 Gabriele B. Papini
 Alberto G. Bonomi1
 Francesco Sartor
- 1Hospital Patient Monitoring, Royal Philips Electronics, Eindhoven, Netherlands
- 2Department of Electrical Engineering, Technical University Eindhoven, Eindhoven, Netherlands
- 3Clinical Affairs Office, Philips Medical Systems, Eindhoven, Netherlands
- 4Institute for Applied Human Physiology, Bangor University, Bangor, United Kingdom
Introduction: This study aimed to model below and above anaerobic threshold exercise-induced heart rate (HR) drift, so that the corrected HR could better represent
Methods: Fifteen healthy subjects (age: 28 ± 5 years;
Results: The area under the curve (AUC) of the hysteresis function, which described the differences in the maximal and submaximal exercise-induced
Discussion: In conclusion, this model allowed HR drift instantaneous correction, which could be exploited in the future for more accurate
1 Introduction
After a few minutes (e.g., 5–10 min) (Coyle, 1998) of submaximal aerobic or below anaerobic threshold exercise (BTE, e.g., 70%
and it is referred to as cardiovascular (CV) drift. Hamilton et al. (1991) showed that during 2 h of cycling exercise at 70%
Interestingly, CV elevation persists during the post-exercise recovery phase, with SV and HR remaining depressed and elevated, respectively, for several minutes even after exercise termination [see Figure 7 in the study by Miyamoto et al. (1982)]. When studying the excess post-exercise oxygen consumption, it is clear that, after a consistent rapid recovery component,
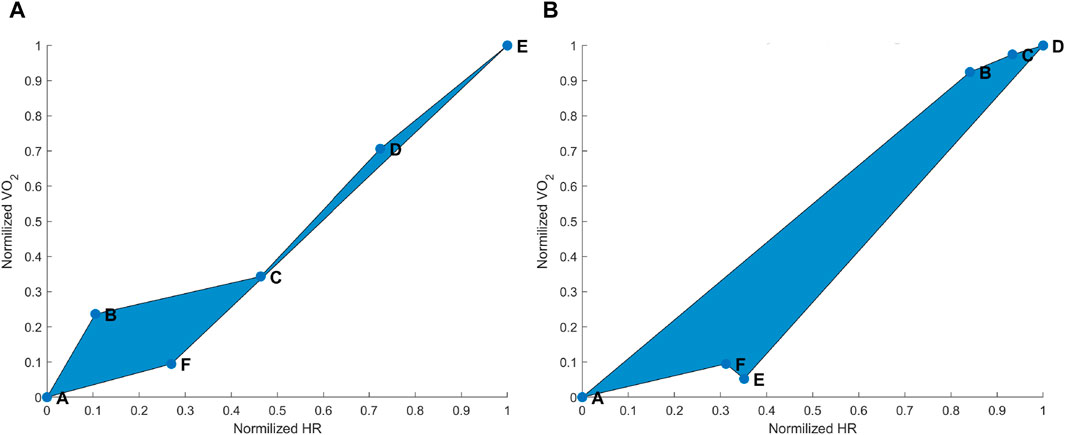
Figure 1. (A) Hysteresis derived from the maximal aerobic exercise (MAX) for a subject representative of the group. Data points: A = pre-MAX resting; B = pre-MAX self-selected speed (SSS) walking; C = beginning of MAX; D = half of MAX; E = end of MAX; and F = post-MAX resting. (B) Hysteresis derived from below anaerobic-threshold exercise (BTE) for a subject representative of the group. Data points: A = pre-BTE SSS walking; B = first phase of BTE (8th and 10th minute); C = middle phase of BTE (20th minute); D = end phase of BTE; E = post-BTE SSS walking; and F = post-BTE SSS + 1-km/h 2nd walking. The blue area represents the hysteresis when normalized VO2 is related to normalized heart rate (HR) values.
As we have previously shown, the relationship between
where ω(t) is the amount of training per session and is referred to as the training impulse (TRIMP), D is the exercise duration, ΔHRratio provided the personalized exercise intensity as it was calculated by dividing the difference between exercise HR and rest HR by HR reserve, and
The aim of this study was to model low (below anaerobic threshold)- and high (above anaerobic threshold)-intensity components of exercise-induced HR drift so that the corrected HR could better represent
2 Methods
2.1 Participants and study design
In order to develop a model to estimate
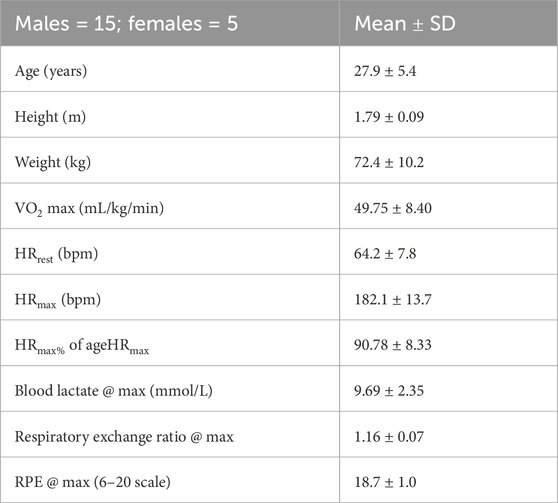
Table 1. Participant characteristics.
2.2 Maximal graded running exercise
Maximal exercise testing was executed on a treadmill, where subjects were instructed to follow Gerkin’s graded run test (Mier and Gibson, 2004) to physical exhaustion. The criteria for maximal physiological effort were set for all subjects as blood lactate >7 mmol/L, respiratory exchange ratio (RER) > 1.15, and rating of perceived exertion (RPE)
This session began with the subjects wearing the monitoring equipment. Then they were asked to sit down at rest for 7 min, at the end of which they were asked to walk on a treadmill at 0% incline at a self-selected speed (SSS) for 3 min. At the end of the SSS walking, the subjects were asked to rest for 3 min, and then they were asked to start with the maximal test until exhaustion. When exhaustion was reached, the subjects stopped or were stopped, and they were asked to sit down resting for 1 h. Blood lactate was drawn from the earlobe during the resting period before the first walking activity, immediately after stopping with the maximal test, and 1 h after the maximal test was concluded. High-resolution (20 grams) body weight was measured at the very beginning of the session two times, once when subjects were wearing sports clothes without shoes and the second time after the subjects wore the monitoring equipment and with shoes so that this second weight could be compared with the weight at the end of the exercise. The third weighing took place after drawing the blood lactate at the end of the exercise and drying the subjects thoroughly with towels. Maximal voluntary contractions (MVCs) were originally recorded before and immediately after the end of the exercise for a secondary research purpose. However, because of some technical difficulties, only a subset of subjects had usable data, and the results of the analysis were regarded as not worth reporting.
2.3 Submaximal constant speed running exercise
There were at least 48 h between visits. The intensity for the submaximal running exercise was determined using the V-slope method (Beaver et al., 1986) by two researchers using the maximal exercise test data. This intensity corresponded to 73% ± 10% of
2.4 Monitoring equipment
Each subject was equipped with a wearable metabolic system (K5, COSMED), by which
2.5 Exertion index model
The primary inputs of our model were the HR signal, the activity duration, and subjects’ characteristics like
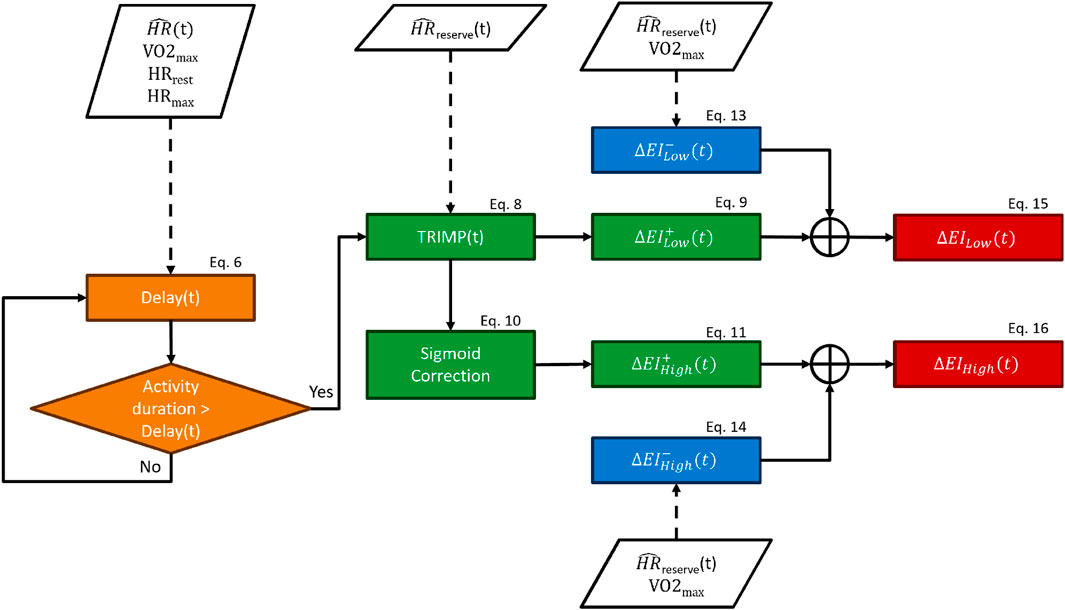
Figure 2. Flowchart of the heart rate-drift correction model.
The delay block forced a lag between the beginning of an exercise and the onset of the exertion indexes, where 20 is an arbitrary constant (see Eq. 6). By design, the exertion indexes began to increase only when the time spent performing the exercise was above the “delay” threshold. The delay function is described by Eq. 6, and it was computed for each subject and each timestamp. It can be observed in Eq. 6 that the delay function is dependent on the fitness level, so fitter subjects would require more time for the onset of the exertion indexes. The delay ranged from zero to infinity depending upon the proximity of a given HR to the HR range boundaries: the closer to resting values, the longer time required for the onset of the exertion index and vice versa. The boundaries were represented by
The new TRIMP block consisted of updating the traditional TRIMP formula Eq. 2 using the corrected HR, which was used for recalculating HRReserve, providing
The sigmoid function Sigm promoted a substantial accumulation of the high-intensity-related exertion index only when the TRIMP exceeded 80% of the maximum TRIMP reachable by a subject (TRIMPmax, i.e., TRIMP calculated with the HR equal to HRmax). The Sigm function was introduced to mimic the exponential increase in lactate accumulation once the exercise intensity crossed the anaerobic threshold.
We designed this model so that the increase block provided the increase in exertion indexes (
The decrease block returned the decrease factors (
The delay,
Finally, the exertion indexes were used to remove the HR drift component from the HR according to the following equations:
The EICorrection was bound to a maximum of 30 bpm in order to avoid overcorrection of the HR drift in Eq. 17. The HR drift correction (see Eqs 18, 19) was mediated by
2.6 Statistical analysis
Difference analysis between uncorrected and HR drift-corrected parameters (e.g., AUCs) was performed by one-tail paired t-tests, setting the significance level at 0.05. Pearson’s linear regressions were used to assess the correlation between the biomarkers and exertion indexes. MATLAB software (MathWorks) was used for both data processing and statistical analysis.
3 Results
The aim of this study was to model the high (above anaerobic threshold)- and the low (below anaerobic threshold)-intensity components of the HR and
3.1 Heart rate–oxygen consumption hysteresis
In this investigation, we defined hysteresis as the drift of the HR in relation to
3.1.1 Maximal exercise hysteresis correction
The
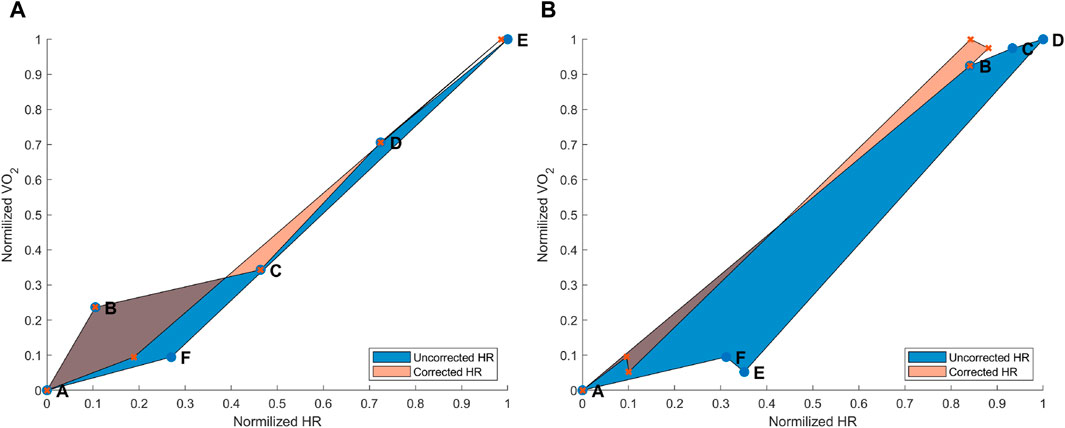
Figure 3. (A) Hysteresis derived from the maximal aerobic exercise (MAX) for a subject representative of the group. Data points: A = pre-MAX resting; B = pre-MAX SSS walking; C = beginning of MAX; D = half of MAX; E = end of MAX; and F = post-MAX resting. (B) Hysteresis derived from below anaerobic-threshold exercise (BTE) for a subject representative of the group. Data points: A = pre-BTE SSS walking; B = first phase of BTE (8th and 10th minute); C = middle phase of BTE (20th minute); D = end phase of BTE; E = post-BTE SSS walking; and F = post-BTE SSS + 1-km/h 2nd walking. The blue area represents the hysteresis when normalized VO2 is related to uncorrected normalized HR values, whereas the orange area depicts the hysteresis between the normalized VO2 and corrected normalized HR.
3.1.2 Submaximal exercise hysteresis correction
The
3.2 Heart rate-drift correction
An additional way to test the performance of the combined EIlow and EIhigh-based HR correction model was to calculate HR deltas between pre-exercise and post-exercise states. For the MAX, uncorrected and corrected post-resting and pre-resting differences were tested using a right-tailed paired t-test. This showed that the HR drift for the corrected HR (10.57 ± 9.07 bpm) was significantly lower than that for the uncorrected original HR (20.77 ± 10.77 bpm) [t(14): 8.739, p < 0.001] (Figure 4). For the BTE deltas that analyzed the difference between HRs post- and pre-BTE SSS walks, the corrected drift was significantly lower (6.16 ± 4.03 bpm) than the uncorrected original drift (23.92 ± 3.34 bpm) [t(11): 14.391, p < 0.001] (Figure 5A). The same was found for the difference between HRs post-BTE SSS + 1 km/h and pre-BTE SSS walks, where the uncorrected drift (26.39 ± 8.29 bpm) was reduced significantly (6.58 ± 5.18 bpm) [t(11): 11.040, p < 0.001] (Figure 5B). Finally, and probably more interestingly, the difference between the uncorrected (2.47 ± 4.64 bpm) and corrected HR (4.95 ± 5.69 bpm) of the two post-BTE walks, namely, post-BTE SSS + 1 km/h and post-BTE SSS walks, resulted in significantly greater delta for the corrected values [t(11): −4.794, p < 0.001] (Figure 5C). This was to be expected because the difference between the uncorrected HR of the two post-BTE walks accounts for two phenomena: i) a workload increase of 1 km/h (e.g., + 5 bpm) and ii) a slow decay in the HR drift (e.g., −3 bpm). Meanwhile, theoretically, in the case of the corrected HR, only the workload increase was accounted for.
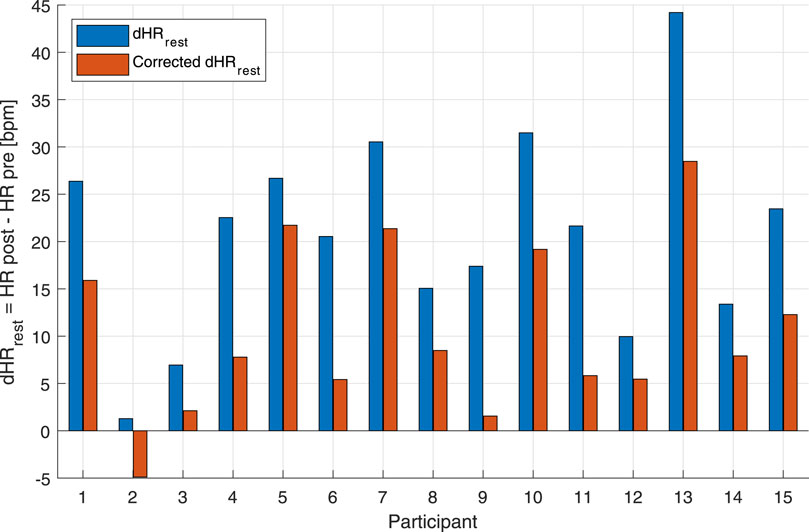
Figure 4. Bar graph of uncorrected and corrected HR drifts of the individual subjects for the maximal aerobic exercise (MAX) session. Blue bars represent the difference between post-MAX resting and the pre-MAX resting of the uncorrected HR. Orange bars show the difference between post-MAX resting and the pre-MAX resting of the corrected HR.
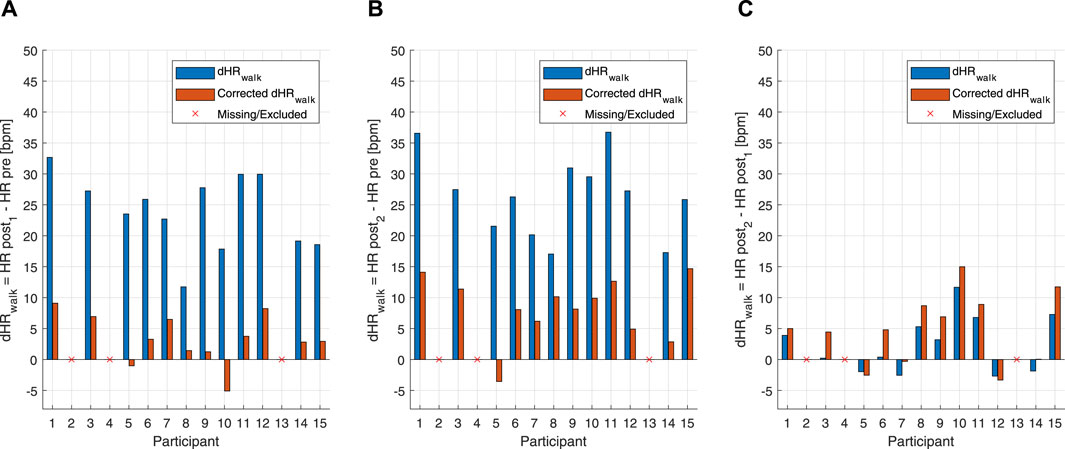
Figure 5. Bar graph of uncorrected and corrected HR drifts of the individual subjects for the below anaerobic-threshold exercise (BTE) session. (A) Blue bars represent the difference between post-BTE SSS walking (post 1) and the pre-BTE SSS walking (pre) of the uncorrected HR. Orange bars represent the difference between post-BTE SSS walking (post 1) and the pre-BTE SSS walking (pre) of the corrected HR. (B) Blue bars represent the difference between post-BTE SSS + 1-km/h walking (post 2) and the pre-BTE SSS walking (pre) of the uncorrected HR. Orange bars represent the difference between post-BTE SSS + 1-km/h walking (post 2) and the pre-BTE SSS walking (pre) of the corrected HR. (C) Blue bars represent the difference between post-BTE SSS + 1-km/h walking (post 2) and post-BTE SSS walking (post 1) of the uncorrected HR. Orange bars represent the difference between post-BTE SSS + 1-km/h walking (post 2) and the post-BTE SSS walking (post 1) of the corrected HR.
3.2.1 High- and low-intensity components for HR-drift correction
A distinctive feature of the correction model presented in this work was the coexistence of two components, EILow and EIHigh. The low exertion index was designed to detect below-threshold exercises and those high above the threshold. The qualitative analysis given in Figures 6, 7 shows that HR-drift correction (green dashed line in the top panels) does not onset as soon as the exercises start, as intended by the dealy function. In the bottom panels of Figures 6, 7, EIHigh is clearly greater than EILow for the MAX activity, and the opposite is true for the BTE. However, the magnitude of EIHigh and EILow is greater for BTE because the exercise duration is far greater than dealy, accounting for greater HR drifts.
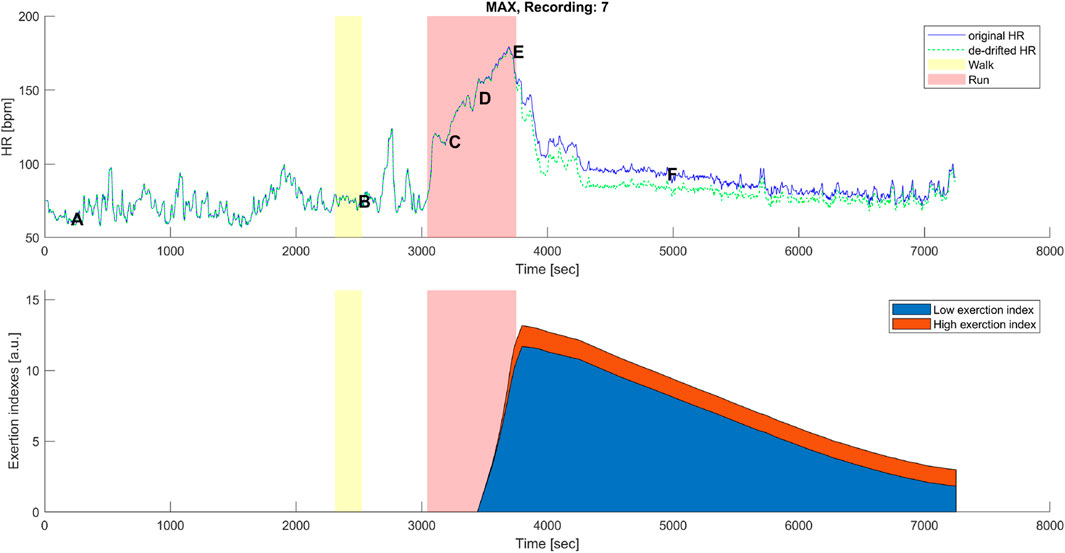
Figure 6. Top panel: original (blue) and corrected (green) HR time series before, during, and after the maximal aerobic exercise (MAX) of a representative subject. Data points A, B, C, D, E, and F are as described in Figures 1A, 3A. Bottom panel: cumulative time series of the low-exertion index (blue) and the high-exertion index (red) as a result of the activities performed during the MAX session. The yellow banner indicates the pre-MAX walking activity at a self-selected speed. The red banner indicates the MAX activity.
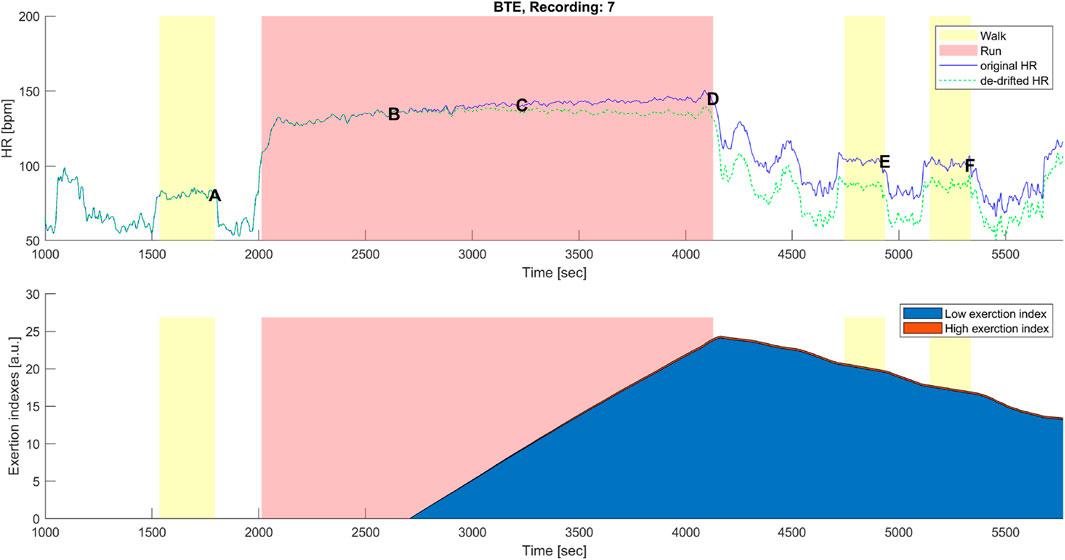
Figure 7. Top panel: original (blue) and corrected (green) HR time series before, during, and after the below anaerobic-threshold exercise (BTE) of a representative subject. Data points A, B, C, D, E, and F are as described in Figures 1B, 3B. Bottom panel: cumulative time series of the low-exertion index (blue) and of the high-exertion index (red) as a result of the activities permed during the BTE session. The yellow banner indicates all walking activities, pre- and first post- at a self-selected speed, while the third yellow bar indicates walking at the self-selected speed plus 1 km/h. The red banner indicates the BTE activity.
3.3 Correlations with lactate levels and water loss
To understand how the two components (i.e., EILow and EIHigh) of the exercise exertion model actually related with the low- and high-exercise intensities, linear correlations were performed (Figure 8). It is clear that EIHigh is approximately 10 times smaller than EILow. Moreover, as expected, the lactate levels, chosen here as a marker of anaerobic exertion, were higher after MAX activity than BTE, and EIHigh clustered around lower values for BTE running. Meanwhile, EILow showed a very clear divide, displaying greater values for the BTE activity. In order to check whether cardiorespiratory fitness would affect these indexes, lactate levels were normalized by
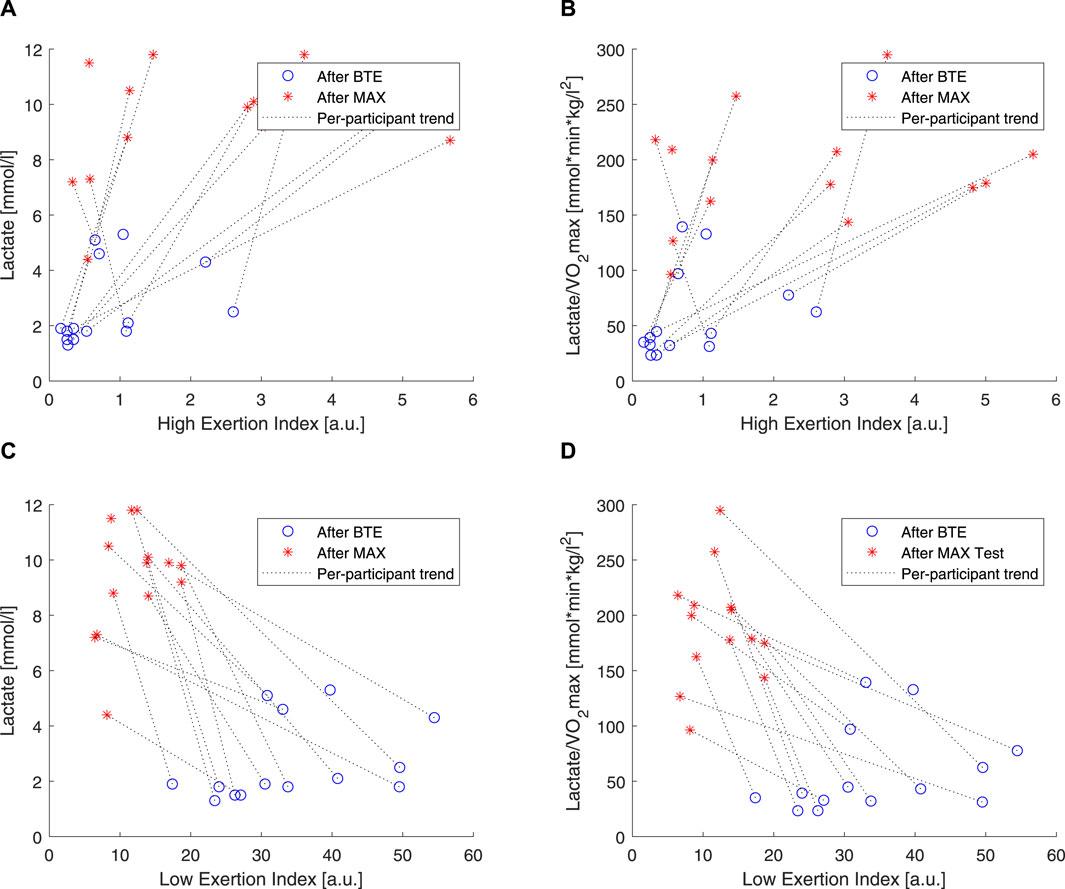
Figure 8. Correlations of lactate and high exertion index (EI) and low EI. Blue open circles refer to below anaerobic-threshold exercise (BTE), red asterisks refer to maximal aerobic exercise (MAX), dotted lines represent linear trendlines.
As introduced in this article, it is well documented that CVD is affected by dehydration. A simple way to estimate exercise dehydration is weight loss when no solid or fluid intake and excretion (e.g., feces and urine) are ensured. Under these conditions, weight loss is due to water loss + CO2 expiration. According to our
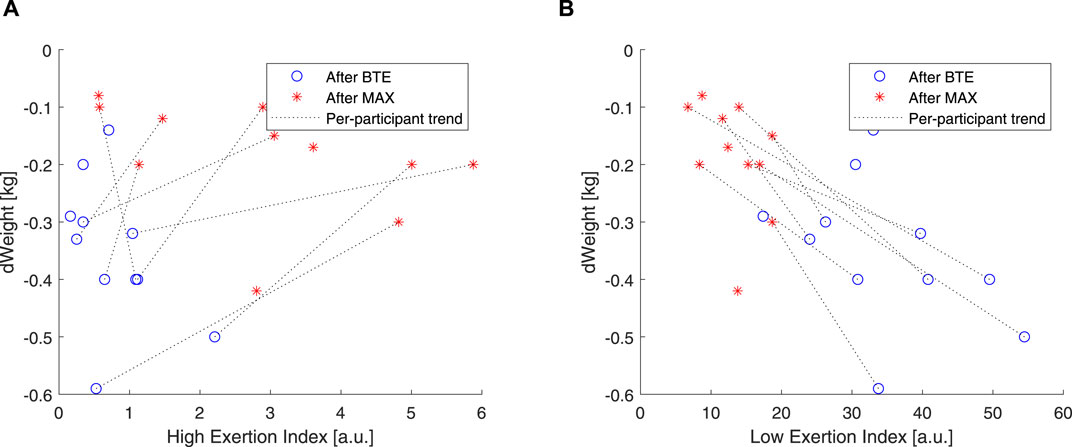
Figure 9. Correlations of weight and high EI and low EI. Blue open circles refer to below anaerobic-threshold exercise (BTE), red asterisks refer to maximal aerobic exercise (MAX), dotted lines represent linear trendlines.
4 Discussion
We developed an HR-based model that can significantly correct for HR drift during and after maximal and submaximal exercises by using cardiovascular fitness information, exercise activity intensity, and duration.
As expected, MAX running did not show an evident HR drift during the incremental exercise test itself (see Figure 1A, points B–E). However, an evident HR elevation was present during the recovery phase, which can be appreciated by observing the horizontal distance between points A and F in Figure 1A. In most cases,
Our model was designed so that it started correcting for HR drift only when the exercise intensity was high enough and when the duration was prolonged enough. For instance, short and very intense exercise would not impact the dehydration component of the drift. On the other hand, long but very mild exercise (e.g., walking) would require far more time to produce a dehydrating effect. Since EIHigh and EILow indexes are HR-based, the model should theoretically work when mild exercise is performed under exceptional conditions (e.g., very hot and dry) that significantly affect the HR. In this study, the EI correction accounted for the high-intensity exercises via the EIHigh component, which, on the one hand, could rapidly increase but, on the other hand, did not have the time to reach high magnitudes (see Figure 5), whereas the EI correction during lower intensities, EILow component, such as for BTE running, had a smaller slope of increase, but it had the time to reach greater (2-fold) magnitudes (see Figure 7).
In order to evaluate how these two components, high and low, related to the exercise intensity and duration, we used two rather “simple” markers. We used blood lactate levels as markers of anaerobic exercise exertion (Faude et al., 2009), and we correlated these to our EIHigh and EILow. Our results showed that EIHigh was particularly unresponsive to BTE running, but it did show some spread in response to the MAX sessions (see Figures 8A, B). EILow was clearly, by design, able to increase 10 times more than EIHigh, and higher levels were shown in response to BTE sessions (Figures 8C, D). Moreover, cardiovascular fitness did not seem to influence these relationships (Figure 9A did not differ from Figure 9B). Exercise-induced dehydration was estimated by weight loss. Although we experienced some difficulties in obtaining reliable weight loss measurements in all subjects, by setting some boundaries (i.e., Δweight >70 g for MAX and Δweight >125 g for BTE), we attempted limiting the measurement errors and drawing wrong conclusions. We observed that weight loss for MAX running seemed less pronounced than for the BTE running sessions. EILow showed a much stronger relation to dehydration (i.e., weight loss) than EIHigh. This was in accordance with our expectations. The lactate and the weight loss evidence seemed to confirm that EILow better reflected the below-anaerobic threshold exercise, whereas EIHigh reflected the above-anaerobic threshold.
Souissi et al. (2021) recently reviewed the causes of CV drift, concluding that it has a multifactorial nature. For prolonged exercise, hyperthermia, dehydration, hypovolemia, and consequent SV decrease (thus, HR increase) are known causes. However, there are more reasons for CV drift than HR drift alone, for example, decrease in left ventricular compliance (Souissi et al., 2021). In our study, HR drift was clearly present during the submaximal exercise and its recovery and during recovery from maximal exercise. HR elevation above resting levels is well documented; for instance, Facioli et al. (2021) showed that even cardiovascularly fit subjects needed more than 36 min to recover from submaximal exercise at 90%–95% of HRmax. We designed our model so that it would mimic similar kinetics.
The main implication of our proof-of-concept work is that whenever in the future
5 Conclusion
In this study, differences in maximal and submaximal exercise-induced
Data availability statement
The datasets presented in this article are not readily available because of concerns about participant privacy and confidentiality. Requests to access the datasets should be directed to FS, francesco.sartor@philips.com.
Ethics statement
The studies involving humans were approved by the Philips Research Internal Committee of Biomedical Experiments. The studies were conducted in accordance with the local legislation and institutional requirements. The participants provided their written informed consent to participate in this study.
Author contributions
GP: conceptualization, data curation, formal analysis, investigation, methodology, visualization, writing–original draft, and writing–review and editing. AB: conceptualization, supervision, writing–original draft, and writing–review and editing. FS: conceptualization, data curation, methodology, resources, supervision, writing–original draft, and writing–review and editing.
Funding
The author(s) declare that financial support was received for the research, authorship, and/or publication of this article. GP, AB, and FS received financial support in the form of salaries, but the employer did not have any additional role in the study design, data collection and analysis, decision to publish, or preparation of the manuscript.
Acknowledgments
The authors thank Eng. Emanuele Bruno and Eng. Dr. Laura Secondulfo for conducting the data collection.
Conflict of interest
Authors GP, AB, and FS were employed by Royal Philips Electronics and Clinical Affairs Office, Philips Medical Systems.
FS declared that they were an editorial board member of Frontiers, at the time of submission. This had no impact on the peer review process and the final decision.
Publisher’s note
All claims expressed in this article are solely those of the authors and do not necessarily represent those of their affiliated organizations, or those of the publisher, the editors, and the reviewers. Any product that may be evaluated in this article, or claim that may be made by its manufacturer, is not guaranteed or endorsed by the publisher.
References
Altini M., Penders J., Amft O. (2016). Estimating oxygen uptake during nonsteady-state activities and transitions using wearable sensors. IEEE J. Biomed. Health Inf. 20, 469–475. doi:10.1109/JBHI.2015.2390493
Altini M., Penders J., Vullers R., Amft O. (2014). Personalizing energy expenditure estimation using physiological signals normalization during activities of daily living. Physiol. Meas. 35, 1797–1811. doi:10.1088/0967-3334/35/9/1797
Astrand P., Rodahl K., Dahl H. A., Strømme S., Allen T. (2003). Temperature regulation (human kinetics). 4.
Beaver W. L., Wasserman K., Whipp B. J. (1986). A new method for detecting anaerobic threshold by gas exchange. J. Appl. Physiology 60, 2020–2027. doi:10.1152/jappl.1986.60.6.2020
Bonomi A. G., Goldenberg S., Papini G., Kraal J., Stut W., Sartor F., et al. (2015). Predicting energy expenditure from photo-plethysmographic measurements of heart rate under beta blocker therapy: data driven personalization strategies based on mixed models. Annu. Int. Conf. IEEE Eng. Med. Biol. Soc. 2015, 7642–7646. doi:10.1109/EMBC.2015.7320162
Bonomi A. G., Hoor G. A. T., Morree H. M. D., Plasqui G., Sartor F. (2020). Cardiorespiratory fitness estimation from heart rate and body movement in daily life. J. Appl. Physiology 128, 493–500. doi:10.1152/japplphysiol.00631.2019
Børsheim E., Bahr R. (2003). Effect of exercise intensity, duration and mode on post-exercise oxygen consumption. Sports Med. 33, 1037–1060. doi:10.2165/00007256-200333140-00002
Calvert T. W., Banister E. W., Savage M. V., Bach T. (1976). A systems model of the effects of training on physical performance. IEEE Trans. Syst. Man, Cybern. SMC-6 94–102. doi:10.1109/TSMC.1976.5409179
Coyle E. F. (1998). Cardiovascular drift during prolonged exercise and the effects of dehydration. Int. J. Sports Med. 19, S121–S124. doi:10.1055/s-2007-971975
Desgorces F. D., Sénégas X., Garcia J., Decker L., Noirez P. (2007). Methods to quantify intermittent exercises. Appl. Physiology, Nutr. Metabolism 32, 762–769. doi:10.1139/H07-037
Ekelund L.-G. (1967). Circulatory and respiratory adaptation during prolonged exercise. Acta Physiol. Scand. Suppl. 292, 1–38. doi:10.1111/j.1748-1716.1967.tb03529.x
Facioli T. P., Philbois S. V., Gastaldi A. C., Almeida D. S., Maida K. D., Rodrigues J. A., et al. (2021). Study of heart rate recovery and cardiovascular autonomic modulation in healthy participants after submaximal exercise. Sci. Rep. 11, 3620. doi:10.1038/s41598-021-83071-w
Faude O., Kindermann W., Meyer T. (2009). Lactate threshold concepts how valid are they? Sports Med. 39, 469–490. doi:10.2165/00007256-200939060-00003
Hamilton M. T., Gonzalez-alonso J., Montain S. J., Coyle E. F., replacementandglu E. F. C. N. (1991). Fluid replacement and glucose infusion during exercise prevent cardiovascular drift. J. Appl. Physiology 71, 871–877. doi:10.1152/jappl.1991.71.3.871
Jackson A., Blair S., Mahar M., Wier L., Ross R., Stuteville J. (1990). Prediction of functional aerobic capacity without exercise testing. Med. Sci. Sports Exerc. 22, 863–870. doi:10.1249/00005768-199012000-00021
Jones A. M., Grassi B., Christensen P. M., Krustrup P., Bangsbo J., Poole D. C. (2011). Slow component of VO2 kinetics: mechanistic bases and practical applications. Med. Sci. Sports Exerc. 43, 2046–2062. doi:10.1249/MSS.0b013e31821fcfc1
Kraal J. J., Sartor F., Papini G., Stut W., Peek N., Kemps H. M., et al. (2016). Energy expenditure estimation in beta-blocker-medicated cardiac patients by combining heart rate and body movement data. Eur. J. Prev. Cardiol. 23, 1734–1742. doi:10.1177/2047487316667786
Matsui H., Shimaoka K., Miyamura M., Kobayashi K. (1978). Seasonal variation of aerobic work capacity in ambient and constant temperature. Massachusetts, United States: Academic Press. doi:10.1016/B978-0-12-261350-0.50023-5
Mier C. M., Gibson A. L. (2004). Evaluation of a treadmill test for predicting the aerobic capacity of firefighters. Occup. Med. 54, 373–378. doi:10.1093/occmed/kqh008
Miyamoto Y., Hiura T., Tamura T., Nakamura T., Higuchi J., Mikami T. (1982). Dynamics of cardiac, respiratory, and metabolic function in men in response to step work load. J. Appl. Physiology 52, 1198–1208. doi:10.1152/jappl.1982.52.5.1198
Morton R. H., Fitz-Clarke J. R., Banister E. W., Morton R., Hugh J. R., Fitz-Clarke E. W. (1990). Modeling human performance in running. J. Appl. Physiology 69, 1171–1177. doi:10.1152/jappl.1990.69.3.1171
Pettitt R. W., Symons J. D., Taylor J. E., Eisenman P. A., White A. T. (2008). Adjustment for gas exchange threshold enhances precision of heart rate-derived vo2 estimates during heavy exercise. Appl. Physiology, Nutr. Metabolism 33, 68–74. doi:10.1139/H07-133
Rowell L. B. (1974). Human cardiovascular adjustments to exercise and thermal stress. Physiol. Rev. 54, 75–159. doi:10.1152/physrev.1974.54.1.75
Rowell L. B., O’Leary D. S., Kellogg D. L. (1996). Integration of cardiovascular control systems in dynamic exercise. New Jersey, United States: Wiley. doi:10.1002/cphy.cp120117
Sartor F., Bonato M., Papini G., Bosio A., Mohammed R. A., Bonomi A. G., et al. (2016). A 45-second self-test for cardiorespiratory fitness: heart rate-based estimation in healthy individuals. PLoS ONE 11, e0168154. doi:10.1371/journal.pone.0168154
Souissi A., Haddad M., Dergaa I., Saad H. B., Chamari K. (2021). A new perspective on cardiovascular drift during prolonged exercise. Life Sci. 287, 120109. doi:10.1016/j.lfs.2021.120109
Zouhal H., Jacob C., Delamarche P., Gratas-Delamarche A. (2008). Catecholamines and the effects of exercise, training and gender. Sports Med. 38, 401–423. doi:10.2165/00007256-200838050-00004
Keywords: cardiovascular drift, training impulse, VO2 max, hysteresis, wearables
Citation: Papini GB, Bonomi AG and Sartor F (2024) Proof-of-concept model for instantaneous heart rate-drift correction during low and high exercise exertion. Front. Physiol. 15:1358785. doi: 10.3389/fphys.2024.1358785
Received: 20 December 2023; Accepted: 26 March 2024;
Published: 22 April 2024.
Edited by:
Susanna Rampichini, Università degli Studi di Milano, ItalyReviewed by:
Marta Borrelli, Università degli Studi di Milano, ItalyLucieli Teresa Cambri, Federal University of Mato Grosso, Brazil
Copyright © 2024 Papini, Bonomi and Sartor. This is an open-access article distributed under the terms of the Creative Commons Attribution License (CC BY). The use, distribution or reproduction in other forums is permitted, provided the original author(s) and the copyright owner(s) are credited and that the original publication in this journal is cited, in accordance with accepted academic practice. No use, distribution or reproduction is permitted which does not comply with these terms.
*Correspondence: Francesco Sartor, francesco.sartor@philips.com