 Jiacen Liu
 Yong Yang
 Feng Li
 Jing Luo5
- 1Chongqing Institute of Green and Intelligent Technology, Chinese Academy of Sciences, Chongqing, China
- 2Chengdu Institute of Computer Application, Chinese Academy of Sciences, Chengdu, Sichuan, China
- 3Faculty of Mechanical and Electrical Engineering, Kunming University of Science and Technology, Kunming, China
- 4Chongqing School, University of Chinese Academy of Sciences, Chongqing, China
- 5Department of Neurology, The First Affiliated Hospital of Chongqing Medical University, Chongqing, China
Epilepsy is a disease caused by abnormal neural discharge, which severely harms the health of patients. Its pathogenesis is complex and variable with various forms of seizures, leading to significant differences in epilepsy manifestations among different patients. The changes of brain network are strongly correlated with related pathologies. Therefore, it is crucial to effectively and deeply explore the intrinsic features of epilepsy signals to reveal the rules of epilepsy occurrence and achieve accurate detection. Existing methods have faced the following issues: 1) single approach for feature extraction, resulting in insufficient classification information due to the lack of rich dimensions in captured features; 2) inability to deeply analyze the essential commonality of epilepsy signal after feature extraction, making the model susceptible to data distribution and noise interference. Thus, we proposed a high-precision and robust model for epileptic seizure detection, which, for the first time, applies hypergraph convolution to the field of epilepsy detection. Through a hypergraph network structure constructed based on relationships between channels in electroencephalogram (EEG) signals, the model explores higher-order characteristics of epilepsy EEG data. Specifically, we use the Conv-LSTM module and Power spectral density (PSD), a two-branch parallel method, to extract channel features from space-time and frequency domains to solve the problem of insufficient feature extraction, and can adequately describe the data structure and distribution from multiple perspectives through double-branch parallel feature extraction. In addition, we construct a hypergraph on the captured features to explore the intrinsic features in the high-dimensional space in an attempt to reveal the essential commonality of epileptic signal feature extraction. Finally, using the ensemble learning concept, we accomplished epilepsy detection on the dual-branch hypergraph convolution. The model underwent leave-one-out cross-validation on the TUH dataset, achieving an average accuracy of 96.9%, F1 score of 97.3%, Pre of 98.2% and Re of 96.7%. In addition, the model was generalized performance tested on CHB-MIT scalp EEG dataset with leave-one-out cross-validation, and the average ACC, F1 score, Pre and Re were 94.4%, 95.1%, 95.8%, and 93.9% respectively. Experimental results indicate that the model outperforms related literature, providing valuable reference for the clinical application of epilepsy detection.
1 Introduction
The human brain contains approximately 100 billion neurons, making it the most complex organ in the human body. The brain organizes itself through various means such as synaptic connections, forming a complex neural network that dominates our consciousness and behavior (Poo et al., 2016; Sala et al., 2022; Thiebaut de Schotten and Forkel, 2022). Increasing research findings have indicated that the implementation of advanced human functions relies on the connections and communication between different brain regions (Sporns et al., 2005; Yan et al., 2019). In other words, the realization of brain functions primarily depends on highly complex interactions between different areas of the brain in a large-scale network. As a result, the concept of the brain as a network is gaining widespread attention from researchers and clinical practitioners. Currently, the study of interregional relationships in the brain relies heavily on functional connectivity analysis. This method involves analyzing the correlation of neurophysiological activities between brain regions in terms of temporal and frequency domains. It provides objective quantification and interpretable metric information, contributing to the understanding of cognitive function principles and the detection of neurological disorders.
Epilepsy, as a typical neurological disorder, is caused by abnormal neuronal discharges in the brain, leading to a disruption of neural functions. The pathogenesis of epilepsy has been confirmed to be associated with abnormalities in functional connections between relevant brain regions (Shuting et al., 2019; van den Heuvel and Hulshoff Pol, 2010). Neuroscientists are paying attentions to the tools and concepts of network science on a widespread basis, applying them to researches in brain science. These tools and concepts allow for a consistent description and interpretation of interactions among various neural systems within the complex topology of the brain and its networks. This approach has been proven to be successful in systems biology and social network analysis (Michel et al., 2004; Sakkalis, 2011; Fornito et al., 2016; Presigny and De Vico Fallani, 2022).
For the collection of electroencephalographic (EEG) signals, the commonly employed method is electroencephalogram (EEG). EEG is a technique that utilizes electrophysiological metrics to record brain activities. It captures the electrical wave changes during brain activity, serving as a comprehensive reflection of the electrophysiological activity of brain neurons on the cerebral cortex or the surface of the scalp. In recent years, the use of EEG for epileptic seizure detection has drawn widespread attention in the academic circle due to its advantages of easy collection, affordability, and high temporal resolution of data. The installation of EEG collecting channels follows the international 10–20 system, which provides precise positions for channel installation. Each channel’s location corresponds to specific brain regions, facilitating the possibility of analyzing interregional relationships in further analysis (Ein Shoka et al., 2023).
The key innovations of this study include:
(1) for the first time, proposing the neural network model that is based on hypergraph convolution and suitable for epilepsy detection. The model extracted features from each channel by using Conv-LSTM module and PSD, constructed hypergraphs respectively based on the extracted features, and then realized automatic epilepsy detection by adopting hypergraph convolution.
(2) conducting comprehensive experimental tests on the TUH epilepsy dataset and the CHB-MIT scalp EEG dataset to validate the model’s performance. The result indicates that the model can achieve optimal detection performance in epilepsy detection tasks. This approach provides valuable reference for clinical epilepsy detection.
This study is structured as the following: Part 1 provides an overview. Part 2 introduces relevant technologies in epilepsy detection. Part 3 proposes the epilepsy detection model based on multi-dimensional feature extraction and dual-branch hypergraph convolutional network. Part 4 presents the comparative experiments with relevant literature by adopting benchmark dataset. Part 5 discusses the model’s superiority through ablation experiments and various parameter configurations. Part 6 gives the conclusion.
2 Related works
Regarding the task of neurological disease detection, existing detection methods are often as the following: 1) Artificial feature extraction is adopted, and the extracted features are calculated by filtering and energy evaluation algorithms such as Multi-variable Fast Iterative Filter (MFIF) (Sharma et al., 2023) and dynamic approximate entropy (Zhang et al., 2023). Then the data is classified by machine learning, for example, decision tree classifier (Nithya et al., 2023) and random forest (Sharma et al., 2018). 2) Applying deep learning model to automatically extract features and performing classification.
In the application of epilepsy detection, some researchers used individual patients’ historical data to train models and then applied these models to test new data from the same patients. Representative achievements in this area include: Hu et al. (2020) proposed an epileptic seizure detection method based on the deep bidirectional long short-term memory (Bi-LSTM) network, achieving an average sensitivity of 93.61% and an average specificity of 91.85% on the long-term scalp EEG database. To address the challenge of limited data samples in individual patient detection tasks, Yang et al. (2022) introduced a specific patient epilepsy detection and analysis method based on data augmentation and deep learning, this approach achieved an average accuracy of 95.47%, an average sensitivity of 93.89%, and an average specificity of 96.48% respectively on the CHB-MIT dataset. Zhou et al. (2018) proposed an epileptic seizure recognition model based on convolutional neural networks (CNN), achieving an average accuracy of 97.5% on the CHB-MIT dataset. Poorani and Balasubramanie (2023) presented a one-dimensional CNN model and a hybrid CNN-LSTM model, where the one-dimensional CNN model achieved an average accuracy of 91.50%, and the CNN-LSTM model achieved an average accuracy of 92.11% on the CHB-MIT dataset. Similarly, Wang et al. (2023) also used the persistent homology method to calculate the complex filter bar code of virtual reality on the CHB-MIT dataset to extract topological features and input them into GoogLeNet for classification. The average accuracy, sensitivity and specificity were 97.05%, 96.71%, and 97.38%, respectively. However, these methods are limited to training and testing on individual subjects, having poor model generalization.
Another research approach involves designing network models with generalization capabilities and utilizing leave-one-out cross-validation. Specifically, this method involves partitioning epilepsy datasets with data from multiple patients. One patient’s data is selected for testing, while the data from other patients are used for training. This approach enhances the model’s generalization capability. Representative achievements include: Zhang et al. (2020) employed feature separation and adversarial representation learning to decompose data into category (seizure and normal) relevant features and patient-specific features, achieved an average accuracy of 80.5% on the TUH EEG dataset. Dissanayake et al. (2021) utilized CNN network structure and Siamese network structure, achieved an accuracy of 88.81% on the CHB-MIT dataset. Yang et al. (2023) applied feature separation adversarial training, achieved an average accuracy of 85.7% on the TUH EEG dataset.
The two aforementioned approaches involve overall feature extraction from a data segment without capturing information transmitting among channels. However, for epilepsy EEG data, the interregional relationships in the brain are highly relevant to seizure patterns, which includes higher-order information of EEG signals and holds important reference significance for epilepsy detection. In the exploration of advanced network feature information from data, researchers have conducted extensive work. Feng et al. (2019a) were among the pioneers who introduced hypergraph neural networks, while Yadati et al. (2019) proposed hypergraph convolutional networks. Jiang et al. (2019) introduced a dynamic hypergraph convolutional neural network, this network utilizes KNN and K-Means to dynamically update the hypergraph structure, enhancing its ability to capture data relationships, it can extract both partial and overall relationships within the data.
In the field of brain science research, some researchers have proposed using graph models to describe pairwise relationships among multi-channel EEG signals. For instance, Zhang et al. (2019) introduced a graph-based hierarchical model that classifies motor intentions based on the relationships between EEG signals and their spatial information. Li et al. (2023) proposed a spatial-temporal hypergraph convolutional network (STHGCN) to capture higher-order relationships in EEG emotion recognition, achieved leading results on the SEED and SEED-IV datasets. Recently, Wagh and Varatharajah (2020) employed graph convolutional neural networks (GCNN) for the classification of epilepsy and normal data, achieving an AUC of 0.90. Currently, there isn’t related research found regarding the application of hypergraph convolution in the field of epilepsy detection. Therefore, taking use of hypergraph convolution can be considered as an important research approach for exploring higher-order information among brain regions in epilepsy patients.
3 Methodology
In the study, we proposed an epilepsy detection model based on hypergraph convolution, as illustrated in Figure 1. The processing flow of the model consisted of three stages: 1) feature extraction stage, 2) hypergraph construction stage, and 3) hypergraph convolution stage. The approach in feature extraction stage was depicted in Figure 2. To thoroughly extract multidimensional features from the data, two parallel extraction methods were employed. PSD was used to extract spectral features, and Conv-LSTM neural network was utilized to capture spatiotemporal features. In the hypergraph construction stage, a hypergraph was generated by combining multidimensional features. Hyperedges were adopted to characterize the vertices connected to them, encoding high-order feature information to represent complex data structures in a more flexible manner. In the hypergraph convolution stage, a hypergraph spectral domain convolution method was applied to thoroughly extract high-order data features from epilepsy data, thereby enhancing the model’s generalization capability and classification performance.
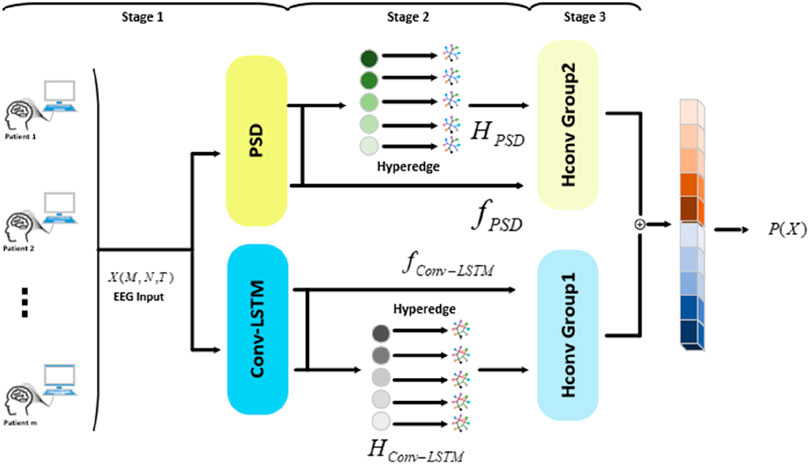
Figure 1. Model structure.
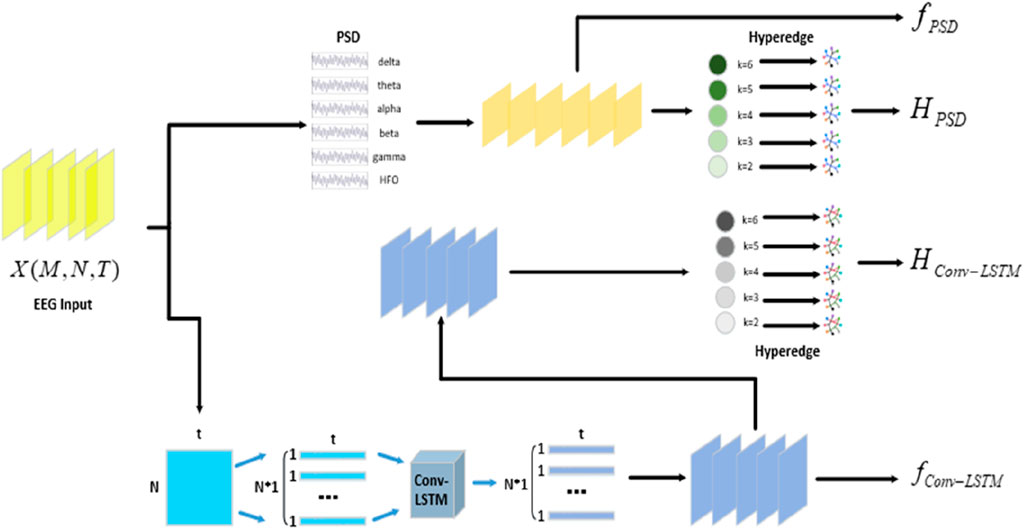
Figure 2. The process of feature extraction stage.
3.1 Data preprocessing
The EEG is a bioelectrical signal generated by brain activity, which is characterized by uncertainty and randomness. Therefore, prior to analyzing raw data, preprocessing is necessary to eliminate the negative impact of different units and numerical ranges between features on subsequent data analysis. Additionally, it is helpful to improve data quality by adopting various interference elimination techniques, thus to enhance the accuracy of later analyses. This paper adopted min-max regularization technology (Sola and Sevilla, 1997) to regularize the EEG data. The min-max regularization method was shown as the formula (1):
where,
After regularization of EEG data, in order to extract the features of EEG data, the EEG data were processed in segments. In the study,
3.2 Feature extraction
For data feature extraction, we proposed a dual-branch epilepsy feature extraction method in the study. It utilizes PSD to extract spectral features and the Conv-LSTM neural network to capture spatiotemporal features. By extracting data features from multiple dimensions, this approach can provide more information for hypergraph construction, ensuring that the model achieves higher classification accuracy.
3.2.1 Feature extraction using PSD
PSD is a method for calculating the energy distribution of EEG signals at different frequencies from a frequency domain perspective. It helps reveal the essence of brain activity and function. Currently, the frequency domain features of EEG signals represent the most intuitive and convenient characteristics. They are widely utilized in the diagnosis and treatment of neurological disorders. By implementing this algorithm, it is possible to thoroughly extract the energy information of EEG data at different frequency bands, analyzing subjects’ changes in energy across different stages and frequency bands. Consequently, this provides reliable clues for the diagnosis and treatment of relevant neurological disorders.
For the process of extracting PSD features, the first step involved applying Fast Fourier Transform (FFT) to the input data
where,
Then, performed PSD calculation as Eq. (3) on the obtained
where,
By integrating, we obtained the PSD features
3.2.2 Feature extraction using Conv-LSTM
EEG signals are temporal signals, and solely capturing PSD features may not sufficiently acquire the spatiotemporal features of the signal. In the study, we employed the Conv-LSTM spatiotemporal convolutional network (Shi et al., 2015) to automatically extract one-dimensional spatial features and temporal features from EEG signals. This approach allows for a more comprehensive and in-depth extraction of EEG signal features, thereby enhancing the detection accuracy of the model.
In the study, we adopted LSTM networks, which are powerful in representing the extracted temporal domain features, and used the states and outputs of the network’s memory cells at each time step, to construct spatial convolutional norms learning and the sequential accumulation of effective signal features. Therefore, between adjacent time steps, parameters are selectively inherited, aiding in the construction of contextual information and ensuring the integrity of feature structures presentation.
In the current time segment
where,
3.3 Hypergraph construction
Building on the foundation of feature extraction, we constructed a hypergraph
For any given feature vertex
where,
For any given hyperedge
All expressions for the degrees of feature vertices
3.4 Hypergraph convolution
Based on the
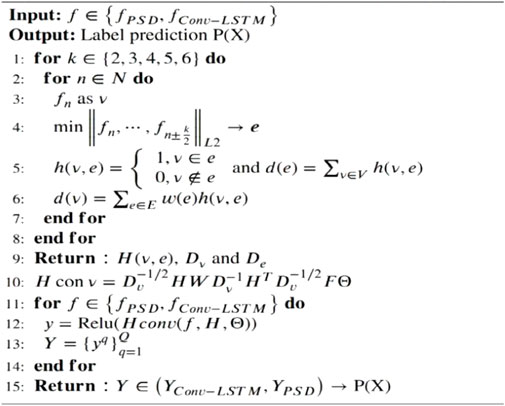
Algorithm 1.
where,
For the PSD branch, the hypergraph convolution after Relu mapping was defined as Eq. (13):
To enhance the model’s generalization and robustness, we have introduced a convolutional expansion factor Q, expanding the feature output to
Through the dual-branch hypergraph convolution, we obtained the frequency domain features and spatiotemporal features representations of the data respectively. These two representations were then connected in a cascaded manner. Finally, label prediction was achieved through two convolutional layers
To complete the model training, we introduced the cross-entropy loss function in the study. The cross-entropy loss function measured the difference between the predicted probability distribution of the proposed model and the true probability distribution. During backpropagation, gradients were used to constrain the hyperparameters and convolutional parameters in the model, aiming to improve the model’s predictive accuracy. It was specifically represented by Eq. (15):
where,
4 Experiments
4.1 Datasets and evaluation metrics
The proposed model in the study was extensively evaluated on the publicly available dataset, TUH epilepsy dataset (Obeid and Picone, 2016), to thoroughly assess and validate the effectiveness of the model and its components. The dataset included 2,993 records of at least 15 min duration obtained from 2,329 unique patients and consisted of a developed and separate final assessment set. It contains records of male and female patients from a variety of age ranges (7 days −96 years), and therefore includes infants, children, adolescents, adults, and elderly patients. Pathologies diagnosed in patients in the dataset include (but are not limited to) epilepsy, stroke, depression, and Alzheimer’s disease, however, only binary labels are provided. The dataset includes physician reports that provide additional information about each EEG record, such as major EEG findings, the patient’s ongoing medication, and medical history. In the description of the dataset, TUH reported an inter-rater confidence of 97%–100%. In the literature, the reported scores are usually much lower. The nearly perfect rating may be the result of a review of the survey results by medical students who were aware of the diagnosis in advance. The dataset followed the international 10–20 system to perform channel installation and data collection, with 21 channels and a sampling rate of 250 Hz. We randomly selected subjects with seizure duration being more than 250 s, forming 14 TUH subsets as the experimental datasets. For each subject, we used 500 s of EEG signals (half normal data and half seizure data), with each EEG segment having 250 sampling points (lasting for 1 s), i.e., t = 250, and adjacent segments overlapping by 50%. For each EEG segment, the seizure state ones being categorized as positive were assigned a label of 1, while the normal state ones being categorized as negative were assigned a label of 0. Then, the 14 TUH subsets were divided into training set and testing set according to leave-one-out cross-validation.
The leave-one-out cross-validation method used in this paper is a special cross-validation method. Specifically, the TUH dataset contains 14 patient data subsets, and through 14 experimental trainings, only 1 patient sample is retained as the validation set each time, and the remaining 13 patients are used as the training set. Because each sample is independently verified, the model is not affected by the division of training set and verification set, and the validity and robustness of experimental data are guaranteed. To be more specific, the designed diagnosis model with robustness must handle both intra-patient factors and inter-patient noise to embrace clinical and more complex situations needs such as patient-independent: the testing patient is unseen in the training stage (Zhang et al., 2020). Therefore, the leave-one-out cross-validation method provides a patient-independent validation of the differences in data structures among patients during training and testing. The high average accuracy obtained by leave-one-out cross-validation method can reflect the anti-noise interference ability and robustness of the proposed model. At the same time, we evaluated the training time and test delay of our method. The results showed that the test required only 0.03 s (0.01 s for EEG decomposition and 0.02 s for attentional epilepsy diagnosis), while a single training session required 1,852.7 s. In conclusion, in a potential online seizure diagnosis system, the diagnostic delay of our approach is acceptable.
At the same time, we used the epilepsy scalp EEG dataset from Boston Children’s Hospital, United States (Goldberger et al., 2000), which is named as CHB-MIT scalp EEG, to further verify the validity of the proposed model. This dataset contains 24 consecutive scalp EEG recordings from 23 patients. The first and 21st records were from the same patient, and the 24th record did not provide personal information. The dataset followed the international 10–20 system to perform channel installation and data collection with a signal sampling frequency of 256 Hz and a resolution of 16 bits per second. In the dataset, 23 channels were used for most records. For the convenience of research, only EEG data containing 23 channels were retained in this paper, and records with channel number less than or greater than 23 would be discarded. The number of channels recorded in the 12th and 15th sections was not sufficient for the requirements of this experiment, so the data recorded in the 12th and 15th sections were discarded. Table 1 shows the personal information and the number of seizures recorded in the CHB-MIT scalp EEG dataset.
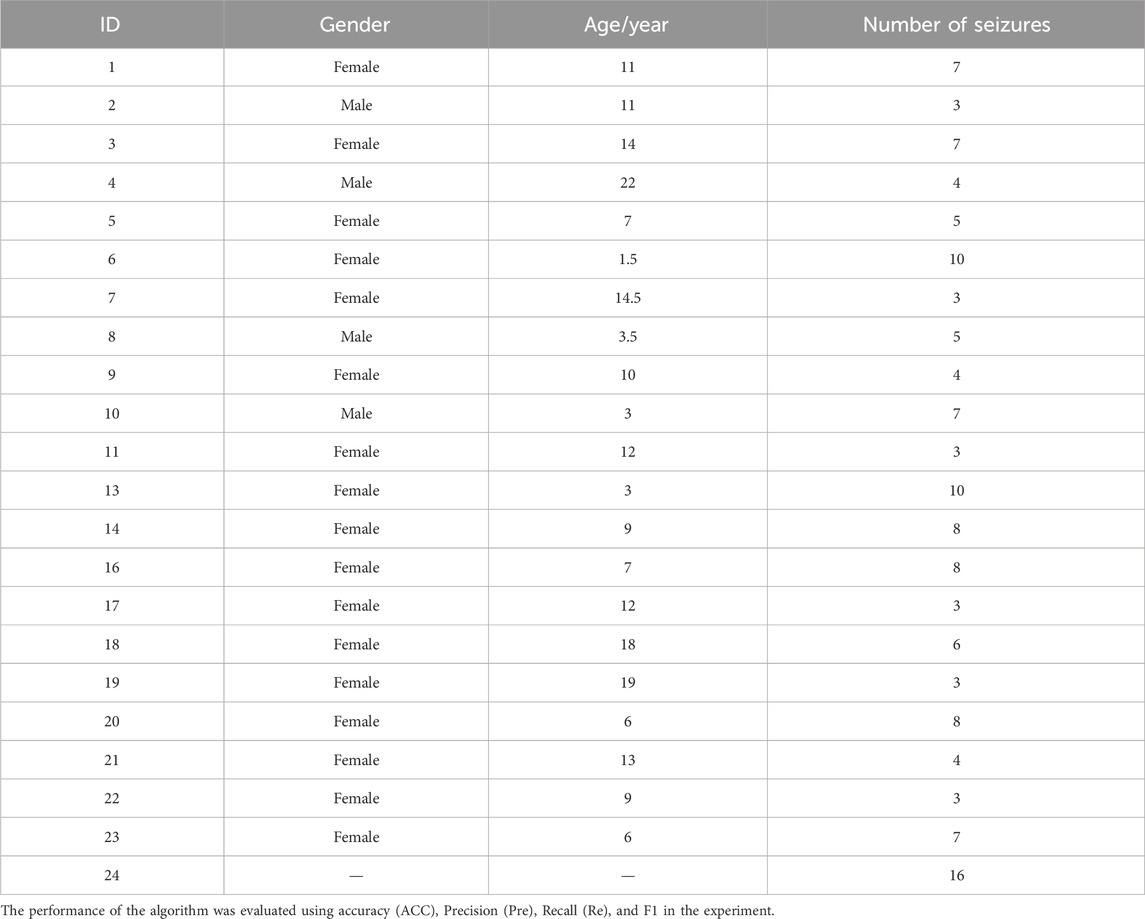
Table 1. CHB-MIT scalp EEG dataset information.
In the above equations from (16) to (19), TP (True Positive) denoted the samples judged as positive that are actually positive, TN (True Negative) denoted the samples judged as negative that are actually negative, FP (False Positive) denoted the samples judged as positive that are actually negative, FN (False Negative) denoted the samples judged as negative that are actually positive.
4.2 Benchmark
On the TUH dataset, using the same data segment length and employing leave-one-out cross-validation, we compared our approach with seven other methods. The comparative results of ACC are presented in Table 2 and Heatmap in Figure 3. Meanwhile, the comparison results of multiple indicators are shown in Table 3.
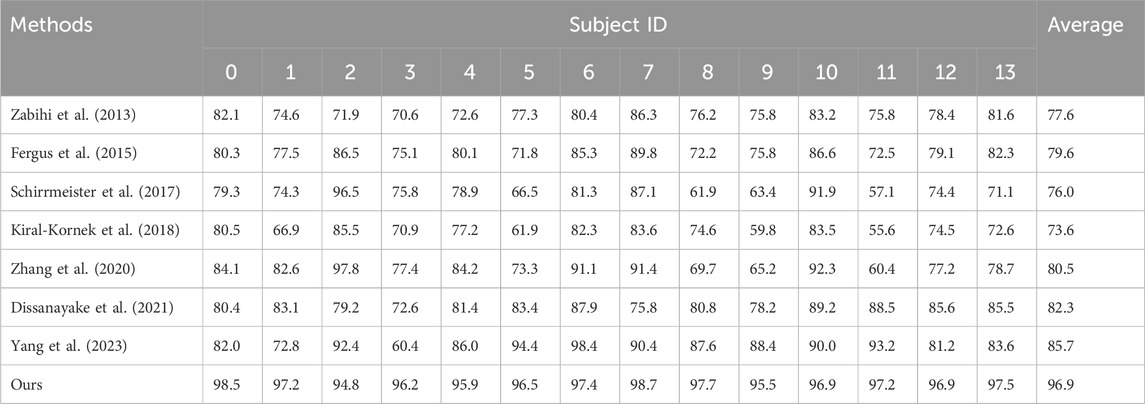
Table 2. Comparative results.
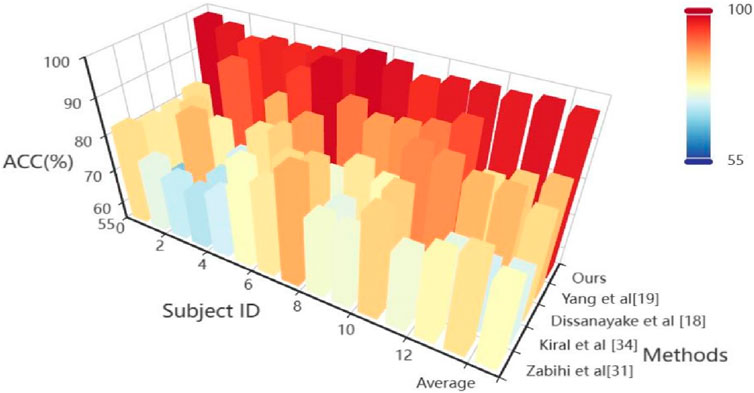
Figure 3. Heatmap visualization results from the comparative experiment.
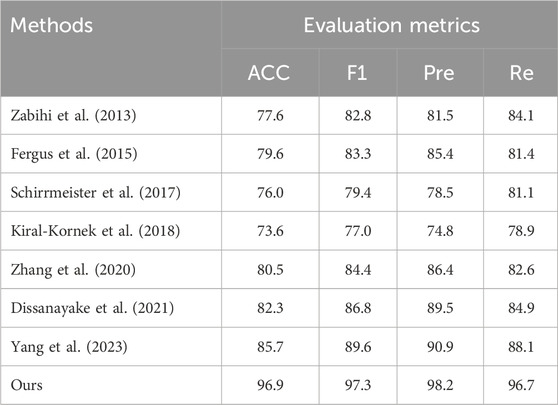
Table 3. Comparison results of multiple indexes.
Zabihi et al. (2013) used discrete wavelet transform (DWT) to calculate indicators such as relative scale energy and Shannon entropy as features. Support vector machines are used for data classification.
Fergus et al. (2015) used PSD and calculated metrics such as peak frequency and maximum frequency as features; KNN is used for data classification.
Schirrmeister et al. (2017) used convolutional neural networks to decode task-related information from EEG signals to distinguish epileptic fragments.
Kiral-Kornek et al. (2018) designed deep neural networks for epilepsy diagnosis and further developed predictive systems for wearable devices.
Zhang et al. (2020) propose an adversarial representation learning strategy to achieve robust and interpretable seizure detection.
Dissanayake et al. (2021) used CNN network structure and Siamese network structure to improve the generalization ability of the model.
Yang et al. (2023) used multistage time-spectrum feature extraction network, feature separation network and invariant feature extraction network to extract the essence of features in depth to avoid differences in data distribution between patients.
Through comparative analysis, Schirrmeister (Schirrmeister et al., 2017) and Kiral (Kiral-Kornek et al., 2018) initially applied deep neural networks to epilepsy detection but failed to consider the diversity in patient data. This lack of extracting consistent features from the data negatively impacted the model training, reducing the detection accuracy for new patients. In this context, Zabihi (Zabihi et al., 2013) used relative scale energy and Shannon entropy, etc. as features, and Fergus (Fergus et al., 2015) used peak frequency and maximum frequency, etc. as features, to capture common features in the data. However, these approaches were unable to identify common features at higher-dimensional levels. Therefore, the proposed method in the study demonstrated better detection accuracy comparing to Schirrmeister’s (Schirrmeister et al., 2017) and Kiral’s (Kiral-Kornek et al., 2018). Additionally, shallow feature commonality extraction cannot thoroughly explore the essence of features, resulting in test results lower than those achieved by Zhang (Zhang et al., 2020), Dissanayake (Dissanayake et al., 2021), and Yang (Yang et al., 2023). Zhang (Zhang et al., 2020) and Dissanayake (Dissanayake et al., 2021) employed deep learning methods such as adversarial training and contrastive training, etc., reducing the negative impact of differences in data distribution between patients. Their results were superior to those not considering removing the negative impact of data distribution shift between patients. Furthermore, Yang (Yang et al., 2023) first used a multi-level time-spectrum feature extraction network to capture common features and then input it into a feature separation network and an invariant feature extraction network, achieving more excellent accuracy performance by deeply extracting the essence of features and avoiding differences in data distribution between patients. We introduced in the study, for the first time, a hypergraph convolutional neural network model suitable for epilepsy detection. It captures multidimensional features through parallel dual branches while constructing hypergraph convolution. This exploration of high-order common information between brain regions of epilepsy patients can project essential features of data structure from a higher dimension, thereby reducing the impact of skewed distribution.
Through comprehensive analysis of several evaluation indicators, the proposed model reached 96.9% (ACC), 97.3% (F1), 98.2% (Pre) and 96.7% (Re) on the TUH dataset. Compared with the epilepsy detection study in the preface, Yang’s method has an 11.2% improvement in ACC, 7.7% improvement in F1, 7.1% improvement in Pre and 8.6% improvement in Re (Yang et al., 2023). Compared with the traditional support vector machine method (Zabihi et al., 2013), it has a greater improvement: 19.3%, 14.5%, 16.7%, and 12.6% corresponding to ACC, F1, Pre and Re, respectively. The excellent performance of the proposed model is further described through multiple evaluation dimensions.
On the CHB-MIT scalp EEG dataset, we used the model and the leave-one-out cross-validation method to conduct a full experiment on this dataset. The experimental results (ACC) are shown in Table 4.
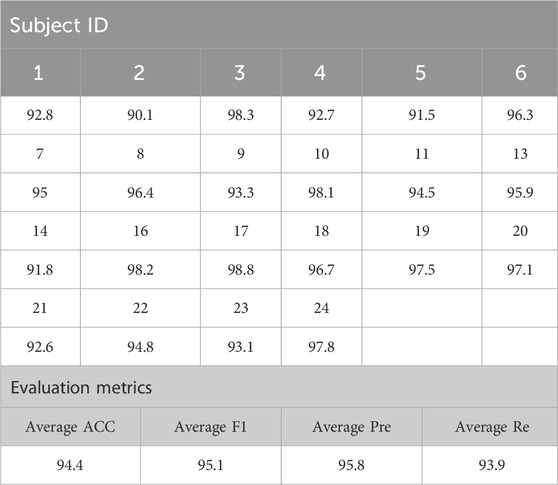
Table 4. Experimental results.
The generalization ability of the proposed model was tested on the CHB-MIT scalp EEG dataset. From the experimental results in the table, it can be concluded that the ACC, F1, Pre and Re of 22 patients evaluated by the model were as high as 94.4%, 95.1%, 95.8%, and 93.9%. Each evaluation index is above 90%, and the comprehensive ability is outstanding. Among them, the EEG test results of patient 17 were as high as 98.8%, and the model’s worst performance was patient 16, at 89.4%. The experimental data of the two datasets show that the proposed model has good generalization ability and robustness.
5 Discussions
In order to analyze the effectiveness of the proposed method, we conducted extensive ablation experiments on TUH dataset with its components and parameters. First, in the feature extraction stage, to validate the effectiveness of the dual-branch structure, we conducted two sets of experiments: “Only Conv-LSTM,” “Only PSD,” “Only Conv-Att” and “Only Ene,” which respectively represented only using Conv-LSTM to extract features, only using PSD to extract features, using only channel attention convolution and only energy representations. Secondly, for the important parameters
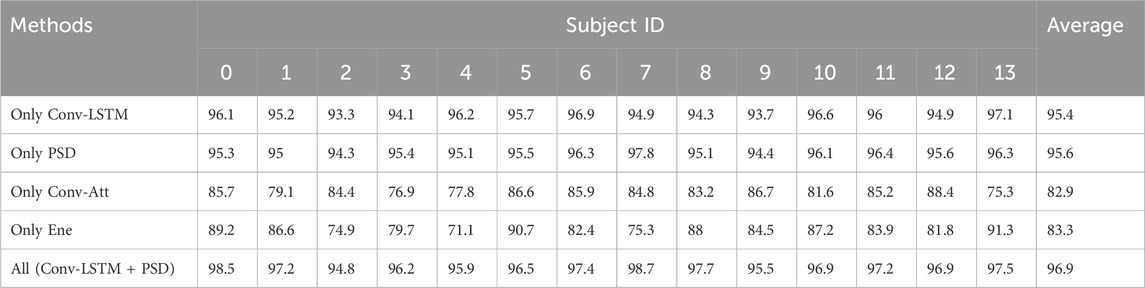
Table 5. Experimental results of branch ablation.
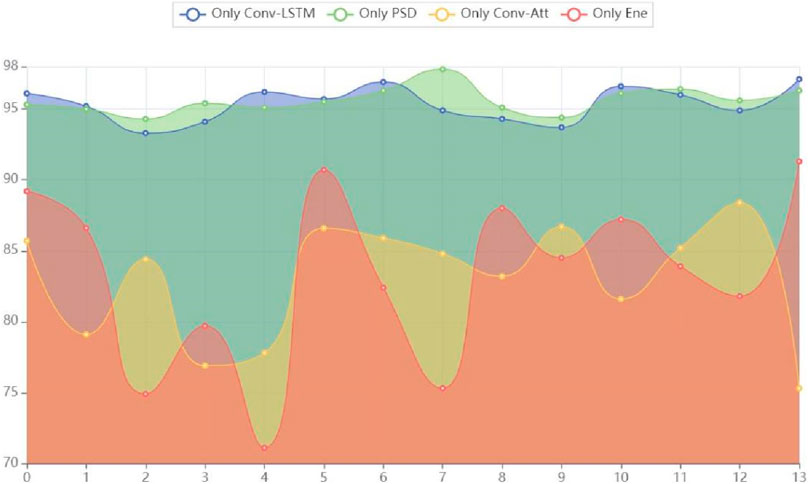
Figure 4. Area of experimental results for branch ablation.
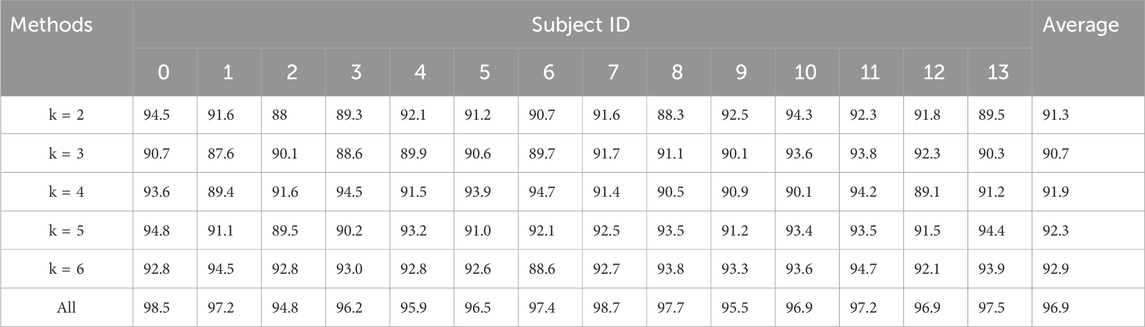
Table 6. Experimental results of hypergraph parameters.
To validate the effectiveness of the proposed dual-branch structure, a comparison between the results of single-branch experiments and dual-branch experiments revealed that the model testing average accuracy was 95.4% when only using Conv-LSTM to extract features, while the model testing average accuracy was 95.6% when only using PSD to extract features. At the same time, “Only Conv-Att” and “Only Ene” performed significantly lower in ACC at 82.9% and 83.3%, respectively, than “Only Conv-LSTM” and “Only PSD.” This shows that the essential ability of hypergraph convolutional representation data constructed after spatial attention extraction branch and energy branch extraction is inferior to Conv-LSTM branch and PSD branch. Therefore, Conv-LSTM branch and PSD branch are selected as more effective feature extraction methods in this paper.
By comparing the model performance of using only the Conv-LSTM feature extraction branch and using only the PSD feature extraction branch, it was found that the model performance using only the PSD feature extraction branch was superior to the model performance using only the Conv-LSTM feature extraction branch. We conducted a model performance comparison using an area chart, as shown in Figure 2, where the model performance using only the PSD feature extraction branch dominated in total area, highlighting its outstanding testing performance. The reason for this result may be that frequency domain features have advantages in explaining the essence of epilepsy EEG information, while spatiotemporal domain information is more focused on connecting temporal information to construct context. Therefore, after extracting frequency domain features, the fusion of temporal information can effectively reveal multiple aspects of the essential characteristics of epilepsy EEG signals, achieving a superior detection accuracy of 96.9%.
Upon completing the dual-branch feature extraction, it is crucial to effectively construct the hypergraph for feature representation and hypergraph learning. In hypergraph construction, each EEG data channel served as a vertex
In future study, we propose three recommendations as the following:
Firstly, the proposed method employed a dual-branch parallel extraction and hypergraph learning structure, capturing frequency domain information and spatiotemporal domain information respectively. Next, we can increase the data volume in parallel branches to extract more discriminative features from multiple dimensions, thereby enhancing the model’s performance.
Secondly, in the hypergraph construction stage, the current approach only utilized the KNN method to search for vertices and construct hyperedges. Next, we can explore various ways of constructing hypergraphs and integrate them to enhance the feature representation capability of hypergraphs.
Lastly, the proposed method was trained and tested only on two public datasets, lacking validation on real clinical datasets. Therefore, we will conduct validation on the actual performance of the model using clinical data in the future.
6 Conclusion
In the study, we have first ever introduced a novel neural network model for epilepsy detection based on hypergraph convolution. Addressing the insufficient feature extraction in traditional methods for epilepsy datasets, which fails to deeply reveal the high-order characteristics of seizure data, we have proposed the dual-branch approach to extract features from each channel using Conv-LSTM module and PSD. This has been a highly effective way to explore both the frequency domain features and spatiotemporal domain features information of epilepsy signals. Based on this, hypergraphs were constructed using the KNN algorithm, exploring the commonalities and intrinsic information of epilepsy data in the hypergraph structure. Finally, hypergraph convolution was applied to achieve graph feature extraction and automatic epilepsy detection. In the testing and validation phase, we conducted leave-one-out cross-validation with 14 patients’ data selected from the TUH dataset according to experimental requirements and compared the results with relevant literature. The proposed method achieved the best results. In addition, the effectiveness and generalization ability of the proposed model are verified on CHB-MIT Scalp EEG dataset. It indicates that the high-order hypergraph features, which the model explores, are highly discriminative, being able to achieve higher detection accuracy and provide valuable reference for the clinical application of epilepsy detection.
Data availability statement
Publicly available datasets were analyzed in this study. This data can be found here: I. Obeid and J. Picone, “The Temple University Hospital EEG Data Corpus,” Frontiers in Neuroscience, vol. 10, p. 196, 2016.
Author contributions
JaL: Conceptualization, Methodology, Software, Writing–original draft, Writing–review and editing. YY: Conceptualization, Methodology, Software, Writing–original draft, Writing–review and editing. FL: Investigation, Supervision, Validation, Writing–review and editing. JnL: Investigation, Supervision, Validation, Writing–review and editing.
Funding
The author(s) declare that financial support was received for the research, authorship, and/or publication of this article. This research was partly supported by the National Natural Science Foundation of China (Nos 62376168 and 62371438), the National Key R&D Program of China (No. 2023YFB3308601), Science and Technology Service Network Initiative (No. KFJ-STS-QYZD-2021-21-001), the Talents by Sichuan provincial Party Committee Organization Department, and Chengdu—Chinese Academy of Sciences Science and Technology Cooperation Fund Project (Major Scientific and Technological Innovation Projects).
Conflict of interest
The authors declare that the research was conducted in the absence of any commercial or financial relationships that could be construed as a potential conflict of interest.
Publisher’s note
All claims expressed in this article are solely those of the authors and do not necessarily represent those of their affiliated organizations, or those of the publisher, the editors and the reviewers. Any product that may be evaluated in this article, or claim that may be made by its manufacturer, is not guaranteed or endorsed by the publisher.
References
Alam M. N., Ibrahimy M. I., Motakabber S. M. A. (2021). in Feature extraction of EEG signal by power spectral density for motor imagery based BCI[C]//2021 8th International Conference on Computer and Communication Engineering (ICCCE) (IEEE), 234–237.
Dissanayake T., Fernando T., Denman S., Sridharan S., Fookes C. (2021). Deep learning for patient-independent epileptic seizure prediction using scalp EEG signals. IEEE Sensors J. 21 (7), 9377–9388. doi:10.1109/jsen.2021.3057076
Ein Shoka A. A., Dessouky M. M., El-Sayed A., Hemdan E. E. D. (2023). EEG seizure detection: concepts, techniques, challenges, and future trends. Multimedia Tools Appl. 82, 42021–42051. doi:10.1007/s11042-023-15052-2
Feng Y., You H., Zhang Z. (2019a). “Hypergraph neural networks. Biomedical engineering,” in Paper presented at the Proceedings of the AAAI conference on artificial intelligence, 162–175.
Feng Y., You H., Zhang Z., Ji R., Gao Y. (2019b). “Hypergraph,” in Neural Networks//Proceedings of the AAAI conference on artificial intelligence, 3558–3565. 01. doi:10.1609/aaai.v33i01.33013558
Fergus P., Hignett D., Hussain A., Al-Jumeily D., Abdel-Aziz K. (2015). Automatic epileptic seizure detection using scalp EEG and advanced artificial intelligence techniques. Biomed. Res. Int. 2015, 986736. doi:10.1155/2015/986736
Goldberger A. L., Amaral L. A. N., Glass L., Hausdorff J. M., Ivanov P. C., Mark R. G., et al. (2000). PhysioBank, PhysioToolkit, and PhysioNet: components of a new research resource for complex physiologic signals. circulation 101 (23), e215–e220. doi:10.1161/01.cir.101.23.e215
Hu X., Yuan S., Xu F., Leng Y., Yuan K., Qi Y. (2020). Scalp EEG classification using deep Bi-LSTM network for seizure detection. Comput. Biol. Med. 124, 103919. doi:10.1016/j.compbiomed.2020.103919
Jiang J., Wei Y., Feng Y., Cao J., Gao Y., et al. (2019). “Dynamic hypergraph neural networks[C]//IJCAI,” in Proceedings of the Twenty-Eighth International Joint Conference on Artificial Intelligence Maintrack, 2635–2641. doi:10.24963/ijcai.2019/366
Kiral-Kornek I., Roy S., Nurse E., Mashford B., Karoly P., Carroll T., et al. (2018). Epileptic seizure prediction using big data and deep learning: toward a mobile system. EBioMedicine 27, 103–111. doi:10.1016/j.ebiom.2017.11.032
Li M., Qiu M., Zhu L., Kong W. (2023). Feature hypergraph representation learning on spatial-temporal correlations for EEG emotion recognition. Cogn. Neurodynamics 17 (5), 1271–1281. doi:10.1007/s11571-022-09890-3
Michel C. M., Murray M. M., Lantz G., Gonzalez S., Spinelli L., Grave de Peralta R. (2004). EEG source imaging. Clin. Neurophysiol. 115 (10), 2195–2222. doi:10.1016/j.clinph.2004.06.001
Nithya K., Sharma S., Sharma R. R. (2023). in Eigenvalues of Hankel Matrix based Epilepsy Detection using EEG Signals[C]//2023 2nd International Conference on Paradigm Shifts in Communications Embedded Systems, Machine Learning and Signal Processing (PCEMS) (IEEE), 1–6.
Obeid I., Picone J. (2016). The temple university hospital EEG data corpus. Front. Neurosci. 10, 196. doi:10.3389/fnins.2016.00196
Poo M. M., Du J. L., Ip N. Y., Xiong Z. Q., Xu B., Tan T. (2016). China brain project: basic neuroscience, brain diseases, and brain-inspired computing. Neuron 92 (3), 591–596. doi:10.1016/j.neuron.2016.10.050
Poorani S., Balasubramanie P. (2023). Deep learning based epileptic seizure detection with EEG data. Int. J. Syst. Assur. Eng. Manag., 1–10. doi:10.1007/s13198-022-01845-5
Presigny C., De Vico Fallani F. (2022). Colloquium: multiscale modeling of brain network organization. Rev. Mod. Phys. 94 (3), 031002. doi:10.1103/revmodphys.94.031002
Sakkalis V. (2011). Review of advanced techniques for the estimation of brain connectivity measured with EEG/MEG. Comput. Biol. Med. 41 (12), 1110–1117. doi:10.1016/j.compbiomed.2011.06.020
Sala A., Lizarraga A., Caminiti S. P., Calhoun V. D., Eickhoff S. B., Habeck C., et al. (2022). Brain connectomics: time for a molecular imaging perspective? Trends Cognitive Sci. (99), 1–14. doi:10.1016/j.tics.2022.11.015
Schirrmeister R. T., Springenberg J. T., Fiederer L. D. J., Glasstetter M., Eggensperger K., Tangermann M., et al. (2017). Deep learning with convolutional neural networks for EEG decoding and visualization. Hum. brain Mapp. 38 (11), 5391–5420. doi:10.1002/hbm.23730
Sharma R. R., Varshney P., Pachori R. B., Vishvakarma S. K. (2018). Automated system for epileptic EEG detection using iterative filtering. IEEE Sensors Lett. 2 (4), 1–4. doi:10.1109/lsens.2018.2882622
Sharma S., Shedsale A., Sharma R. R. (2023). Multivariate fast iterative filtering based automated system for grasp motor imagery identification using EEG signals. Int. J. Human–Computer Interact., 1–9. doi:10.1080/10447318.2023.2280327
Shi X., Chen Z., Wang H., Yeung D-Y., Wong W-K., Woo W-C. (2015). Convolutional LSTM network: a machine learning approach for precipitation nowcasting. Adv. neural Inf. Process. Syst., 28. doi:10.1007/978-3-319-21233-3_6
Shuting S., Xiaowei L., Jing Z., Wang Y., La R., Zhang X., et al. (2019). Graph theory analysis of functional connectivity in major depression disorder with high-density resting state EEG data. IEEE Trans. neural Syst. rehabilitation Eng. 27 (3), 429–439. doi:10.1109/TNSRE.2019.2894423
Sola J., Sevilla J. (1997). Importance of input data normalization for the application of neural networks to complex industrial problems. IEEE Trans. Nucl. Sci. 44 (3), 1464–1468. doi:10.1109/23.589532
Sporns O., Tononi G., Kötter R. (2005). The human connectome: a structural description of the human brain. PLoS Comput. Biol. 1 (4), e42. doi:10.1371/journal.pcbi.0010042
Thiebaut de Schotten M., Forkel S. J. (2022). The emergent properties of the connected brain. Science 378 (6619), 505–510. doi:10.1126/science.abq2591
van den Heuvel M. P., Hulshoff Pol H. E. (2010). Exploring the brain network: a review on resting-state f MRI functional connectivity. Eur. Neuropsychopharmacol. 20 (8), 519–534. doi:10.1016/j.euroneuro.2010.03.008
Wagh N., Varatharajah Y. (2020). Eeg-gcnn: augmenting electroencephalogram-based neurological disease diagnosis using a domain-guided graph convolutional neural network[C]//Machine Learning for Health. PMLR, 367–378.
Wang Z., Liu F., Shi S., Xia S., Peng F., Wang L., et al. (2023). Automatic epileptic seizure detection based on persistent homology. Front. Physiology 14, 1227952. doi:10.3389/fphys.2023.1227952
Yadati N., Nimishakavi M., Yadav P. (2019). Hypergcn: a new method for training graph convolutional networks on hypergraphs. Adv. Neural Inf. process Syst. 32. doi:10.48550/arXiv.1809.02589
Yan C.-G., Chen X., Li L., Castellanos F. X., Bai T. J., Bo Q. J., et al. (2019). Reduced default mode network functional connectivity in patients with recurrent major depressive disorder. Proc. Natl. Acad. Sci. 116 (18), 9078–9083. doi:10.1073/pnas.1900390116
Yang Y., Li F., Qin X., Wen H., Lin X., Huang D. (2023). Feature separation and adversarial training for the patient-independent detection of epileptic seizures. Front. Comput. Neurosci. 17, 1195334. doi:10.3389/fncom.2023.1195334
Yang Y., Qin X., Lin X., Wen H., Peng Y. (2022). Epilepsy detection and analysis method for specific patient based on data augmentation and deep learning. Sheng Wu Yi Xue Gong Cheng Xue Za Zhi 39 (2), 293–300. doi:10.7507/1001-5515.202107060
Yudhana A., Muslim A., Wati D. E., Puspitasari I., Azhari A., Mardhia M. M. (2020). Human emotion recognition based on EEG signal using fast fourier transform and K-Nearest neighbor. Adv. Sci. Technol. Eng. Syst. J. 5 (6), 1082–1088. doi:10.25046/aj0506131
Zabihi M., Kiranyaz S., Ince T., Gabbouj M., et al. Patient-specific epileptic seizure detection in long-term EEG recording in paediatric patients with intractable seizures. 2013. Corpus ID: 62541685.
Zhang D., Yao L., Chen K., Wang S., Haghighi P. D., Sullivan C. (2019). A graph-based hierarchical attention model for movement intention detection from EEG signals. IEEE Trans. Neural Syst. Rehabilitation Eng. 27 (11), 2247–2253. doi:10.1109/TNSRE.2019.2943362
Zhang R., Sui L., Gong J., Cao J. (2023). EEG-based real-time diagnostic system with developed dynamic 2TEMD and dynamic ApEn algorithms. Front. Physiology 14, 1165450. doi:10.3389/fphys.2023.1165450
Zhang X., Yao L., Dong M., Liu Z., Zhang Y., Li Y. (2020). Adversarial representation learning for robust patient-independent epileptic seizure detection. IEEE J. Biomed. health Inf. 24 (10), 2852–2859. doi:10.1109/JBHI.2020.2971610
Keywords: epileptic seizure detection, EEG, PSD, Conv-LSTM, hypergraph learning
Citation: Liu J, Yang Y, Li F and Luo J (2024) An epilepsy detection method based on multi-dimensional feature extraction and dual-branch hypergraph convolutional network. Front. Physiol. 15:1364880. doi: 10.3389/fphys.2024.1364880
Received: 06 January 2024; Accepted: 28 March 2024;
Published: 12 April 2024.
Edited by:
Feng Liu, The University of Queensland, AustraliaReviewed by:
Hua Zhang, The University of Queensland, AustraliaRishi Raj Sharma, Defence Institute of Advanced Technology (DIAT), India
Copyright © 2024 Liu, Yang, Li and Luo. This is an open-access article distributed under the terms of the Creative Commons Attribution License (CC BY). The use, distribution or reproduction in other forums is permitted, provided the original author(s) and the copyright owner(s) are credited and that the original publication in this journal is cited, in accordance with accepted academic practice. No use, distribution or reproduction is permitted which does not comply with these terms.
*Correspondence: Yong Yang, yangyong@cigit.ac.cn; Feng Li, 954036024@qq.com