 Nirmala Chandralega Kampan1,2,3
 Mutsa Tatenda Madondo1Orla M. McNally2
 Andrew N. Stephens4,5,6
 Michael A. Quinn2
 Magdalena Plebanski1,7*
- 1Department of Immunology and Pathology, Monash University, Melbourne, VIC, Australia
- 2Oncology Unit, Royal Women’s Hospital, Melbourne, VIC, Australia
- 3Department of Obstetrics and Gynaecology, Pusat Perubatan Universiti Kebangsaan Malaysia, Kuala Lumpur, Malaysia
- 4Centre for Cancer Research, Hudson Institute of Medical Research, Clayton, VIC, Australia
- 5Department of Molecular and Translational Sciences, Monash University, Clayton, VIC, Australia
- 6Epworth Research Institute, Epworth Healthcare, Richmond, VIC, Australia
- 7School of Health and Biomedical Sciences, RMIT University, Melbourne, VIC, Australia
Background: Epithelial ovarian cancer (EOC) remains a highly lethal gynecological malignancy. Ascites, an accumulation of peritoneal fluid present in one-third of patients at presentation, is linked to poor prognosis. High levels of regulatory T cells (Tregs) in ascites are correlated with tumor progression and reduced survival. Malignant ascites harbors high levels of Tregs expressing the tumor necrosis factor receptor 2 (TNFR2), as well as pro-inflammatory factors such as interleukin 6 (IL-6) and tumor necrosis factor (TNF). IL-6 is also associated with poor prognosis. Herein, we study the effect of IL-6 and TNF present in ascites on the modulation of TNFR2 expression on T cells, and specifically Tregs.
Methods: Ascites and respective peripheral blood sera were collected from 18 patients with advanced EOC and soluble biomarkers, including IL-6, sTNFR2, IL-10, TGF-β, and TNF, were quantified using multiplexed bead-based immunoassay. Peripheral blood mononuclear cells (PBMC) from healthy donors were incubated with cell-free ascites for 48 h (or media as a negative control). In some experiments, IL-6 or TNF within the ascites were neutralized by using monoclonal antibodies. The phenotype of TNFR2+ Tregs and TNFR2− Tregs were characterized post incubation in ascites. In some experiments, cell sorted Tregs were utilized instead of PBMC.
Results: High levels of immunosuppressive (sTNFR2, IL-10, and TGF-β) and pro-inflammatory cytokines (IL-6 and TNF) were present in malignant ascites. TNFR2 expression on all T cell subsets was higher in post culture in ascites and highest on CD4+CD25hiFoxP3+ Tregs, resulting in an increased TNFR2+ Treg/effector T cell ratio. Furthermore, TNFR2+ Tregs conditioned in ascites expressed higher levels of the functional immunosuppressive molecules programmed cell death ligand-1, CTLA-4, and GARP. Functionally, TNFR2+ Treg frequency was inversely correlated with interferon-gamma (IFN-γ) production by effector T cells, and was uniquely able to suppress TNFR2+ T effectors. Blockade of IL-6, but not TNF, within ascites decreased TNFR2+ Treg frequency. Results indicating malignant ascites promotes TNFR2 expression, and increased suppressive Treg activity using PBMC were confirmed using purified Treg subsets.
Conclusion: IL-6 present in malignant ovarian cancer ascites promotes increased TNFR2 expression and frequency of highly suppressive Tregs.
Introduction
Ovarian cancer is one of the most lethal types of cancer in women globally (1, 2). This is because the majority of ovarian cancer patients are diagnosed in late stages, with up to one-third of patients presenting with a prominent peritoneal accumulation of fluid called “ascites.” Ascites development is associated with chemo-resistance, disease recurrence (3, 4), and poorer survival in ovarian cancer patients (5–9). Ovarian cancer ascites further contains a complex reservoir of immune cells and cytokines, harboring immunosuppressive cells as well as inflammatory soluble factors (7, 10, 11). This unique milleau has been proposed to help tumor cells evade host immunosurveillance, so that tumor cells can continue growing without restriction (3, 7, 9, 10). In ovarian cancer, similar to other cancers, the immune system is hampered in controlling the tumor due to the presence of regulatory T cells (Tregs) that inhibit T effector (Teff) cell-mediated antitumor responses (9).
Tumor necrosis factor receptor type II (TNFR2) stimulates the activation and proliferation of Tregs from a resting to an activated state (12). Expression of TNFR2 on Tregs is reported to identify the maximally suppressive and functional Treg population in both mice and humans (13–15). Overabundance of TNFR2+ Tregs creates a potent immunosuppressive microenvironment associated with negative patient outcomes in diverse cancers, such as acute myeloid leukemia, lung cancer, ovarian cancer, and colorectal cancer (16–20). Decreasing TNFR2+ Treg levels using cyclophosphamide in mice (21) or panobinostat and azacitidine in humans (19) is associated with improved antitumor immune responses and prolonged survival. Lenalidomide has also been shown to both decrease TNFR2+ Treg levels and enhance Teff function in patients with acute myeloid leukemia. The high levels of TNFR2+ Tregs in ovarian cancer ascites can be driven by their preferential migration into the ascites, given their high levels of expression of the CCR4 chemokine receptor (18). It is also possible that cytokines present in ascites may promote TNFR2 expression on Tregs. Once TNFR2 is expressed on Tregs, tumor necrosis factor (TNF) in ascites can further stabilize FoxP3 expression, the hallmark transcription factor associated with Treg suppressive capabilities (22).
Tumor necrosis factor receptor 2 expression is elevated on peripheral blood mononuclear cells (PBMCs) of ovarian cancer patients, as well as on mononuclear cells present in ovarian cancer ascites (18). In a previous study looking at TNFR2+ Tregs from ovarian cancer ascites, Govindaraj and colleagues observed that TNFR2+ Tregs extracted from ascites express higher levels of immunosuppressive molecules CTLA-4 and GARP, and are functionally more suppressive when compared to peripheral blood TNFR2+ Tregs (18). Induction of CTLA-4 and GARP expression on human Tregs is dependent on the transcription factor FoxP3 (23–26). In the present study, we have assessed whether soluble components present in cell-free ascites can promote upregulation of these functional immunosuppressive molecules on Tregs, and their association with a TNFR2+ Treg phenotype.
Apart from these immunosuppressive check-point inhibitor receptors, it is also important to assess whether ascites may modulate the expression of other immunosuppressive molecules currently being explored for ovarian cancer immunotherapy. Programmed cell death ligand-1 (PD-L1), a member of B7 superfamily, is a negative immunoregulatory molecule that inhibits effector T cell activity and is highly expressed on cancer cells (27–31) and immune cells including Tregs (32, 33). PD-L1 expression on Tregs is associated with upregulated FoxP3 expression and promotes maximally suppressive Treg activity (34). PD-L1 inhibitors have demonstrated promising antitumor efficacy in several cancer types, including melanoma, non-small cell lung cancer, renal cell carcinoma, bladder carcinoma, and Hodgkin’s lymphoma (35–37). Recent studies have shown that PD-L1 can be upregulated by pro-inflammatory cyokines such as TNF (38).
Elevated interleukin 6 (IL-6) in ascites and in the serum of patients with advanced ovarian cancer has been most strongly correlated with poor survival (39–41) as it has in multiple other cancers (42). IL-6 is a pleiotropic cytokine and an essential biomarker in the cytokine cascade that is involved in the initiation and regulation of inflammation (43, 44). It can be synthesized by dendritic cells, macrophages (45, 46), lymphocytes (47–50), somatic cells (e.g., fibroblasts, keratinocytes, endothelial cells) (51–53), and multiple cancer cell types including breast, lung, head and neck, colorectal, hepatobiliary, pancreatic, as well as ovarian cancer cells (54–62).
Accumulated Tregs in ascites and tissue have been found to be higher in patients with ovarian cancer and linked to advanced ovarian disease and poor prognosis (9). The production of TNF and IL-6 are concomitantly increased in these conditions (63); therefore, the potential effect of these pro-inflammatory cytokines on Tregs is of interest. The relationship between Tregs, IL-6, and TNF is likely to be complex. Experiments using murine cells with autoimmune disease reported that TNF promotes proliferation and maintains suppressive activity of Treg cells both in vitro and in vivo (13, 64). In contrast, there are conflicting reports of the activity of TNF on human Tregs. Some studies suggest that TNF promotes a reduction in the expression of FoxP3 and inhibits the suppressive activity of human Tregs (65, 66). Conversely, a recent study showed that TNF, in the presence of IL-2, increases the expression of human Tregs (both CD25 and FoxP3), and their suppressive activity in a 3-day culture (67). TNFR2 is agreed to be the primary receptor for TNF on both murine and human Treg cells.
The effect of IL-6 on Tregs similarly has been a source of significant controversy. IL-6 has been reported to promote differentiation into T helper type 2 differentiation cells (68) and influence the balance between IL-17 producing cells (Th17) and Tregs (69). While IL-6 alone is unable to induce Th17 cells, culturing of IL-6 in combination with TGF-β (70–73) has been reported to promote murine and human naïve T cells to become Th17 and inhibit conversion into Tregs. In contrast, inducible Tregs activated in the presence of IL-2 and TGF-β did not differentiate into Th17 when cultured with IL-6 (74). In a murine study mimicking excessive IL-6 as seen in chronic inflammatory disorders and several cancers, T cells isolated from peripheral lymphoid organs in IL-6 transgenic mice not only had increased levels of Th17 but also Tregs which further were shown to have retained suppressive activity (75). This in vivo study, therefore, suggests that excessive IL-6 conditions do not negatively affect development and function of Tregs and may potentially promote them under specific conditions (75).
To explore the relationship between Tregs, TNF, and IL-6 in ovarian cancer ascites, we created an in vitro system to study the effect of IL-6 and TNF within cell-free ovarian cancer ascites on TNFR2+ Treg and on TNFR2+ Teff frequency and function. Our results suggest a critical role for IL-6, present in ovarian cancer ascites, in promoting highly functional TNFR2+ Tregs, which are shown to be the only Treg subset capable of suppressing TNFR2+ Teffs in ovarian cancer ascites cultures.
Materials and Methods
Trial Design and Patient Details
This study was carried out in accordance with the recommendations of an Immunity and Ovarian Cancer trial (Project 13/32), HREC of Royal Women’s Hospital with written informed consent from all patients. All patients gave written informed consent in accordance with the Declaration of Helsinki. The protocol was approved by the HREC of the Royal Women’s Hospital, Melbourne. Ascites and peripheral blood serum samples were prospectively obtained from 18 patients with newly diagnosed advanced epithelial ovarian cancer (EOC) seen in the Oncology Unit, Royal Women’s Hospital, Melbourne, Australia following informed consent. All relevant clinical information including demographic status, medical and drug history, clinical diagnosis, and disease extent and status were prospectively collected. Blood samples were obtained immediately prior to surgery and general anesthesia. Ascites samples were collected either during peritoneal tapping prior to chemotherapy or at the time of surgery. Histologic diagnosis of the study patients was confirmed independently by senior hospital pathologists, and all histologic data were prospectively collected and stored in a computerized hospital database. For healthy blood samples, 40 buffy coats were obtained from blood donated by healthy adult volunteers acquired at Australian Red Cross Blood Bank Service.
Isolation of Peripheral Blood Serum
Pre-operative venous blood was drawn from ovarian cancer patients into serum collecting (SST) vacutainer tubes (BD). Following collection, the tubes were left undisturbed at room temperature for 30 min to allow blood to clot. The clots were removed by centrifugation at 1,000 g for 10 min in a refrigerated centrifuge. All sera were stored at −80°C until use.
Isolation of Ascites Supernatant
Ascites samples from ovarian cancer patients were first filtered through a 100-µm cell strainer and centrifuged to remove the cellular component. The cell-free supernatant layer of the ascites was collected and stored at −80°C until use.
Isolation of PBMCs
Healthy donor (Australian Red Cross Blood Services) PBMCs were isolated by Ficoll (Amersham Pharmacia Biotech, Sweden) density gradient centrifugation. The isolated PBMCs were suspended in cryovials containing a freeze medium mixture of 10% DMSO (Sigma-Aldrich, USA) and 90% heat-inactivated fetal calf serum (GIBCO, Life Technologies, USA) and frozen at a speed of −1°C/min in a −80°C freezer then subsequently stored in liquid nitrogen. Prior to cell culture, each vial of frozen PBMCs was rapidly thawed in a 37°C water-bath and resuspended in complete AIM V media [AIM V (Life Technologies, USA) supplemented with 5% normal human serum (Sigma-Aldrich, USA)].
In Vitro Conditioning with Ascites
Peripheral blood mononuclear cells from healthy donors were cultured in a 96-well culture plate with 150 μl/well of either complete AIM V media alone or with 50% ascites supernatant (obtained from patient ascites via centrifugation) at a final concentration of 2 × 10⁶ cells/ml. The cells were then incubated in a humidified incubator at 37°C with 5% CO2. After 48 h, the cells were harvested, antibody labeled, and further analyzed by flow cytometry.
In Vitro Blockade of Cytokines within Ascites with Monoclonal Antibodies (mAbs)
Peripheral blood mononuclear cells from healthy donors were isolated by Ficoll density centrifugation and incubated in vitro in either complete AIM V media or cell-free ascites from an advanced EOC patient. IL-6 and TNF within the ascites was blocked with murine anti-human IL-6 monoclonal antibody (final concentration at 2.5 µg/ml, R&D, USA) and murine anti-human TNF monoclonal antibody at 500 ng/ml (R&D, USA). Mouse IgG1 immunoglobulins (isotype control) (R&D USA) were used as a negative control. Isotype control and mAbs were added into media and ascites, respectively, in a 10-ml tube, gently suspended and incubated at room temperature for 10 min. PBMCs from healthy donors were then added into a 96-well culture plate with 150 μl/well of either complete AIM V media alone or with 50% ascites supernatant (blocked IL-6 or TNF or both) at a final concentration of 2 × 10⁶ cells/ml. Following 48 h of incubation in a humidified incubator at 37°C with 5% CO2, cells were washed, stained, and analyzed with flow cytometry.
Flow Cytometric Analysis
To determine the frequency and phenotype of T cell populations in PBMCs, multicolor flow cytometry was performed using the following surface antibodies: anti-CD3 PerCP (BD Pharmingen, USA) and anti-CD8 FITC (Biolegend, USA); anti-CD4 APC-Cy7 (BD Pharmingen, USA), and anti-CD25 PECF584 (BD Pharmingen, USA), anti-CD127 BV650 (Biolegend, USA), anti-TNFR2 biotinylated followed by conjugation with Streptavidin PECy7 (BD Pharmingen, USA), anti-PD-L1 PE (Biolegend, USA), anti-CTLA-4 BV605 (Biolegend, USA), and anti-GARP BV711 (BD Pharmingen, USA). Following primary staining, a fixable dead cell marker (Life Technologies, USA) was also used to distinguish between dead and live cells. Intracellular levels of FoxP3 and IFN-γ were determined following fixation and permeabilization of cells using a fixation/permeabilization buffer kit (eBioscience, USA) then staining the cells with anti-FoxP3 APC (eBioscience, USA) and anti- IFN-γ v450 antibody (eBioscience, USA). Flow cytometry data were acquired on a Becton Dickinson LSR II flow cytometer using FACS Diva software, acquiring a minimum of 100,000 events per sample. Fluorescence minus one (FMO) controls and isotype-matched immunoglobulins were used to enable accurate gating. Data were analyzed using Flow jo software (TreeStar, USA).
Intracellular Cytokine Analysis
Peripheral blood mononuclear cells from healthy donors cultured in a 48-well plate at final concentration of 2 × 10⁶ cells/ml per well in either AIM V media alone or with 50% ascites supernatant for 48 h. Cells were washed and then stimulated for 6 h with 50 ng/ml of phorbol 12-myristate 13-acetate (PMA) and 1 µg/ml of ionomycin (Sigma-Aldrich, USA) at 37°C in a 5% CO2, humidified incubator. Brefeldin A (eBioscience, USA) was added for the last 5 h of incubation at a concentration of 1 µg/ml. After stimulation, the cells were washed and labeled for surface markers as above, followed by intracellular staining for FoxP3 and IFN-γ and then prepared for flow cytometric analysis. Unstimulated cells, FMO, and isotype-matched immunoglobulins were also used as controls. Flow cytometry data were acquired on a Becton Dickinson LSR II flow cytometer, and data were analyzed using Flowjo software (TreeStar, USA).
Cell Sorting and Culture
Flow cytometric cell sorting was performed using BD Influx to isolate Teff and Tregs cells as well as Tregs TNFR2+ and Tregs TNFR2− subsets. PBMCs from healthy donors were stained with the following surface antibodies: anti-CD3 PerCP (BD Pharmingen, USA), anti-CD4 APC-Cy7 (BD Pharmingen, USA), anti-CD127 BV650 (Biolegend, USA), and anti-CD25 PECF584 (BD Pharmingen, USA). For isolation of Tregs TNFR2+ and Tregs TNFR2− subsets in some experiments, pre-sort PBMCS were additionally stained for biotinylated followed by conjugation with Streptavidin PECy7 (BD Pharmingen, USA). A fixable dead cell marker (Life Technologies, USA) was used to distinguish between dead and live cells. Following exclusion for doublet and dead cells, cells for sorting were initially gated on the CD3+CD4+ population. Within CD4+ gates, cells were then gated on CD127 and CD25 to identify and isolate CD25hiCD127lo (Tregs) and CD25−CD127+ (Teff) population, respectively. Additionally, further gating on TNFR2 was performed to isolate Treg TNFR2+ and Tregs TNFR2− subsets. Prior to culture, purity was assessed on post-sort Tregs and were confirmed to be 95 ± 3% FoxP3+ by flow cytometry. Samples containing the sorted populations were then suspended at a ratio of 105 cells per 50 µl of complete AIM V media and were cultured in either complete AIM V media alone or in cell-free ascites for 48 h. The cells were then incubated in a humidified incubator at 37°C with 5% CO2. After 48 h, the cells were harvested, antibody labeled to assess phenotype, and then analyzed by flow cytometry.
In Vitro Suppression Assay
To determine the difference in ratio at which Tregs incubated in ascites are suppressive compared Tregs incubated in media, add-back suppression assays were performed. Following in vitro conditioning of PBMCS in either complete AIM V media or ascites for 48 h, the cells were washed, harvested, and labeled with anti-CD3 PerCP (BD Pharmingen, USA), anti-CD4 APC-Cy7 (BD Pharmingen, USA), anti-CD127 BV650 (Biolegend, USA), and anti-CD25 PECF584 (BD Pharmingen, USA). Following primary staining, a fixable dead cell marker (Life Technologies, USA) was used to distinguish between dead and live cells. The cultured cells underwent cell sorting as described in Section “Cell Sorting and Culture.” Three populations consisting of Teff incubated in media, Tregs incubated in media, and Tregs incubated in ascites were isolated. Teff were further labeled with Carboxyfluorescein Diacetate Succinimidyl Ester (CSFE) (Molecular Probes, US) at 0.5 µM to monitor cell proliferation. The labeled effector cells were cultured alone, or at a 1:2, 1:4, or 1:8 and 1:16 ratio with autologous Tregs already conditioned in either complete AIM V media or ascites. The cells were cultured (usually in triplicates) in a 96-well plate pre-coated with anti-CD3 (1.0 µg/ml clone OKT3, Biolegend). This was followed by the addition of soluble anti-CD28 (1.0 µg/ml clone CD28.2, BD Pharmingen) for 3 days at 37°C with 5% CO2. Cells were harvested, stained, and further analyzed by flow cytometry.
Multiplexed Bead-Based Immunoassay
Cell-free ascites were collected from 18 patients with advanced EOC and soluble biomarkers were quantified using BD™ Cytokine cytometric bead arrays (flex sets for IL-10, IFN-γ, IL-2, IL-6, TNF, TGF-β, and sTNFR2, BD USA), following manufacturer’s protocol. Ascites supernatants were used at 1 in 4 and 1 in 8 dilution. Ascites samples were analyzed in duplicates and results were calculated as the average of two values. Samples were then acquired by flow cytometry on a Becton Dickinson LSR II flow cytometer collecting 300 events per analyte. Flow cytometry standard data files were exported and was analyzed by FCAP Array software version 3.0.
For simultaneous measurement of multiple cytokines in serum, multiplex magnetic bead immunoassay kits were used as per manufacturer’s protocol (Invitrogen). Human cytokine 25-Plex panel was used to determine quantitative measurement for IL-10, IFN-γ, IL-2, IL-6, and TNF in study serum. sTNFRII and TGF-β were analyzed separately using singleplex bead kits. The serum samples were randomly assigned to the plates to avoid assay bias and to determine inter-assay differences. Five ascites samples which were quantified using cytometric bead array were also analyzed to determine limits of agreement. All samples were analyzed in duplicate and results were calculated as the average of two values. The samples were analyzed using a Luminex® 200™ analyser (Luminex Corp.) as per standard protocol. Data were analyzed using a five-parametric-curve fitting within the manufacturer’s software.
Assessment of ascites and serum samples were on different platform as the samples were from part of a larger trial samples, where the respective platforms were used for cytokine assessment. The platforms were chosen based on the cytokines being analyzed. We formally compared the same samples run across both platforms to provide cross validation of the two using Bland–Altman method comparison study observed mean differences of estimated bias 2.04 ± 9.05 between two tests, and the 95% limits of agreement were between −15.7 and 19.8. Therefore, results from both the platforms were confirmed to be within good limits of agreement.
Statistical Analysis
Comparison of two groups of data were analyzed by Wilcoxon matched-paired t-test, while three-group data were analyzed with one-way ANOVA with Dunn’s multiple comparison test (post hoc). Pearsons’ correlations were employed for correlation analyses. p < 0.05 was significant. Data were always shown as mean ± SEM. Statistical analyses were performed using Graphpad prism 7.0.
Results
Culturing PBMCs in Cell-Free Ovarian Cancer Malignant Ascites Increases TNFR2+ Expression on T Cell Subsets
To quantify potential general changes in cell population frequencies in response to ovarian cancer ascites, we isolated peripheral mononuclear cells (PBMCs) from healthy donors (n = 30) and incubated them in vitro in AIM V media or cell-free ascites from advanced EOC patients, followed by cell staining and analysis by flow cytometry. T-lymphocytes were identified using an anti-CD3 antibody, a pan T-cell marker. The percentages of CD4+ and CD8+ T cells were unchanged following incubation of PBMCs in ascites (Figures 1A–B). Within the CD4+ gate, Tregs were further identified as CD25hiFoxP3+, while effector T cells (Teff) were identified as CD25−FoxP3− (Figure 1C). CD25hiFoxp3+ cells gated using this strategy were further confirmed to be CD127lo (Figure S1 in Supplementary Material). Malignant ascites compared to media induced higher frequencies of Tregs (Figure 1D) and conversely decreased frequencies of Teff (Figure 1E). As Treg-related cell markers can be expressed on non-Treg cells upon cell stimulation including transient expression of FoxP3 (76), we used purified Tregs to confirm that the phenotype of CD25hiFoxP3+ observed in ascites cultures identifies functional suppressors. We purified Tregs from PBMCs of two healthy donors (already conditioned in media or ascites for 48 h) by using flow cytometry cell sorting. Following gating on CD3+CD4+ lymphocyte population, Tregs were then sorted as CD25hiCD127lo and Teff as CD25−CD127+ T cells (Figure 1F). The purity of post-sort Tregs were confirmed to be 95 ± 3% FoxP3+ by flow cytometry. We performed a suppression assay using these purified Tregs conditioned in ascites, to formally determine their ability to suppress autologous effector T cells compared to media. Purified CD4+CD25− effector T cells were labeled with CSFE to monitor cell proliferation and were cultured alone (without Tregs) or at a 1:2, 1:4, or 1:8 and 1:16 ratio with autologous Tregs (pre-conditioned in either AIM V media or ascites for 48 h) in a 96-well plate with mAb stimulants anti-CD3 and soluble anti-CD28 for 3 days. As shown in Figure 1G, both media and ascites culture derived Tregs suppressed proliferation of Teffs. Moreover, on a cell-for-cell basis Tregs cultured in ascites showed higher suppressive capacity on autologous Teffs compared to Tregs conditioned in media (Figure 1G). The above result confirmed that malignant ascites caused increases in functional Tregs.
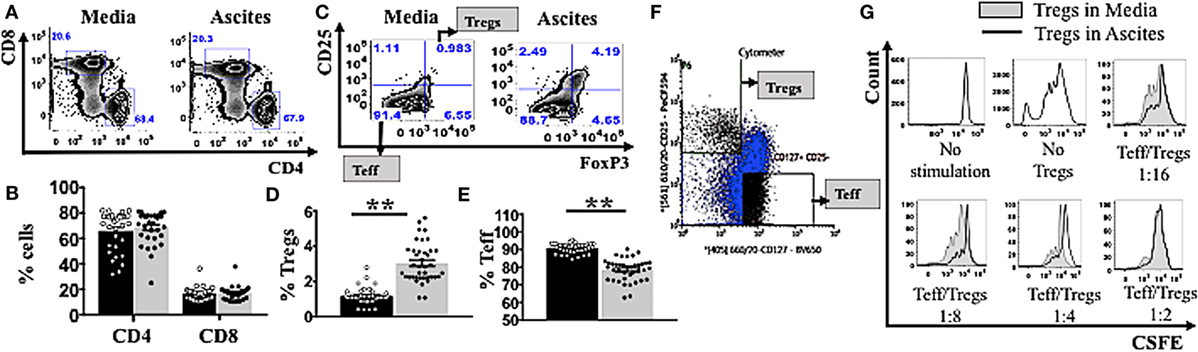
Figure 1. Ascites increases frequency of functional regulatory T cells (Tregs). (A–E) Peripheral blood mononuclear cells (PBMCs) from healthy donors (n = 30) were isolated by Ficoll density centrifugation and incubated in vitro in either AIM V media or cell-free ascites from advanced epithelial ovarian cancer patients for 48 h. Cells were washed, stained with anti-CD3, CD4, CD8, CD25, tumor necrosis factor receptor 2 (TNFR2), and FoxP3, and analyzed with flow cytometry. (F,G) PBMCs from two healthy donors were isolated by Ficoll density centrifugation. Cells were labelled anti-CD3, anti-CD4, anti-CD25, and anti-CD127, and flow cytometric cell sorting was performed. (A) Flow cytometry plots of CD4+ and CD8+ T cells within CD3+ T cells incubated in media and ascites. (B) The frequency (%) of CD4+ and CD8+ T cells within media (black bar) and ascites (gray bar) (n = 30). (C) Tregs were identified as CD25hiFoxP3+ and effector T cells (Teff) were identified as CD25+FoxP3+ within CD4+ T cells. Flow cytometry plots of Tregs and Teff cells within CD4+ T cells incubated in media and ascites. (D,E) The frequency (%) of Tregs (D) and Teff (E) within media (black bar) and ascites (gray bar) (n = 30). (F) Tregs and Teff were identified by gating on CD3+CD4+ population, followed by CD127 and CD25 to identify CD25hiCDl27lo and CD25−CD127+ T cells respectively (n = 2). (G) Prior to suppression assay, Teff were labelled with carboxyfluorescein diacetate succinimidyl ester (CSFE) and incubated in media, while Tregs were cultured in either complete AIM V media or in cell-free ascites for 48 h (n = 2). Cells were then harvested and washed. The labelled effector cells were cultured either alone or at a 1:2, 1:4, 1:8, and 1:16 ratio with autologous pre-conditioned Tregs in a 96-well plate with anti-CD3/CD28 for 3 days. Cells were washed, stained, and analyzed by flow cytometry. Proliferation of Teff by Tregs incubated in ascites (black line) compared to Tregs incubated in media (gray line and shaded), cultured alone (no Tregs) or in co-culture with several ratios of Teff to Tregs. *p < 0.05 and **p < 0.0001, Wilcoxon matched-pair t-test. Data from PBMCs were pooled from three independent experiments (error bars-SEM), while data of sorted cells are replicates of two donors.
We next investigated whether culturing in ascites also influenced changes in the phenotypes of Tregs and Teffs. We incubated PBMCs from healthy donors (n = 30) in AIM V media or cell-free malignant ascites, followed by cell staining and analysis by flow cytometry. We found that culture with ascites strongly upregulated TNFR2 expression on both CD4+ and CD8+ T cell subsets (Figure 2A), resulting in a higher proportion (%) of TNFR2+ CD4 and CD8 T cells (Figure 2A). Additionally, stimulation with malignant ascites significantly upregulated the median fluorescence intensity of TNFR2 on Tregs as well as the frequency of TNFR2+ Tregs (Figure 2F) (p < 0.05). This effect was also found consistently in 18 separate EOC patient derived ascites affecting PBMCs from a single healthy volunteer (Figure 2F) or a single cell-free ascites affecting PBMCs from 30 healthy volunteers (data not shown). We also used purified Tregs and Teff from healthy donors (n = 2) and cultured them in a similar in vitro system. We observed similar increased in TNFR2 expression on these purified T cell subsets, particularly Tregs (Figures 2B,C). Although ascites decreased the frequency of Teff (Figure 1E), ascites significantly increased the frequency of TNFR2+ Teffs, as well as the level of expression of TNFR2 on the effectors (Figures 2D–F). However, the fold change in TNFR2 expression in ascites compared to media was significantly lower for Teffs compared to Tregs (1.97 ± 0.37 vs 3.37 ± 0.48, p < 0.001) resulting in a significantly increased ratio of TNFR2+ Treg/Teff (1.14 ± 0.21 vs 1.98 ± 0.32, p < 0.0001) (Figure 2F). Together the above data demonstrate conditioning in ascites promotes higher expression of TNFR2 on Tregs and Teffs.
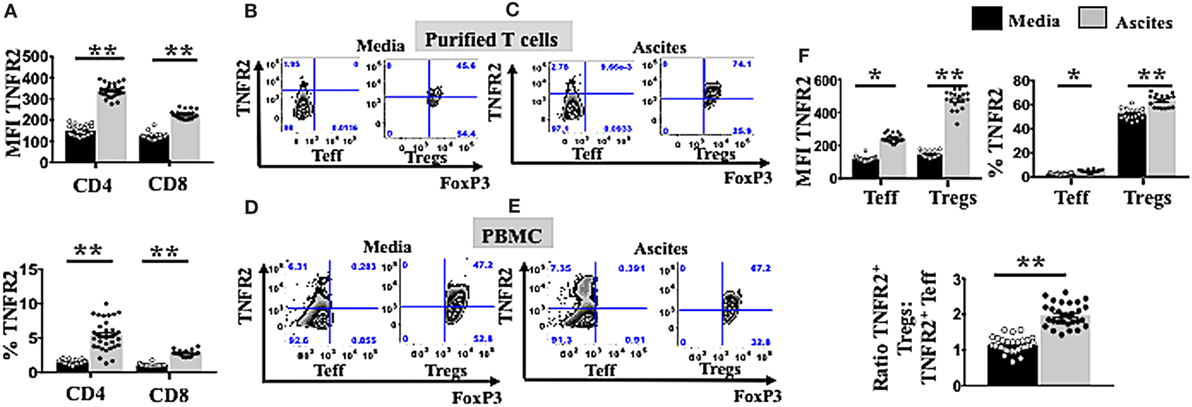
Figure 2. Ascites upregulates tumor necrosis factor receptor 2 (TNFR2) expression on both T effector (Teff) and regulatory T cells (Tregs). (A) Peripheral blood mononuclear cells (PBMCs) from healthy donors (n = 30) were isolated by Ficoll density centrifugation and incubated in vitro in either AIM V media or cell-free ascites from advanced epithelial ovarian cancer (EOC) patients for 48 h. Cells were washed, stained with anti-CD3, CD4, and CD8 and TNFR2 and analyzed with flow cytomcery (A). The level of TNFR2 expression (median fluorescence intensity, MFI) and frequency (%) of TNFR2 within CD4+ and CD8+ T cells in media (black bar) and ascites (gray bar) (n = 30) (B,C). PBMCs from two healthy donors were isolated by Ficoll density centrifugation. Cells were labelled anti-CD3, anti-CD4, anti-CD25, and anti-CD127 and flow cytometric cell sorting for Tregs and Teff was performed. Isolated Tregs and Teff were cultured in either complete AIM V media or in cell-free ascites for 48 h. Cells were then washed and labeled for surface markers with CD3, CD4, CD25, and TNFR2 followed by intracellular staining for FoxP3 and prepared for flow cytometric analysis (B,C). Representative flow cytometry expression of TNFR2 and FoxP3 on sorted Tregs and Teff cells as well incubated in media (B) and ascites (C). (D–F) PBMCs from a single healthy donor were incubated in vitro for 48 h in either AIM V media or cell-free ascites from 18 patients with advanced EOC (n = 18). Cells were washed, stained with CD3, CD4, CD25, TNFR2, and FoxP3, and analyzed with flow cytometry. (D,E) Expression of TNFR2 and FoxP3 was analyzed with flow cytometry by gating on Tregs and Teff cells derived from PBMCs incubated in media and ascites. (F) The level of TNFR2 expression (MFI) within Teff and Tregs and percentages (%) of TNFR2+ Teff and Tregs and the ratio of TNFR2+ Tregs to TNFR2+ Teff in media and ascites (n = 18). *p < 0.05 and **p < 0.0001, Wilcoxon matched-pair t-test. Data from PBMCs were pooled from three independent experiments (error bars-SEM), while data of sorted cells are replicates of two donors.
TNFR2+ Tregs Conditioned in Malignant Ascites Express Higher Levels of Immunosuppressive Molecules PD-L1, CTLA-4, and GARP and Are Negatively Correlated with Total and TNFR2+ Teff Activity
TNFR2+ Tregs have been demonstrated to be more suppressive compared to TNFR2− Tregs in various diseases including chronic inflammatory conditions (16–19). Highly suppressive Tregs usually express elevated levels of functional immunosuppressive molecules CTLA-4, GARP (13, 18, 19), and PD-L1 (34). We explored whether ascites could further induce other immunosuppressive molecules on TNFR2+ and TNFR2− Tregs. We used purified Tregs TNFR2+ and Tregs TNFR2− subsets isolated from PBMC of healthy donors (n = 2) by flow cytometric cell sorting. These purified Treg subsets were initially identified by gating on CD3+CD4+ for lymphocytes population and followed by CD25hiCD127lo (Figure 3A). Two subsets of Tregs were then derived by sorting on TNFR2+ and TNFR2− population. Following incubation in either AIM V media or cell-free ascites of an advanced EOC patient for 48 h, purified Tregs were stained for surface markers with CD3, CD4, CD25, PD-L1, CTLA-4, GARP followed by intracellular staining for FoxP3 and prepared for flow cytometric analysis. This exploratory data using purified Treg subsets suggested that TNFR2+ Tregs conditioned in ascites had increased expression of immunosuppressive molecules, including PD-L1, CTLA-4, and GARP when compared to TNFR2+ Tregs in media as well as when compared to TNFR2− Tregs (Figure 3B).
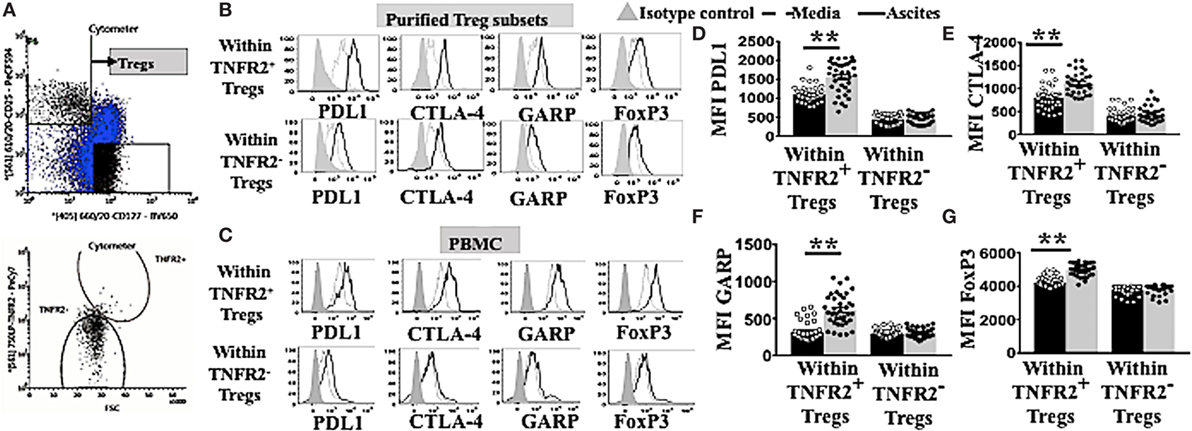
Figure 3. TNFR2+ regulatory T cells (Tregs) conditioned in ascites expressed higher levels of functional immunosuppressive molecules, such as programmed cell death ligand-1 (PD-L1), CTLA-4, and GARP. (A) Peripheral blood mononuclear cells (PBMCs) from two healthy donors were isolated by Ficoll density centrifugation and labelled with anti-CD3, CD4, CD25. CD127 and tumor necrosis factor receptor 2 (TNFR2) and flow cytometric cell sorting was performed. (A) Tregs were identified by gating on CD3* CD4* population, followed by CD127 and CD25 to identity CD25hi CD127lo. Two populations of Tregs were sorted by gating on TNFR2+ and TNFR2−. Isolated Tregs subsets were cultured in either complete AIM V media or in cell-free ascites for 48 h. Cells were washed and labeled with anti-CD3, CD4. CD25, PD-L1, CTLA-4. GARP and FoxP3 and prepared for flow cytometric analysis. (C–G) PBMCs from healthy donors (n = 30) were incubated in either AIM V media or ascites supernatant from an advanced epithelial ovarian cancer patient for 48 h. Cells were washed, stained for anti-CD3, CD4, CD25, TNFR2. PD-L1, CTLA-4, GARP, and FoxP3, and prepared for flow cytometric analysis. (C,B) Expression of PD-LI, CTLA-4, GARP, and FoxP3 expression were analyzed in sorted TNFR2+ Tregs and TNFR2− Tregs, (B) and in Tregs from PBMCs by gating on Tregs TNFR2+ and Tregs TNFR2− cells incubated in media (dashed line) and ascites (solid line). The shaded histogram represents staining with an isotype control. (D–G) The level of expression (in MFI) PD-L1, CTLA-4, GARP, and FoxP3 within Tregs TNFR2+ and Tregs TNFR2− cells incubated in media (black bar) and ascites (gray bar) (n = 30). *p < 0.05 and **p < 0.0001, Wilcoxon matched-pair t-test. Data using PBMCs were pooled from three independent experiments (error bars-SEM), while data of sorted cells are replicates of two donors.
We, therefore, performed an experiment to determine if this upregulation pattern would also be reproducibly found when using PBMC. We incubated PBMCs from healthy donors (n = 30) in either AIM V media or ascites supernatant of an advanced EOC patient for 48 h followed by cell labeling with anti-CD3, CD4, CD25, TNFR2, PD-L1, CTLA-4, GARP, and FoxP3 and subsequent flow cytometric analysis. TNFR2+ Tregs conditioned in malignant ascites showed significantly higher levels of expression of PD-L1 (1,550 ± 66.0 vs 1,103 ± 34. 2, p < 0.0001), CTLA-4 (1,116 ± 36.6 vs 795 ± 39.5, p < 0.0001), and GARP (612.5 ± 34.0 vs 315.7 ± 20.9, p < 0.0001) compared to media (Figure 3C). Moreover, within PBMCs conditioned in ascites, TNFR2+ Tregs expressed higher levels of immunosuppressive molecules compared to TNFR2− Tregs, including PD-L1 (1,898 ± 59.9 vs 689 ± 29.5, p < 0.0001), CTLA-4 (1,082 ± 32.6 vs 465.5 ± 37.8, p < 0.0001), and GARP (544.3 ± 35.3 vs 308.8 ± 10.2, p < 0.0001) (Figures 3C–F). These differences were likely to be driven by significantly higher expression of FoxP3 on TNFR2+ Tregs conditioned in ascites than media (5,048 ± 48.4 vs 4,238 ± 56.5, p < 0.0001), and in TNFR2+ compared to TNFR2− Tregs within ascites conditioned cells (Figures 3C,G) (5,048 ± 48.4 vs 3,842 ± 32.0, p < 0.0001). The above data support a more potent immunosuppressive regulatory phenotype for TNFR2+ Tregs conditioned in ascites as compared to media, as well as for TNFR2+ compared to TNFR2− Treg induced by culturing PBMCs in ascites.
The latter hypothesis was specifically tested by determining the capacity of the ascites induced TNFR2+ Tregs to be associated with decreased CD4 effector T cell function. PBMCs from healthy donors (n = 30) were incubated in either AIM V media or cell-free malignant ascites in two plates in parallel. One plate remained unstimulated to assess the proportion of T cell subsets, while another plate underwent PMA and ionomycin stimulation to detect intracellular cytokine production. As expected, Tregs were induced at a higher frequency by ascites compared to media in unstimulated PBMCs cultures with ascites, and this increase in Tregs (fold change) (media or ascites cultured) was inversely correlated with the ability of Teff to produce IFN-γ (Figure 4A). Moreover, only increases TNFR2+ Tregs (Figure 4B), but not TNFR2− Tregs (Figure 4C) were inversely correlated with effector CD4 T cell function. Given we found ascites also increased TNFR2+ Teffs, and these cells are reported as hyperactive cytokine producers (77), we tested whether conventional Tregs would be able to suppress their cytokine production. Figure 4D shows that there was no inverse relationship between conventional Tregs increases and TNFR2+ Teff IFN-γ production, showing they could not suppress this effector T cell subset. Previous studies by Chen and colleagues have suggested only TNFR2+ Tregs can suppress TNFR2+ T cell effectors (78). Consistent with these studies the fold change of TNFR2+ Tregs (Figure 4E), but not TNFR2− Tregs (Figure 4F) was strongly inversely correlated with the ability of TNFR2+ Teffs to produce IFN-γ. We next determined whether the proportion of Tregs, TNFR2+ Tregs, and TNFR2− Tregs correlated with the total production of IFN-γ within CD4+ T cells to ensure that the inverse correlation seen is not influenced by reciprocal gating for Teff and Tregs subpopulations following incubation in ascites. There was inverse correlation between total IFN-γ within CD4+ T cells to Tregs and TNFR2+ Tregs, but not TNFR2− Tregs. There was also increase in the fold change of IFN-γ producing CD4+TNFR2+ T cells which inversely correlated to Tregs as well as TNFR2+ Tregs but not TNFR2− Tregs (Figure S2 in Supplementary Material). Similar correlation patterns were also observed when the level of IFN-γ expression measured by mean fluorescence intensity (MFI) was used instead of proportion of IFN-y+ T cells (data not shown). We also looked at whether CD8 T cell function was affected by the induced TNFR2+ Tregs. There was no inverse correlation between conventional Tregs or TNFR2+ Tregs with the ability of CD8 to produce IFN-γ (data not shown).
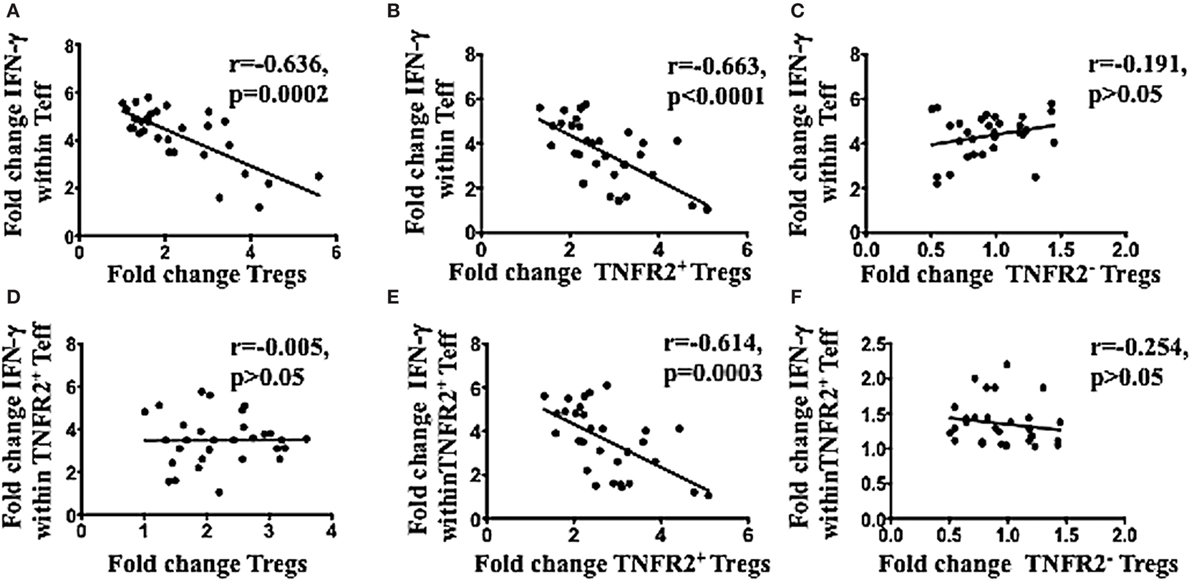
Figure 4. TNFR2+ regulatory T cells (Tregs) conditioned in ascites, compared to media had a higher frequency and were inversely correlated with IFN-γ production by effector T cells in the same donor. Peripheral blood mononuclear cells from healthy donors from three independent experiments (n = 30) were incubated in either AIM V media or ascites supernatant of an advanced epithelial ovarian cancer patient for 48 h in two plates simultaneously. One of plate was left unstimulated for quantification of T cell subsets, while another plate was incubated with PMA and ionomycin for the last 6 h, and Brefeldin A was added at 1 μg/ml for the last 5 h of incubation, to detect intracellular cytokine production. Cells were washed, labeled for surface markers CD3, CD4, CD25. Tumor necrosis factor receptor 2 (TNFR2) followed by intracellular staining for FoxP3 and IFN-gamma (IFN-γ) and then prepared for flow cytometric analysis. (A–C) Correlation of the fold change in Tregs (A). TNFR2+ Tregs (B), and TNFR2– Tregs (C), following conditioning in ascites with the fold change in IFN-γ production by T effector (Teff) respectively. (D–F) Correlation of the fold change in Tregs (D), TNFR2+ Tregs (E), and TNFR2– Tregs (F) conditioned in ascites with the fold change in IFN-γ production by TNFR2+ Teff respectively. p > 0.05 is not significant.
Higher Levels of Immunosuppressive (sTNFR2, IL-10, and TGF-β) and Pro-inflammatory Cytokines (IL-6 and TNF) Are Present in Malignant Ascites Compared to Serum of Advanced Ovarian Cancer Patients
We next determined the pro-inflammatory soluble factors present in malignant ascites that may promote TNFR2+ Tregs. Ascites and respective peripheral blood serum were collected from 18 patients with ovarian cancer. The mean age at the time of cytoreductive surgery was 60.2 ± 7.82 years (range 49–78 years). All patients had advanced disease including 16 patients with Stage III (88.8%) and 2 patients (11.2%) with Stage IV disease. Specimens were collected prior to surgery and before chemotherapy. Final pathology was consistent with high-grade (poorly differentiated) serous type ovarian cancer. We performed multiplexed bead-based immunoassay on cell-free pre-treatment ascites and on respective sera of all 18 patients. Ascites specimen demonstrated a significant elevated level of immunosuppressive (sTNFR2, IL-10 and TGF-β) and pro-inflammatory cytokines (IL-6 and TNF) compared to respective serum (Figure 5). TNFR2 expression has been shown to be induced by either TNF (15, 79) or TNF in combination with IL-6 in cancer cell lines (20). We next explored whether blockade of either of these soluble factors would influence overall Treg induction by malignant ascites, as well as TNFR2 expression.
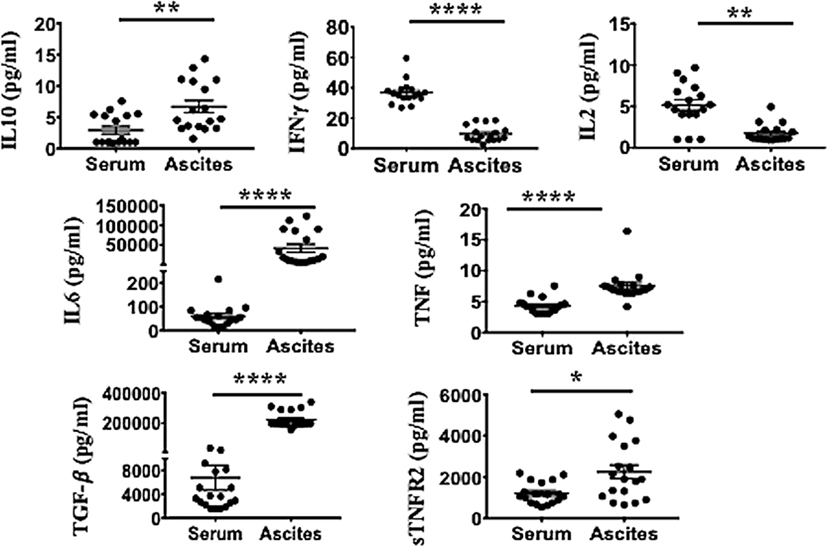
Figure 5. Ascites of epithelial ovarian cancer (EOC) patients contain higher levels of immunosuppressive (sTNFR2, IL-10 and TGF-β) and pro-inflammatory cytokines [interleukin 6 (IL-6) and TNF], but lower levels of IFN-γ compared to their respective serum. Cell-free ascites and corresponding peripheral blood serum were collected from 18 patients with advanced EOC and soluble biomarkers including IL-10, IFN-γ, IL-2, IL-6, TNF, TGF-β, and sTNFR2 quantified using multiplexed bead-based immunoassay. *p < 0.05, **p = 0.001–0.01, ***p = 0.0001–0.001, ***p < 0.0001, Wilcoxon matched-paired t-test (error bars-SEM).
TNFR2+ Tregs Are Decreased in Frequency and in their Suppressive Phenotype following Blockade of IL-6 in Ascites
Following conditioning of PBMCs from healthy donors in malignant cell-free ascites for 48 h, soluble factors IL-6 and TNF within the ascites were blocked with neutralizing mAb against IL-6 or TNF. Mouse IgG1 immunoglobulins (isotype control) (R&D USA) were used as a negative control. Cells were washed, stained, and analyzed using flow cytometry. The overall fraction of CD4+ and CD8+ T cells following conditioning in ascites and blockade with either IL-6 or TNF mAbs showed no significant differences compared to isotype control (Figures 6A,B). By contrast, within CD4 T cells, there was a clear increase in Teff and decrease in Tregs following blockade of IL-6 within ascites compared to isotype control (Figures 6C,D). The ratio of Teff to Tregs was, therefore, greatly increased following blockade of IL-6 within ascites (Figure 6E). These effects were not observed following blockade of TNF within ascites. Moreover, blockade of bioactive IL-6 in ascites, but not TNF, also decreased the level of TNFR2 expression in both CD4+ and CD8+ T cells (Figures 6F,G) as well as Teff and Tregs (Figures 6H,I), with the most prominent effect found on Tregs, overall increasing the ratio of TNFR2+ Teffs to TNFR2+ Tregs (Figure 6J). Following the blockade of bioactive IL-6 within ascites with monoclonal antibody, the level of expression of PD-L1 (1,550 ± 66.0 vs 803 ± 104.8, p < 0.0001), CTLA-4 (1,116 ± 36.6 vs 203.2 ± 42.0, p < 0.0001), and GARP (612.5 ± 34.0 vs 58.0 ± 32.8, p < 0.0001) decreased within TNFR2+ Tregs conditioned in ascites compared to media (Figure 6K). The expression of FoxP3 on TNFR2+ Tregs following blockade of IL-6 was decreased compared to TNFR2+ Tregs within ascites conditioned cells (Figure 6K). The above data support an active role of IL-6 within ascites on promoting TNFR2 expression on Tregs.
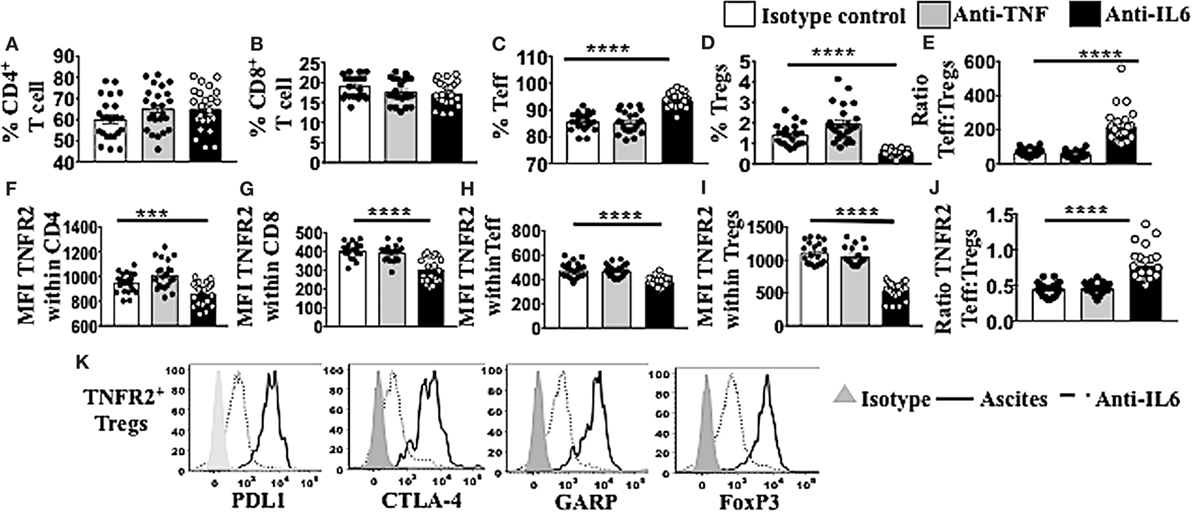
Figure 6. Blockade of bioctive interleukin 6 (IL-6), but not TNF, within ascites of epithelial ovarian cancer (EOC) patients decreases percentage of regulatory T cells (Tregs) as well as TNFR2+ Tregs, as well as tumor necrosis factor receptor 2 (TNFR2) expression. Peripheral blood mononuclear cells (PBMCs) from healthy donors (n = 30) were isolated by Ficoll density centrifugation and incubated in vitro in either AIM V media or cell-free ascites from advanced EOC patients for 48 h. IL-6 and tumor necrosis factor (TNF) within the ascites were blocked with mouse anti-human IL-6 monoclonal antibody (mAb) at 2.5 μg/ml and mouse anti-human TNF at 500 ng/ml. Mouse IgG1 immunoglobulins (isotype control) were used as a negative control. Cells were washed, labeled for surface and intracellular markers CD3, CD4, CD8, CD25, TNFR2, programmed cell death ligand-1 (PD-L1), CTLA-4, GARP, and FoxP3, and analyzed with flow cytometry. (A–E) The frequency (%) of CD4, CD8, T effector (Teff), and Treg (A–D) and the ratio of Teff to Tregs (E) within ascites following blockade with IL-6 (black bar) or TNF (gray bar). (F–J) The level of TNFR2 expression (median fluorescence intensity, MFI) within CD4, CD8, Teff, and Tregs (F–I) and ratio of TNFR2 expressing Teff to Tregs (J) in ascites following IL-6 or TNF blockade. (K) PD-L1, CTLA-4, GARP, and FoxP3 expression on TNFR2+ Tregs cells incubated in ascites (solid line) and following blockade with IL-6 mAb (dashed line). The shaded (gray) histogram represents staining with an isotype control. *p < 0.05, **p = 0.001–0.01, ***p = 0.0001–0.001, ****p < 0.0001, One-way ANOVA and Dunn’s multiple comparison test (post hoc). Data are pooled from three independent experiments (error bars-SEM).
Discussion
The present study shows for the first time that culture with ovarian cancer-associated malignant ascites promotes increased frequencies of T cells expressing high levels of TNFR2. Moreover, it shows a critical role for IL-6 in promoting TNFR2 expression on T cells, and particularly on Tregs. These findings could provide a mechanistic link between IL-6 and Tregs, where both have been independently associated with disease progression, for example in breast, lung, renal, and colorectal cancer (80–83). These results also suggest that IL-6 blocking therapy may have additional beneficial therapeutic effects (62). Specifically, and similarly to our in vitro studies, it may preferentially decrease TNFR2+ expressing Tregs, leading to an increase in IFN-γ production by Teffs. This is particularly important in the case of TNFR2+ Teffs, since our studies show that, similarly to what has been demonstrated in autoimmunity (84), that these cells may only be suppressed by TNFR2+ Tregs within ovarian cancer ascites.
The high levels of TNFR2+ Tregs within patient ascites have been suggested to be the consequence of preferential migration of TNFR2+CCR4+ Tregs into ascites (9, 18). Herein, we show for the first time that a higher fraction of TNFR2+ expressing T cell subsets, particularly on CD4+CD25hiFoxP3+ (Tregs) can also be induced de novo from healthy donor PBMCs conditioned with cell-free ovarian cancer ascites. In addition, the increase in TNFR2 expression also demonstrated on purified Treg subsets cultured in ascites, further suggests the direct induction of TNFR2 by soluble factors in the ascites in the absence of other immune cells. The ovarian cancer ascites used in our study from patients in advanced disease stages showed a mixture and levels of soluble factors similar to previous studies (11, 18, 85, 86), with a predominance toward Th2 vs Th1 type cytokines, and high levels of IL-6 and TNF compared to serum. We have consistently observed similar effects across 18 different ovarian cancer ascites and on cells derived from different human volunteers, confirming the robustness of this effect.
In addition to being induced at high frequencies by ovarian cancer ascites, TNFR2+ Tregs were also potent suppressors when compared to the TNFR2− T cell fraction, which was in agreement with previous studies (13, 18). The higher frequency of TNFR2+ Tregs induced from malignant ascites was inversely correlated with IFN-γ production by effector T cells in our study. TNFR2+ Tregs conditioned in ovarian cancer ascites, compared to media, also expressed higher levels of functional immunosuppressive molecules such as PD-L1, CTLA-4, and GARP. These differences were likely to be driven by the significantly higher expression of FoxP3 on TNFR2+ Tregs compared to TNFR2− Tregs within ascites conditioned cells. Our observation that only TNFR2+ Tregs suppress TNFR2+ Teff in these cultures is highly likely to be mediated by the higher levels of these immunosuppressive molecules. Future studies may be able to distinguish the relative contribution of each one of these molecules on their ability to suppress TNFR2+ effectors. The present study shows that the high levels of CTLA-4 and GARP, previously shown to be present on Tregs derived from human cancer ascites (18), may be directly induced by soluble factors within this ascites, and specifically IL-6. Moreover, PD-L1 expression is also upregulated by ovarian cancer ascites. Recent human trials have demonstrated promising antitumor efficacy for immunosuppressive checkpoint inhibitors in several cancer types (35–37); however, their role as ovarian cancer therapeutics is still not well-established. As blockade of bioactive IL-6 within ascites decreased TNFR2 expression on Tregs, IL-6 may potentially play a combined role with other pro-inflammatory cytokines such as TNF, as seen in past studies (38), to help decrease immunosuppressive molecules such as CTLA-4, GARP, and PD-L1.
Tumor necrosis factor receptor 2 expression can also be induced on Teff by soluble factors within the tumor microenvironment or by TCR stimulation according to Chen (78), and this was also observed in our study. The expression of TNFR2 on Teffs rendered these cells resistant to suppression by Tregs, whereas TNFR2-expressing Teff were highly proliferative, secreted high levels of effector cytokines (IFN-γ), and were more resistant to Treg-mediated inhibition (78). This was also demonstrated in our study where TNFR2+ effector T cells were resistant to suppression by TNFR2− Tregs, but susceptible to inhibition by TNFR2+ Tregs.
Tumor necrosis factor and IL-6 are pleiotropic pro-inflammatory cytokines that modulate growth, differentiation, and proliferation of various types of cells. Both these cytokines, secreted by cancer cells as well as immune cells, are also involved in the inflammation process and play a functional role in malignancy promotion and progression in various cancers including ovarian cancer (61, 63, 87–89). The present study shows a new critical role for IL-6 present in ascites in promoting TNFR2 expression on T cells, particularly Tregs. In contrast to previous studies, TNF did not appear to be similarly critical. The role of TNF and IL-6, independently or in combination, on TNFR2 expression on diverse cell types is controversial (20, 64, 79, 90). Addition of exogenous TNF, but not IL-6 or IL-1β, have been found to upregulate TNFR2 on murine Treg cells in vitro (64). TNF alone has no effect on TNFR2 expression on human colon cancer cell lines in vitro; however, the combination of IL-6 and TNF can upregulate TNFR2 on such cells (90). In the same study, the regulation of TNFR2 by IL-6 was confirmed using an in vivo murine model. The lack of IL-6 in TCR/IL-6 KO double mutant (IL-6 DKO) mice resulted in markedly reduced TNFR2 expression in colonic epithelial cells compared with TCR KO mice, even in the presence of mild colitis in both groups (90). It was, therefore, possible that, even if we could not detect direct effects for TNF, TNF would still potentiate TNFR2 induction by IL-6. However, we did not observe an enhancement of the decrease in TNFR2 expression by blockade of both IL-6 and TNF compared to IL-6 blockade alone (data not shown).
Tumor necrosis factor receptor 2 upregulation is associated with increased suppressive activity of Tregs. Chen and colleagues used purified T cell subsets from lymph nodes of C57/BL6 mice and performed a suppression assay by coculturing Tregs and Teff with exogenous TNF (10 ng/ml) and IL-2 (10 ng/ml) for up to 72 h. The authors found that prolonged exposure to TNF increased Treg suppressive activity, but shorter duration did not demonstrate this effect (64). We did not find a prominent role for TNF in our study, most likely given we used different methods (ascites vs pure cytokines), species (murine vs human), measurements (TNFR2 expression vs suppression add-back assays), and timepoints (48 vs 72 h). Ascites may contain other soluble factors such as TGF-β that may synergize with IL-6 to promote TNFR2 expression. TGF-β has been suggested to play a role in the generation and expansion and stability of Tregs (91). The exploration of the influence of these cytokines in promoting TNFR2 expression is worthwhile, but beyond the scope of this paper. Preliminary results suggest TGF-β may not play a substantial role in the upregulation of TNFR2 on Tregs (manuscript in preparation). In the present paper, we found that blockade of the elevated IL-6 level within ascites, but not TNF, decreased TNFR2 expression, particularly on Tregs.
Therefore, the findings from this study suggest IL-6 may play an active role in promoting early TNFR2 upregulation, which may in turn enable these Tregs to respond to TNF. The nature of our short term cultures (we do not add IL-2 or other factors which may extend cell survival) does not allow us to test this hypothesis directly. However, taking together with the findings from a previous study (64) and the present data, we propose IL-6 may promote early activation of TNFR2 expression on Tregs, while TNF may be responsible for long term maintenance of TNFR2 expression and Tregs suppressive activity. Consistent with this hypothesis, Mizoguchi and colleagues have observed in their in vitro system using colonic epithelial cells from murine colitis model that while TNFR2 upregulation is seen on day 8, upregulation of IL-6/STAT3 is observed earlier by day 4, indicating that the IL-6/STAT3 signaling cascade is activated before upregulation of TNFR2 expression (90). Another recent study looking at human colon cancer cell lines (20), confirmed the critical role for the IL-6/STAT3 pathway in enabling TNFR2 upregulation (20, 90).
Future studies could also address the influence of IL-6 on different subsets of TNFR2 expressing effector T cells. Previous studies have shown that TNFR2+ effectors were capable upon anti-CD3 and anti-CD28 stimulation of producing a range of cytokines including IFN-y, IL-2 and IL-10 (77, 78). It would be particularly interesting to study the effect of IL-6 on cytokine producing Th17 cells given literature suggesting that Th17 plays an important role in the pathogenesis of diverse group of autoimmune diseases as well inflammatory diseases and cancers, including ovarian cancer (92, 93).
The immune system is capable of effective antitumor responses against many cancers including ovarian cancer. As ovarian cancer has been identified as an immunogenic tumor, immunotherapy should be optimized to be included as part of ovarian cancer therapeutics. Our study demonstrates that in ovarian cancer, TNFR2 expression can be selectively decreased on all T cells, and predominantly on Tregs, by blockade of bioactive IL-6 within ascites. Our findings support future research into two potential interactive immunotherapeutic targets, TNFR2+ Tregs and IL-6, to help enhance effective antitumor responses in patients with ovarian cancer.
Ethics Statement
This study was carried out in accordance with the recommendations of Immunity and Ovarian Cancer trial (Project 13/32), HREC of Royal Women’s Hospital with written informed consent from all patients. All patients gave written informed consent in accordance with the Declaration of Helsinki. The protocol was approved by HREC of the Royal Women’s Hospital, Melbourne.
Author Contributions
Concept and design: NK, MM, OM, MQ, and MP. Development of methodology: NK, MM, MQ, and MP. Acquisition of data (acquired and managed patients, provided facilities, etc.) and writing, review, and/or revision of the manuscript: NK, MM, OM, AS, MQ, and MP. Analysis and interpretation of data (e.g., statistical analysis, computational analysis): NK, MM, and MP. Administrative, technical, or material support (i.e., organizing data, constructing databases): NK, OM, AS, MQ, and MP. Study supervision: OM, MQ, and MP.
Conflict of Interest Statement
The authors declare that the research was conducted in the absence of any commercial or financial relationships that could be construed as a potential conflict of interest.
Acknowledgments
The authors thank Ms. Julene Hallo for collecting serum and ascites samples and the women who volunteered for this study for their generous participation. Special acknowledgment to Australian Red Cross Blood Services and their donors. The authors would also like to thank Margot Osinski and Claire Shallue for help in administrative support. The authors thank Sarah Peruzza, Kirsty Wilson, and Sue Xiang for their assistance in cell culture, flow cytometry, and multiplex bead-based immunoassay, as well as AMREP flow cytometry staffs Geza Paukovics, Eva Orlowski and Magdaline Costa for their assistance with cell sorting. NK is supported by Australian Monash International Postgraduate Research Scholarship as well as Universiti Kebangsaan Malaysia Postgraduate Scholarship Award and MP is a Senior NHMRC Fellow.
Funding
The work was partly supported by visionary donations from John Brunner and the Women’s Cancer Fund.
Supplementary Material
The Supplementary Material for this article can be found online at http://www.frontiersin.org/article/10.3389/fimmu.2017.01482/full#supplementary-material.
References
1. Malvezzi M, Carioli G, Rodriguez T, Negri E, La Vecchia C. Global trends and predictions in ovarian cancer mortality. Ann Oncol (2016) 27(11):2017–25. doi:10.1093/annonc/mdw306
2. Siegel RL, Miller KD, Jemal A. Cancer statistics, 2016. CA Cancer J Clin (2016) 66(1):7–30. doi:10.3322/caac.21332
3. Ahmed N, Stenvers KL. Getting to know ovarian cancer ascites: opportunities for targeted therapy-based translational research. Front Oncol (2013) 3:256. doi:10.3389/fonc.2013.00256
4. Kipps E, Tan DS, Kaye SB. Meeting the challenge of ascites in ovarian cancer: new avenues for therapy and research. Nat Rev Cancer (2013) 13(4):273. doi:10.1038/nrc3432
5. Jayson GC, Kohn EC, Kitchener HC, Ledermann JA. Ovarian cancer. Lancet (2014) 384(9951):1376–88. doi:10.1016/S0140-6736(13)62146-7
6. Xu X, Deng F, Lv M, Ren B, Guo W, Chen X. Ascites regression following neoadjuvant chemotherapy in prediction of treatment outcome among stage IIIc to IV high-grade serous ovarian cancer. J Ovarian Res (2016) 9(1):85. doi:10.1186/s13048-016-0294-z
7. Kim S, Kim B, Song YS. Ascites modulates cancer cell behavior, contributing to tumor heterogeneity in ovarian cancer. Cancer Sci (2016) 107(9):1173–8. doi:10.1111/cas.12987
8. Lane D, Matte I, Rancourt C, Piché A. The prosurvival activity of ascites against TRAIL is associated with a shorter disease-free interval in patients with ovarian cancer. J Ovarian Res (2010) 3(1):1. doi:10.1186/1757-2215-3-1
9. Curiel TJ, Coukos G, Zou L, Alvarez X, Cheng P, Mottram P, et al. Specific recruitment of regulatory T cells in ovarian carcinoma fosters immune privilege and predicts reduced survival. Nat Med (2004) 10(9):942–9. doi:10.1038/nm1093
10. Tan DS, Agarwal R, Kaye SB. Mechanisms of transcoelomic metastasis in ovarian cancer. Lancet Oncol (2006) 7(11):925–34. doi:10.1016/S1470-2045(06)70939-1
11. da Silva RF, Yoshida A, Cardozo DM, Jales RM, Paust S, Derchain S, et al. Natural killer cells response to IL-2 stimulation is distinct between ascites with the presence or absence of malignant cells in ovarian cancer patients. Int J Mol Sci (2017) 18(5):ii:E856. doi:10.3390/ijms18050856
12. Okubo Y, Mera T, Wang L, Faustman DL. Homogeneous expansion of human T-regulatory cells via tumor necrosis factor receptor 2. Sci Rep (2013) 3:3153. doi:10.1038/srep03153
13. Chen X, Subleski JJ, Kopf H, Howard OZ, Männel DN, Oppenheim JJ. Cutting edge: expression of TNFR2 defines a maximally suppressive subset of mouse CD4+ CD25+ FoxP3+ T regulatory cells: applicability to tumor-infiltrating T regulatory cells. J Immunol (2008) 180(10):6467–71. doi:10.4049/jimmunol.180.10.6467
14. Chen X, Subleski JJ, Hamano R, Zack Howard OM, Robert HW, Oppenheim JJ, et al. Co-expression of TNFR2 and CD25 identifies more of the functional CD4+ FOXP3+ regulatory T cells in human peripheral blood. Eur J Immunol (2010) 40(4):1099–106. doi:10.1002/eji.200940022
15. Santinon F, Batignes M, Salomon B, Decker P, Boissier MC, Semerano L, et al. TNFR2+ Regulatory T Cells subpopulations are highly suppressive and are increased on Anti-TNF Treatment [abstract]. Arthritis Rheumatol (2017) 69(10).
16. Yan F, Du R, Wei F, Zhao H, Yu J, Wang C, et al. Expression of TNFR2 by regulatory T cells in peripheral blood is correlated with clinical pathology of lung cancer patients. Cancer Immunol Immunother (2015) 64(11):1475–85. doi:10.1007/s00262-015-1751-z
17. Chopra M, Riedel SS, Biehl M, Krieger S, von Krosigk V, Bäuerlein CA, et al. Tumor necrosis factor receptor 2-dependent homeostasis of regulatory T cells as a player in TNF-induced experimental metastasis. Carcinogenesis (2013) 34(6):1296–303. doi:10.1093/carcin/bgt038
18. Govindaraj C, Scalzo-Inguanti K, Madondo M, Hallo J, Flanagan K, Quinn M, et al. Impaired Th1 immunity in ovarian cancer patients is mediated by TNFR2+ Tregs within the tumor microenvironment. Clin Immunol (2013) 149(1):97–110. doi:10.1016/j.clim.2013.07.003
19. Govindaraj C, Madondo M, Kong YY, Tan P, Wei A, Plebanski M. Lenalidomide-based maintenance therapy reduces TNF receptor 2 on CD4 T cells and enhances immune effector function in acute myeloid leukemia patients. Am J Hematol (2014) 89(8):795–802. doi:10.1002/ajh.23746
20. Hamilton KE, Simmons JG, Ding S, Van Landeghem L, Lund PK. Cytokine induction of tumor necrosis factor receptor 2 is mediated by STAT3 in colon cancer cells. Mol Cancer Res (2011) 9(12):1718–31. doi:10.1158/1541-7786.MCR-10-0210
21. van der Most RG, Currie AJ, Mahendran S, Prosser A, Darabi A, Robinson BW, et al. Tumor eradication after cyclophosphamide depends on concurrent depletion of regulatory T cells: a role for cycling TNFR2-expressing effector-suppressor T cells in limiting effective chemotherapy. Cancer Immunol Immunother (2009) 58(8):1219. doi:10.1007/s00262-008-0628-9
22. Chen X, Wu X, Zhou Q, Howard OM, Netea MG, Oppenheim JJ. TNFR2 is critical for the stabilization of the CD4+Foxp3+ regulatory T cell phenotype in the inflammatory environment. J Immunol (2013) 190(3):1076–84. doi:10.4049/jimmunol.1202659
23. Sakaguchi S, Wing K, Onishi Y, Prieto-Martin P, Yamaguchi T. Regulatory T cells: how do they suppress immune responses? Int Immunol (2009) 21(10):1105–11. doi:10.1093/intimm/dxp095
24. Marson A, Kretschmer K, Frampton GM, Jacobsen ES, Polansky JK, MacIsaac KD, et al. Foxp3 occupancy and regulation of key target genes during T-cell stimulation. Nature (2007) 445(7130):931. doi:10.1038/nature05478
25. Zheng Y, Josefowicz SZ, Kas A, Chu TT, Gavin MA, Rudensky AY. Genome-wide analysis of Foxp3 target genes in developing and mature regulatory T cells. Nature (2007) 445(7130):936. doi:10.1038/nature05563
26. Wang R, Wan Q, Kozhaya L, Fujii H, Unutmaz D. Identification of a regulatory T cell specific cell surface molecule that mediates suppressive signals and induces Foxp3 expression. PLoS One (2008) 3(7):e2705. doi:10.1371/journal.pone.0002705
27. Chen Y, Mu CY, Huang JA. Clinical significance of programmed death-1 ligand-1 expression in patients with non-small cell lung cancer: a 5-year-follow-up study. Tumori (2012) 98(6):751–5. doi:10.1700/1217.13499
28. Li Z, Dong P, Ren M, Song Y, Qian X, Yang Y, et al. PD-L1 expression is associated with tumor FOXP3+ regulatory T-cell infiltration of breast cancer and poor prognosis of patient. J Cancer (2016) 7(7):784. doi:10.7150/jca.14549
29. Birnbaum DJ, Finetti P, Lopresti A, Gilabert M, Poizat F, Turrini O, et al. Prognostic value of PDL1 expression in pancreatic cancer. Oncotarget (2016) 7(44):71198. doi:10.18632/oncotarget.11685
30. Darb-Esfahani S, Kunze CA, Kulbe H, Sehouli J, Wienert S, Lindner J, et al. Prognostic impact of programmed cell death-1 (PD-1) and PD-ligand 1 (PD-L1) expression in cancer cells and tumor-infiltrating lymphocytes in ovarian high grade serous carcinoma. Oncotarget (2016) 7(2):1486. doi:10.18632/oncotarget.6429
31. Saito R, Abe H, Kunita A, Yamashita H, Seto Y, Fukayama M, et al. Overexpression and gene amplification of PD-L1 in cancer cells and PD-L1+ immune cells in Epstein–Barr virus-associated gastric cancer: the prognostic implications. Mod Pathol (2017) 30(3):427–39. doi:10.1038/modpathol.2016.202
32. Keir ME, Butte MJ, Freeman GJ, Sharpe AH. PD-1 and its ligands in tolerance and immunity. Annu Rev Immunol (2008) 26:677–704. doi:10.1146/annurev.immunol.26.021607.090331
33. Noguchi T, Ward JP, Gubin MM, Arthur CD, Lee SH, Hundal J, et al. Temporally distinct PD-L1 expression by tumor and host cells contributes to immune escape. Cancer Immunol Res (2017) 5(2):106–17. doi:10.1158/2326-6066.CIR-16-0391
34. Francisco LM, Salinas VH, Brown KE, Vanguri VK, Freeman GJ, Kuchroo VK, et al. PD-L1 regulates the development, maintenance, and function of induced regulatory T cells. J Exp Med (2009) 206(13):3015–29. doi:10.1084/jem.20090847
35. Sharma P, Allison JP. The future of immune checkpoint therapy. Science (2015) 348(6230):56–61. doi:10.1126/science.aaa8172
36. Ott PA, Hodi FS, Robert C. CTLA-4 and PD-1/PD-L1 blockade: new immunotherapeutic modalities with durable clinical benefit in melanoma patients. Clin Cancer Res (2013) 19(19):5300–9. doi:10.1158/1078-0432.CCR-13-0143
37. Herbst RS, Soria JC, Kowanetz M, Fine GD, Hamid O, Gordon MS, et al. Predictive correlates of response to the anti-PD-L1 antibody MPDL3280A in cancer patients. Nature (2014) 515(7528):563. doi:10.1038/nature14011
38. Wang X, Yang L, Huang F, Zhang Q, Liu S, Ma L, et al. Inflammatory cytokines IL-17 and TNF-α up-regulate PD-L1 expression in human prostate and colon cancer cells. Immunol Lett (2017) 184:7–14. doi:10.1016/j.imlet.2017.02.006
39. Dobrzycka B, Mackowiak-Matejczyk B, Terlikowska KM, Kulesza-Bronczyk B, Kinalski M, Terlikowski SJ. Serum levels of IL-6, IL-8 and CRP as prognostic factors in epithelial ovarian cancer. Eur Cytokine Netw (2013) 24(3):106–13. doi:10.1684/ecn.2013.0340
40. Dijkgraaf EM, Welters MJ, Nortier JW, van der Burg SH, Kroep JR. Interleukin-6/interleukin-6 receptor pathway as a new therapy target in epithelial ovarian cancer. Curr Pharm Des (2012) 18(25):3816–27. doi:10.2174/138161212802002797
41. Lane D, Matte I, Rancourt C, Piché A. Prognostic significance of IL-6 and IL-8 ascites levels in ovarian cancer patients. BMC Cancer (2011) 11:210. doi:10.1186/1471-2407-11-210
42. Maccio A, Madeddu C. Inflammation and ovarian cancer. Cytokine (2012) 58(2):133–47. doi:10.1016/j.cyto.2012.01.015
43. Akira S, Taga T, Kishimoto T. Interleukin-6 in biology and medicine. Adv Immunol (1993) 54:1–78. doi:10.1016/S0065-2776(08)60532-5
44. Kishimoto T. Interleukin-6: discovery of a pleiotropic cytokine. Arthritis Res Ther (2006) 8(2):1. doi:10.1186/ar1906
45. Heink Set al. Trans-presentation of interleukin-6 by dendritic cells is required for priming pathogenic TH17 cells. Nat Immunol (2017) 18(1):74. doi:10.1038/ni0417-474b
46. Luckett-Chastain L, Calhoun K, Schartz T, Gallucci RM. IL-6 influences the balance between M1 and M2 macrophages in a mouse model of irritant contact dermatitis. J Immunol (2016) 196(1 Suppl):196.17.
47. Kowalczewska M, Piotrowski J, Jędrzejewski T, Kozak W. Polysaccharide peptides from Coriolus versicolor exert differential immunomodulatory effects on blood lymphocytes and breast cancer cell line MCF-7 in vitro. Immunol Lett (2016) 174:37–44. doi:10.1016/j.imlet.2016.04.010
48. Dumoitier N, Chaigne B, Régent A, Lofek S, Mhibik M, Dorfmüller P, et al. Scleroderma peripheral B lymphocytes secrete interleukin-6 and transforming growth factor β and activate fibroblasts. Arthritis Rheumatol (2017) 69(5):1078–89. doi:10.1002/art.40016
49. Hirano T, Yasukawa K, Harada H, Taga T, Watanabe Y, Matsuda T, et al. Complementary DNA for a novel human interleukin (BSF-2) that induces B lymphocytes to produce immunoglobulin. Nature (1986) 324(6092):73–6. doi:10.1038/324073a0
50. Villiger PM, Cronin MT, Amenomori T, Wachsman W, Lotz M. IL-6 production by human T lymphocytes. Expression in HTLV-1-infected but not in normal T cells. J Immunol (1991) 146(2):550–9.
51. Nguyen HN, Noss EH, Mizoguchi F, Huppertz C, Wei KS, Watts GF, et al. Autocrine loop involving IL-6 family member LIF, LIF receptor, and STAT4 drives sustained fibroblast production of inflammatory mediators. Immunity (2017) 46(2):220–32. doi:10.1016/j.immuni.2017.01.004
52. Stannard JN, Reed TJ, Myers E, Lowe L, Sarkar MK, Xing X, et al. Lupus skin is primed for IL-6 inflammatory responses through a keratinocyte-mediated autocrine type I interferon loop. J Invest Dermatol (2017) 137(1):115–22. doi:10.1016/j.jid.2016.09.008
53. Baselet B, Belmans N, Coninx E, Lowe D, Janssen A, Michaux A, et al. Functional gene analysis reveals cell cycle changes and inflammation in endothelial cells irradiated with a single X-ray dose. Front Pharmacol (2017) 8:213. doi:10.3389/fphar.2017.00213
54. Dmitrieva O, Shilovskiy I, Khaitov M, Grivennikov S. Interleukins 1 and 6 as main mediators of inflammation and cancer. Biochemistry (Moscow) (2016) 81(2):80–90. doi:10.1134/S0006297916020024
55. Gallo M, Frezzetti D, Normanno N, De Luca A. Effects of the Co-expression of RANTES and IL-6 on the Transformed Phenotype of Breast Cancer Cells. AACR (2017).
56. Caetano MS, Zhang H, Cumpian AM, Gong L, Unver N, Ostrin EJ, et al. IL6 blockade reprograms the lung tumor microenvironment to limit the development and progression of K-ras–mutant lung cancer. Cancer Res (2016) 76(11):3189–99. doi:10.1158/0008-5472.CAN-15-2840
57. Gao J, Zhao S, Halstensen TS. Increased interleukin-6 expression is associated with poor prognosis and acquired cisplatin resistance in head and neck squamous cell carcinoma. Oncol Rep (2016) 35(6):3265–74. doi:10.3892/or.2016.4765
58. Sanchez-Lopez E, Flashner-Abramson E, Shalapour S, Zhong Z, Taniguchi K, Levitzki A, et al. Targeting colorectal cancer via its microenvironment by inhibiting IGF-1 receptor-insulin receptor substrate and STAT3 signaling. Oncogene (2016) 35(20):2634. doi:10.1038/onc.2015.326
59. Liu H, Shen J, Lu K. IL-6 and PD-L1 blockade combination inhibits hepatocellular carcinoma cancer development in mouse model. Biochem Biophys Res Commun (2017) 486(2):239–44. doi:10.1016/j.bbrc.2017.02.128
60. Wu YS, Chung I, Wong WF, Masamune A, Sim MS, Looi CY. Paracrine IL-6 signaling mediates the effects of pancreatic stellate cells on epithelial-mesenchymal transition via STAT3/NRF2 pathway in pancreatic cancer cells. Biochim Biophys Acta (2017) 1861(2):296–306. doi:10.1016/j.bbagen.2016.10.006
61. Israelsson P, Labani-Motlagh A, Nagaev I, Dehlin E, Nagaeva O, Lundin E, et al. Assessment of cytokine mRNA expression profiles in tumor microenvironment and peripheral blood mononuclear cells of patients with high-grade serous carcinoma of the ovary. J Cancer Sci Ther (2017) 9(5):422–9. doi:10.4172/1948-5956.1000453
62. Kampan NC, Xiang SD, McNally OM, Stephens AN, Quinn MA, Plebanski M. Immunotherapeutic interleukin-6 or interleukin-6 receptor blockade in cancer: challenges and opportunities. Curr Med Chem (2017). doi:10.2174/0929867324666170712160621
63. Kolomeyevskaya N, Eng KH, Khan ANH, Grzankowski KS, Singel KL, Moysich K, et al. Cytokine profiling of ascites at primary surgery identifies an interaction of tumor necrosis factor-α and interleukin-6 in predicting reduced progression-free survival in epithelial ovarian cancer. Gynecol Oncol (2015) 138(2):352–7. doi:10.1016/j.ygyno.2015.05.009
64. Chen X, Bäumel M, Männel DN, Howard OZ, Oppenheim JJ. Interaction of TNF with TNF receptor type 2 promotes expansion and function of mouse CD4+ CD25+ T regulatory cells. J Immunol (2007) 179(1):154–61. doi:10.4049/jimmunol.179.1.154
65. Valencia X, Stephens G, Goldbach-Mansky R, Wilson M, Shevach EM, Lipsky PE. TNF downmodulates the function of human CD4+ CD25 hi T-regulatory cells. Blood (2006) 108(1):253–61. doi:10.1182/blood-2005-11-4567
66. Nie H, Zheng Y, Li R, Guo TB, He D, Fang L, et al. Phosphorylation of FOXP3 controls regulatory T cell function and is inhibited by TNF-[alpha] in rheumatoid arthritis. Nat Med (2013) 19(3):322–8. doi:10.1038/nm.3085
67. Zaragoza B, Chen X, Oppenheim JJ, Baeyens A, Gregoire S, Chader D, et al. Suppressive activity of human regulatory T cells is maintained in the presence of TNF. Nat Med (2016) 22(1):16. doi:10.1038/nm.4019
68. Dienz O, Rincon M. The effects of IL-6 on CD4 T cell responses. Clin Immunol (2009) 130(1):27–33. doi:10.1016/j.clim.2008.08.018
69. Kimura A, Kishimoto T. IL-6: regulator of Treg/Th17 balance. Eur J Immunol (2010) 40(7):1830–5. doi:10.1002/eji.201040391
70. Korn T, Mitsdoerffer M, Croxford AL, Awasthi A, Dardalhon VA, Galileos G, et al. IL-6 controls Th17 immunity in vivo by inhibiting the conversion of conventional T cells into Foxp3+ regulatory T cells. Proc Nat Acad Sci U S A (2008) 105(47):18460–5. doi:10.1073/pnas.0809850105
71. Veldhoen M, Hocking RJ, Atkins CJ, Locksley RM, Stockinger B. TGFβ in the context of an inflammatory cytokine milieu supports de novo differentiation of IL-17-producing T cells. Immunity (2006) 24(2):179–89. doi:10.1016/j.immuni.2006.01.001
72. Bettelli E, Carrier Y, Gao W, Korn T, Strom TB, Oukka M, et al. Reciprocal developmental pathways for the generation of pathogenic effector TH17 and regulatory T cells. Nature (2006) 441(7090):235. doi:10.1038/nature04753
73. Quintana FJ. Old dog, new tricks: IL-6 cluster signaling promotes pathogenic TH17 cell differentiation. Nat Immunol (2017) 18(1):8–10. doi:10.1038/ni.3637
74. Zheng SG, Wang J, Horwitz DA. Cutting edge: Foxp3+ CD4+ CD25+ regulatory T cells induced by IL-2 and TGF-β are resistant to Th17 conversion by IL-6. J Immunol (2008) 180(11):7112–6. doi:10.4049/jimmunol.180.11.7112
75. Fujimoto M, Nakano M, Terabe F, Kawahata H, Ohkawara T, Han Y, et al. The influence of excessive IL-6 production in vivo on the development and function of Foxp3+ regulatory T cells. J Immunol (2011) 186(1):32–40. doi:10.4049/jimmunol.0903314
76. Ziegler SF. FOXP3: not just for regulatory T cells anymore. Eur J Immunol (2007) 37(1):21–3. doi:10.1002/eji.200636929
77. Govindaraj C, Scalzo-Inguanti K, Scholzen A, Li S, Plebanski M. TNFR2 expression on CD25hiFOXP3+ T cells induced upon TCR stimulation of CD4 T cells identifies maximal cytokine-producing effectors. Front Immunol (2013) 4:233. doi:10.3389/fimmu.2013.00233
78. Chen X, Hamano R, Subleski JJ, Hurwitz AA, Howard OZ, Oppenheim JJ. Expression of costimulatory TNFR2 induces resistance of CD4+ FoxP3− conventional T cells to suppression by CD4+ FoxP3+ regulatory T cells. J Immunol (2010) 185(1):174–82. doi:10.4049/jimmunol.0903548
79. Hamano R, Huang J, Yoshimura T, Oppenhei JJ, Chen X. TNF optimally activatives regulatory T cells by inducing TNF receptor superfamily members TNFR2, 4-1BB and OX40. Eur J Immunol (2011) 41(7):2010–20. doi:10.1002/eji.201041205
80. Wang L, Miyahira AK, Simons DL, Lu X, Chang AY, Wang C, et al. IL6 signaling in peripheral blood T cells predicts clinical outcome in breast cancer. Cancer Res (2017) 77(5):1119–26. doi:10.1158/0008-5472.CAN-16-1373
81. Kopparam J, Meylan E. RIP off STAT3 to counteract tumor progression. Cell Cycle (2017) 16(19):1727–8. doi:10.1080/15384101.2017.1360643
82. Miteva L, Stanilov N, Cirovski G, Stanilova SA. Upregulation of Treg-related genes in addition with IL6 showed the significant role for the distant metastasis in colorectal cancer. Cancer Microenviron (2017):1–8. doi:10.1007/s12307-017-0198-5
83. Polimeno M, Napolitano M, Costantini S, Portella L, Esposito A, Capone F, et al. Regulatory T cells, interleukin (IL)-6, IL-8, vascular endothelial growth factor (VEGF), CXCL10, CXCL11, epidermal growth factor (EGF) and hepatocyte growth factor (HGF) as surrogate markers of host immunity in patients with renal cell carcinoma. BJU Int (2013) 112(5):686–96. doi:10.1111/bju.12068
84. Chen X, Nie Y, Xiao H, Bian Z, Scarzello AJ, Song NY, et al. TNFR2 expression by CD4 effector T cells is required to induce full-fledged experimental colitis. Sci Rep (2016) 6:32834. doi:10.1038/srep32834
85. Giuntoli RL, Webb TJ, Zoso A, Rogers O, Diaz-Montes TP, Bristow RE, et al. Ovarian cancer-associated ascites demonstrates altered immune environment: implications for antitumor immunity. Anticancer Res (2009) 29(8):2875–84.
86. Nowak M, Glowacka E, Szpakowski M, Szyllo K, Malinowski A, Kulig A, et al. Proinflammatory and immunosuppressive serum, ascites and cyst fluid cytokines in patients with early and advanced ovarian cancer and benign ovarian tumors. Neuro Endocrinol Lett (2010) 31(3):375–83.
87. Todoric J, Antonucci L, Karin M. Targeting inflammation in cancer prevention and therapy. Cancer Prev Res (2016) 9(12):895–905. doi:10.1158/1940-6207.CAPR-16-0209
88. Ma Y, Ren Y, Dai ZJ, Wu CJ, Ji YH, Xu J. IL-6, IL-8 and TNF-α levels correlate with disease stage in breast cancer patients. Adv Clin Exp Med (2017) 26(3):421. doi:10.17219/acem/62120
89. De Simone V, Franzè E, Ronchetti G, Colantoni A, Fantini MC, Di Fusco D, et al. Th17-type cytokines, IL-6 and TNF-α synergistically activate STAT3 and NF-kB to promote colorectal cancer cell growth. Oncogene (2015) 34(27):3493. doi:10.1038/onc.2014.286
90. Mizoguchi E, Mizoguchi A, Takedatsu H, Cario E, de Jong YP, Ooi CJ, et al. Role of tumor necrosis factor receptor 2 (TNFR2) in colonic epithelial hyperplasia and chronic intestinal inflammation in mice. Gastroenterology (2002) 122(1):134–44. doi:10.1053/gast.2002.30347
91. Toomer KH, Malek TR. Cytokine signaling in the development and homeostasis of regulatory T cells. Cold Spring Harb Perspect Biol (2017):a028597. doi:10.1101/cshperspect.a028597
92. Noack M, Miossec P. Th17 and regulatory T cell balance in autoimmune and inflammatory diseases. Autoimmun Rev (2014) 13(6):668–77. doi:10.1016/j.autrev.2013.12.004
Keywords: epithelial ovarian cancer, malignant ascites, interleukin 6, tumour necrosis factor 2, FoxP3, regulatory T cells, effector T cells, inflammation
Citation: Kampan NC, Madondo MT, McNally OM, Stephens AN, Quinn MA and Plebanski M (2017) Interleukin 6 Present in Inflammatory Ascites from Advanced Epithelial Ovarian Cancer Patients Promotes Tumor Necrosis Factor Receptor 2-Expressing Regulatory T Cells. Front. Immunol. 8:1482. doi: 10.3389/fimmu.2017.01482
Received: 11 August 2017; Accepted: 23 October 2017;
Published: 06 November 2017
Edited by:
Piotr Trzonkowski, Gdańsk Medical University, PolandReviewed by:
Xuehui He, Radboud University Nijmegen Medical Center, NetherlandsJarek T. Baran, Jagiellonian University Medical College, Poland
Sergiusz Markowicz, Maria Sklodowska Curie Institute of Oncology, Poland
Jacek Tabarkiewicz, University of Rzeszow, Poland
Copyright: © 2017 Kampan, Madondo, McNally, Stephens, Quinn and Plebanski. This is an open-access article distributed under the terms of the Creative Commons Attribution License (CC BY). The use, distribution or reproduction in other forums is permitted, provided the original author(s) or licensor are credited and that the original publication in this journal is cited, in accordance with accepted academic practice. No use, distribution or reproduction is permitted which does not comply with these terms.
*Correspondence: Magdalena Plebanski, bWFnZGFsZW5hLnBsZWJhbnNraUBtb25hc2guZWR1