 Md Shaki Mostaid1,2
 Ting Ting Lee3
 Gursharan Chana3,4,5Suresh Sundram4,6,7
 Cynthia Shannon Weickert8,9,10
 Christos Pantelis1,2,3,4,6Ian Everall1,2,3,4,6,11
 Chad Bousman1,2,12,13,14*
- 1Melbourne Neuropsychiatry Centre, Department of Psychiatry, The University of Melbourne and Melbourne Health, Parkville, VIC, Australia
- 2The Cooperative Research Centre (CRC) for Mental Health, Melbourne, VIC, Australia
- 3Centre for Neural Engineering, The University of Melbourne, Carlton, VIC, Australia
- 4Florey Institute of Neuroscience and Mental Health, The University of Melbourne, Parkville, VIC, Australia
- 5Department of Medicine, Royal Melbourne Hospital, Parkville, VIC, Australia
- 6NorthWestern Mental Health, Melbourne, VIC, Australia
- 7Department of Psychiatry, School of Clinical Sciences, Monash University and Monash Health, Clayton, VIC, Australia
- 8Schizophrenia Research Institute, Sydney, NSW, Australia
- 9Schizophrenia Research Laboratory, Neuroscience Research Australia, Sydney, NSW, Australia
- 10Faculty of Medicine, School of Psychiatry, University of New South Wales, Sydney, NSW, Australia
- 11Institute of Psychiatry, Psychology and Neuroscience, King’s College London, London, United Kingdom
- 12Department of Medical Genetics, University of Calgary, Calgary, AB, Canada
- 13Department of Psychiatry, University of Calgary, Calgary, AB, Canada
- 14Department of Physiology and Pharmacology, University of Calgary, Calgary, AB, Canada
Investigation of peripheral gene expression patterns of transcripts within the NRG–ErbB signaling pathway, other than neuregulin-1 (NRG1), among patients with schizophrenia and more specifically treatment-resistant schizophrenia (TRS) is limited. The present study built on our previous work demonstrating elevated levels of NRG1 EGFα, EGFβ, and type I(Ig2) containing transcripts in TRS by investigating 11 NRG–ErbB signaling pathway mRNA transcripts (NRG2, ErbB1, ErbB2, ErbB3, ErbB4, PIK3CD, PIK3R3, AKT1, mTOR, P70S6K, eIF4EBP1) in whole blood of TRS patients (N = 71) and healthy controls (N = 57). We also examined the effect of clozapine exposure on transcript levels using cultured peripheral blood mononuclear cells (PBMCs) from 15 healthy individuals. Five transcripts (ErbB3, PIK3CD, AKT1, P70S6K, eIF4EBP1) were significantly elevated in TRS patients compared to healthy controls but only expression of P70S6K (Pcorrected = 0.018), a protein kinase linked to protein synthesis, cell growth, and cell proliferation, survived correction for multiple testing using the Benjamini–Hochberg method. Investigation of clinical factors revealed that ErbB2, PIK3CD, PIK3R3, AKT1, mTOR, and P70S6K expression were negatively correlated with duration of illness. However, no transcript was associated with chlorpromazine equivalent dose or clozapine plasma levels, the latter supported by our in vitro PBMC clozapine exposure experiment. Taken together with previously published NRG1 results, our findings suggest an overall upregulation of transcripts within the NRG–ErbB signaling pathway among individuals with schizophrenia some of which attenuate over duration of illness. Follow-up studies are needed to determine if the observed peripheral upregulation of transcripts within the NRG–ErbB signaling pathway are specific to TRS or are a general blood-based marker of schizophrenia.
Introduction
Intracellular signaling initiated by neuregulins (NRGs) and their cognate receptors (ErbBs) are vital for the assembly of neuronal circuitry (1, 2), including myelination of axonal processes (3, 4), neurotransmission (5), and synaptic plasticity (6–8). Abnormalities in NRG–ErbB signaling have been implicated in schizophrenia, with the majority of evidence linked to neuregulin-1 (NRG1) and ErbB4 (5, 9–11).
Neuregulin-1 and ErbB4, together, initiate signaling via the PI3K-AKT signaling pathway, which results in activation of mTOR and in turn stimulates protein synthesis (Figure 1). Several human postmortem brain studies have shown dysregulation of gene expression of NRG1, ErbB4 or down-stream targets among individuals with schizophrenia (12–17). Likewise, evidence of dysregulated gene expression of NRG1 (18–20), ErbB1/ErbB4 (21), and PI3K/AKT (22, 23) in peripheral tissues [i.e., whole blood, peripheral blood mononuclear cells (PBMCs), monocytes] in schizophrenia has also been shown in people with chronic schizophrenia. Treatment-resistant schizophrenia (TRS) patients represent a considerable subgroup who have significant increases in multiple NRG1 splice variants in peripheral blood (24). Thus, we may expect the biological interactors (receptors) and mediators (kinase) of this pathway to also be changed. However, peripheral examination of gene expression within this pathway among individuals with TRS has yet to be completed. Moreover, the impact of medication, lifestyle (e.g., smoking, alcohol use), and/or symptom severity on NRG1-related mRNA expression is largely unknown.
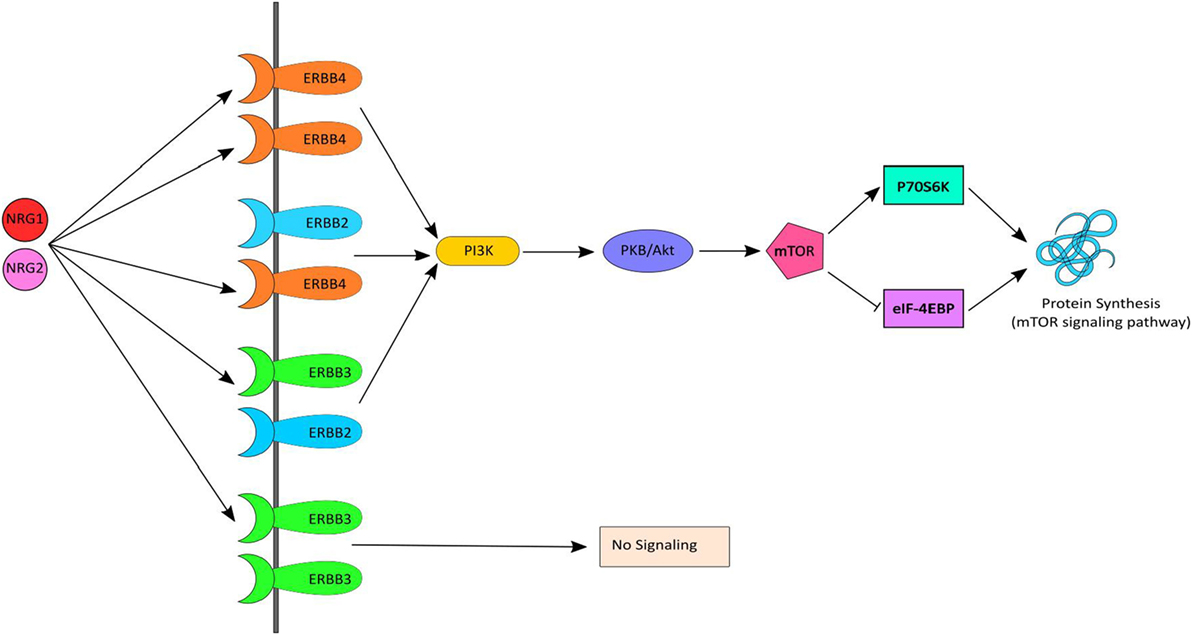
Figure 1. NRG–ErbB signaling pathway. Neuregulin-1 (NRG1) and NRG2 bind to ErbB3 and/or ErbB4, which in turn undergoes homo or heterodimerization and activates PI3K. PI3K then activates AKT and subsequently mTOR causing initiation of protein synthesis via the mTOR signaling pathway. mTOR phosphorylates and activates P70S6K which facilitates phosphorylation of small ribosomal protein 6 (S6) and eukaryotic translation initiation factor 4B (eIF4B) and leads to initiation of protein synthesis. Activated mTOR also causes phosphorylation and inactivation of eIF4EBP1, which release eIF4E and facilitates translation.
The present investigation, therefore, quantiatively compared (i) whole blood mRNA levels of 11 NRG–ErbB signaling receptors and pathway genes (NRG2, ErbB1, ErbB2, ErbB3, ErbB4, PIK3CD, PIK3R3, AKT1, mTOR, P70S6K, eIF4EBP1) among individuals with TRS and healthy controls, (ii) associations between mRNA levels and symptom severity, age of onset, duration of illness, clozapine plasma level, and chlorpromazine equivalent dosage, and (iii) the effect of clozapine exposure on mRNA expression in PBMCs from healthy controls. We expected that there would be multiple molecular changes in TRS compared to controls that may contribute to the amplification of NRG1 signaling in perhiperal blood in support of a widespread gain of function model of NRG1 in the pathophysiology of schizophrenia.
Materials and Methods
Participants
Clinical Samples
Seventy-one participants aged 18–65 with schizophrenia who were treated with clozapine were recruited from inpatient and outpatient clinics in Melbourne, Australia. As these individuals failed to respond to two or more previous trials of antipsychotics, had poor functioning, and persistent symptoms, they were considered “treatment-resistant,” consistent with current criteria (25). In addition, 57 age-, sex-, and socioeconomic-matched unrelated healthy controls were recruited from the general community. Controls with a first-degree family history of psychiatric illness, prior or current use of antipsychotic medication, head injury, seizure, neurological disease, impaired thyroid function, and/or substance abuse/dependence were excluded. Detailed demographic characteristics of all participants are presented in Table 1.
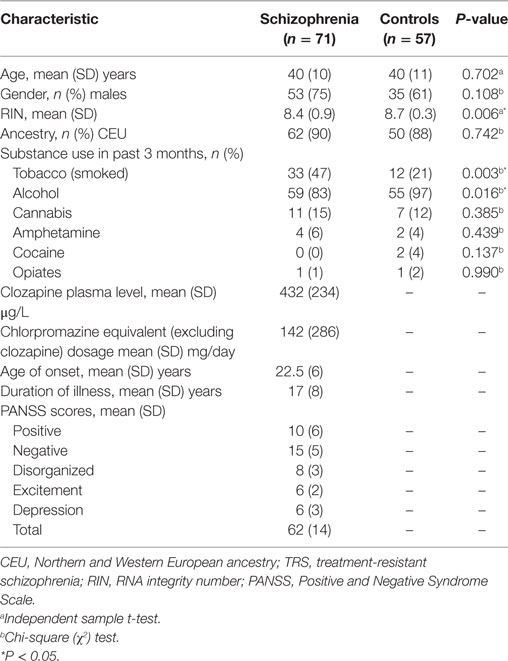
Table 1. Demographic data and clinical characteristics of participants.
Mini International Neuropsychiatric Interview (26) was administered to all participants to confirm the diagnosis of schizophrenia as well as to rule out the presence of psychiatric disorders in healthy controls. The Positive and Negative Syndrome Scale (PANSS) (27) was used to assess the clinical symptoms and the patients were scored in accordance with the consensus five-factor (i.e., positive, negative, disorganized/concrete, excited, depressed) PANSS model (28). Information on tobacco, alcohol, and illicit drug use in the past 3 months was collected using a substance use questionnaire. Whole blood samples were collected after overnight fasting and processed according to standardized blood collection and processing protocol (see supplementary methods for more details). Plasma levels of clozapine were measured and chlorpromazine equivalent dosage (excluding clozapine) were calculated for the 31% (n = 22) of participants with schizophrenia who were taking concomitant antipsychotic medication in accordance with published guidelines (29, 30). All the participants provided written informed consent and the study protocol was approved by the Melbourne Health Human Research Ethics Committee (MHREC ID 2012.069). The study complied with the Declaration of Helsinki and its subsequent revisions (31).
In Vitro Clozapine Exposure Samples
To assess the effect of clozapine exposure on gene expression of our candidate transcripts, fresh frozen PBMCs from 15 healthy individuals (8 males and 7 females) of European ancestry with a mean age of 35 (SD = 13.5; range 20–54 years) were purchased from STEMCELL™ Technologies, Inc. (Vancouver, BC, Canada). A sample size of 15 was sufficient to detect a large effect (Cohen’s d = 0.80) between exposed and unexposed conditions at α = 0.05 and power (1 − β) = 0.80. The percentage of current smokers among the donors was 33.3% (n = 5). All the donors were tested for HIV-1, HIV-2, hepatitis B and hepatitis C prior to blood collection.
Peripheral blood mononuclear cells isolated from whole blood were supplied as vials containing 100 million cells. PBMCs were rapid-thawed from liquid nitrogen and seeded in six-well plates in triplicates at a concentration of 2 million cells per well (1 × 10⁶ cells/mL) in RPMI-1640 medium (Sigma-Aldrich; St. Louis, MO, USA) supplemented with l-glutamine (0.3 g/L) and sodium bicarbonate (2 g/L), penicillin (100 U/mL), streptomycin (100 µg/mL), and 10% fetal bovine serum for 24 h. Cells were then exposed to clozapine (Sigma-Aldrich, St. Louis, MO, USA) for 24 h and 7 days, at a concentration of 1.2 µM (control cells were exposed to vehicle only, see supplementary methods for details) and incubated at 37°C in 5% CO2. Clozapine was initially dissolved in absolute ethanol and media was used for dilution. The final concentration of ethanol on each well was 1 in 8,000. The concentration of clozapine used was determined from the mean plasma concentration of clozapine found in the first 48 recruited clinical samples (1.2 µM or 384 ng/mL). Toxicity assays (CytoTox 96® Non-Radioactive Cytotoxicity Assay; Promega Corporation, Madison, WI, USA) were performed at baseline, 24 h and 7-day time points after clozapine exposure to measure the production of lactate dehydrogenase within the media (see Figure S1 in Supplementary Material for more details).
RNA Extraction, Complementary DNA (cDNA) Synthesis, and Quantitative Real-time PCR
PureLink RNA Mini Kit (ThermoFisher scientific, Waltham, MA, USA) was used to extract total RNA from both clinical and in vitro samples following standard manufacturer’s instructions. The RNA integrity number (RIN) range was 3.60–9.50 (mean = 8.59, SD = 0.79). Total RNA was reverse transcribed to complementary DNA (cDNA) using SuperScript® IV First-Strand Synthesis System (Invitrogen, Foster city, CA, USA) using random hexamers. cDNA (10.25 ng) was used as a template for real-time PCR (RT-qPCR) using master-mix and gene specific validated Taqman assays from Applied Biosystems, Foster City, CA, USA. Inventoried assays (TaqMan®, Invitrogen, USA) were used for all the genes of interest as well as for four reference genes (beta-actin, ACTB; ubiquitin C, UBC; ABL proto-oncogene 1, ABL1; Succinate Dehydrogenase Complex Flavoprotein Subunit A, SDHA). See Table S1 in Supplementary Material for a list of each of the probes and primers.
Complementary DNA (10.25 ng) was subjected to quantitative real-time PCR in duplicate using FAM-MGB TaqMan® gene expression probes (Invitrogen, Foster city, CA, USA) in 192 × 24 Dynamic Arrays IFC in Fluidigm® BioMark™ HD system (South San Francisco, CA, USA) at the Monash Health Translation Precinct Medical Genomics Facility (Hudson Institute of Medical Research, Clayton, VIC, Australia). In addition, no reverse transcriptase controls and no template controls were included to rule out genomic DNA contamination and reagent contamination, respectively. Adhering to minimum information for publication of RT-qPCR (MIQE) guidelines (32), normalized relative quantities (NRQ), i.e., 2−ΔCt where ΔCt = [Ct(candidate gene) − Ct(geometric mean of reference genes)] of each mRNA isoform was calculated using the geometric mean expression of two reference genes (UBC and ACTB) that did not differ between groups in the clinical cohort. ABL-1 and SDHA were not used as reference genes because their expression differed significantly by group in the clinical cohort (Figures S2–S4 in Supplementary Material). In the in vitro cohort only, ABL-1 was stable after 24 h clozapine exposure and ACTB was stable after 7 days clozapine exposure and were used for normalization and subsequent analysis at specific time points.
Statistical Analysis
Two-sided tests were used for all statistical analyses. Shapiro–Wilk test and quantile–quantile (Q–Q) plots were used to assess normality of variable distributions. Student’s t-tests were used to test differences for continuous variables between schizophrenia patients and healthy controls, while chi-squared (χ2) tests were used for categorical variables. The Benjamini and Hochberg (B–H) step-up procedure (33) was used to adjust for multiple comparisons for all analyses. Effect sizes were calculated using the Hedges’ g method (34).
Prior to analysis, the NRQ values for all the mRNA transcripts were checked for normality using Q–Q plots (Figure S5 in Supplementary Material) and as required were log10 transformed for subsequent analysis. In addition, we assessed the following variables as potential confounders: age, sex, RIN, alcohol use, and smoking status. A variable was considered a confounder and included in our statistical models only when it was significantly different between groups (P < 0.05) and was significantly associated with gene expression. The log-transformed NRQ values were compared among groups using general or generalized linear models based on their distribution and adjusted for appropriate covariates. Outliers were identified using the Grubbs’ test for outliers and removed from further analysis.
Within the schizophrenia group, Pearson or Spearman correlations, depending on data distribution, were calculated between gene transcript levels and symptom severity, age of onset, illness duration, current chlorpromazine equivalent dose, and clozapine plasma levels. In addition, mRNA transcript levels between participants in positive symptom remission and non-remission were assessed using a t-test or Mann–Whitney U test. Positive symptom remission was defined as a PANSS score of ≤3 on delusions, hallucinations, grandiosity, and unusual thought content (28).
To assess differences in gene expression between clozapine exposed and unexposed PBMCs at both time points (24 h and 7 days), Wilcoxon matched paired t-test were used, adjusting for age, gender, and RIN.
Results
NRG–ErbB Signaling Pathway Transcripts Are Upregulated in TRS
Two (ErbB1, ErbB4) of the 11 NRG–ErbB pathway mRNA transcripts interrogated, were not detectable in more than 80% of the full cohort and so were removed from further analysis. The rates of non-detects were not significantly different between groups (ErbB1: case 95%, control: 97%; ErbB4: case 81%, control 85%). Analysis on the remaining nine transcripts showed significantly elevated levels of five transcripts: ErbB3 (P = 0.046), PIK3CD (Praw = 0.035), AKT1 (Praw = 0.018), P70S6K (Praw = 0.002), and eIF4EBP1 (Praw = 0.013) in TRS patients compared to healthy controls after adjustment for covariates. However, only P70S6K (PB–H = 0.018) remained significant after correction for multiple comparisons (Figure 2). Importantly, transcript levels were not correlated with clozapine plasma levels or chlorpromazine equivalent antipsychotic exposure (excluding clozapine) (Table S2 in Supplementary Material). The lack of relationship between mRNA levels and clozapine levels were further corroborated by our in vitro analysis that showed no difference in mRNA levels of detectable transcripts (n = 9) in clozapine exposed compared to unexposed PBMCs, except mTOR mRNA which showed decreased expression levels in clozapine exposed cells at both 24 h (P = 0.001) and 7-day (P = 0.05) time points (Figures S6 and S7 in Supplementary Material).
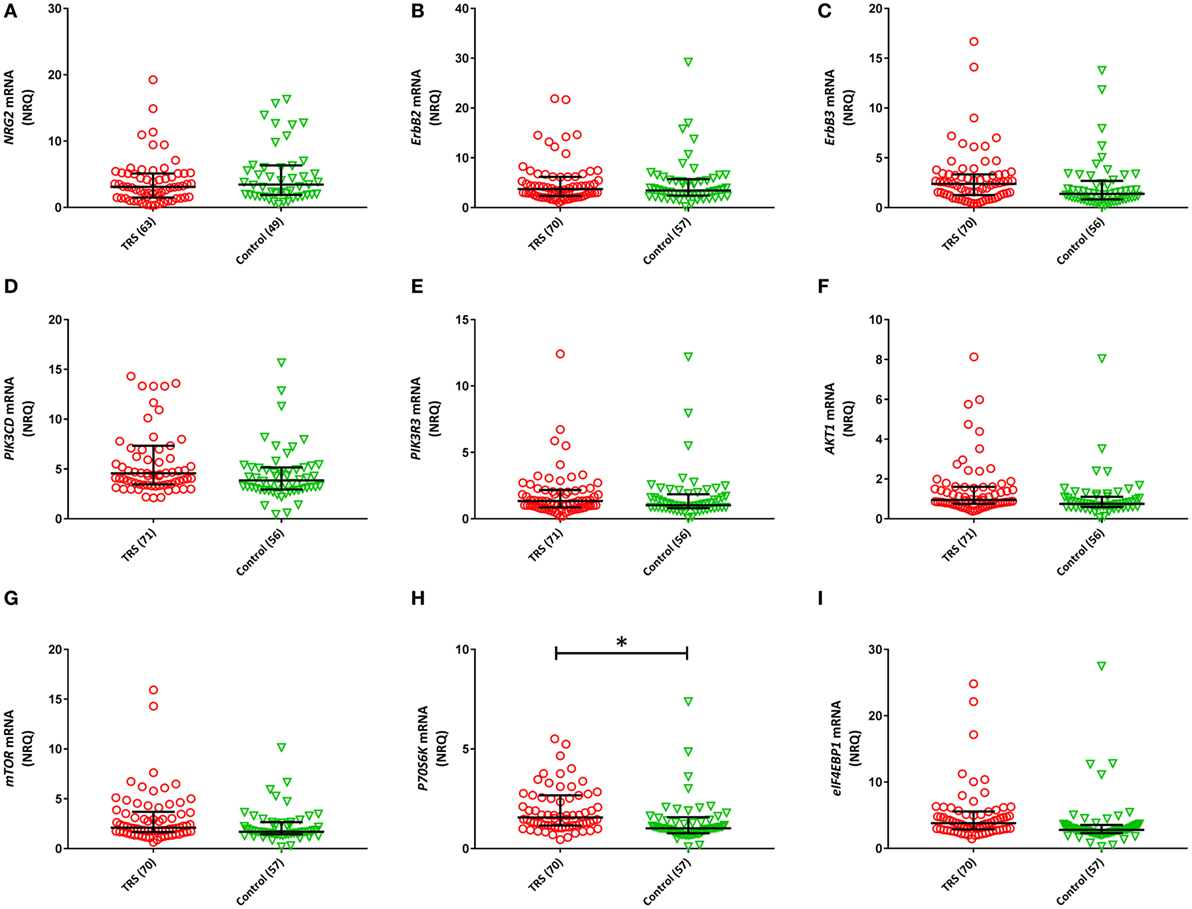
Figure 2. Normalized relative quantities (NRQ) of the gene transcripts: (A) NRG2 [treatment-resistant schizophrenia (TRS): 3.11, interquartile range (IQR) = 1.5–5.12, controls: 3.44, IQR = 1.89–6.34; F1, 111 = 0.524, P = 0.113]; (B) ErbB2 (TRS: 3.72, IQR = 2.39–6.19, controls: 3.44, IQR = 2.42–5.73; Wald χ2 = 0.029, P = 0.864); (C) ErbB3 (TRS: 2.39, IQR = 1.26–3.35, controls: 1.38, IQR = 0.82–2.70; F1, 126 = 4.071, P = 0.083); (D) PIK3CD (TRS: 4.57, IRQ = 3.45–7.34, controls: 3.86, IQR = 2.94–5.16; Wald χ2 = 4.464, P = 0.079); (E) PIK3R3 (TRS: 1.34, IQR = 0.86–2.17, controls: 1.02, IQR = 0.8–1.85; Wald χ2 = 0.104, P = 0.84); (F) AKT1 (TRS: 0.94, IQR = 0.75–1.61, controls: 0.75, IQR = 0.59–1.11; Wald χ2 = 5.605, P = 0.054); (G) mTOR (TRS: 2.10, IQR = 1.66–3.69, controls: 1.44, IQR = 1.44–2.65; Wald χ2 = 4.746, P = 0.20); (H) P70S6K (TRS: 1.57, IQR = 1.16–2.68, controls: 1.02, IQR = 0.77–1.58; Wald χ2 = 13.90, P = 0.018); (I) eIF4EBP1 (TRS: 3.81, IQR = 2.88–5.58, controls: 2.80, IQR = 2.30–3.55; Wald χ2 = 8.71, P = 0.054). Error bars represent median with interquartile range. Benjamini–Hochberg adjusted P-values are shown (*P < 0.05).
NRG–ErbB Signaling Pathway Transcripts Are Associated with Duration of Illness but Not Age of Onset or Symptom Severity
Among individuals with TRS, significant negative correlations between duration of illness and ErbB2 (r = −0.293, Praw = 0.016, PB-H = 0.031), PIK3CD (r = −0.303, Praw = 0.013, PB-H = 0.031), PIK3R3 (r = −0.275, Praw = 0.025, PB-H = 0.038), AKT1 (r = −0.290, Praw = 0.017, PB-H = 0.031), mTOR (r = −0.339, Praw = 0.005, PB-H = 0.023), and P70S6K (r = −0.347, Praw = 0.005, PB-H = 0.023) expression were detected (Figure 3). None of the reference genes were significantly correlated with duration of illness, UBC (r = −0.139, Praw = 0.263), ACTB (r = 0.232, Praw = 0.59). No significant correlations were observed between any of the transcripts and age of onset (Table S2 in Supplementary Material).
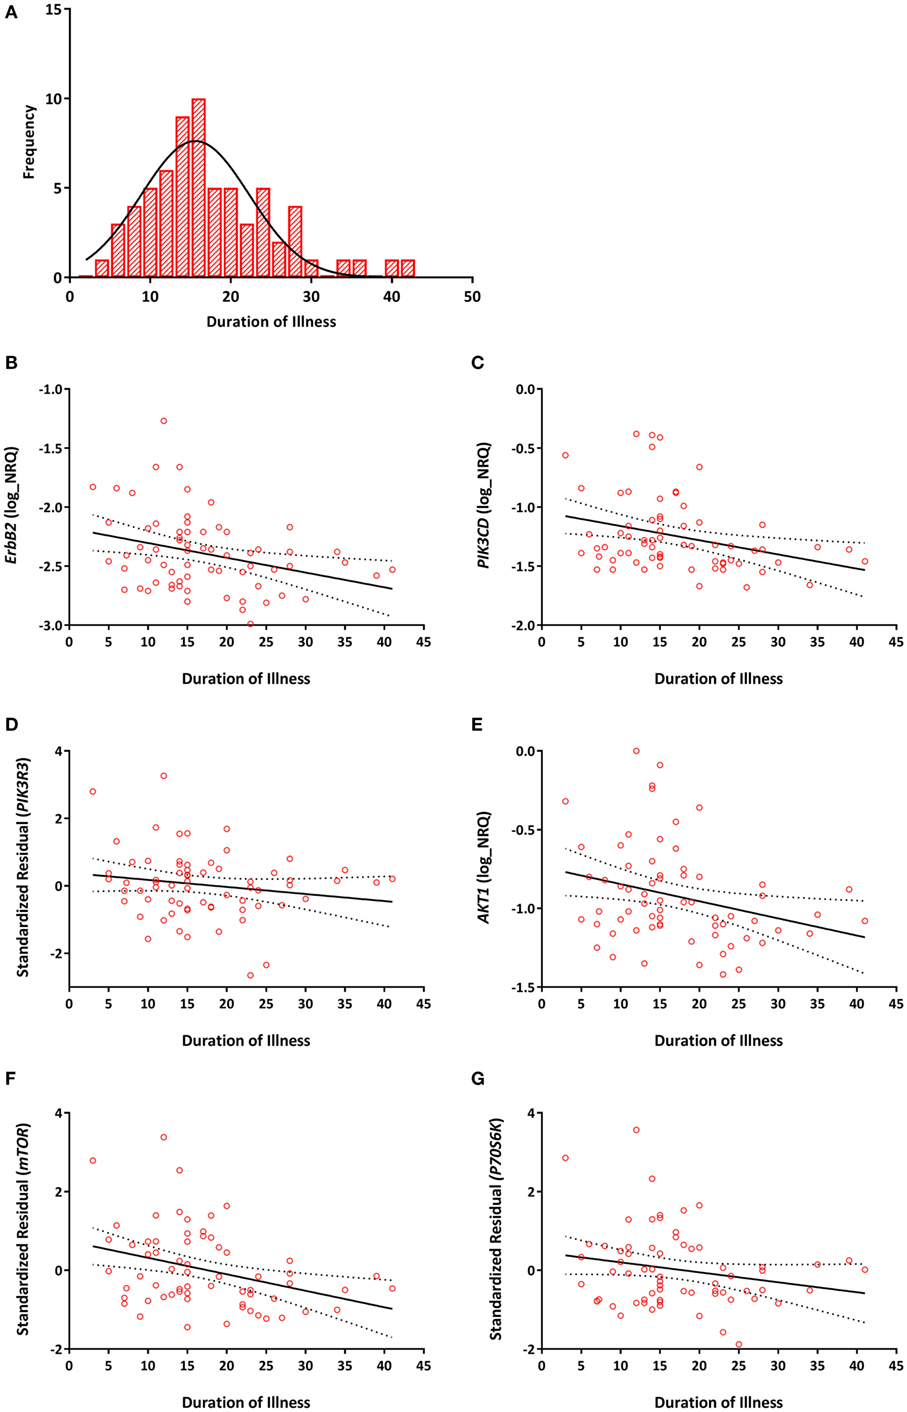
Figure 3. (A) Distribution of duration of illness in years (mean = 17, SD = 8). Correlations between duration of illness and (B) ErbB2 (r = −0.293, PB–H = 0.031); (C) PIK3CD (r = −0.303, PB–H = 0.031); (D) PIK3R3 (r = −0.275, PB–H = 0.038); (E) AKT1 (r = −0.290, PB–H = 0.031); (F) mTOR (r = −0.339, PB–H = 0.023); (G) P70S6K (r = −0.347, PB–H = 0.023) mRNA expression. Expression of PIK3R3, mTOR, and P70S6K are represented as the standardized residual from a linear regression model after adjusting for potential confounds [i.e., age for PIK3R3, RNA integrity number (RIN) and smoking for mTOR, age, RIN and smoking for P70S6K]. Solid lines represent the line of best fit and dotted lines represents 95% confidence intervals for the line of best fit.
A significant positive correlation between ErbB2 expression and PANSS excitement score (r = 0.289, Praw = 0.014, PB–H = 0.667) was observed but did not survive correction for multiple comparisons (Table S3 in Supplementary Material). An exploratory examination of TRS patients in positive symptom remission versus non-remission revealed no statistically significant differences in levels of any of the gene mRNA transcripts after correction for multiple comparisons (Table S4 in Supplementary Material).
Discussion
Our findings suggest transcription in the NRG–ErbB signaling pathway is upregulated in the whole blood of individuals with TRS and is negatively correlated with duration of illness. Among the nine detectable NRG–ErbB pathway transcripts we examined, five (ErbB3, PIK3CD, AKT1, P70S6K, and eIF4EBP1) were elevated and, of these, P70S6K survived correction for multiple comparisons. Importantly, we could not attribute this upregulation of peripheral transcription in the NRG–ErbB pathway to age, sex, or medication. In fact, results from our in vitro clozapine exposure experiment suggested clozapine might reduce rather than increase transcription of genes within the NRG–ErbB signaling pathway, particularly mTOR expression. Overall, our findings support our hypothesis that there is a generalized increase in NRG1 signaling in people with TRS.
Previous findings by us and others support the notion of increased transcription of genes within the NRG–ErbB signaling pathway in schizophrenia. We recently showed in the same cohort used in the current study, an increased expression of three NRG1 transcripts [i.e., NRG1-EGFα, NRG1-EGFβ, and NRG1-typeI(Ig2)] in TRS compared to controls (24). In addition, several studies by others have reported increased expression of specific isoforms of NRG1 (18) and mRNA of down-stream signaling molecules, including PIK3CD, PIK3CB (16, 22), and AKT1 (22, 23) in schizophrenia patients. Furthermore, other down-stream signaling molecules, such as mTOR, P70S6K, and eIF4B, have been shown to be increased in major depressive disorder (35). However, as we are not aware of any human studies that have interrogated P70S6K, in schizophrenia, we are the first to report increased mRNA of P70S6K in TRS.
P70S6K encodes for a vital kinase in the mTOR signaling pathway (36–38) that when phosphorylated by mTOR results in phosphorylation and activation of translation elongation factors eIF4B and eEF2K, thereby promoting protein translation (39, 40). Our findings suggest upregulation of P70S6K, in part, may result from an increase in transcription of several genes upstream of P70S6K within the NRG–ErbB signaling pathway. However, other genes (i.e., BDNF, DISC1) as well as neurotransmitters (i.e., glutamate, serotonin) and hormones (e.g., insulin) have also been shown to activate the PI3K–AKT–mTOR signaling pathway (41–43) and as such may contribute or confound the increase in P70S6K expression we have observed. However, most studies find decreased BDNF levels in the blood of people with schizophrenia (44) and suggest some degree of insulin resistance in clozapine-treated patients (45). Future investigations should attempt to account for these other signaling factors and the potential confounders of metabolic changes in people with schizophrenia being treated with clozapine, as doing so will further elucidate the suitability of P70S6K as a peripheral biomarker of over-activity in the NRG1 pathway in schizophrenia.
We also detected trend-level increases in three transcripts (ErbB3, PIK3CD, and AKT1) upstream of mTOR, within the NRG–ErbB signaling pathway among those with TRS. These increases in whole blood expression are, in part, supported by previous studies that have shown an increased AKT1 mRNA expression in PBMCs from individuals with early-onset (23) and treatment-naïve schizophrenia (46), suggesting peripheral upregulation of NRG–ErbB pathway transcripts may not be specific to the stage of illness and may occur during the first phases of schizophrenia and continue during the chronic phases. However, six of the mRNA transcripts (ErbB2, PIK3CD, PIK3R3, AKT1, mTOR, and P70S6K) we examined were negatively correlated with duration of illness, suggesting that as the illness progresses the upregulation of transcription within the NRG–ErbB signaling pathway might become less apparent. However, it is not clear whether this correlation represents a potential disease process and/or a compensatory response in an effort to maintain signaling homeostasis. Studies examining patterns of NRG–ErbB signaling pathway transcripts over the course of the illness are required to confirm this notion and determine the underlying mechanism.
We did not find differences in the peripheral expression of NRG2 between TRS patients and controls. To our knowledge, we are the first to examine NRG2 mRNA in the blood in schizophrenia or other psychiatric disorder. However, a recent study showed that ablation of NRG2 in the adult mouse brain mimicked dopaminergic imbalance seen in schizophrenia (i.e., high subcortical dopamine, low cortical dopamine) and resulted in severe behavioral phenotypes relevant to psychiatric disorders (47). Thus, NRG2 may play a role in the pathophysiology of schizophrenia but based on our results seems less likely to serve as a peripheral marker of neurobiological changes found in schizophrenia. Likewise, ErbB2 mRNA expression seems an unlikely peripheral marker of schizophrenia based on our null findings as well as findings from others that reported no difference in ErbB2 mRNA expression in monocytes of first-episode, drug-naive patients with schizophrenia compared to healthy controls (48). However, this same study suggested that there may be an exaggerated NRG1 stimulated cytokine response from PBMC in people with schizophrenia compared to controls (48), suggesting a link between overactive NRG1 signaling and inflammation.
Our study has notable limitations. First, we were unable to compare affected individuals with and without TRS and as such the specificity of our results to TRS patients remains to be confirmed. Second, we analyzed cross-sectional data, which makes it complicated to predict how gene expression patterns might change with disease progression and their possible relation to clinical symptoms. Third, we measured gene expression in whole blood, as this tissue is clinically accessible and commonly used in biomarker research. However, it is unclear how our findings will relate to other peripheral (PBMCs or lymphocytes) or central tissues (e.g., brain) despite some suggestion for their relevance in schizophrenia (49). Fourth, we did not investigate all transcripts within the NRG–ErbB pathway (i.e., PIK3CA-B, PIK3R1-2, eIF4B, eEF2, and eIF4E). We instead, chose transcripts based on evidence from the current literature in schizophrenia. Furthermore, we only interrogated mRNA levels of our candidate genes within the NRG–ErbB pathway and as such cannot rule out the potential that genetic, protein, and/or epigenetic markers in this pathway may differ in those with schizophrenia. Fifth, our sample size was relatively small and as such requires independent validation. Finally, our in vitro clozapine exposure experiments examined a single clozapine concentration (1.2 µM) that was guided by pilot data from our study population. While this concentration of clozapine does reflect steady state plasma concentrations (50–52), future work with PBMCs should examine multiple concentrations that reflect the range of clozapine blood levels observed in the clinic together with interrogating a greater number of candidates at both genetic, gene expression and protein levels.
In summary, our results provide the first peripheral gene expression profile of the major NRG–ErbB pathway genes among individuals with TRS. We detected an overall upregulation of NRG–ErbB pathway transcripts among those with TRS, most robustly for P70S6K. We further showed that most of the transcripts we examined were negatively correlated with duration of illness, suggesting the upregulation of NRG–ErbB pathway transcripts we observed in the current chronic schizophrenia cohort may be more easily detectable among individuals at earlier stages of the illness relative to healthy individuals. If this notion is substantiated by future research, NRG–ErbB pathway gene expression may serve, in part, as a useful peripheral biomarker for staging of the illness and possibly assist in the identification of those at greatest risk for TRS.
Ethics Statement
All the participants provided written informed consent and the study protocol was approved by the Melbourne Health Human Research Ethics Committee (MHREC ID 2012.069). The study complied with the Declaration of Helsinki and its subsequent revisions.
Author Contributions
MSM, CB, IE, GC, and SS designed the study and wrote the protocol. MM, TL, and GC conducted the lab experiments. MM managed the literature searches and analyses and wrote the first draft of the manuscript. All authors contributed to and have approved the final manuscript.
Conflict of Interest Statement
The authors declare that the research was conducted in the absence of any commercial or financial relationships that could be construed as a potential conflict of interest.
Funding
The authors acknowledge the financial support of the CRC for Mental Health. The Cooperative Research Centre (CRC) programme is an Australian Government Initiative. The authors also wish to acknowledge the CRC Scientific Advisory Committee, in addition to the contributions of study participants, clinicians at recruitment services, staff at the Murdoch Children’s Research Institute, staff at the Australian Imaging, Biomarkers and Lifestyle Flagship Study of Aging, and research staff at the Melbourne Neuropsychiatry Centre, including coordinators, C. Phassouliotis, A. Merritt, and research assistants, A. Burnside, H. Cross, S. Gale, and S. Tahtalian. Participants for this study were sourced, in part, through the Australian Schizophrenia Research Bank (ASRB), which is supported by the National Health and Medical Research Council of Australia (Enabling Grant N. 386500), the Pratt Foundation, Ramsay Health Care, the Viertel Charitable Foundation, and the Schizophrenia Research Institute. The authors thank the Chief Investigators and ASRB Manager, V. Carr, U. Schall, R. Scott, A. Jablensky, B. Mowry, P. Michie, S. Catts, F. Henskens, C. Pantelis, C. Loughland. The authors acknowledge the help of Jason Bridge for ASRB database queries. MM was supported by a Cooperative Research Centre for Mental Health Top-up Scholarship. SS was supported by One-in-Five Association Incorporated. CSW is supported by Schizophrenia Research Institute (utilizing infrastructure funding from the NSW Ministry of Health and the Macquarie Group Foundation), the University of New South Wales, and Neuroscience Research Australia. CSW is a recipient of a National Health and Medical Research Council (Australia) Principal Research Fellowship (PRF) (#1117079). CP was supported by an NHMRC Senior Principal Research Fellowship (628386 and 1105825), and a Brain and Behavior Research Foundation (NARSAD) Distinguished Investigator Award. CB was supported by a NHMRC Career Development Fellowship (1127700) and Brain and Behavior Research Foundation (NARSAD) Young Investigator Award (20526). None of the funding sources played any role in the study design; collection, analysis, or interpretation of data; in the writing of the report; or in the decision to submit the paper for publication.
Supplementary Material
The Supplementary Material for this article can be found online at http://www.frontiersin.org/article/10.3389/fpsyt.2017.00225/full#supplementary-material.
References
1. Fazzari P, Paternain AV, Valiente M, Pla R, Lujan R, Lloyd K, et al. Control of cortical GABA circuitry development by Nrg1 and ErbB4 signalling. Nature (2010) 464(7293):1376–80. doi:10.1038/nature08928
2. Barros CS, Calabrese B, Chamero P, Roberts AJ, Korzus E, Lloyd K, et al. Impaired maturation of dendritic spines without disorganization of cortical cell layers in mice lacking NRG1/ErbB signaling in the central nervous system. Proc Natl Acad Sci U S A (2009) 106(11):4507–12. doi:10.1073/pnas.0900355106
3. Nave KA. Myelination and support of axonal integrity by glia. Nature (2010) 468(7321):244–52. doi:10.1038/nature09614
4. Snaidero N, Mobius W, Czopka T, Hekking LH, Mathisen C, Verkleij D, et al. Myelin membrane wrapping of CNS axons by PI(3,4,5)P3-dependent polarized growth at the inner tongue. Cell (2014) 156(1–2):277–90. doi:10.1016/j.cell.2013.11.044
5. Mei L, Nave KA. Neuregulin-ERBB signaling in the nervous system and neuropsychiatric diseases. Neuron (2014) 83(1):27–49. doi:10.1016/j.neuron.2014.06.007
6. Mei L, Xiong WC. Neuregulin 1 in neural development, synaptic plasticity and schizophrenia. Nat Rev Neurosci (2008) 9(6):437–52. doi:10.1038/nrn2392
7. Chen YJ, Zhang M, Yin DM, Wen L, Ting A, Wang P, et al. ErbB4 in parvalbumin-positive interneurons is critical for neuregulin 1 regulation of long-term potentiation. Proc Natl Acad Sci U S A (2010) 107(50):21818–23. doi:10.1073/pnas.1010669107
8. Li B, Woo RS, Mei L, Malinow R. The neuregulin-1 receptor erbB4 controls glutamatergic synapse maturation and plasticity. Neuron (2007) 54(4):583–97. doi:10.1016/j.neuron.2007.03.028
9. Buonanno A. The neuregulin signaling pathway and schizophrenia: from genes to synapses and neural circuits. Brain Res Bull (2010) 83(3–4):122–31. doi:10.1016/j.brainresbull.2010.07.012
10. Mostaid MS, Lloyd D, Liberg B, Sundram S, Pereira A, Pantelis C, et al. Neuregulin-1 and schizophrenia in the genome-wide association study era. Neurosci Biobehav Rev (2016) 68:387–409. doi:10.1016/j.neubiorev.2016.06.001
11. Iwakura Y, Nawa H. ErbB1-4-dependent EGF/neuregulin signals and their cross talk in the central nervous system: pathological implications in schizophrenia and Parkinson’s disease. Front Cell Neurosci (2013) 7:4. doi:10.3389/fncel.2013.00004
12. Aston C, Jiang L, Sokolov BP. Microarray analysis of postmortem temporal cortex from patients with schizophrenia. J Neurosci Res (2004) 77(6):858–66. doi:10.1002/jnr.20208
13. Hashimoto R, Straub RE, Weickert CS, Hyde TM, Kleinman JE, Weinberger DR. Expression analysis of neuregulin-1 in the dorsolateral prefrontal cortex in schizophrenia. Mol Psychiatry (2004) 9(3):299–307. doi:10.1038/sj.mp.4001434
14. Silberberg G, Darvasi A, Pinkas-Kramarski R, Navon R. The involvement of ErbB4 with schizophrenia: association and expression studies. Am J Med Genet B Neuropsychiatr Genet (2006) 141B(2):142–8. doi:10.1002/ajmg.b.30275
15. Law AJ, Kleinman JE, Weinberger DR, Weickert CS. Disease-associated intronic variants in the ErbB4 gene are related to altered ErbB4 splice-variant expression in the brain in schizophrenia. Hum Mol Genet (2007) 16(2):129–41. doi:10.1093/hmg/ddl449
16. Law AJ, Wang Y, Sei Y, O’Donnell P, Piantadosi P, Papaleo F, et al. Neuregulin 1-ErbB4-PI3K signaling in schizophrenia and phosphoinositide 3-kinase-p110delta inhibition as a potential therapeutic strategy. Proc Natl Acad Sci U S A (2012) 109(30):12165–70. doi:10.1073/pnas.1206118109
17. Joshi D, Fullerton JM, Weickert CS. Elevated ErbB4 mRNA is related to interneuron deficit in prefrontal cortex in schizophrenia. J Psychiatr Res (2014) 53:125–32. doi:10.1016/j.jpsychires.2014.02.014
18. Petryshen TL, Middleton FA, Kirby A, Aldinger KA, Purcell S, Tahl AR, et al. Support for involvement of neuregulin 1 in schizophrenia pathophysiology. Mol Psychiatry (2005) 10(4):366–74, 28. doi:10.1038/sj.mp.4001608
19. Zhang HX, Li WQ, Zhang HS, Zhang Y, Zhao JP, Lv LX, et al. [Expressional changes of neuregulin-1 gene mRNA in peripheral blood from schizophrenia patients]. Zhonghua Yi Xue Yi Chuan Xue Za Zhi (2011) 28(6):620–4. doi:10.3760/cma.j.issn.1003-9406.2011.06.005
20. Zhang HX, Zhao JP, Lv LX, Li WQ, Xu L, Ouyang X, et al. Explorative study on the expression of neuregulin-1 gene in peripheral blood of schizophrenia. Neurosci Lett (2008) 438(1):1–5. doi:10.1016/j.neulet.2007.09.051
21. Futamura T, Toyooka K, Iritani S, Niizato K, Nakamura R, Tsuchiya K, et al. Abnormal expression of epidermal growth factor and its receptor in the forebrain and serum of schizophrenic patients. Mol Psychiatry (2002) 7(7):673–82. doi:10.1038/sj.mp.4001081
22. Liu L, Luo Y, Zhang G, Jin C, Zhou Z, Cheng Z, et al. The mRNA expression of DRD2, PI3KCB, and AKT1 in the blood of acute schizophrenia patients. Psychiatry Res (2016) 243:397–402. doi:10.1016/j.psychres.2016.07.010
23. Xu Y, Yao Shugart Y, Wang G, Cheng Z, Jin C, Zhang K, et al. Altered expression of mRNA profiles in blood of early-onset schizophrenia. Sci Rep (2016) 6:16767. doi:10.1038/srep16767
24. Mostaid MS, Lee T, Chana G, Sundram S, Weickert CS, Pantelis CP, et al. Elevated peripheral expression of neuregulin-1 (NRG1) mRNA isoforms in clozapine-treated schizophrenia patients. Transl Psychiatry (2017).
25. Howes OD, McCutcheon R, Agid O, de Bartolomeis A, van Beveren NJ, Birnbaum ML, et al. Treatment-resistant schizophrenia: treatment response and resistance in psychosis (TRRIP) working group consensus guidelines on diagnosis and terminology. Am J Psychiatry (2017) 174(3):216–29. doi:10.1176/appi.ajp.2016.16050503
26. Sheehan DV, Lecrubier Y, Sheehan KH, Amorim P, Janavs J, Weiller E, et al. The Mini-International Neuropsychiatric Interview (M.I.N.I.): the development and validation of a structured diagnostic psychiatric interview for DSM-IV and ICD-10. J Clin Psychiatry (1998) 59(Suppl 20):22–33; quiz 4–57.
27. Kay SR, Fiszbein A, Opler LA. The positive and negative syndrome scale (PANSS) for schizophrenia. Schizophr Bull (1987) 13(2):261–76. doi:10.1093/schbul/13.2.261
28. Wallwork RS, Fortgang R, Hashimoto R, Weinberger DR, Dickinson D. Searching for a consensus five-factor model of the positive and negative syndrome scale for schizophrenia. Schizophr Res (2012) 137(1–3):246–50. doi:10.1016/j.schres.2012.01.031
29. American Psychiatric Association. Practice guideline for the treatment of patients with schizophrenia. American Psychiatric Association. Am J Psychiatry (1997) 154(4 Suppl):1–63. doi:10.1176/ajp.154.4.1
30. Woods SW. Chlorpromazine equivalent doses for the newer atypical antipsychotics. J Clin Psychiatry (2003) 64(6):663–7. doi:10.4088/JCP.v64n0607
31. World Medical Association. World Medical Association Declaration of Helsinki: ethical principles for medical research involving human subjects. JAMA (2013) 310(20):2191–4. doi:10.1001/jama.2013.281053
32. Bustin SA, Benes V, Garson JA, Hellemans J, Huggett J, Kubista M, et al. The MIQE guidelines: minimum information for publication of quantitative real-time PCR experiments. Clin Chem (2009) 55(4):611–22. doi:10.1373/clinchem.2008.112797
33. Benjamini Y, Hochberg Y. Controlling the false discovery rate – a practical and powerful approach to multiple testing. J Roy Stat Soc B Met (1995) 57(1):289–300.
34. Hedges LV, Olkin I. Statistical Methods for Meta-Analysis. (Vol. xxii). Orlando: Academic Press (1985). 369 p.
35. Jernigan CS, Goswami DB, Austin MC, Iyo AH, Chandran A, Stockmeier CA, et al. The mTOR signaling pathway in the prefrontal cortex is compromised in major depressive disorder. Prog Neuropsychopharmacol Biol Psychiatry (2011) 35(7):1774–9. doi:10.1016/j.pnpbp.2011.05.010
36. Hoeffer CA, Klann E. mTOR signaling: at the crossroads of plasticity, memory and disease. Trends Neurosci (2010) 33(2):67–75. doi:10.1016/j.tins.2009.11.003
37. Hay N, Sonenberg N. Upstream and downstream of mTOR. Genes Dev (2004) 18(16):1926–45. doi:10.1101/gad.1212704
38. Gong R, Park CS, Abbassi NR, Tang SJ. Roles of glutamate receptors and the mammalian target of rapamycin (mTOR) signaling pathway in activity-dependent dendritic protein synthesis in hippocampal neurons. J Biol Chem (2006) 281(27):18802–15. doi:10.1074/jbc.M512524200
39. Raught B, Peiretti F, Gingras AC, Livingstone M, Shahbazian D, Mayeur GL, et al. Phosphorylation of eucaryotic translation initiation factor 4B Ser422 is modulated by S6 kinases. EMBO J (2004) 23(8):1761–9. doi:10.1038/sj.emboj.7600193
40. Ma XM, Blenis J. Molecular mechanisms of mTOR-mediated translational control. Nat Rev Mol Cell Biol (2009) 10(5):307–18. doi:10.1038/nrm2672
41. Bradshaw NJ, Porteous DJ. DISC1-binding proteins in neural development, signalling and schizophrenia. Neuropharmacology (2012) 62(3):1230–41. doi:10.1016/j.neuropharm.2010.12.027
42. Abi-Dargham A, Laruelle M, Aghajanian GK, Charney D, Krystal J. The role of serotonin in the pathophysiology and treatment of schizophrenia. J Neuropsychiatry Clin Neurosci (1997) 9(1):1–17. doi:10.1176/jnp.9.1.1
43. Gururajan A, van den Buuse M. Is the mTOR-signalling cascade disrupted in schizophrenia? J Neurochem (2014) 129(3):377–87. doi:10.1111/jnc.12622
44. Green MJ, Matheson SL, Shepherd A, Weickert CS, Carr VJ. Brain-derived neurotrophic factor levels in schizophrenia: a systematic review with meta-analysis. Mol Psychiatry (2011) 16(9):960–72. doi:10.1038/mp.2010.88
45. Lu ML, Chen TT, Kuo PH, Hsu CC, Chen CH. Effects of adjunctive fluvoxamine on metabolic parameters and psychopathology in clozapine-treated patients with schizophrenia: a 12-week, randomized, double-blind, placebo-controlled study. Schizophr Res (2017). doi:10.1016/j.schres.2017.06.030
46. Kumarasinghe N, Beveridge NJ, Gardiner E, Scott RJ, Yasawardene S, Perera A, et al. Gene expression profiling in treatment-naive schizophrenia patients identifies abnormalities in biological pathways involving AKT1 that are corrected by antipsychotic medication. Int J Neuropsychopharmacol (2013) 16(7):1483–503. doi:10.1017/S1461145713000035
47. Yan L, Shamir A, Skirzewski M, Leiva-Salcedo E, Kwon OB, Karavanova I, et al. Neuregulin-2 ablation results in dopamine dysregulation and severe behavioral phenotypes relevant to psychiatric disorders. Mol Psychiatry (2017). doi:10.1038/mp.2017.22
48. Keri S, Szabo C, Kelemen O. Uniting the neuro developmental and immunological hypotheses: neuregulin 1 receptor ErbB and toll-like receptor activation in first-episode schizophrenia. Sci Rep (2017) 7(1):4147. doi:10.1038/s41598-017-03736-3
49. Harris LW, Pietsch S, Cheng TM, Schwarz E, Guest PC, Bahn S. Comparison of peripheral and central schizophrenia biomarker profiles. PLoS One (2012) 7(10):e46368. doi:10.1371/journal.pone.0046368
50. Facciola G, Avenoso A, Scordo MG, Madia AG, Ventimiglia A, Perucca E, et al. Small effects of valproic acid on the plasma concentrations of clozapine and its major metabolites in patients with schizophrenic or affective disorders. Ther Drug Monit (1999) 21(3):341–5. doi:10.1097/00007691-199906000-00017
51. Zoccali R, Muscatello MR, Torre DL, Malara G, Canale A, Crucitti D, et al. Lack of a pharmacokinetic interaction between mirtazapine and the newer antipsychotics clozapine, risperidone and olanzapine in patients with chronic schizophrenia. Pharmacol Res (2003) 48(4):411–4. doi:10.1016/S1043-6618(03)00178-6
Keywords: treatment-resistant schizophrenia, NRG–ErbB pathway, gene expression, symptom severity, schizophrenia
Citation: Mostaid MS, Lee TT, Chana G, Sundram S, Shannon Weickert C, Pantelis C, Everall I and Bousman C (2017) Peripheral Transcription of NRG-ErbB Pathway Genes Are Upregulated in Treatment-Resistant Schizophrenia. Front. Psychiatry 8:225. doi: 10.3389/fpsyt.2017.00225
Received: 05 September 2017; Accepted: 23 October 2017;
Published: 06 November 2017
Edited by:
Felice Iasevoli, University of Naples Federico II, ItalyCopyright: © 2017 Mostaid, Lee, Chana, Sundram, Shannon Weickert, Pantelis, Everall and Bousman. This is an open-access article distributed under the terms of the Creative Commons Attribution License (CC BY). The use, distribution or reproduction in other forums is permitted, provided the original author(s) or licensor are credited and that the original publication in this journal is cited, in accordance with accepted academic practice. No use, distribution or reproduction is permitted which does not comply with these terms.
*Correspondence: Chad Bousman, Y2hhZC5ib3VzbWFuQHVjYWxnYXJ5LmNh