 Susan G. Merle1*
 Robert W. Embley1
 H. Paul Johnson2T.-K. Lau1
 Benjamin J. Phrampus3Nicole A. Raineault4Lindsay J. Gee4
- 1The Cooperative Institute for Marine Resources Studies - Oregon State University, and NOAA PMEL Earth Ocean Interactions Program, Newport, OR, United States
- 2School of Oceanography, University of Washington, Seattle, WA, United States
- 3US Naval Research Laboratory, Code 7432, Stennis Space Center, Hancock County, MS, United States
- 4Ocean Exploration Trust Inc., Narragansett, RI, United States
Nearly 3,500 methane bubble streams, clustered into more than 1,300 methane emission sites, have been identified along the US Cascadia margin, derived both from archived published data and 2011, 2016–2018 dedicated multibeam surveys using co-registered seafloor and water column data. In this study, new multibeam sonar surveys systematically mapped nearly 40% of the US Cascadia margin, extending from the Strait of Juan de Fuca in the north to the Mendocino fracture zone in the south, and bounded East–West by the coast and the base of the accretionary prism. The frequency-depth histogram of the bubble emission sites has a dominant peak at the 500 m isobar, which extends laterally along much of the Cascadia margin off Oregon and Washington. Comparisons with published seismic data on the distribution of bottom simulating reflectors (BSR), which is the acoustic impedance boundary between methane hydrate (solid phase) and free gas phase below, correlates the bottom simulating reflectors upward termination of the feather edge of methane hydrate stability (FEMHS) zone and the newly identified bubble emission sites off Oregon and Washington. The Cascadia margin off northern California, where the BSR ends seaward of the FEMHS, has fewer sites centered on the 500 m isobaths, although data are more limited there. We propose that the peak in bubble emission sites observed near the 500 m isobath results from migration of free gas from beneath the solid phase of the BSR upslope to the FEMHS termination zone, and suggest that this boundary will be useful to monitor for a change in methane release rate potentially related to a warming ocean.
Introduction
Methane is a strong greenhouse gas that significantly contributes to the ongoing anthropogenic warming of the earth (Kvenvolden 1988b; Bangs et al., 2005; Kretschmer et al., 2015; Saunois et al., 2016; Ruppel and Kessler, 2017). Methane is generated naturally in many terrestrial environments such as wetlands, and peat bogs. Human-induced sources include landfills, livestock, industrial resource extraction and melting permafrost (Ciais et al., 2014; Hope and Schaefer, 2016). Methane gas is also being continually produced by microbial and thermogenic processes in marine sediments and exits the seafloor in thousands of bubble streams distributed over most continental margins (Von Rad et al., 2000; Muller-Karger et al., 2005; Skarke et al., 2014; Geersen et al., 2016; Egger et al., 2018; Hong et al., 2018). Under certain pressure–temperature (P–T) conditions with high concentrations of methane in the pore water, methane hydrate, an ice-like substance, is formed in large quantities within the upper few hundred meters of the sedimentary section on many continental margins (Ewing and Hollister, 1972; Kvenvolden, 1993; Ruppel and Kessler, 2017). Factors such as the geothermal gradient, pore water methane concentrations, tidal pressures, near-bottom water velocities and local tectonics can modulate the release of free gas from below the sediment layers that contain solid methane hydrate (Thomsen et al., 2012; Johnson et al., 2015; Phrampus et al., 2017; Salmi et al., 2017; Egger et al., 2018; Johnson et al., 2019). Bottom simulating reflectors (BSRs), seen in seismic profiles on the margin, are the acoustic impedance boundary between methane hydrate (solid phase) and the free gas phase below. The distribution of methane emission sites and their relationship to the underlying hydrate zone are important to understand as ocean warming, long and short-term tectonic strain, eustatic sea level change, and geothermal heat flow affect the stability zone of methane hydrate. On active continental margins, regional tectonics likely control a large portion of the methane throughput to the ocean. It is important to identify the present distribution of seafloor methane bubble emission sites in light of a continued ocean warming that could potentially dissociate the upper edge of the hydrate layer in the future.
Methane contained within the sediment pore fluids is utilized by erobic methane oxidizing archea and sulphate-reducing bacteria that form the basis of a unique chemosynthetic food web (Levin, 2005; Graves et al., 2017). Oxidation of methane by methanotrophs precipitates large amounts of solid carbonate deposits at the sediment/seawater boundary (Johnson et al., 2003). Because many of the seafloor methane exit sites are biological hotspots (Salmi et al., 2011), knowledge of the distribution of methane emission sites, also referred to as seep ecosystems in historical literature (Field and Jennings, 1987; Collier and Lilley, 2005; Levin, 2005; Torres et al., 2009; Hautala et al., 2014; Johnson et al., 2015), is necessary to assess the importance of seeps on continental margins, providing a valuable data source for research on the interplay between these biological hotspots and fisheries.
Cascadia Margin Geology
The USCM is a 1,000 km-long convergent accretionary margin that evolved during a long period of under-thrusting of the Juan de Fuca plate beneath the North American plate (Figures 1–5). Tectonic strain over the past tens of millions of years has resulted in a large volume of terrigenous, organic-rich, sedimentary and volcanic terranes that have been accreted to the continent (Snavely, 1987). This process continues at present with the strain occurring primarily during periodic megathrust earthquakes along the Cascadia subduction zone (Goldfinger et al., 2012). The present accretionary prism is the result of a long history of convergence where sediments are deposited, compressed, and gradually uplifted (Kulm and Fowler, 1974; Carson, 1977). Brittle fracturing of the accretionary prism nucleates faults, while folding, diapirism, and mud volcanism steepen slopes, precipitating mass failures at various scales on the continental slope. Tectonic strain expels methane-rich sediment pore fluids produced by both microbial and thermogenic processes (Suess et al., 1999; Tréhu et al., 1999). These organic-rich fluids migrate upward, diffusing through the sediment column, and flowing along permeable strata and fractures. In water depths below 500 m, methane migrates toward the seafloor and enters the methane hydrate stability zone and forms a solid hydrate-rich layer within the uppermost sedimentary column. In areas of high concentrations of hydrate, the previously permeable sediments can form an impermeable layer that traps the gas phase below. Methane gas can escape where this hydrate layer is breached by upward migrating diapirs, faults, rapid downcutting by canyons, or sediment slope failures (Orange and Breen, 1992; Johnson et al., 2019). For normal seawater salinities, methane hydrate forms in the P–T conditions existing from abyssal depths to an upper limit of 500 m on the USCM, which is defined as the feather edge of methane hydrate stability (FEMHS) (Hautala et al., 2014; Davies et al., 2015; Johnson et al., 2015; Phrampus et al., 2017; Ruppel and Kessler, 2017).
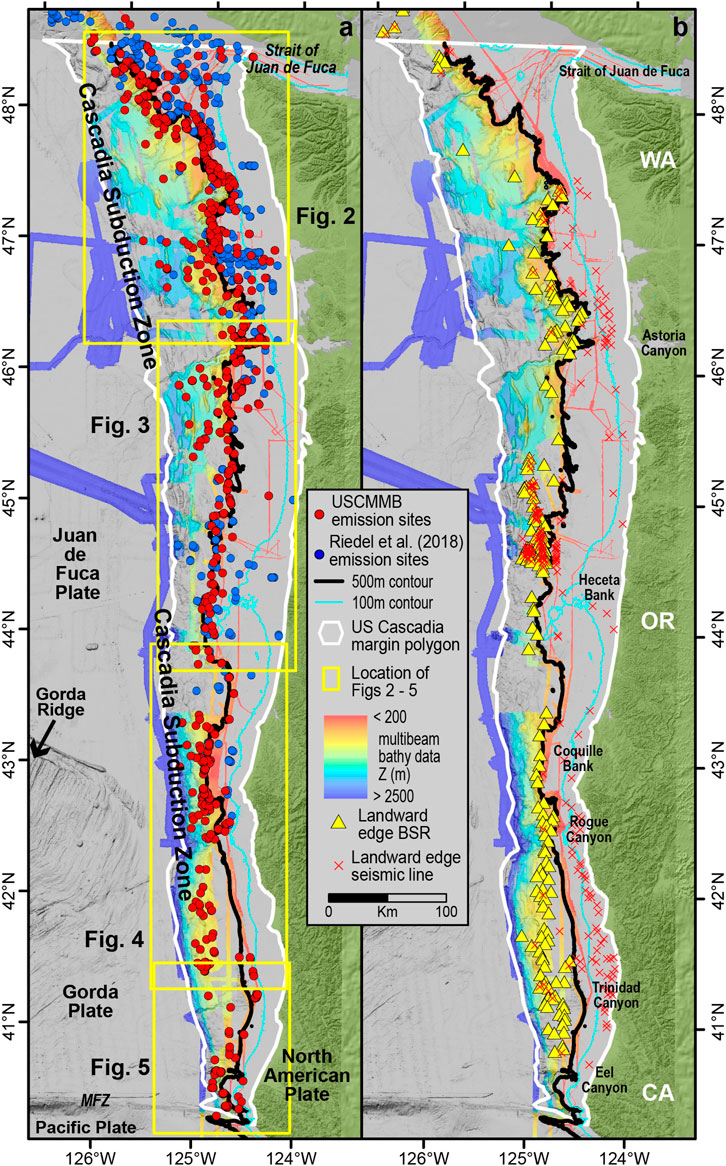
FIGURE 1. (A, B) Bathymetric map depicting the U.S. Cascadia margin area (white polygon) stretching from the Strait of Juan de Fuca in the north to the Mendocino fracture zone (MFZ) in the south. Colored bathymetry is a compilation of the eight multibeam surveys (USCMMB) with co-registered seafloor and water column data presented in this paper. Gray background grid from Goldfinger et al. (2017). (A) Yellow boxes indicate the location of four detailed maps to follow (Figures 2–5). Red circles are the U.S. Cascadia margin multibeam (USCMMB) methane bubble emission sites. Blue circles are Riedel et al. (2018) emission sites. (B) Map revised from Phrampus et al. (2017). Red X’s indicate the landward end of seismic lines. Black line is 500-m depth contour. Yellow triangles depict the FEMHS or the landward-most observed BSRs. BSRs are observed at the end of the seismic line if the red X’s overlay the yellow triangles. Abbreviations: WA (Washington), OR (Oregon) and CA (California).
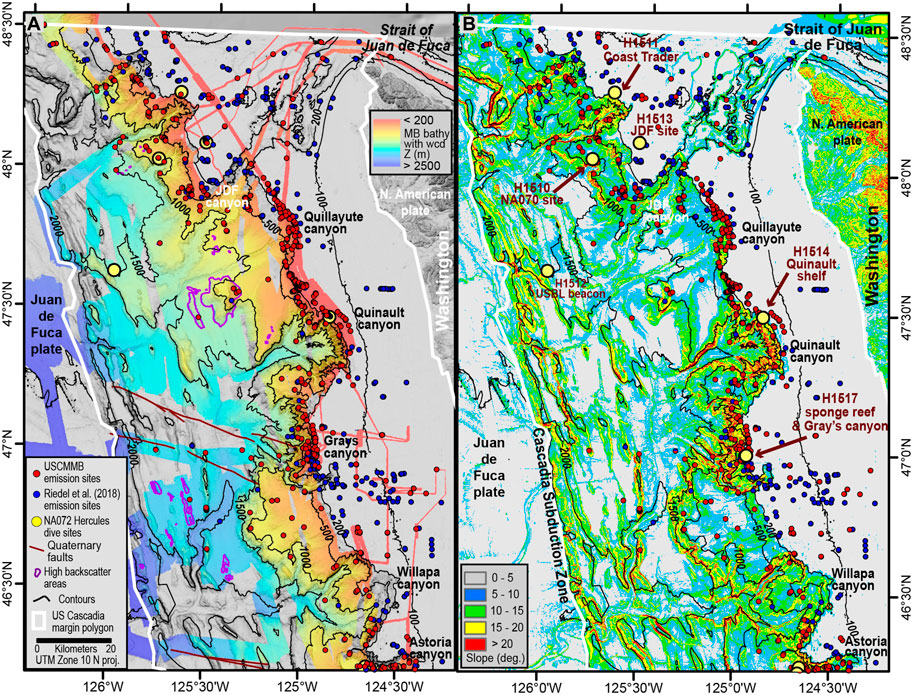
FIGURE 2. Bathymetry and slope maps of Washington Cascadia margin–Strait of Juan de Fuca to Astoria Canyon. Black seafloor contours and slope map derived from grey-scale background grid, Goldfinger et al. (2017). (A) Bathymetric map with major seafloor features labeled. Colored bathymetry data are from the USCMMB database. Red circles are the USCMMB emission sites. Blue circles are Riedel et al. (2018) emission sites. High seafloor backscatter areas outlined by purple polygons. Quaternary faults from Goldfinger and Kulm (1997). USCMMB bathymetry and emission site data north of Astoria Canyon to the Strait of Juan de Fuca published in Johnson et al. (2019). (B) Slope map of the same area shown in (A). NA072 Hercules remotely operated vehicle (ROV) dive sites represented by yellow circles, as well as dive number and name (e.g., H1677).
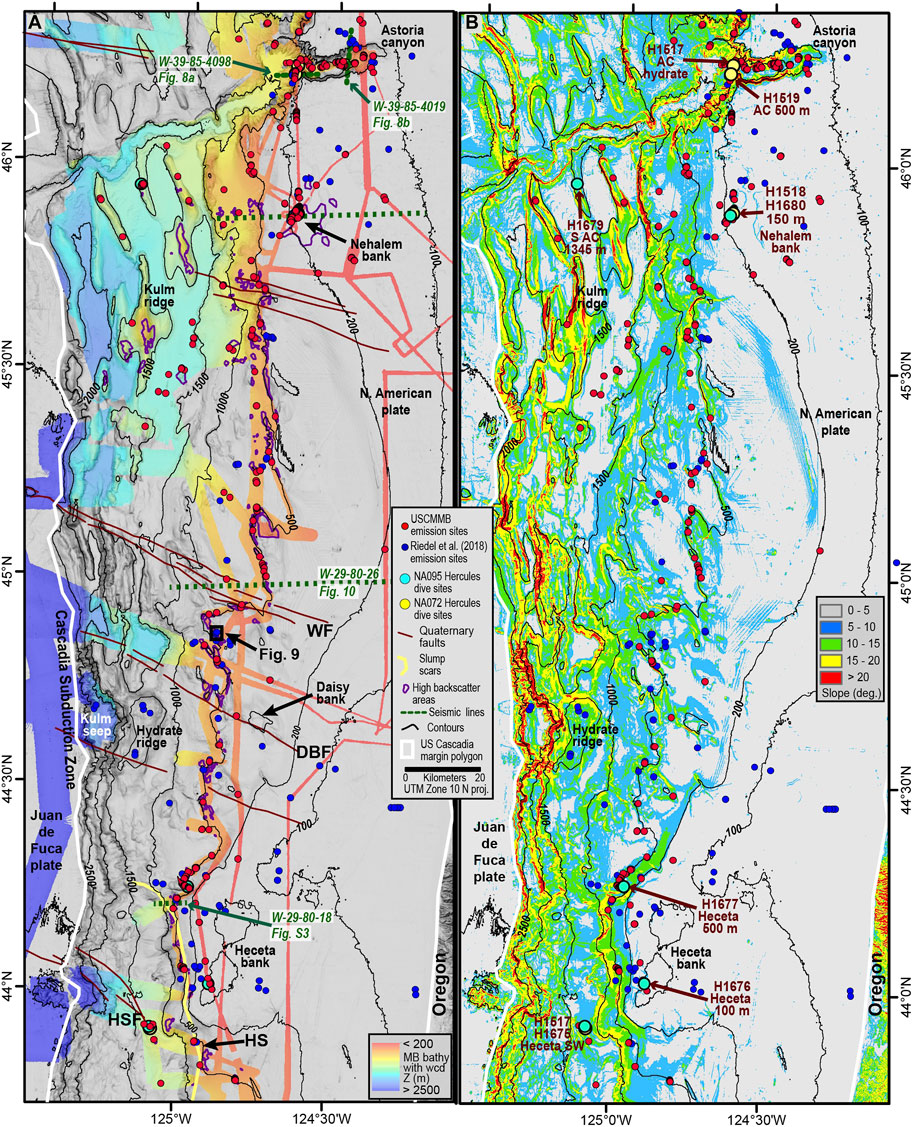
FIGURE 3. Bathymetry and slope maps of Cascadia margin—Astoria Canyon to Heceta Bank. Annotations and data sets same as in Figure 2. (A) Bathymetric map with major seafloor features labeled. Green dashed lines are the location of multi-channel seismic profiles. WF—Wecoma Fault, DBF - Daisy Bank Fault, HSF - Heceta South Fault (all in Goldfinger and Kulm, 1997); HS–Heceta Slump (Goldfinger et al., 2000). Slump scars from Goldfinger et al. (2000). (B) Slope map of the same area shown in (A).
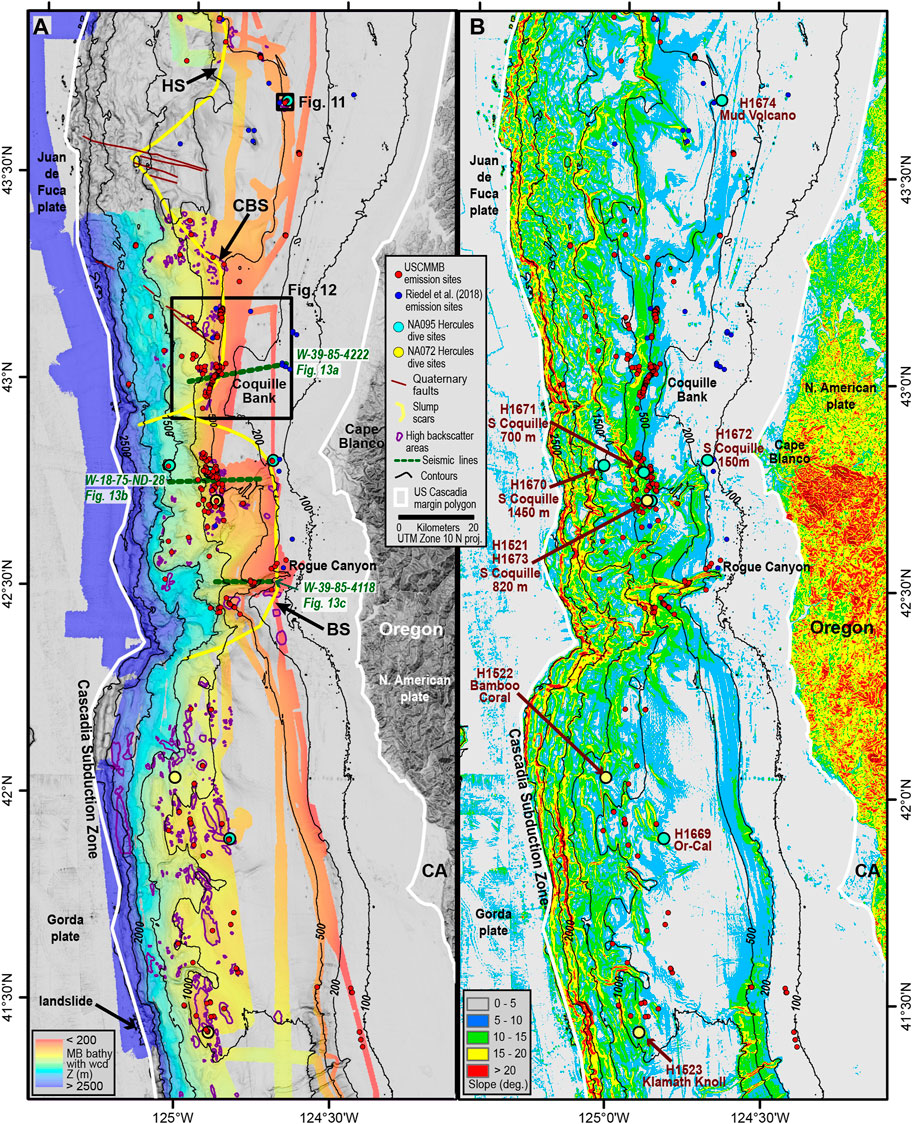
FIGURE 4. Bathymetry and slope maps of Cascadia margin - Heceta Bank to Trinidad Canyon. Annotations and data sets same as in Figure 2. (A) Bathymetric map of with major seafloor features labeled. HS–Heceta slide, CBF–Coos Basin slide, BS–Blanco slide (Goldfinger et al., 2000). (B) Slope map of the same area shown in (A).
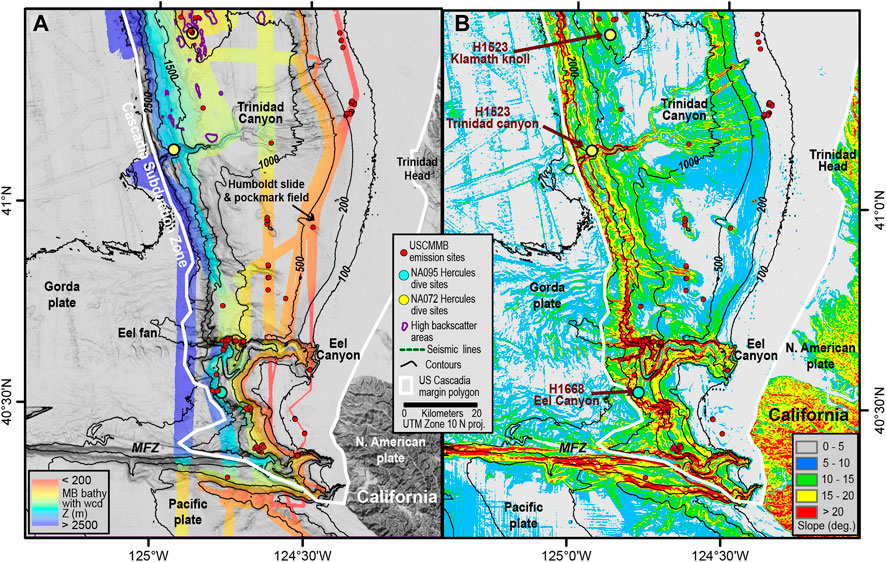
FIGURE 5. Bathymetry and slope maps of Cascadia margin - Trinidad Canyon to Cape Mendocino. Annotations and data sets same as in Figure 2. (A) Bathymetric map with major seafloor features labeled. (B) Slope map of the same area shown in (A).
Background of Submarine Cold Seep Discoveries
Submarine cold seeps are characterized by particular fauna that rely on methane for chemosynthetic reactions. Initial discoveries of submarine cold seeps were serendipitous. Some of the first cold seep sites were found by the deep submergence vehicle (DSV) Alvin at the base of the Florida escarpment (Paull et al., 1984) and near the toe of the accretionary prism off the Oregon coast (Suess et al., 1985; Kulm et al., 1986). Cold seeps with hydrate exposure and bubble streams at the seafloor were later found at Hydrate Ridge off Oregon (Suess et al., 1999), Barkley Canyon off Vancouver Island (Chapman et al., 2004), and Eel Canyon off northern California (Paull et al., 2014). Later, bubble streams rising through the water column (also called flares) were detected by acoustic single beam sonars (Judd and Hovland, 2008). Johnson et al. (2015) identified 195 known locations of bubble streams and seeps on the Cascadia margin, compiling an inventory based on historic methane emission sites (Carson et al., 1990; Collier and Lilley, 2005; Torres et al., 2009; Salmi et al., 2011), locations of fishermen-reported sonar flares, and University of Washington R/V Thompson EM302 multibeam water column data. The more recent study by Riedel et al. (2018) identified an additional 929 bubble stream locations, with the majority of sites on the British Columbia and northern Washington margins. A large portion of the latter were located with EK60 single-beam sonar during the U.S. National Marine Fishery Service fishery stock assessment surveys on the west coast.
It is important to note that seepages of methane-rich fluids are more abundant than indicated by the inventory of bubble emission sites. Although the advent of multibeam water column mapping enables many emission sites to be discovered based on the location of bubble streams (Westbrook et al., 2009; Skarke et al., 2014), bubble streams form only when gas-saturated fluids are delivered rapidly to the seafloor for emission into the water column. For example, bubble streams were not reported at some historic seep areas that were studied during submersible dives on the Oregon margin (Kulm et al., 1986; Orange et al., 1997). Similarly, small seep areas were found on a 2016 dive on the wall of the deep section of Trinidad Canyon (1,950–2,150 m) off northern California, although a multibeam water column survey failed to identify bubble streams over the same site (Figures 5A,B), (Embley et al., 2017).
Conversely, carbonate hardgrounds, which result from methane oxidation and form over long periods (102–103 years), represent past fluid discharge sites and do not identify currently active fluid emission areas (Kulm et al., 1986; Bohrmann et al., 1998). Also, bubble streams can be non-uniform in flux rate and can be modulated by tidal pressures and near-bottom currents over short intervals (Archer, 2007; Thomsen et al., 2012; Philip et al., 2016a; Sun et al., 2020) and geological processes over longer periods. In any case, due to the ephemeral nature of individual bubble streams and/or the lack of a gas phase at some seeps, there are limits to how well we can interpret the distribution of active bubble emission sites with even modern remote sensing methods.
Large-scale systematic surveys required the development of advanced multibeam sonars with a water column imaging capability (Gardner et al., 2009; Skarke et al., 2014; Urban et al., 2017). Where ground-truth data of the sonar images exist, most of these water column bubble streams are co-located with cold fluid seeps on the seafloor (Judd and Hovland, 2008; Greinert et al., 2010). The converse is not true, as not all cold fluid seeps have associated bubble plumes. In this study, new multibeam sonar surveys systematically mapped nearly 40% of the US Cascadia margin, extending from the Strait of Juan de Fuca in the north to the Mendocino fracture zone in the south, and bounded East-West by the coast and the base of the accretionary prism (Table 1; Figures 1A, Supplementary Figure S1). The eight new shipboard multibeam surveys with corresponding water column data reported here will henceforth be referred to as the US Cascadia Margin MultiBeam (USCMMB) dataset.
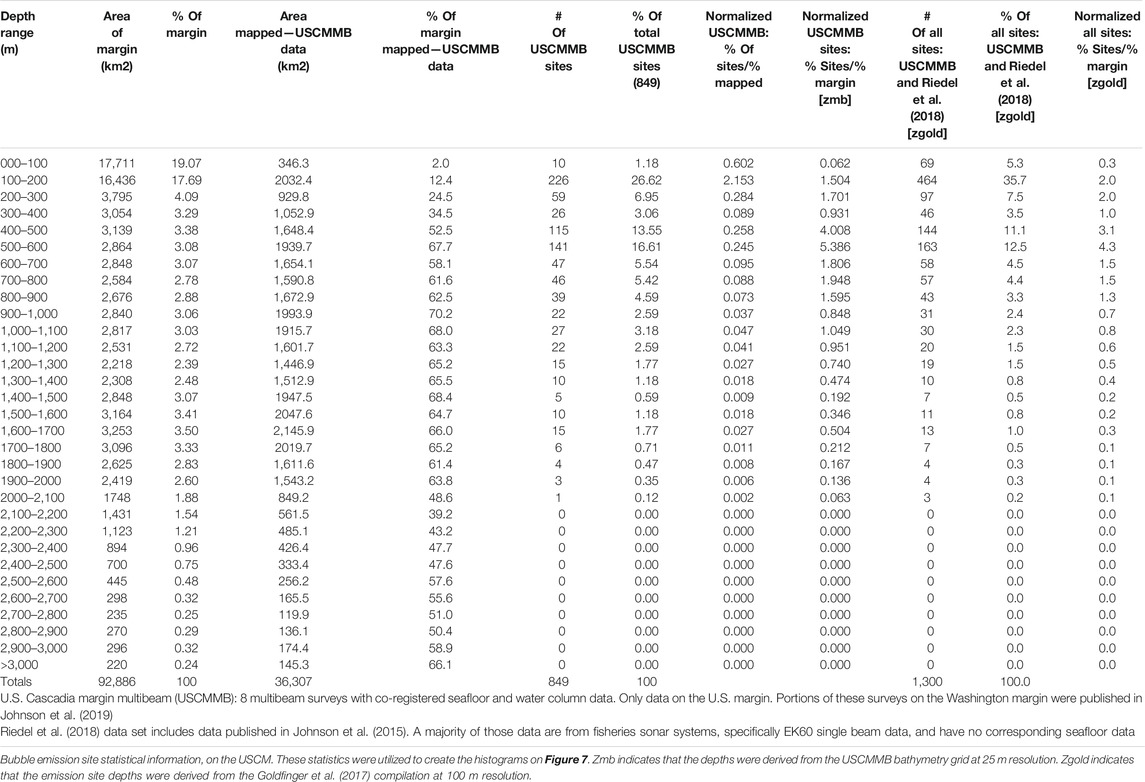
TABLE 1. Bubble emission site statistics–US cascadia margin.
A major result of our data analyses is that a significant concentration of bubble emission sites is located within a narrow depth range centered on the FEMHS, which is located at ∼500 m depth along Cascadia. Johnson et al. (2015) previously documented a robust concentration of sites at the FEMHS along the Washington and northern Oregon Cascadia margin. Here we present the new data inventory from the eight USCMMB cruises, combined with the historical data published by Johnson et al. (2015) and Riedel et al. (2018) (Table 1). Importantly, we extend the survey region southward along the full Cascadia active margin, and now include the Oregon and Northern California margins. In this analysis, the depth distribution of bubble streams is compared to seafloor morphology and overlain on a previously published dataset on the extent of the BSRs from multi-channel seismic reflections, which are available over much of the Cascadia accretionary prism (Figures 1B, 3A, 4A, Supplementary Figure S3), (Phrampus et al., 2017).
Data and Analysis
The new USCMMB acoustic dataset presented here consists of eight co-registered multibeam seafloor and water column surveys (Table 2), which identified 2,510 individual bubble streams on the US Cascadia margin from the Strait of Juan de Fuca (JDF) in the north to the Mendocino fracture zone (MFZ) in the south (Supplementary Table S1). When those data are combined with the Johnson et al. (2015) and Riedel et al. (2018) bubble plume inventories along the USCM, they total 3,481 individual bubble streams (Supplementary Table S2). To prevent over-counting of duplicate bubble streams that were identified on different expeditions, individual bubble streams were clustered into emission sites using a 300-m radius spatial filter, based on the Johnson et al. (2015) methodology. That methodology was derived when Johnson et al., 2015 realized the plumes appeared as clusters, which argues that they have a single sub-surface source and that a deep pathway breaks up into an abundance of smaller vents nearer the surface. They rigorously took the center of a number of these clusters and drew circles of increasing radius around them and counted the number of bubble streams in each circle. When the number of streams counted in the circles of increasing radius stopped increasing, the interpretation was that it was one sub-surface site, similar to hydrothermal vent fields. The 2510 USCMMB individual bubble streams clustered into 848 bubble emission sites (Supplementary Table S3). When all 3,481 bubble streams were re-clustered in this study, a total of 1,300 bubble emission sites were identified (Figures 1A–5A, Supplementary Table S4). The clustered bubble emission sites, rather than the individual bubble streams, were utilized for all statistical analyses in this manuscript (Table 1). USCMMB emission site depths were derived from high resolution multibeam data collected on the eight expeditions highlighted in this study, and gridded at 25-m resolution. The emission site depth information for the “ALL” sites data, which combines the USCMMB and Riedel et al. (2018) datasets, was derived from the Goldfinger et al. (2017) grid at 100 m resolution. Therefore, the emission site depth information is more accurate for the USCMMB dataset than for the “ALL” sites compilation.
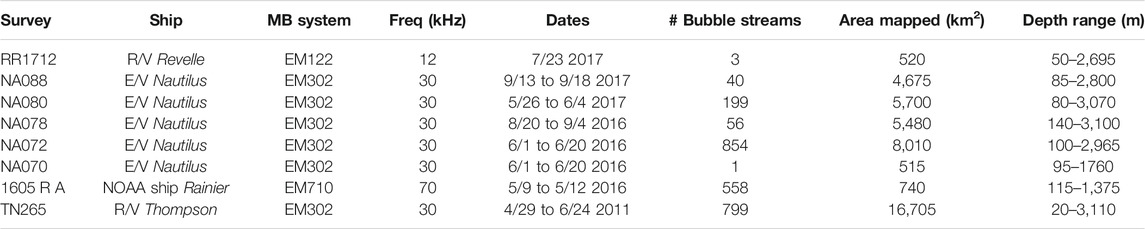
TABLE 2. USCMMB Co-registered seafloor and water column data surveys.
The USCMMB surveys (Figures 1A–5A, Supplementary Figure S1; Table 2) mapped a total of 36,336 km2 of seafloor, which represents 39% of the US Cascadia continental margin (Figure 1A, Supplementary Figure S2; Table 1). The numbers for each survey in Table 2 are specific to each multibeam expedition. Due to overlapping surveys, the total seafloor mapped is larger in Table 2 than Table 1, which reduces the total seafloor mapped because of those coinciding survey areas. Five of the eight datasets were collected on the E/V Nautilus during 2016 and 2017. The 30 kHz acoustic frequency of the EM302 multibeam system on the E/V Nautilus and the R/V Thompson is optimal for surveying the continental slope in water depths ranging from 200–3,200 m. Those two vessels located a combined 1949 bubble streams. A 12 kHz EM122 system on the R/V Revelle only detected three bubble streams on a transit swath, most likely due to high survey speed and the lower frequency sonar. An EM710 system (70 kHz) on the NOAA Ship Rainier surveyed just landward of the heads of Quinault and Quillayute submarine canyons on the Washington margin in depths that range from 100 to 300 m and located more than 500 bubble streams from this limited area (Johnson et al., 2019). Information regarding specific multibeam data availability are in the Supplementary Material document.
All eight of the multibeam water column datasets in this study were processed using the QPS FMMidwater© computer program, which provides location and extraction of features from within the water column. Identification of bubble streams was based on identifying acoustic reflection features that were required to: 1) originate at the seafloor, 2) appear as a flare-shaped echo pattern within the water column data (Urban et al., 2017; Riedel et al., 2018), and 3) could be traced across several pings as they rise toward the sea surface. Several views of the data are available with the processing software, but the beam fan panel was exclusively employed to locate the bubble streams for consistency. When a bubble stream was detected, the seafloor location was “geo-picked” from a single ping within the beam fan view (Figure 6). Rise heights of the bubble streams within the water column were recorded for the majority of the multibeam surveys (Supplementary Table S1).
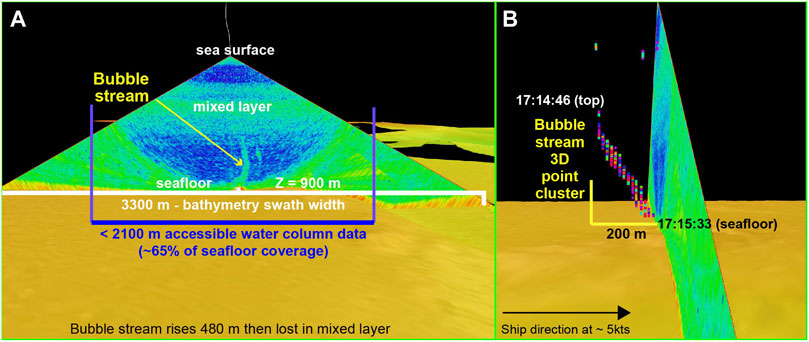
FIGURE 6. Fledermaus© depictions of co-registered seafloor and water column data. (A) Midwater data beam fan view overlaid on concurrently collected seafloor bathymetry data. The horizontal width of effective water column data coverage, in this instance, is <65% of the width of bathymetric seafloor coverage. In this example, a bubble stream rises 480 m and is lost when it intersects the mixed layer. (B) 3-D view of a point cluster object representing a bubble stream wafting in the water column during the NA072 expedition. Hotter colors in the point clusters represent higher amplitude values in the water column data. In this instance, the individual bubble stream seen in (A) was visible in ∼15 dual swath pings covering a 200 m along-track distance over the seafloor, during the course of 47 s at five knots.
The beam fan view is indicative of the geometry of multibeam sonar systems and illustrates the limitations of the multibeam water column data (Figure 6A). The fan-shaped ping only allows visualization of the entire water column at nadir, with decreasing vertical extent of water column data available toward the edge of the swath. Bubble streams on the outer beams of a swath can be clipped and true rise heights not always identified. Due to the beam fan geometry, the percentage of horizontal area available within the water column data is less than the percentage of seafloor data, and that factor can be exacerbated by insufficient swath overlap, rapid ship speeds, noisy surface ocean conditions, and biota obscuring the bubble streams. Constructing 3D views (Figure 6B) allows visualization of the bubble stream in the along-track direction.
To examine sub-seafloor structures located beneath the plume emission sites, seismic profiles were processed using archival Multi Channel Seismic (MCS) data, which are publicly available at the U.S. Geological Survey (USGS) website: https://walrus.wr.usgs.gov/namss/. Plotting, viewing, and enhancing contrast values of the MCS data were executed with MATLAB® software.
Distribution of Cold Seeps Along Cascadia Margin
Overall Distribution
Figure 1A shows the distribution of the USCMMB bubble emission sites (red circles) and historical seep sites (blue circles) along the entire USCM. Figure 1B depicts the landward edge of the BSR from historical seismic data on the margin. Figure 2–five zoom in on those data latitudinally from north to south. The left side of Figure 2–five show the bubble emission sites overlaid on the USCMMB bathymetry data. The right side of Figures 2–5 show a slope map of the margin with added ROV dive site locations from R/V Nautilus expeditions on the margin. Geological interpretations of quaternary faults, slump scars, high backscatter areas and seismic lines utilized in this study are also presented.
Histograms of USCM bubble stream emission site data are presented in Figure 7. The frequency histogram of individual bubble stream depths for all inventoried data on the USCM (USCMMB, plus Johnson et al., 2015, and Riedel et al., 2018) is shown in Figure 7A. The Riedel et al. (2018) data coverage only extends south to 42°30′N, on the southern Oregon margin. Most of the upper slope and shelf coverage is from EK60 sonar, and differs from the USCMMB data in that the footprint of the EK60 is more than 4 times narrower than that of multibeam sonar at 200 m water depth. On the other hand, the EK60 surveys, which consist of E-W lines extending from the shallow continental shelf to ∼800 m mid-water depth, in groups of repeat lines spaced approximately 35 km apart on a N-S grid, provide a relatively evenly parsed sampling of the continental shelf and slope for all of Washington and northern and central Oregon. These historical fisheries survey data supplement the USCMMB acoustic water column data set, which has limited coverage in water depths less than 200 m (∼14% mapped), but accounts for 37% of the area of the USCM (Figures 1–5, Supplementary Figure S2; Table 1).
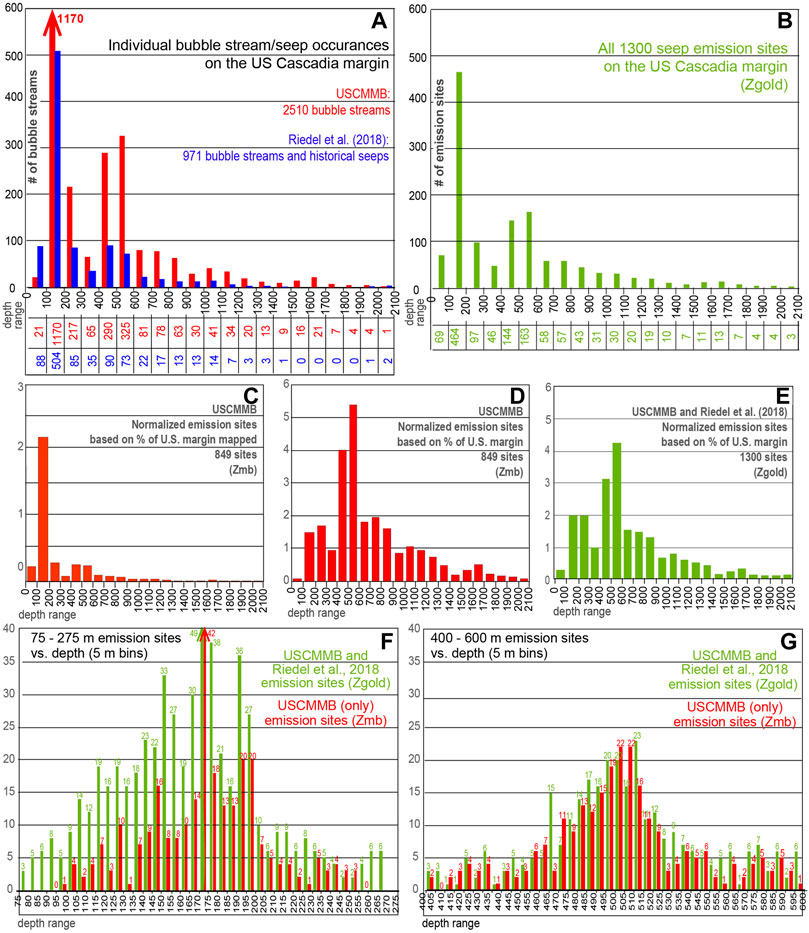
FIGURE 7. Histograms of USCM bubble stream/emission site data. USCMMB emission site depth values were derived from 25 m multibeam grid (Zmb). Riedel et al. 2018 site depth information from Goldfinger et al. (2017) compilation at 100 m resolution (Zgold). Therefore depth values are more accurate when using the Zmb grid numbers. (A) Histogram comparing individual bubble streams from the USCMMB database to the Riedel et al. (2018) data set, which includes the Johnson et al. (2015) compilation. Beneath the depth range intervals are bubble stream numbers from each data set. (B) All the data sets on the USCM combined and clustered into 300 m radii emission sites. Noted beneath the depth range intervals are the number of emission sites within that depth range. (C) Normalized histogram of the UCMMB emission sites on the USCM based on the % of the seafloor mapped. The normalization involves the % of emission sites per 100 m depth interval divided by the % of the depth interval that has been mapped. (D) Normalized histogram of the USCMMB emission sites on the USCM. The normalization involves the % of total sites per 100 m interval divided by the % of the margin within that 100 m interval. (E) Normalized histogram of all 1,300 emission sites on the margin, combining the USCMMB and Riedel et al. (2018) data. The same normalization method as in (D). (F) 5-m binned histograms of the shallow peak in emission site data. The numbers above the histogram bars are the number of sites per 5 m bin (in F and G). (G) 5-m binned histograms of the FEMHS peak.
Johnson et al. (2015) determined the 300 m standard radius filter by testing clustered radii of 0.150, 300, and 500 m, to identify a characteristic length scale for emission sites where the number of total sites counted would become almost constant with increasing radii. Applying the 300-m radius spatial filter used for the data to the combined USCMMB and historical data sets (Johnson et al., 2015; Riedel et al., 2018) yields a total of 1,300 emission sites (Figure 7B) on the margin. Histograms of emission site data exhibit prominent peaks on the outer edge of the continental shelf at 100–200 m and on the upper slope at 400–600 m (Figures 7F,G), and then significantly decrease when extended downward to 2,100 m on the accretionary prism. The highest density of emission sites occurs in shallow water, less than 200 m, off the Washington and northern Oregon coasts.
In order to evaluate the statistical significance of the combined datasets shown in Figures 7A,B,D–G, we first consider only the USCMMB data since actual seafloor areal coverage can be quantified using those surveys (Figures 7C,D, Supplementary Figure S1A). Analysis of the USCMMB data yield a total of 2,510 bubble streams (Supplementary Table S1) that were then grouped into 849 bubble emission sites (Supplementary Table S3). 28% of the total emission sites located in the USCMMB surveys lie within the 0–200 m depth range, a total of 238 sites, which accounts for the large peak in the histogram at the 100–200 m depth interval. A smaller peak brackets the FEMHS between 400–600 m, where 29% (253 emission sites) of the total sites identified lie. Moreover, most of the sites shallower than 200 m are concentrated on the Washington and northern Oregon margins (north of 4,5°45″N). The importance of that will not be truly provable until more data are collected south of that boundary from systematic surveys similar to Riedel et al. (2018) in this sparsely surveyed area, using appropriate multibeam bathymetry tools to determine if the gap in seepage may be real. For comparision, about 37% of the U.S. margin is less than 200 m deep, but only 2% of the 0–100 m depth range, and only 12% of the 100–200 m range has been mapped by multibeam sonar with water column coverage (Table 1, Supplementary Figures S1B and S2).
To avoid duplicate counts of bubble streams discovered in multiple datasets, the bubble streams were clustered into bubble emission sites and normalized in two different ways (See Supplemental Material). First, because all the water column data in the USCMMB inventory have co-registered multibeam seafloor data, only those sites could be normalized based on the percentage of the USCM mapped (Figure 7C; Table 1). Even though only a small percentage of the shallow water portion of Cascadia (<200 m) has co-registered seafloor-water column data, there is a large peak in the histogram in the 100–200 m range. Second, the emission site counts were normalized based on the area of the USCM per 100 m depth interval, after Johnson et al. (2015). In just the USCMMB data, two distinct peaks found in the un-clustered data (individual bubble streams) are still present in the clustered (emission sites) normalized histogram (Figure 7D). One of those peaks is in the 100–300 m depth range and the other peak is between 400 and 600 m. Figure 7E shows a normalized histogram produced similarly that includes the USCMMB data, the Riedel et al. (2018), and Johnson et al. (2015) data on the US margin. Similar peaks in the histogram are evident in the 100–300 m, and 400–600 m depth ranges.
Approximately 75% of the bubble emission sites in this inventory of the USCM occur within the shelf and upper slope (0–600 m) and only a residual of 25% have been identified in the range from 600 m water depth to the abyssal base of the accretionary prism (Table 1). However, a much greater percentage of the deeper zone below 500 m has been surveyed, so it seems likely that future shallow water depth surveys would increase the ratio of shallow vs. deep sites. In any case, the overarching observation of this study is that the majority of bubble plume sites are near or shallower than the FEMHS, which has also been reported for other continental margins, including the Gulf of Oman (Von Rad et al., 2000), US Atlantic (Skarke et al., 2014), and Svalbard, north of Norway (Sahling et al., 2014). Sites on Cascadia deeper than 525 m all lie below the upper water depth of the regional hydrate stability zone (Hautala et al., 2014; Phrampus et al., 2017) and if sufficient methane is present in the sediment pore fluid, hydrate should exist in the upper layers of the seafloor. However, the emission peak centered at the FEMHS depth of 500 m includes many sites along Washington, northern Oregon and in the vicinity of Rogue Canyon and Coquille Bank (Figures 1A–4A). A higher-resolution depth histogram of the USCMMB emission site data shows well defined distributions of sites centered on, respectively, 150–200 m (Figure 7F), and 465–535 m (Figure 7G). The high percentage of sites located near 500 m raises the question of a possible correlation with the emission depths and the FEMHS (see section “The FEMHS”).
The Continental Shelf
USCMMB, Riedel et al. (2018) and Johnson et al. (2019) data show that the Washington and northern Oregon continental shelfs are “hotspots” for methane seeps (Figures 2, 3). The peak in bubble emission sites at the continental shelf break at 165–200 m (Figure 7F) is heavily weighted toward surveys conducted on the Washington and northernmost Oregon continental shelf, and 19% of the sites in this study for the entire USCM occur within that depth range. The USCMMB coverage in shallow water is limited south of Nehalem Bank so the current data coverage is not adequate for major conclusions regarding the overall distribution of seeps in shallow water along the entire USCM.
The high density of methane emission sites in shallow water depths on northern Cascadia, north of Nehalem Bank (Figures 2, 3), has been ascribed to sources beneath the wide continental shelf underlain by kilometers-thick organic rich sediments deposited during Pleistocene low sea level stands (Riedel et al., 2018; Johnson et al., 2019) have demonstrated that many of the sites on the outer continental shelf along the Washington margin are correlated with listric faults just east of the heads of some of the major submarine canyons (Juan de Fuca, Quillayute and Quinault). In addition, mud/shale diapirs generated within the Melange and Broken Formation of Eocene to Middle Miocene age (Snavely, 1987; McNeill et al., 2000; Johnson et al., 2019) are associated with many of the sites and may provide vertical pathways from the underlying methane source. Johnson et al. (2019) hypothesized that the shallow peak on the outer shelf of Washington, in particular the emission fields parallel to the shelf edge near the submarine canyon heads off Washington (Figure 2), is due to listric faulting and diapirism within a period of intra-seismic extension. There is also evidence for extensive diapirism and listric faulting at shelf and slope depths for portions of the northern Oregon (this study and Snavely, 1987) and southern Oregon margin (Clarke et al., 1985), although existing data are too sparse to generalize to the entire USCM (Figures 1–5).
The FEMHS
The FEMHS on the Washington and northern Oregon portion of Cascadia has been estimated to be between 500 ± 4 m and only slightly deeper on southern Cascadia (Hautala et al., 2014; Johnson et al., 2015), so a statistical peak of seeps at 470–525 m closely brackets that water depth range, with 13% of the sites within that range (Figure 7G). Sites within the 470–525 m peak on the landward edge of the upper continental slope occur along the Washington and large sections of the Oregon margins (Figures 2–4). Our surveys combined with the historic sites only show a few sites within the 470–525 m depth range (Figures 4, 5) on the southern Cascadia segment adjacent to the northern California coastline. We propose that this peak in bubble plume emission site depths arises from gas migrating through the upper sediment column below the impermeable cap formed by the presence of solid hydrate within the sediment pores. This migration continues both vertically and landward until the point where seawater P–T conditions do not facilitate the formation of any solid hydrate, and the disappearance of the impermeable cap allows egress of the methane into the ocean. This is a model previously proposed for other temperate latitude margins including the US East coast (Sharke et al., 2014) and Makran margins (Von Rad et al., 2000). Similar emission site distributions near the regional FEMHS are also found on Arctic margins and could produce a positive correlation between melting permafrost due to a warming environment and an increased methane gas flux as seawater bubble streams. (Kvenvolden et al., 1993; Nimblett and Ruppel 2003; Westbrook et al., 2009; Biastoch et al., 2011; Berndt, et al., 2014; Frederick, and Buffett 2014; Graves et al., 2015; and; Ruppel et al., 2016). Upward migration of buoyant gas beneath an impermeable sediment cap with solid hydrate-filled pore spaces is enhanced by the steep gradients of the seafloor that occur on the continental slope. (Figures 2B–5B).
The emission depth peak that correlates with the FEMHS at 500–510 m in the USCMMB data has a nearly bell-shaped normal distribution curve in the depth-frequency histogram (Figure 7G, red bars). A range of variations and uncertainties in relevant physical variables along the margin can affect the exact FEMHS location producing the stochastic depth distribution of the bubble emission sites near the 500 m isobath. Steep seafloor slopes would amplify this effect and would narrow the concentration of sites located near the FEMHS zone depth. The slope maps of the Washington and Oregon margins (Figures 2B–4B) do appear to show steep topography within this depth range at the slope break. However, our coverage is not uniformly complete, e.g., in some places there are only one or two multibeam survey lines covering the upper slope.
BSRs and Bubble Emission Sites Near the FEMHS
Entire Margin
Along the Cascadia margin, oblique subduction drives compressional folding and thrust faulting normal to the margin as well as NW-SE oriented strike-slip faults between rotational blocks within the forearc (Figures 2A–4A), (Goldfinger and Kulm, 1997; Han et al., 2017; Han et al., 2018). Methane and other hydrocarbons are generated by biogenic and thermogenic processes within the sedimented accretionary wedge. Sediment compression begins on the in-coming abyssal plain, seaward of the deformation front, and high pore pressures have been observed west of the accretionary front, which along the USCM ranges in depth from 3,100 m in the south to 2,450 m in the north, with the exception of a shallower value of 2,500 m just north of the Mendocino FZ in northern California. In the lower margin, methane concentrations may not have reached saturation values in the pore fluid, and methane-enriched fluid flow is diffuse without producing gas phase emissions (Kulm et al., 1986; Salmi et al., 2017). The majority of deep water bubble streams on the Cascadia accretionary prism occur on the northern Oregon margin, in the vicinity of Hydrate Ridge off central Oregon, and on the southern Oregon and northernmost California margin (Figures 3A–5A). These sites are typically located on the summits and/or flanks of the first few anticlinal ridges landward of the deformation front. The area where free gas is present at depth below the methane hydrate layer can be determined by mapping the presence of the BSR on seismic reflection records such as seen in Figures 8A,B, as well as subsequent figures.
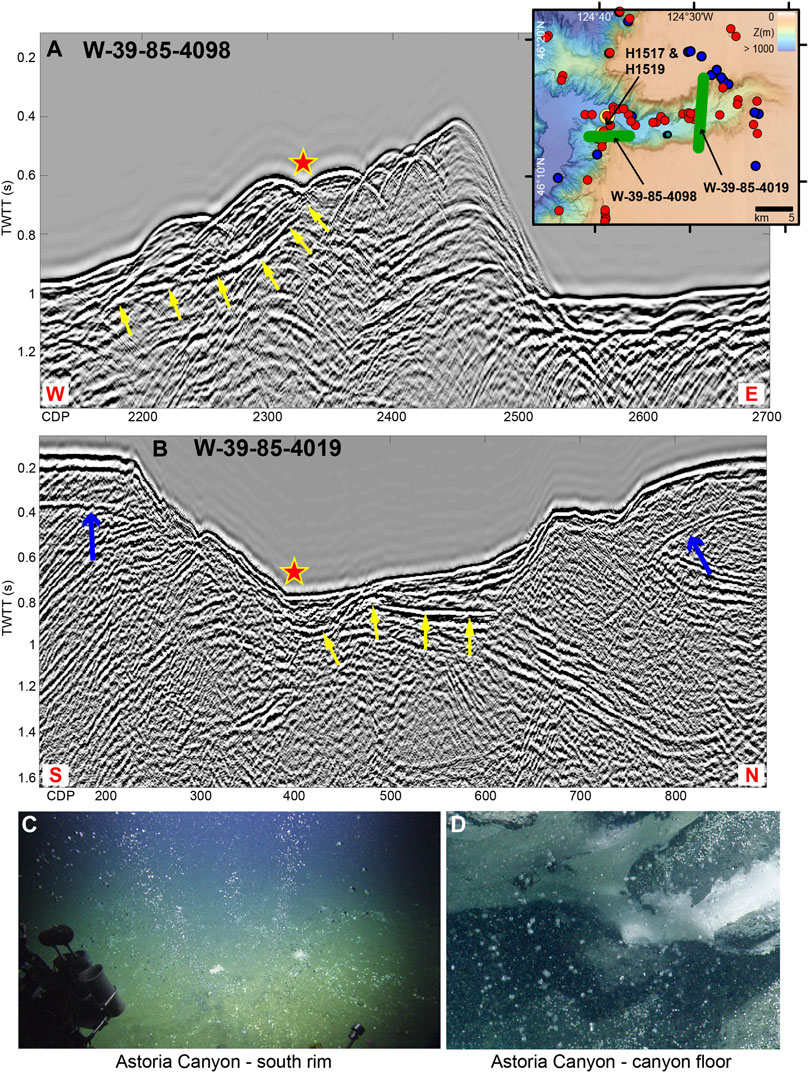
FIGURE 8. MCS profiles across Astoria Canyon (Upper right inset) Green lines show the profiles extent. Red and blue circles indicate bubble emission sites. 2016 ROV Hercules dive sites are noted. Red stars represent methane emission sites. Yellow arrows point to BSR reflectors. (A) W–E MCS profile W-39–85-4,098 (location on inset and Figure 3) at Astoria Canyon over emission sites at ∼500 m, the FEMHS. The BSR reflector intersects the seafloor at the depth of ∼500 m. (B) N–S MCS profile W-39–85-4,019 (location on inset map and Figure 3). Red star marks where the seismic line intersects a cluster of methane emission sites exposed at a depth of ∼575 m water on the canyon floor. Yellow arrows point to probable BSRs. Blue arrows point to acoustic multiples. (C) Vigorous methane bubble streams at site on south rim of Astoria Canyon at ∼500 m: taken with high definition camera on dive H1519. (D) Close-up of methane bubbles stream from beneath layer of methane hydrate (white layer on right side) on the floor of Astoria Canyon at ∼850 m. Taken with high definition camera on dive H1517.
The compilation of archival MCS data in Phrampus et al. (2017) plots the landward limit of the BSRs relative to the FEMHS (Figure 1B). This compilation shows that BSRs present on the upper slope (shallower than 750 m water depth) often correlates with the presence of gas bubble streams at 500 m at the eastern end of the profile. Although the seismic data coverage in the Phrampus et al. (2017) study is incomplete, BSRs reach the upper slope in latitude bands defined by 46.0–47.5°N, 44.0–45.0°N, and 42.5–43.4°N. BSRs can be traced to near the FEMHS on some seismic profiles off northern Oregon, central Oregon in the vicinity of Heceta Bank (Supplementary Figure S4), (Torres et al., 2009), and southern Oregon on the western edge of Coquille Bank (Phrampus et al., 2017). Also, BSRs terminate 15–25 km seaward of the FEMHS in the relatively dense MCS profile coverage between 40.3°N at Cape Mendocino and 42.0°N (Figure 1B).
Within the present inventory, bubble emission sites occurring near the FEMHS are common along much of the Washington and northern/central Oregon margin, generally corresponding to the areas of upper slope BSRs (Phrampus et al., 2017; Salmi et al., 2017). Conversely, they are not present on the upper slope of the northern California margin, where the BSR images appear limited to the lower slope (Supplementary Figure S3). Analyses of some seismic reflection profiles (next section) indicate that the BSR can sometimes be traced up to very near the FEMHS, although the resolution of those data is not precise enough to measure the exact depth of disappearance of the reflector. Our observations are consistent with the concentration of gas plumes at sites near the 500 m isobaths, where there is coincidence of the landward limits of both the FEMHZ and the BSR. We suggest that this is caused by gas migration along the base of the hydrate layer and exiting at the FEMHS.
Washington Margin
Archival MCS coverage on the Washington margin is relatively abundant and the BSR has been mapped onto the mid and upper slope off southern Washington (Figure 1B, Supplementary Figure S3). Johnson et al. (2015), Phrampus et al. (2017), Salmi et al., 2017, and Johnson et al. (2019) previously examined Washington margin bubble stream distribution with respect to the underlying BSR and thus will not be covered in this manuscript. It should be noted that Phrampus et al. (2017) indicate a gap in the BSR distribution between 47.5 and 48.25°N on the Washington margin. Coincidentally, the shelf break bubble emission sites are particularly abundant within that same latitudinal range (Figure 2). Holbrook et al. (2002) and Johnson et al. (2019) suggest that a correlation between the presence of subseafloor BSRs and subsurface methane emission sites are independent factors and that a hydrate/gas interface can occur even when the BSR is not imaged in the seismic profile.
Astoria Canyon
Astoria Canyon is a dynamic environment where several simultaneous geological processes could produce enhanced gas emissions. First, the topography of a canyon concentrates geothermal gradient isotherms directly below the valley (Poort et al., 2007) resulting in higher heat flow through the floor, which distorts the BSR reflectors and causes ‘feather-edge’ methane emissions to occur deeper than the normal FEMHS (Hautala et al., 2014; Salmi et al., 2017). Second, gas accumulating within an over-pressured gas-rich high porosity zone beneath the BSR (Crutchley et al., 2015) would migrate toward the canyon axis (Orange and Breen, 1992) and has been proposed to create hydrofractured pathways for gas egress (Tréhu et al., 2004). An ROV dive within the canyon thalweg at 850 m depth discovered gas bubble streams likely released from the free-gas zone beneath the overlying solid hydrate layer (Baumberger et al., 2018). We think it’s likely that this and other gas plumes in the down-cut section of Astoria canyon are locally controlled by the opening of pathways to permeable sediment horizons by faults beneath the canyon and erosional turbidity currents and slumping of the canyon walls (Figure 3).
Acoustically bright bubble streams were identified on the south rim of Astoria Canyon near the 500 m isobath where an E-W MCS profile (W-39_4,098; Figure 8A) shows a shoaling BSR. This and other BSRs discussed below were identified by the acoustic wave polarity reversal relative to the seafloor reflection, which is characteristic of BSRs. The BSR is detectable up to/near the FEMHS at 500 m (0.68 s two-way travel time). A Hercules remotely operated vehicle (ROV) dive there in 2016 found a number of steady-state, high-flux bubble streams (Figure 8C), (Embley et al., 2017; Baumberger et al., 2018; Seabrook et al., 2018).
Almost all the canyon-parallel clusters of bubble emission sites occur within the portion of the canyon that is incised into the continental shelf, down to a water depth of 700 m. Within the shelf, gas emissions occur along the canyon thalweg and near the base of the canyon walls. The complex topography of the canyon produces East–West oriented MCS images that are difficult to interpret due to 3D topographic effects. However, several archival North–South MCS lines oriented orthogonal to the canyon thalweg provide a vertical cross-section through margin sediments that contain BSR images associated with known active methane emission sites. Figure 8B shows one of these North–South profiles (W-39–85–4,019) that intersects a cluster of methane emission sites exposed at 577 m water depth on the canyon floor.
Astoria Canyon is a dynamic environment where several simultaneous geological processes could produce enhanced gas emissions. First, the topography of a canyon concentrates geothermal gradient isotherms directly below the valley (Poort et al., 2007) resulting in higher heat flow through the floor, which distorts the BSR reflectors and causes ‘feather-edge’ methane emissions to occur deeper than the normal FEMHS (Hautala et al., 2014; Salmi et al., 2017). Second, gas accumulating within an over-pressured gas-rich high porosity zone beneath the BSR (Crutchley et al., 2015) would migrate toward the canyon axis (Orange and Breen, 1992) and has been proposed to create hydrofractured pathways for gas egress (Tréhu et al., 2004). The concentration of gas plumes in this down-cut section of the canyon could be controlled by the outcropping of permeable sediment horizons and/or faults within the canyon. Finally, erosional turbidity currents and slumping of the canyon walls can also create new pathways. An ROV dive within the canyon thalweg at 850 m discovered gas bubble streams venting from beneath a layer of methane hydrate that probably exposed one of the permeable horizons (Figure 8D). The gas bubble emissions at a depth of 850, 350 m below the FEMHS, could be coming from the free-gas zone beneath the overlying solid hydrate layer (Baumberger et al., 2018), or from canyon-enhanced currents such as have been documented for erosion of seafloor hydrate in Barkley Canyon (Thomsen et al., 2012).
Northern Oregon Margin–Astoria Canyon to Heceta Bank
On the N–S multibeam transits between Astoria Canyon and southern Heceta Bank, more than 60 gas emission sites were detected at or near the 500 m isobath (Figure 3). Although USCMMB selectively surveyed along the 500 m depth contour, the Riedel et al. (2018) east-west fisheries sonar lines also include about a third of the total number of detected seep sites along this section within the same depth range. In comparison with other areas of the Cascadia margin where we purposely surveyed along the 500 m isobath, this area appears to be a “hotspot” for 500 m emission sites, continuing the trend from the Washington margin. Most of these sites are located within areas of high amplitude backscatter associated with seafloor carbonate deposits, which also are associated with methane emissions (Kulm and Suess, 1990; Carson et al., 1994; Johnson et al., 2003). Many of the bubble emission sites in this region overlie diapirs apparent in the MCS data on steep local slopes. In one location (∼44°52′N), bubble emission sites are concentrated within a large (1.5 km diameter) depression (Figure 9) in an area of high acoustic backscatter that covers an extensive area of the upper slope. The concentration of methane bubble emission sites associated with the depression near the FEMHS appears to implicate dissociating methane hydrate, similar to those described by Paull et al. (2014). A well-defined BSR approaches the emission site on an MCS profile shown in Tréhu et al. (1995). Active diapirs in this area (Profile W-29–80–26; Figure 10) could cause uplift, triggering dissociation of hydrate, breaching of the impermeable cap overlying the free gas zone, with the resulting expulsion of gas creating the carbonate-rimmed pockmarks similar to those described elsewhere (Hovland et al., 1987; Salmi et al., 2011; Skarke et al., 2014). The steep local seafloor slopes in this region (Figure 3B) would enhance lateral landward migration of gas beneath the BSR and emissions near the FEMHS.
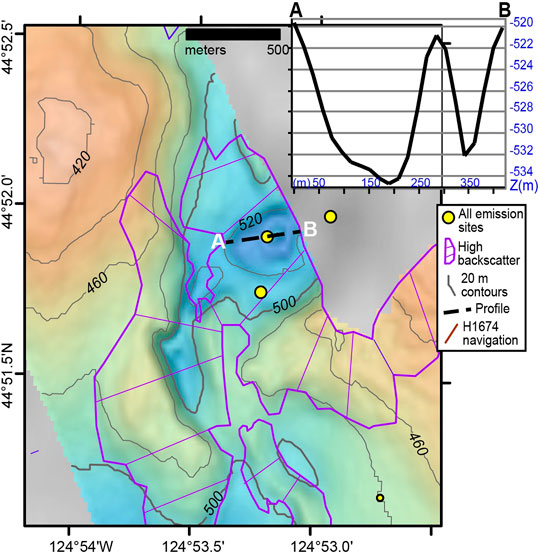
FIGURE 9. Possible pockmark on the Oregon margin with several bubble emission sites within and on the rim of the depression. Emission sites (yellow dots) at/near the 500 m FEMHS zone. Areas of high backscatter delimited by purple outline and hatch lines. Upper right inset is a profile over the collapse. EM302 bathymetry overlaid on background grid depicts the 14 m dip on the western edge of the depression, a mound in the center and another 12 m dip on the eastern edge.
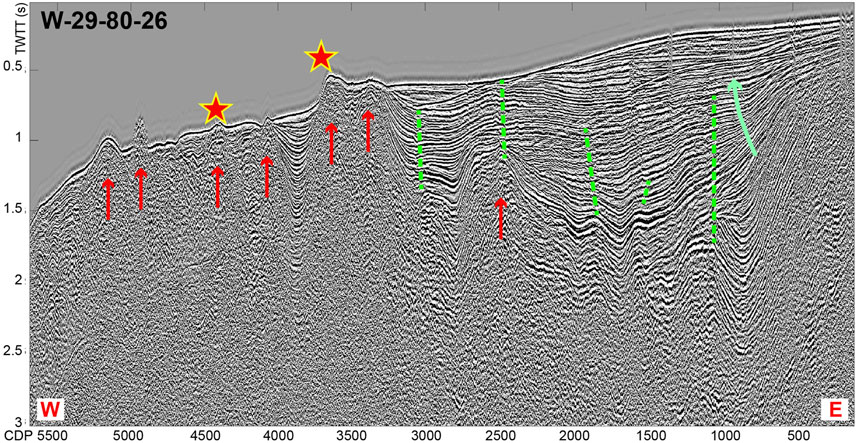
FIGURE 10. West-to-east MCS profile W-29–80–26 north of Newport on the central Oregon margin (see Figure 3A). Red stars represent methane emission sites. Red arrows are diapirs with gas blanking apparent. Green dashed lines are offsets of sediment layers due to faulting. There is clear evidence of upward migration of diapirs that result in nearby venting at 500 m (∼CDP 3700) and 730 m (∼CDP 4400) water depth. Listric faulting is evident in the fanning of sediment layers near the landward (right) side of profile where the green arrow shows rotation and seaward thickening of sediment layers. The faults adjacent to the diapirs illustrate that the diapirs are being thrust upward. The listric faults shown as green dashed lines at the landward edge of the profile suggest long-term post-seismic extension of the upper margin–similar to the WA margin (Johnson et al., 2019).
Heceta Bank
Bubble emission sites in the vicinity of Heceta Bank occur along the 500 m isobath and on the summit of the topographic high bank in water depths as shallow as 80 m (Figure 3). Heceta Bank is a remnant of the outer high formed by underthusting of sediments (Kulm and Fowler, 1974; Fleming and Trehu, 1999). Pockmarks are common on the seaward slope between 150 and 400 m. Analysis of carbon isotopes from ROV-recovered authigenic carbonate samples show a mixed biogenic and thermogenic signature (Torres et al., 2009). Visual exposures of methane hydrate deposits were found in small depressions in association with bubble streams and concentrations of tubeworms, clams, microbial mats and other chemosynthetic life (Embley et al., 2017; Baumberger et al., 2018). Vigorous bubble streams were found during ROV dive H1677 (Figure 3B) at 500 m water depth at the head of the small canyon at the northwest corner of the bank (44°50′N). A MCS profile (W-29–80–18; Supplementary Figure S4) just to the south of this site shows a shallowing of the BSR to 600 m, and sediment slope failures that suggest long term instability in this area (Trehu et al., 1995; Torres et al., 2009), which is within the headwall region of the Heceta megaslide (HS; Figure 3) which were described in previous studies (Goldfinger et al., 2000).
Another bubble emission site just south of Heceta Bank (43°52.5′N:124°55.6′W) at ∼500 m was visited in 2001 by the ROPOS ROV (Torres et al., 2009), and bubble streams were observed within a large seep and carbonate area. Analysis of the carbonates revealed that one carbonate sample from that site is likely sourced from dissociated methane hydrate. Our observations of additional dense gas bubble streams and high flux seafloor vents along the 500 m isobath bounding Heceta Bank supports the Torres et al. (2009) hypothesis of a relationship between long-term seafloor uplift and dissociation of hydrate as a possible cause of slope instability in the Heceta Bank region.
Southern Oregon—Heceta Bank to Rogue Canyon
South of Heceta Bank, bubble stream emission sites are sparsely distributed along the NA072 traverses that bracket the 500 m isobath. However, one of these sites appears to be a mud volcano (at 43°41′N) (Figures 4A, 11). The bubble streams are sited near/on a truncated 1 km diameter cone rising 80 m from a base at 500 m water depth. There is a diapir-like structure beneath this feature (westernmost side of Figure 10 of Clarke et al., 1985), and this morphology is interpreted as a constructional feature built by fluidized, gas-rich, over-pressured sediment flowing from a central vent (Brown, 1990; Dimitrov, 2002). An ROV dive (H1674) in 2018 (Figure 4B) identified extensive carbonate deposits and seeps on the flank and summit (Baumberger et al., 2019). A cluster of bubble emission sites is also located on a previously active diapir located 12 km SW of the mud volcano site at 480–750 m depth (Clarke et al., 1985).
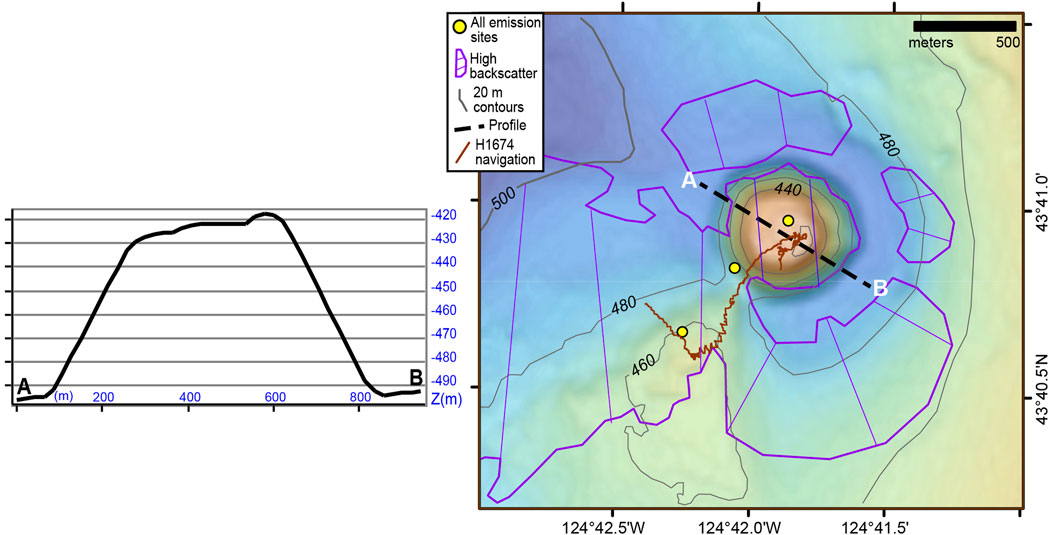
FIGURE 11. Mud volcano on the Oregon Cascadia margin. The profile to the left indicates that the feature rises ∼80 m from a moat-like surrounding circular depression. The mud volcano and surrounding seafloor exhibit high backscatter values, with the exception of the depression that flanks the feature. Emission sites (yellow dots) at/near the 500 m FEMHS zone. Areas of high backscatter delimited by purple outline and hatch lines.
To the south, on the western edge of Coquille Bank, there are two linear N–S arrays of 13 (northern) and 21 (southern) emission sites that closely follow the 500 m FEMHS isobath (Figures 4A, 12A), which is the approximate location of the landward edge of the BSR over much of the margin. Several well-defined slide scars and slump masses occur west and downslope of these sites, and the high backscatter patches (Figure 12B) of presumptive carbonate deposits overlap much of the slope encompassing the bubble emission sites, suggesting long-term methane venting. Profile W-39–85-4,222 (Figure 13A and inset) crosses the southern cluster of 500 m sites and indicates that the BSR continues up to near the 500 m water depth, where the emission sites are concentrated, suggesting that a substantial sub-surface gas reservoir is being tapped.
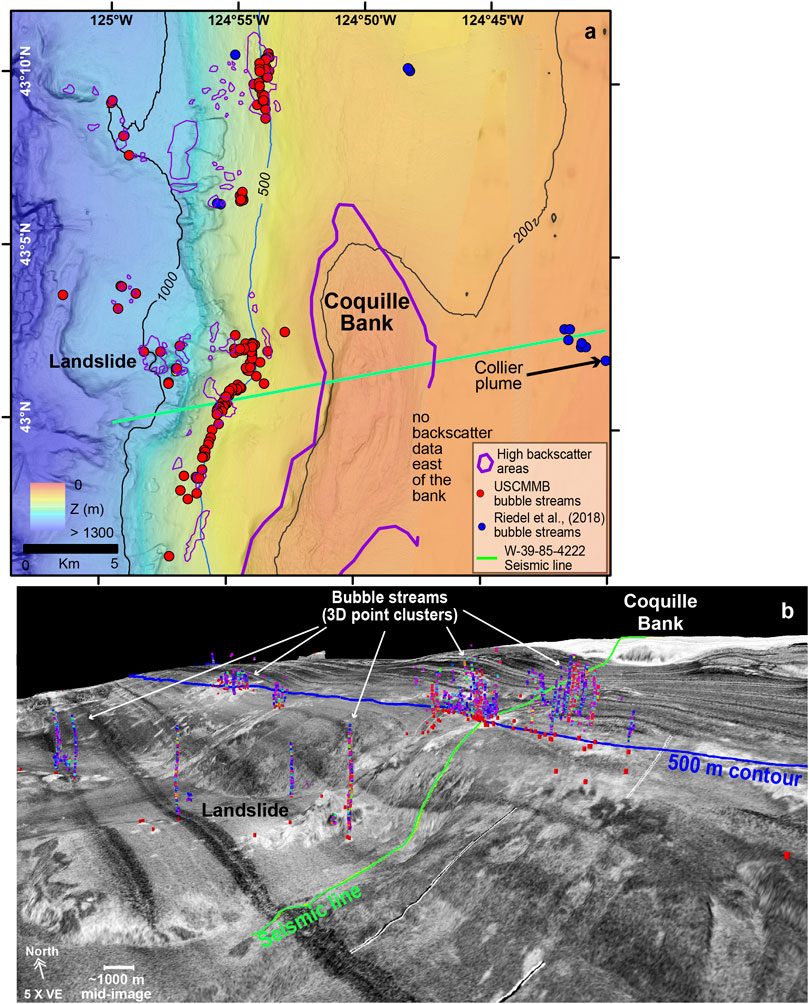
FIGURE 12. 2D and 3D images of Coquille Bank in an area of an unusual number of bubble streams along the 500vm contour. (A) 2D north-up map of central-northern Coquille Bank and shelf. Red and blue circles are individual bubble streams, which range in depth from <200 to >1,000 m. Landslide features are evident along the slope. The green line represents MCS profile W-39–85-4,222 across the seeps (Figure 13A). Purple polygons define areas of high acoustic backscatter. (B) 3D view of EM302 bathymetry of Coquille Bank overlaid with seafloor backscatter, as viewed from the southwest looking onto area of (A). Red cylinders on the seafloor are individual bubble stream locations. High amplitude bubble streams are characterized as 3D point clusters rising from the seafloor into the water column. The 500 m contour (blue line) and seismic line (light green line) are shown. White patches in the backscatter data are indicative of harder substrate and may represent areas of carbonates. 5 times vertical exaggeration.
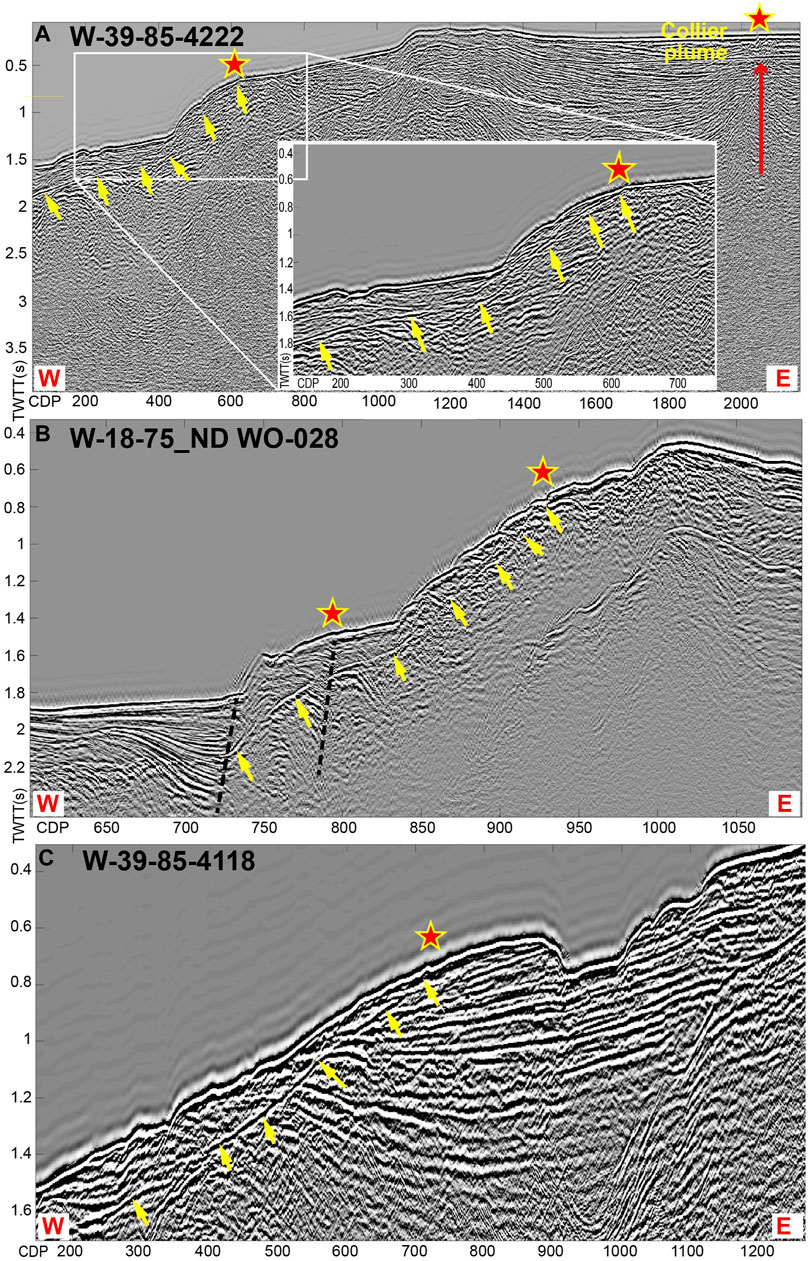
FIGURE 13. MCS profiles across Coquille Bank and Rogue Canyon, southern Oregon margin. Red stars represent methane emission sites. Yellow arrows point to BSR reflectors. (A) W–E MCS profile W-39–85–4,222 across Coquille Bank (Figures 4A, 12). Emission at east (right) end of profile (156 m water depth) is site of a submersible study by Collier and Lilley (2005). Location on Figure 11A. Note large diapir rising beneath this site (red arrow) with interior gas wipe-outs. Seaward site is at the FEMHS. Right lower center image is a blow up of BSR shoaling to the feather edge at 483 m. (B) MCS profile W-18–75_ND-28 across southern Coquille Bank (Figure 4A). This profile has a BSR that ends at 500 m water depth (∼CDP 925), with a bubble emission site nearby. The deeper bubble emission site is at 1,067 m water depth (∼CDP 780) and appears co-located with a fault (black dashed line at CDP 780)—and the fault intersects and disrupts the BSR. There is another fault at the base of the slope where the sediment layers fan out, suggesting rotation on a listric fault (black dashed line at CDP 725).
Placed within a regional context, sites on the western edge of Coquille Bank are along the proposed headwall area of a large mega-slide, the Coos basin slide (CBS) (Figure 4A), that was dated at 450 Ka. by Goldfinger et al. (2000). This is one of several mega-slides mapped by the extent on their slump deposits buried in the Cascadia basin. Goldfinger et al. 2000 also propose that the mega-slides account for the disrupted topography in this area, specifically the absence of accretionary anticlinal ridges that are found north of Heceta Bank and between the Rouge and Trinidad Canyons. The numerous recent slide scars and slump masses, and the wave-cut strata of Coquille Bank on the shelf, are manifestations of both long- and short-term uplift in this region (Kulm and Fowler, 1974; Burgette et al., 2009).
Bubble emission sites on the upper slope southwest of Coquille Bank (42°45′N) lie within the area of the Blanco mega-slide (BS), which is dated at 1,209 ± 112 Ka by Goldfinger et al. (2000) (Figure 4A). This area is geologically complex, with seep sites occurring from 400 to 1,100 m depth. The slope is disrupted by numerous slide scars and erosional channels at scales from <1 to 10 km. The E–W MCS profile through the emission site clusters (W-18–75-ND-28; Figure 13B) shows a BSR shoaling to the FEMHS that coincides with an active bubble emission site. Slump topography is also present on the upper slope in this area with faults present on the lower slope, one of which is coincident with a bubble emission site. Helium-3 anomalies in the bubble stream fluid samples taken from this site are consistent with deep faulting on the upper slope (H1521; Figure 4B), (Baumberger et al., 2018). Future 3D seismic studies will assist in determining the depth of the faulting, which is most likely connected to mantle rock because of the Helium-3 signal.
Southern Cascadia Margin–Coquille Bank to Cape Mendocino
South of Coquille Bank, the Rogue Canyon area lies within the southern half of the Blanco mega-slide (BS; Figure 4A) and contains scattered bubble emission sites associated with sediment slope failures and sediment channels. Several emission sites occur on the west wall of the largest of the Rogue Canyon channels where a prominent BSR shoals near the FEMHS at 500 m (profile W-39–85-4,118; Figure 13C); a pattern similar to other profiles discussed previously from the Oregon margin. The Rogue Canyon area is approximately at the latitude where the landward extension of the BSR moves seaward (Figure 1B), (Phrampus et al., 2017).
Our multibeam coverage between Rogue Canyon and Trinidad Canyon is dense on the middle and lower continental slope at depths greater than 600 m, but is sparse on the upper slope and continental shelf (Figures 4A, 5A). Our USCMMB survey bracketed the 500 m isobath, but did not detect any sites except on the wall of the Rogue Canyon. In this area, a significant extent of mid-lower continental slope (>600 m) is associated with large N-S tectonic thrust ridges, many of which are covered with high acoustic backscatter seafloor reflections and bubble emission sites on their crest or sides. Several dives with the Hercules ROV in this area in 2016 and 2018 (H1522, H1523, and H1669; Figure 4B) reveal that these zones are covered by extensive carbonate pavements.
Although the USCMMB between Trinidad Canyon and Cape Mendocino has sparse overall multibeam coverage, we again surveyed along the 500 m isobath through this region (Figure 5A). Even with these new data, only a small number of sites on/near the FEMHS have been identified, in contrast with the rest of Cascadia margin. This is consistent with the seaward shift of the landward limit of the BSR in this region (Figure 1B), (Phrampus et al., 2017).
This southernmost area of Cascadia margin is impacted by the tectonic influence of the Mendocino triple junction, which is the intersection of the San Andreas transform fault, the Mendocino transform fault linking to the Gorda ridge, and the Cascadia subduction zone (Figures 1A, 5A). Because of the proximity of the triple junction, this is the only area of the Cascadia margin with high levels of historical seismicity (Furlong and Schwartz, 2004; Dziak et al., 2011). High erosion rates from rapid uplift in the adjacent California coast range drain sediment through several large submarine canyons that are incised into the continental shelf and slope, producing substantial forearc basin deposits (Eel river basin) and a deep-water sediment fan (Eel fan) seaward of the accretionary front (Puig et al., 2003). The combination of high sedimentation and high seismicity results in chronic sediment slope failures. As an example, the Humbolt slide was a well-studied sediment failure triggered on the upper margin slope by a large earthquake in 1980, after which excess rates of gas were released into the overlying water column (Field and Jennings, 1987). Numerous bubble streams have been mapped on the continental shelf by Yun et al. (1999) between Trinidad head and Eel Canyon. Bubble streams occur at known seep sites near the 500 m isobath (Orphan et al., 2004; Levin, 2005) and near and within adjacent areas where hydrate has been cored near the seabed (Kennicutt et al., 1989; Brooks et al., 1991). In deeper water, clusters of bubble emission sites and seeps are located in several large sediment failures on the walls of Eel Canyon and on the adjacent accretionary front to the south between 1750 and 2073 m (Figure 5A), (Gardner et al., 2009; Paull et al., 2014). Hydrate was also found on the seafloor in the headwall region of one of these slides (Paull et al., 2014) and was sampled on Hercules dive H1668 in the same area (Baumberger et al., 2019), (Figure 5B).
Discussion
The new dataset shows a clear clustering of methane emission sites centered on the FEMHS along the majority of the along-strike length of the Cascadia margin. The depth of the FEMHS is the limit above which there is no impermeable hydrate barrier to prevent the egress of gas into the ocean, and gas seep sites appear to be concentrated at this boundary. The association of methane seeps and carbonate pavements with most of the 500 m sites indicates that fluid emissions through the sediment-water interface have been occurring for 100–1,000s of years at these locations and within this narrow 500 m depth range (Teichert et al., 2003), and are unlikely to be the result of a recent environmental change (Hautala et al., 2014).
One possible explanation for this observation is the common occurrence of the regional BSR shoaling very close to the FEMHS at the location of the MCS profile (Figures 1B, Supplementary Figure S3). The presence of the BSR is an observation of the presence of free gas below the solid hydrate in the sediment pore spaces, rather than the P–T conditions that allow for the theoretical presence of significant free gas. The existence of this sub-seafloor barrier suggests that free gas collects and migrates beneath the lower surface of the hydrate layer. This upward and landward migration of free gas into shallower depths is then emitted into seawater at the first available exit point permitted by the P–T conditions. This pattern has been observed at other temperate continental margins such as the US East coast (Skarke et al., 2014) and Makran (von Rad, 2000) and on the Arctic margin of Svalbard (Westbrook et al.,2009), although the latter also has significant seasonal temperature variations. One other prediction from this hypothesis is that sites at the FEMHS will be more vigorous and less time variable, because of a steady-state supply of gas generated over a wide area of the margin surface and then concentrated along the pressure gradient. The presence of bubble streams along the 500 m isobaths means the methane is sufficiently concentrated for gas ebullition rather than diffuse flow. The presence of diapirs and faults underlay and steepen the continental slope along Cascadia, and this topography would serve to enhance gas migration landward along the Washington and Oregon margin (Johnson et al., 2019 and this study).
The FEMHS 500 m isobath zone is a key boundary in assessing the potential for increased mass flux of methane to the seafloor and water column due to ocean warming that might cause increased hydrate dissociation along the FEMHS (Westbrook et al., 2009; Hautala et al., 2014; Darnell and Flemings, 2015; Johnson et al., 2015; Ruppel and Kessler, 2017). There are some well-constrained examples of previous long-term warming moving the BSR upward in the sedimentary column (e.g., Bangs et al., 2010), therefore as the current ocean warming trends continue, some movement of this thermal stability limit is likely. For example, Phrampus and Hornbach (2012) modeled significant changes in the course of the Gulf Stream in the western Atlantic due to warming. Our data show what appears to be a normal distribution of sites centered on the 500 m isobath, which constitutes the FEMHS for the Cascadia margin. Although additional data are necessary to support this interpretation, long-term monitoring of this boundary, especially where the BSR approaches the FEMHS, could benefit from resurvey(s) of the 500 m isobath to identify deviations from the normal distribution curve. We estimate that a shipborne survey with two multibeam lines along the 500 m isobath on Cascadia margin (about 1 week of ship time plus transits) on a decadal schedule could effectively monitor this boundary. Where well-defined BSRs are present up to or near the FEMHS, high resolution seismic resurveys could be used to monitor shifts in the landward edge of the BSR.
Summary/Conclusion
We have compiled an inventory of methane gas emission sites from dedicated multibeam surveys (USCMMB) and recently published archival data across the full along-strike length of the US portion of the Cascadia margin. For the USCMMB data inventory, the distribution of bubble emission sites on the US Cascadia margin, when normalized to the survey coverage and area of depth intervals, reveals two primary populations of methane seep peaks, one at continental shelf depth centered at 175 m, and the other closely bracketing the upper limit of the FEMHS at 500 m.
Cascadia methane plumes are extraordinarily abundant and appear to have clearly identifiable origins; 1) on the continental shelf, upward migration from sediment loading is enhanced and localized by specific fault zones. 2) at the continental shelf edge, the abundance of plume sites follows the deep westward reaction faulting that follows and is associated with megathrust faulting of the Cascadia Subduction Zone (Wang and Hu, 2006; Wang et al., 2012; Johnson et al., 2019). 3) At the FEMHS, roughly 500 m water depth, the concentration of methane plumes appears associated with the disappearance of the solid hydrate cap, which allows the migration of methane gas through the sediments at the P–T equilibrium point for Cascadia.
The remaining plumes are sparsely distributed on the lower margin between the 500 m isobath and the deformation front do not have a clearly understood source region, although studies on the Oregon margin have correlated the active plume sites and tectonic faults on the lowermost margin tip. It is significant, but not yet understood why there are no methane plumes deeper or westward of the deformation front, although multiple surveys have been conducted in this area. Clearly, sediment loading, methane gas buoyancy and the faulting associated with the formation of an active margin from previously undisturbed sediments combine to produce a very complex system that produces an abundance of methane vents on the Cascadia margin.
Overall, 75% of bubble emission sites occur on the upper slope and shelf at less than 600 m water depth, with 25% in deeper water. Many of the deeper sites on the middle and lower slope (>525 m) are coincident with major compressional anticlinal and diapiric ridges within the accretionary prism. With more surveys, the ratio of shallow to deep sites is predicted to increase, since only 14% of the shallow areas less than 200 m depth has been surveyed. These results are similar to recent summaries of historical data along other parts of the Cascadia by Johnson et al. (2015, 2019) and Riedel et al. (2018). The distribution of bubble emission sites along the Cascadia margin as a whole is consistent with free gas emissions occurring predominantly at or immediately shallower than the upper limit of the FEMHS, which has also been observed at other continental margins.
The statistical peak of emission site depths centered on the FEMHS is striking. Looking at the USCMMB and fisheries sonar data (Riedel et al., 2018) where they overlap from 48.0° to 43.5°N, sites within the narrow depth range of 475–525 m are common on the Washington and Oregon margin but are sparse within the Northern California segment. Even if recent anthropogenic warming at the depth of the FEHMS is presently dissociating hydrate to some degree (Johnson et al., 2015), the association of methane-mediated carbonate deposits with many of the 500 m sites indicates that gas emissions through the sediment-water interface have been occurring for 100s–1000s of years within this depth range.
Gas outflow occurring at the depth of the FEMHS is likely because the thermal dissolution of solid hydrate in sediment pore spaces would allow free gas egress to the ocean. The Cascadia margin is an example of where methane in the gas phase can migrate beneath the impermeable cap of hydrate-filled sediment pores within the free gas zone below the BSR. This capped upward flow is also concentrated along structures such as rising diapirs and faults, with amplification along steep topographic slopes and moving landward until the P–T conditions do not facilitate the formation of solid hydrate, allowing egress of methane through the sediments into the ocean. An anthropogenic warming ocean would induce seaward migration of the FEMHS in the future, a process that could be monitored by geophysical techniques now in hand.
Data Availability Statement
Information on data availability for each of the multibeam surveys is provided in the Supplemental Material document, section II: Metadata–Multibeam Water Column Data Expeditions, Data Availability, Data Analysis and Credits. Raw multibeam data can be downloaded at Rolling Deck to Repository (R2R) as well as at NOAA National Centers for Environmental Information (NCEI) for all surveys except those on the R/V Nautilus. The positions of individual bubble streams and clustered emission sites for all the water column data will be available for download on the NOAA EOI website at the time of publication. https://www.pmel.noaa.gov/eoi/Cascadia-margin.html. Multi Channel Seismic (MCS) data, which are publicly available at the U.S. Geological Survey (USGS) website: https://walrus.wr.usgs.gov/namss/.
Author Contributions
SM co-wrote the manuscript with RE and HPJ. SM post-processed multibeam seafloor and water column data for expeditions TN265, NA070, NA072, NA078 and RR1712. SM performed statistical analysis on all the multibeam datasets and combined the Riedel et al. (2018) bubble stream data with the USCMMB data for additional analysis. SM created the figures and tables in the manuscript, and participated in NA072 and NA078 expeditions at sea. RE was lead scientist on the NA072 expedition wrote portions of sections describing and interpreting the pattern of methane seeps on within the context of the regional and local geology. HPJ analyzed the seismic profiles utilized in several figures. BP enhanced the manuscript with his previous work on the BSR seismic database and contributed data for figures in the manuscript, modified from Phrampus et al. (2017). T-KL clustered the individual bubble streams into 300 m seep emission sites. NR was expedition leader on NA072 and NA078. NR contributed to the processing of seafloor and water column data on both expeditions. LG was expedition leader on NA080 and NA088. LG contributed to the processing of seafloor and water column data on both expeditions.
Funding
We thank the NOAA Office of Exploration and Research (OER) for funding scientific personnel and post-expedition data analysis for E/V Nautilus expeditions NA072, NA078, NA080 and NA088. Ship time for those Nautilus expeditions was funded by Ocean Exploration Trust (OET) and OER. Additional funding for RWE, SGM, Tamara Baumberger and Camilla Wilkinson work on Cascadia margin provided by NOAA Pacific Marine Environmental Laboratory (PMEL). Support for this study was also supplied by the NOAA Earth-Ocean Interactions (EOI) Program and the Cooperative Institute for Marine Resources Studies (CIMRS) under NOAA Cooperative Agreement No. NA110AR4320091.
Conflict of Interest
The authors declare that the research was conducted in the absence of any commercial or financial relationships that could be construed as a potential conflict of interest.
Acknowledgments
We are grateful to the team on the E/V Nautilus for their assistance during the NA072 ROV expedition, and at-sea data processing and analysis performed by the OET mapping team on all E/V Nautilus expeditions. Special thanks for the assistance and support provided by Tamara Baumberger (OSU/NOAA EOI) both during NA072 and as chief scientist on NA095, and for providing guidance on this manuscript. HPJ and Erica Sampaga (Univ. of Washington) processed water column multibeam data from the NOAA ship Rainier expedition 1605RA, with ship time supported by the NOAA Olympic Coast Marine National Sanctuary. Thanks as well to the crews and scientific party, Chris Romsos (OSU) chief scientist, on the R/V Thompson for collecting seafloor and water column data during the TN265 expedition. Also thanks to chief scientist Bill Chadwick (NOAA EOI) and the crew of the R/V Revelle for collecting seafloor and water column data on the margin during the RR1712 expedition. Informative discussions with Anne Trehu and Marta Torres on Cascadia margin seeps were important in the cruise planning for NA072. William W. Chadwick, and Jeff Beeson provided valuable edits to the manuscript. The USGS MCS data were downloaded from this website: https://walrus.wr.usgs.gov/namss/survey. PMEL Contribution Number: 5060.
Supplementary Material
The Supplementary Material for this article can be found online at: https://www.frontiersin.org/articles/10.3389/feart.2021.531714/full#supplementary-material.
References
Archer, D. (2007). Methane hydrate stability and anthropogenic climate change. Biogeosciences. 4 (4), 521–544. doi:10.5194/bg-4-521-2007
Bangs, N. L. B., Musgrave, R. J., and Tréhu, A. M. (2005). Upward shifts in the southern Hydrate Ridge gas hydrate stability zone following postglacial warming, offshore Oregon. J. Geophys. Res. 110, 39. doi:10.1029/2004JB003293
Bangs, N. L., Hornbach, M. J., Moore, G. F., and Park, J.-O. (2010). Massive methane release triggered by seafloor erosion offshore southwestern Japan. Geology 38, 1019–1022. doi:10.1130/G31491.1
Baumberger, T., Embley, R. W., Merle, S. G., Lilley, M. D., Raineault, N. A., and Lupton, J. E. (2018). Mantle‐derived Helium and multiple methane sources in gas bubbles of cold seeps along the Cascadia continental margin. Geochem. Geophys. Geosyst. 19, 4476–4486. doi:10.1029/2018GC007859
Baumberger, T., Merle, S. G., Wilkinson, C., Roe, K., Buck, N., Embley, R. W., et al. (2019). further exploration of methane seeps on the Cascadia margin. Oceanography 32.(Suppl. 40-41). 1. doi:10.5670/oceanog.2019.supplement.01
Berndt, C., Feseker, T., Treude, T., Krastel, S., Liebetrau, V., Niemann, H., et al. (2014). Temporal constraints on hydrate-controlled methane seepage off svalbard. Science 343 (6168), 284–287. doi:10.1126/10.1126/science.1246298
Biastoch, A., Treude, T., Rüpke, L. H., Riebesell, U., Roth, C., Burwicz, E. B., et al. (2011). Rising Arctic Ocean temperatures cause gas hydrate destabilization and ocean acidification. Geophys. Res. Lett. 38, L08602. doi:10.1029/2011GL047222
Bohrmann, G., Greinert, J., Suess, E., and Torres, M. (1998). Authigenic carbonates from the Cascadia subduction zone and their relation to gas hydrate stability. Geology 26 (7), 1654–1656. doi:10.1130/0091-7613(1998)026<0647:acftcs>2.3.co;2
Brooks, J. M., Field, M. E., and Kennicutt, M. C. (1991). Observations of gas hydrates in marine sediments, offshore northern California. Mar. Geology. 96, 103–109. doi:10.1016/0025-3227(91)90204-h
Brown, K. M. (1990). The nature and hydrogeologic significance of mud diapirs and diatremes for accretionary systems. J. Geophys. Res. 95 (B6), 8969–8982. doi:10.1029/jb095ib06p08969
Burgette, R. J., Weldon, R. J., and Schmidt, D. A. (2009). Interseismic uplift rates for western Oregon and along-strike variation in locking on the Cascadia subduction zone. J. Geophys. Res. 114 (B1), 112. doi:10.1029/2008JB005679
Carson, B., Seke, E., Paskevich, V., and Holmes, M. L. (1994). Fluid expulsion sites on the Cascadia accretionary prism: mapping diagenetic deposits with processed GLORIA imagery. J. Geophys. Res. 99 (B6), 11959–11969. doi:10.1029/94jb00120
Carson, B., Suess, E., and Strasser, J. C. (1990). Fluid flow and mass flux determinations at vent sites on the Cascadia margin accretionary prism. J. Geophys. Res. 95 (B6), 8891–8897. doi:10.1029/jb095ib06p08891
Carson, B. (1977). Tectonically induced deformation of deep-sea sediments off Washington and northern Oregon: mechanical consolidation. Mar. Geol. 24, 289–307. doi:10.1016/0025-3227(77)90073-1
Chapman, R., Pohlman, J., Coffin, R., Chanton, J., and Lapham, L. (2004). Thermogenic gas hydrates in the northern Cascadia margin. Eos Trans. AGU. 85, 361–365. doi:10.1029/2004eo380001
Ciais, P., Dolman, A. J., Bombelli, A., Duren, R., Peregon, A., Rayner, P. J., et al. (2014). Current systematic carbon-cycle observations and the need for implementing a policy-relevant carbon observing system. Biogeosciences. 11, 3547–3602. doi:10.5194/bg-11-3547-2014
Clarke, S. H., Field, M. E., and Hirozawa, C. A. (1985). Reconnaissance geology and geologic hazards of the offshore Coos Bay basin, Oregon. U.S. Geol. Surv. Bull. 1645, 114. doi:10.3133/b1645
Collier, R. W., and Lilley, M. D. (2005). Composition of shelf methane seeps on the cascadia continental margin. Geophys. Res. Lett. 32, L06609. doi:10.1029/2004GL022050
Crutchley, G. J., Fraser, D. R. A., Pecher, I. A., Gorman, A. R., Maslen, G., and Henrys, S. A. (2015). Gas migration into gas hydrate‐bearing sediments on the southern hikurangi margin of New Zealand. J. Geophys. Res. Solid Earth. 120 (2), 725–743. doi:10.1002/2014jb011503
Darnell, K. N., and Flemings, P. B. (2015). Transient seafloor venting on continental slopes from warming-induced methane hydrate dissociation. Geophys. Res. Lett. 42, 10765–10772. doi:10.1002/2015gl067012
Davies, R. J., Yang, J., Li, A., Mathias, S., and Hobbs, R. (2015). An irregular feather-edge and potential outcrop of marine gas hydrate along the mauritanian margin. Earth Planet. Sci. Lett. 423, 202–209. doi:10.1016/j.epsl.2015.04.013
Dimitrov, L. I. (2002). Mud volcanoes—the most important pathway for degassing deeply buried sediments. Earth-sci. Rev. 59 (1–4), 49–76. doi:10.1016/S0012-8252(02)00069-7
Dziak, R. P., Hammond, S. R., and Fox, C. G. (2011). A 20-year hydroacoustic time series of seismic and volcanic events in the Northeast Pacific Ocean. Oceanography 24 (3), 280–293. doi:10.5670/oceanog.2011.79
Egger, M., Riedinger, N., Mogollón, J. M., and Jørgensen, B. B. (2018). Global diffusive fluxes of methane in marine sediments. Nat. Geosci. 11, 421–425. doi:10.1038/s41561-018-0122-8
Embley, R., Raineault, N., Merle, S., Baumberger, T., Seabrook, S., and Hammond, S. (2017). Water column and cold seep exploration of the Cascadia Margin.Oceanogr. Front. Ocean Explor Suppl. 30, 28–30. doi:10.1130/ges00648.1
Ewing, J. I., and Hollister, C. D. (1972). Regional aspects of deep sea drilling in the western north Atlantic. Initial reports of the deep sea drilling project, Vol. 85. Washington: U.S. Government Printing Office, 951–973. doi:10.2973/dsdp.proc.11.132.1972
Field, M. E., and Jennings, A. E. (1987). Seafloor gas seeps triggered by a northern California earthquake. Mar. Geol. 77, 39–51. doi:10.1016/0025-3227(87)90082-x
Fleming, S. W., and Tréhu, A. M. (1999). Crustal structure beneath the central Oregon convergent margin from potential-field modeling: evidence for a buried basement ridge in local contact with a seaward dipping backstop. J. Geophys. Res. 104.(B9), 20431–20447. doi:10.1029/1999jb900159
Frederick, J. M., and Buffett, B. A. (2014). Taliks in relict submarine permafrost and methane hydrate deposits: pathways for gas escape under present and future conditions. J. Geophys. Res. Earth Surf. 119, 106–122. doi:10.1002/2013JF002987
Furlong, K. P., and Schwartz, S. Y. (2004). Influence of the mendocino triple junction on the tectonics of coastal California. Annu. Rev. Earth Planet. Sci. 32, 403–433. doi:10.1146/annurev.earth.32.101802.120252
Gardner, J. V., Malik, M., and Walker, S. (2009). Plume 1400 meters high discovered at the seafloor off the northern California margin. Eos Trans. AGU. 90, 275. doi:10.1029/2009eo320003
Geersen, J., Scholz, F., Linke, P., Schmidt, M., Lange, D., Behrmann, J. H., et al. (2016). Fault zone controlled seafloor methane seepage in the rupture area of the 2010 Maule earthquake, Central Chile. Geochem. Geophys. Geosyst. 17.(11), 4802–4813. doi:10.1002/2016GC006498
Goldfinger, C., Galer, S., Beeson, J., Hamilton, T., Black, B., Romsos, C., et al. (2017). The importance of site selection, sediment supply, and hydrodynamics: a case study of submarine paleoseismology on the Northern Cascadia margin, Washington USA. Mar. Geol. 384, 4–46. doi:10.1016/j.margeo.2016.06.008
Goldfinger, C., Kulm, L. D., McNeil, L. C., and Watts, P. (2000). Super-scale failure of the southern Oregon cascadia margin. Pure Appl. Geophys. 157, 1189–1226. doi:10.1007/s000240050023
Goldfinger, C., Kulm, L. D., Yeats, R. S., McNeill, L., and Hummon, C. (1997). Oblique strike-slip faulting of the central cascadia submarine forearc. J. Geophys. Res. 102, 8217–8243. doi:10.1029/96jb02655
Goldfinger, C., Nelson, C. H., Morey, A. E., Johnson, J. E., Patton, J. R., Karabanov, E., et al. (2012). Turbidite event history—methods and implications for holocene paleoseismicity of the cascadia subduction zone. Corvallis, OR, United States: Oregon State University. Paper 1661–F, 170 p. Available at https://pubs.usgs.gov/pp/pp1661f/. doi:10.3133/pp1661f
Graves, C. A., James, R. H., Sapart, C. J., Stott, A. W., Wright, I. C., Berndt, C., et al. (2017). methane in shallow subsurface sediments at the landward limit of the gas hydrate stability zone offshore western Svalbard. Geochimica et Cosmochimica Acta. 198, 419–438. doi:10.1016/j.gca.2016.11.015
Graves, C. A., Steinle, L., Rehder, G., Niemann, H., Connelly, D. P., Lowry, D., et al. (2015). Fluxes and fate of dissolved methane released at the seafloor at the landward limit of the gas hydrate stability zone offshore western svalbard. J. Geophys. Res. Oceans. 120, 6185–6201. doi:10.1002/2015jc011084
Greinert, J., Lewis, K. B., Bialas, J., Pecher, I. A., Rowden, A., Bowden, D. A., et al. (2010). methane seepage along the hikurangi margin, New Zealand: overview of studies in 2006 and 2007 and new evidence from visual, bathymetric and hydroacoustic investigations. Mar. Geology. 272, 6–25. doi:10.1016/j.margeo.2010.01.017
Han, S., Bangs, N. L., Carbotte, S. M., Saffer, D. M., and Gibson, J. C. (2017). Links between sediment consolidation and Cascadia megathrust slip behaviour. Nat. Geosci. 10, 954. doi:10.1038/s41561-017-0007-2
Han, S., Carbotte, S. M., Canales, J. P., Nedimović, M. R., and Carton, H. (2018). Along‐trench structural variations of the subducting juan de fuca plate from multichannel seismic reflection imaging. J. Geophys. Res. Solid Earth. 123 (4), 3122–3146. doi:10.1002/2017jb015059
Hautala, S. L., Solomon, E. A., Johnson, H. P., Harris, R. N., and Miller, U. K. (2014). Dissociation of cascadia margin gas hydrates in response to contemporary ocean warming. Geophys. Res. Lett. 41 (23), 8486–8494. doi:10.1002/2014GL061606
Holbrook, W. S., Gorman, A. R., Hornbach, M., Hackwith, K. L., Nealon, J., Lizarralde, D., et al. (2002). Seismic detection of marine methane hydrate. Lead. Edge 21 (7), 686–689. doi:10.1190/1.1497325
Hong, W.-L., Torres, M. E., Portnov, A., Waage, M., Haley, B., and Lepland, A. (2018). Variations in gas and water pulses at an arctic seep: fluid sources and methane transport. Geophys. Res. Lett. 45, 4153–4162. doi:10.1029/2018gl077309
Hope, C., and Schaefer, K. (2016). Economic impacts of carbon dioxide and methane released from thawing permafrost. Nat. Clim. Change 6 (1), 56–59. doi:10.1038/nclimate2807
Hovland, M., Talbot, M. R., Qvale, H., Olaussen, S., and Aasberg, L. (1987). Methane-related carbonate cements in pockmarks of the North Sea. J. Sediment. Res. 57 (5), 881–892. 10.1306/212F8C92-2B24-11D7-8648000102C1865D
Johnson, H. P., Merle, S., Salmi, M., Embley, R., Sampaga, E., and Lee, M. (2019). Anomalous concentration of methane emissions at the continental shelf edge of the northern cascadia margin. J. Geophys. Res. Solid Earth 124, 2829. doi:10.1029/2018JB016453
Johnson, H. P., Miller, U. K., Salmi, M. S., and Solomon, E. A. (2015). Analysis of bubble plume distributions to evaluate methane hydrate decomposition on the continental slope. Geochem. Geophys. Geosyst. 16 (11), 3825–3839. doi:10.1002/2015GC005955
Johnson, J. E., Goldfinger, C., and Suess, E. (2003). Geophysical constraints on the surface distribution of authigenic carbonates across the hydrate ridge region, Cascadia margin. Mar. Geol. 202 (1-2), 79–120. doi:10.1016/S0025-3227(03)00268-8
Judd, A., and Hovland, M. (2008). The impact on geology, biology and the marine environment. Statoil, Norway, Cambridge University Press. doi:10.1017/CBO9780511535918
Kennicutt, M. C., Brooks, J. M., Bidigare, R. R., McDonald, S. J., Adkison, D. L., and Macko, S. A. (1989). An upper slope “cold” seep community: northern California. Limnol. Oceanogr. 34, 635–640. doi:10.4319/lo.1989.34.3.0635
Kretschmer, K., Biastoch, A., Rüpke, L., and Burwicz, E. (2015). Modeling the fate of methane hydrates under global warming. Glob. Biogeochem. Cycles 29, 610–625. doi:10.1002/2014GB005011
Kulm, L. D., Suess, E., Moore, J. C., Carson, B., Lewis, B. T., Ritger, S. D., et al. (1986). Oregon subduction zone: venting, fauna, and carbonates. Science 231 (4738), 561–566. doi:10.1126/science.231.4738.561
Kulm, L. D., and Fowler, G. A. (1974). “A test of the imbricate thrust model,” in The geology of continental margins. Oregon continental margin structure and stratigraphy. Editors C. A. Burke, and C. L. Drake (Berlin, Heidelberg: Springer), 261–283.
Kulm, L. D., and Suess, E. (1990). Relationship between carbonate deposits and fluid venting: Oregon accretionary prism. J. Geophys. Res. 95 (B6), 8899–8915. doi:10.1029/jb095ib06p08899
Kvenvolden, K. A., Collett, T. S., and Lorenson, T. D. (1993). Studies of permafrost and gas hydrates as possible sources of atmospheric methane at high latitudes. in Biogeochemistry of global change. Editor R. S. Oremland (New York: Springer), 487–501. doi:10.1007/978-1-4615-2812-8
Kvenvolden, K. A. (1993). Gas hydrates-geological perspective and global change. Rev. Geophys. 31.(2), 173–187. doi:10.1029/93rg00268
Kvenvolden, K. A. (1988b). Methane hydrate—a major reservoir of carbon in the shallow geosphere? Chem. Geol. 71, 41–51. doi:10.1016/0009-2541(88)90104-0
Levin, L. A. (2005). Ecology of cold seep sedimentsinteractions of fauna with flow, chemistry and microbes. Oceanography and marine biology: an annual review. Boca Raton: CRC Press, 11–56. doi:10.1201/9781420037449
McNeill, L. C., Goldfinger, C., Kulm, L. D., and Yeats, R. S. (2000). Tectonics of the neogene cascadia forearc basin: investigations of a deformed late miocene unconformity. Geol. Soc. Am. Bull. 112 (8), 1209–1224. doi:10.1130/0016-7606(2000)112<1209:totncf>2.0.co;2
Nimblett, J., and Ruppel, C. (2003). Permeability evolution during the formation of gas hydrates in marine sediments. J. Geophys. Res. 108 (B9), 2420. doi:10.1029/2001JB001650
Orange, D. L., and Breen, N. A. (1992). The effects of fluid escape on accretionary wedges 2. seepage force, slope failure, headless submarine canyons, and vents. J. Geophys. Res. 97, 9277–9295. doi:10.1029/92jb00460
Orange, D. L., McAdoo, B. G., Casey Moore, J., Tobin, H., Screaton, E., Chezar, H., et al. (1997). headless submarine canyons and fluid flow on the toe of the cascadia accretionary complex. Basin Res. 9, 303–312. doi:10.1046/j.1365-2117.1997.00045.x
Orphan, V. J., Ussler, W., Naehr, T. H., House, C. H., Hinrichs, K.-U., and Paull, C. K. (2004). Geological, geochemical, and microbiological heterogeneity of the seafloor around methane vents in the Eel River Basin, offshore California. Chem. Geol. 205, 265–289. doi:10.1016/j.chemgeo.2003.12.035
Paull, C. K., Hecker, B., Commeau, R., Freeman-Lynde, R. P., Neumann, C., Corso, W. P., et al. (1984). Biological communities at the Florida escarpment resemble hydrothermal vent taxa. Science 226, 965–967. doi:10.1126/science.226.4677.965
Paull, C. K., Caress, D. W., Thomas, H., Lundsten, E., Anderson, K., Gwiazda, R., et al. (2014). seafloor geomorphic manifestation of gas venting and shallow subbottom gas hydrate occurrences. Geophere 11 (2), 491–513. doi:10.1130/GEOS01012.1
Philip, B. T., Denny, A. R., Solomon, E. A., and Kelley, D. S. (2016a). Time-series measurements of bubble plume variability and water column methane distribution above Southern hydrate ridge, Oregon. Geochem. Geophys. Geosyst. 17, 1182–1196. doi:10.1002/2016gc006250
Phrampus, B. J., and Hornbach, M. J. (2012). Recent changes to the Gulf Stream causing widespread gas hydrate destabilization. Nature 490 (7421), 527. doi:10.1038/nature11528
Phrampus, B. J., Harris, R. N., and Tréhu, A. M. (2017). Heat flow bounds over the cascadia margin derived from bottom simulating reflectors and implications for thermal models of subduction. Geochem. Geophys. Geosyst. 18, 3309. doi:10.1002/2017GC007077
Poort, J., Kutas, R. I., Klerkx, J., Beaubien, S. E., Lombardi, S., Dimitrov, L., et al. (2007). Strong heat flow variability in an active shallow gas environment, Dnepr palaeo-delta, Black Sea. Geo-Mar Lett. 27, 185–195. doi:10.1007/s00367-007-0072-4
Puig, P., Ogston, A. S., Mullenbach, B. L., Nittrouer, C. A., and Sternberg, R. W. (2003). Shelf-to-canyon sediment-transport processes on the Eel continental margin (northern California). Mar. Geol. 193 (1–2), 129–149. doi:10.1016/s0025-3227(02)00641-2
Riedel, M., Scherwath, M., Römer, M., Veloso, M., Heesemann, M., and Spence, G. D. (2018). distributed natural gas venting offshore along the cascadia margin. Nat. Commun. 9, 3264. doi:10.1038/s41467-018-05736-x
Ruppel, C. D., Herman, B. M., Brothers, L. L., and Hart, P. E. (2016). Subsea ice-bearing permafrost on the U.S. Beaufort margin: 2. borehole constraints. Geochem. Geophys. Geosyst. 17, 4333–4353. doi:10.1002/2016GC006582
Ruppel, C. D., and Kessler, J. D. (2017). The interaction of climate change and methane hydrates. Rev. Geophys. 55 (1), 126–168. doi:10.1002/2016RG000534
Sahling, H., Römer, M., Pape, T., Bergès, B., dos Santos Fereirra., C., Boelmann, J., et al. (2014). gas emissions at the continental margin west of Svalbard: mapping, sampling, and quantification. Biogeosciences 11, 6029–6046. doi:10.5194/bg-11-6029-2014
Salmi, M. S., Johnson, H. P., and Harris, R. N. (2017). Thermal environment of the Southern Washington region of the cascadia subduction zone. J. Geophys. Res. Solid Earth 122 (8), 5852–5870. doi:10.1002/2016jb013839
Salmi, M. S., Johnson, H. P., Leifer, I., and Keister, J. E. (2011). Behavior of methane seep bubbles over a pockmark on the cascadia continental margin. Geosphere 7 (6), 1273–1283. doi:10.1130/GES00648.1
Saunois, M., Bousquet, P., Poulter, B., Peregon, A., Ciais, P., Canadell, J. G., et al. (2016). The global methane budget 2000–2012. Earth Syst. Sci. Data 8 (2), 697–751. doi:10.5194/essd-8-697-2016
Seabrook, S., C. De Leo, F.F. C., Raineault, N., Thurber, A. R., and Thurber, A. R. (2018). heterogeneity of methane seep biomes in the Northeast Pacific. Deep Sea Res. Part Topical Stud. Oceanogr. 150, 195–209. doi:10.1016/j.dsr2.2017.10.016
Skarke, A., Ruppel, C., Kodis, M., Brothers, D., and Lobecker, E. (2014). Widespread methane leakage from the sea floor on the northern US Atlantic margin. Nat. Geosci 7, 657–661. doi:10.1038/NGEO2232
Snavely, P. D. (1987). “Tertiary geologic framework, neotectonics, and petroleum potential of the Oregon-Washington continental margin,” in Geology and resource potential of the continental margn of western north America and adjacent ocean basins-beaufort sea to baja California. Circum-pacific council for energy and mineral resources. Editors D. W. Scholl, A. Grantz, and J. C. Vedder (Houston, TX), 305–335.
Suess, E., Carson, B., Ritger, S. D., Moore, J. C., Jones, M. L., Kulm, L. D., et al. (1985). Biological communities at vent sites along the subduction zone off Oregon. Bull. Biol. Soc. Wash. 6, 475–484.
Suess, E., Torres, M. E., Bohrmann, G., Collier, R. W., Greinert, J., Linke, P., et al. (1999). Gas hydrate destabilization: enhanced dewatering, benthic material turnover and large methane plumes at the Cascadia convergent margin. Earth Planet. Sci. Lett. 170, 1–15. doi:10.1016/s0012-821x(99)00092-8
Sun, T., Ellis, S., and Saffer, D. (2020). Coupled evolution of deformation, pore fluid pressure, and fluid flow in shallow subduction forearcs. J. Geophys. Res. Solid Earth 125, e2019JB019101. doi:10.1029/2019jb019101
Teichert, B. M. A., Eisenhauer, A., Bohrmann, G., Haase-Schramm, A., Bock, B., and Linke, P. (2003). U/Th systematics and ages of authigenic carbonates from Hydrate Ridge, cascadia margin: recorders of fluid flow variations. Geochimica et Cosmochimica Acta 67.(20), 3845–3857. doi:10.1016/s0016-7037(03)00128-5
Thomsen, L., Barnes, C., Best, M., Chapman, R., Pirenne, B., Thomson, R., et al. (2012). Ocean circulation promotes methane release from gas hydrate outcrops at the NEPTUNE canada barkley canyon node. Geophys. Res. Lett. 39 (16), 113. doi:10.1029/2012GL052462
Torres, M. E., Embley, R. W., Merle, S. G., Trehu, A. M., Collier, R. W., Suess, E., et al. (2009). methane sources feeding cold seeps on the shelf and upper continental slope off central Oregon, USA. Geochem. Geophys. Geosystems.10 (11), 67. doi:10.29/2009/GC002518
Tréhu, A. M., Flemings, P. B., Bangs, N. L., Chevallier, J., Gràcia, E., Johnson, J. E., et al. (2004). feeding methane vents and gas hydrate deposits at south hydrate ridge. Geophys. Res. Lett. 31. doi:10.1016/s0012-821x(04)00219-5
Tréhu, A. M., Lin, G., Maxwell, E., and Goldfinger, C. (1995). A seismic reflection profile across the cascadia subduction zone offshore central Oregon: new constraints on methane distribution and crustal structure. J. Geophys. Res. 100 (B8), 15101–15116. doi:10.1029/95jb00240
Tréhu, A. M., Torres, M. E., Moore, G. F., Suess, E., and Bohrmann, G. (1999). Temporal and spatial evolution of a gas hydrate-bearing accretionary ridge on the Oregon continental margin. Geol 27, 939–942. doi:10.1130/0091-7613(1999)027<0939:taseoa>2.3.co;2
Urban, P., Köser, K., and Greinert, J. (2017). Processing of multibeam water column image data for automated bubble/seep detection and repeated mapping. Limnol. Oceanogr. Methods 15, 1–21. doi:10.1002/lom3.10138
von Rad, U., Berner, U., Delisle, G., Doose-Rolinski, H., Fechner, N., Linke, P., et al. (2000). Gas and fluid venting at the makran accretionary wedge off Pakistan. Geo-Marine Lett. 20, 10–19. doi:10.1007/s003670000033
Wang, K., Hu, Y., and He, J. (2012). Deformation cycles of subduction earthquakes in a viscoelastic Earth. Nature 484 (7394), 327–332. doi:10.1038/nature11032
Wang, K., and Hu, Y. (2006). Accretionary prisms in subduction earthquake cycles: the theory of dynamic coulomb wedge. J. Geophys. Res. 111, B06410. doi:10.1029/2005JB004094
Westbrook, G. K., Thatcher, K. E., Rohling, E. J., Piotrowski, A. M., Pälike, H., Osborne, A. H., et al. (2009). Escape of methane gas from the seabed along the west spitsbergen continental margin. Geophys. Res. Lett. 36 (15), 54. doi:10.1029/2009GL039191
Yeats, F. E., Varela, R., Thunell, R., Luerssen, R., Hu, C., and Walsh, J. J. (2005). The importance of continental margins in the global carbon cycle. Geophys. Res. Lett., 32, L01602. doi:10.1029/2004GL021346
Keywords: methane, bubble emission sites, seeps, Cascadia, multibeam, seismic reflection, bubble streams
Citation: Merle SG, Embley RW, Johnson HP, Lau T-K, Phrampus BJ, Raineault NA and Gee LJ (2021) Distribution of Methane Plumes on Cascadia Margin and Implications for the Landward Limit of Methane Hydrate Stability. Front. Earth Sci. 9:531714. doi: 10.3389/feart.2021.531714
Received: 31 January 2020; Accepted: 08 February 2021;
Published: 24 March 2021.
Edited by:
Martin Scherwath, University of Victoria, CanadaReviewed by:
Pablo Garcia Del Real, TE SubCom, United StatesBenedicte Ferre, Arctic University of Norway, Norway
Copyright © 2021 Merle, Embley, Johnson, Lau, Phrampus, Raineault and Gee. This is an open-access article distributed under the terms of the Creative Commons Attribution License (CC BY). The use, distribution or reproduction in other forums is permitted, provided the original author(s) and the copyright owner(s) are credited and that the original publication in this journal is cited, in accordance with accepted academic practice. No use, distribution or reproduction is permitted which does not comply with these terms.
*Correspondence: Susan G. Merle, c3VzYW4ubWVybGVAbm9hYS5nb3Y=, c3VzYW4ubWVybGVAb3JlZ29uc3RhdGUuZWR1