 Denis Dumas1*
 Patricia Alexander2
- 1Research Methods and Statistics, University of Denver, Denver, CO, United States
- 2Human Development and Quantitative Methods, University of Maryland, College Park, College Park, MD, United States
The test of relational reasoning (TORR) is designed to assess the ability to identify complex patterns within visuospatial stimuli. The TORR is designed for use in school and university settings, and therefore, its measurement invariance across diverse groups is critical. In this investigation, a large sample, representative of a major university on key demographic variables, was collected, and the resulting data were analyzed using a multi-group, multidimensional item-response theory model-comparison procedure. No significant differential item functioning was found on any of the TORR items across any of the demographic groups of interest. This finding is interpreted as evidence of the cultural fairness of the TORR, and potential test-development choices that may have contributed to that cultural fairness are discussed.
Relational reasoning has been characterized as the ability to discern meaningful patterns within any informational stream (Alexander and The Disciplined Reading and Learning Research Laboratory, 2012; Bassok et al., 2012). Moreover, this ability to detect a meaningful pattern within seemingly unrelated information, as well as to derive overarching patterns from sets of relations from different domains, is fundamental to human cognitive functioning (Krawczyk, 2012; Dumas et al., 2013) and learning (e.g., Richland et al., 2007). Importantly, depending on the information at hand, a variety of different types of patterns may be drawn by a reasoner (Chi, 2013). Therefore, relational reasoning has been described as taking multiple forms, with each form representing a different type of relational pattern that is salient for human thinking and learning (Alexander and The Disciplined Reading and Learning Research Laboratory, 2012). Specifically, Alexander and colleagues posited four forms of the construct: analogy, anomaly, antinomy, and antithesis. In effect, analogies occur when a higher-order pattern of similarity is mapped among concepts (Holyoak, 2012), anomalies are relations of deviation or digression from a typical pattern (Chinn and Brewer, 1993), antinomies are formed when two or more mutually exclusive sets of concepts can be identified (Dumas et al., 2014), and antitheses require the reversal of salient relations to form an oppositional pattern (Sinatra and Broughton, 2011).
To date, relational reasoning has been empirically shown to play a role in a number of learning processes across the gamut of educational contexts, from early reading (Ehri et al., 2009), to high-school chemistry (Trey and Khan, 2008), to medical residency (Dumas et al., 2014). Because of these robust findings, interest is growing within the educational and psychological research community in the measurement of relational reasoning. However, despite this interest, a recently published literature review (Dumas et al., 2013) found the measurement of this construct to be historically problematic. In effect, even though the definitions of relational reasoning that populate the literature speak broadly to individuals’ ability to discern patterns, the measures of this construct have focused almost exclusively on one form, analogical reasoning. Thus, the presumed multidimensional character of relational reasoning has not been well represented. Moreover, many of the existing measures of relational reasoning require domain-specific knowledge and strategies that may be more emphasized in one cultural context than another. For example, when strong domain-specific skills (e.g., reading) are a prerequisite for the discernment of relational patterns, construct irrelevant variance attributable to that ability affects the measure of relational reasoning (O’Neill and McPeek, 1993).
In order to address these gaps, the Test of Relational Reasoning (TORR) was conceived (Alexander and The Disciplined Reading and Learning Research Laboratory, 2012) and developed (Alexander et al., 2016). The TORR has 32 visuospatial items, organized in four scales of eight items corresponding to the four forms of relational reasoning. The TORR is intended to measure relational reasoning ability among adolescents and adults, and investigations of the reliability and validity of the TORR with college-age students have yielded promising results. For example, the TORR has been fully calibrated for the undergraduate population using multidimensional item-response theory (MIRT) models (Dumas and Alexander, 2016). In particular, a MIRT bifactor model was identified as the best-fitting model for the TORR data, and a conceptual path diagram of this model appears in Figure 1. Specifically, this model is formulated as a multidimensional 3-parameter logistic model with a bifactor structure. Moreover, TORR scores present good classical reliability (α = 0.84), a high-level of latent variable reproducibility (H = 0.96), and appropriate item parameters.
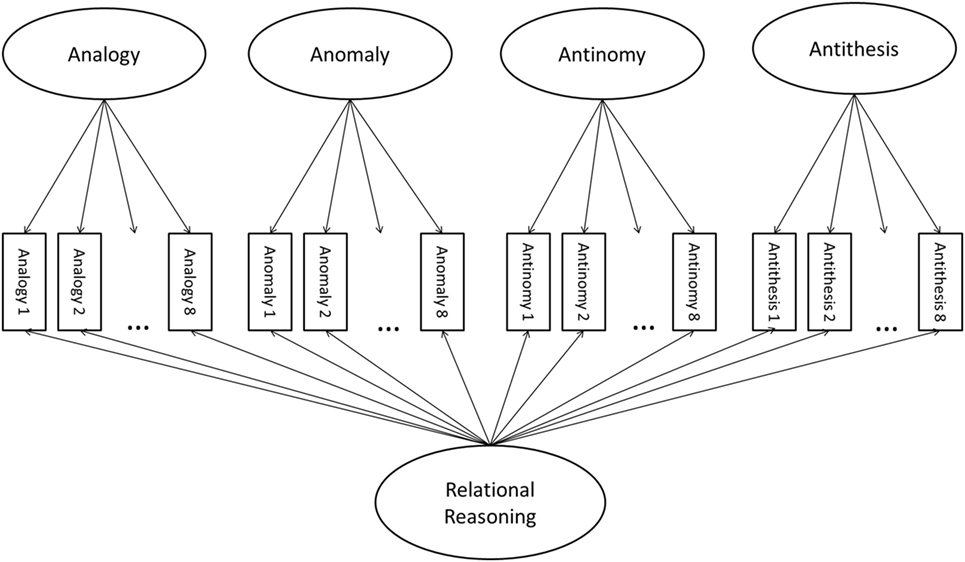
Figure 1. A conceptual path diagram of the bifactor model.
The TORR has also been subjected to expert validation using cognitive labs and has been shown to significantly positively correlate with performance on SAT released items, undergraduate GPA, working memory capacity, fluid intelligence, and critical thinking (Alexander et al., 2016). In addition, TORR scores have been significantly positively predictive of mechanical engineering students’ ability to pose creative solutions to design problems (Dumas and Schmidt, 2015; Dumas et al., 2016), and the cognitive processes required for solving TORR items have also been modeled using Bayesian networks (Grossnickle et al., 2016). In sum, these studies suggest that valid inferences about individual students’ relational reasoning ability may be made from TORR scores. However, the consequential validity of TORR scores across diverse participants within the target population remains an open question—a question specifically addressed within the present study.
Sample items for each scale of the TORR are displayed in Figures 2A–D. It should be noted that because their role was to familiarize respondents with the target process (e.g., antinomous reasoning), the sample items were designed to relatively easy to answer. For example, Figure 2A depicts an example analogy item, created in the matrix analogy format similar to those on the Raven’s Progressive Matrices and other nonverbal reasoning tests (Raven, 1941; Naglieri and Insko, 1986). In this particular item, participants must discern the pattern of changing shapes and interior dots. The correct answer to this item is A, because the pattern requires a triangle with three interior dots to be selected.
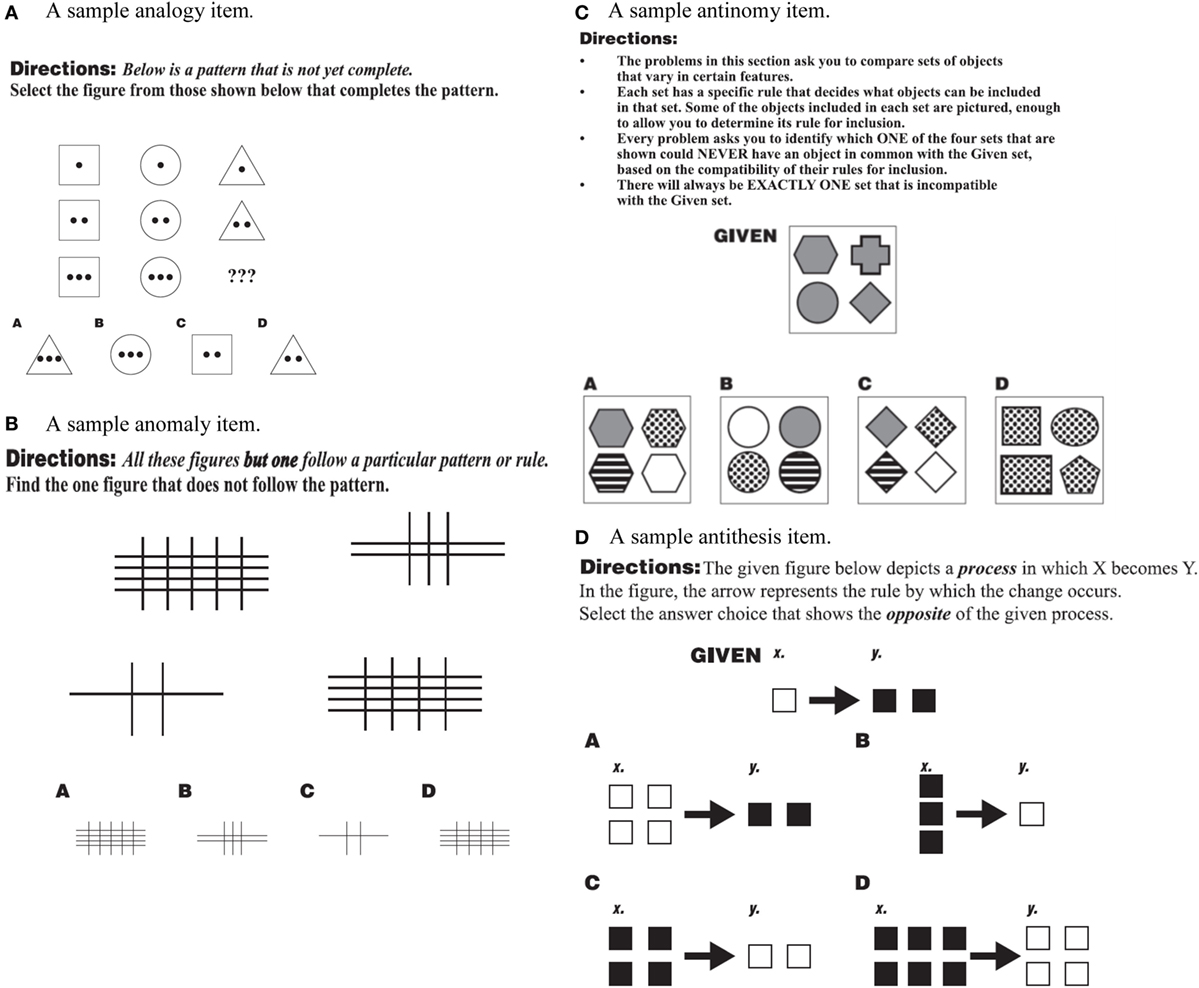
Figure 2. (A–D) Sample items from the test of relational reasoning (TORR) for the analogy, anomaly, antinomy, and antithesis scales. (A) A sample analogy item. (B) A sample anomaly item. (C) A sample antinomy item. (D) A sample antithesis item.
Figure 2B depicts a sample anomaly item, in which each of the figures but answer choice D have one fewer horizontal line then they do vertical. So, the relation between the horizontal and vertical lines is different for choice D, then, it is for each of the other choices, marking it as the anomaly. Figure 2C is sample Antinomy item, where the participant is instructed to select the set that could never have an object in common with the given set. Because the given set contains only gray shapes, and answer choice D contains only dotted shapes, set D is antinomous, or mutually exclusive with the given set. Finally, Figure 2D is a sample antithesis item in which the given process shows white squares doubling in number and becoming filled in. Therefore, the opposite of this process is dark squares halving in number and losing their fill, a process that is found in answer choice C.
Throughout the construction of the TORR, every effort was made to limit the amount of crystallized or cultural-specific knowledge required to correctly respond to the items. Specifically, in order to limit the reading load of the TORR, all items were constructed as graphically presented visuospatial arrays, and the scale and item directions were piloted repeatedly to ensure they were maximally simplistic and comprehensible. In this way, the TORR is designed to tap as little construct irrelevant variance as possible. However, this focus on the novelty and generality of items during test construction does not guarantee that the TORR functions equally well across various demographic or cultural groups within our target populations. Therefore, whether or not TORR items function invariantly or differentially across demographic groups remains an empirical question.
The purpose of this study was to empirically examine the cultural fairness of the TORR across multiple gender, ethnic, and language groups. To do this, TORR data were analyzed using MIRT techniques for uncovering differential item functioning (DIF). Here, DIF refers to a situation in which an item’s MIRT parameters (e.g., difficulty, discrimination, or guessing across all dimensions in the model) are not invariant across demographic groups after controlling for the level of latent ability across groups (Livingston, 2012).
Method
Participants
Participants were 1,379 undergraduate students enrolled at a large public research university in the mid-Atlantic region of the United States, and data-collection procedures utilized in this study were approved by the institutional-review-board of the institution where the study took place. The sample was representative of the full university population in terms of the gender, ethnicity, language background, major, and year in school. The resulting demographic information is displayed in Table 1 for the sample, as well as the university population, along with corresponding chi-square tests for representativeness. Additionally, students ranged in age from 18 to 26, with a mean age of 21.34 (SD = 1.96). A one-sample t-test was used to confirm that this mean was not significantly different than the university reported mean age of 21.0 [t (1,378) = 1.06, p = 0.28]. Moreover, students reported GPAs ranging from 1.5 to 4, on a 4-point scale, with a mean of 2.81 (SD = 0.24).
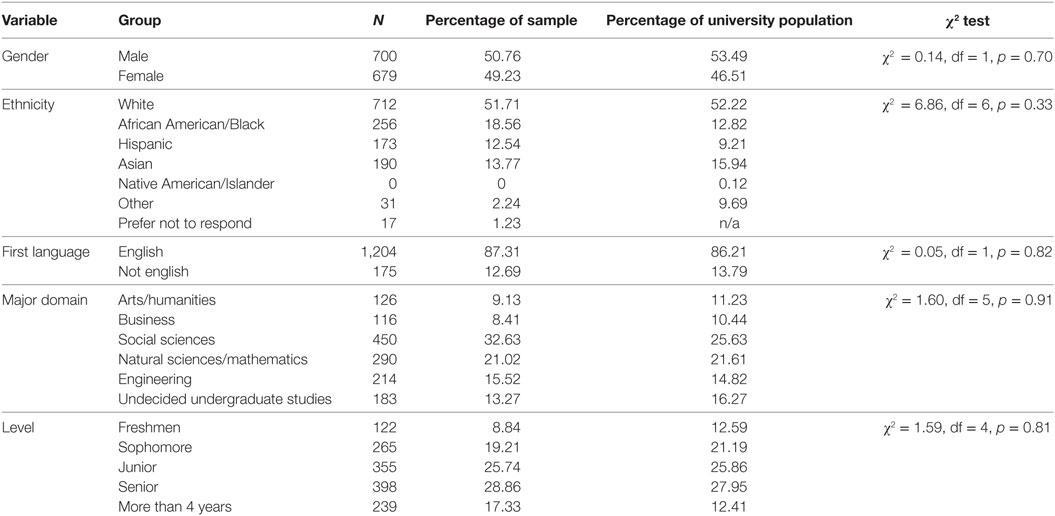
Table 1. Demographics and representativeness of sample.
Procedure
The sample was collected through direct communication with instructors across the university, who received information about the study as well as a link to the online version of the TORR to disseminate to their students via email. The ethical conduct of this research was approved by the institutional-review-board at the University of Maryland, College Park: where the study took place. Before supplying any data, all participants provided informed and written consent for their participation via the study website. In exchange for their students’ participation in this study, instructors agreed to offer extra course credit. The online version of the TORR was powered by Qualtrics (2014) survey software, and was programed to present the scales of the TORR (i.e., analogy, anomaly, antinomy, and antithesis) in a randomized, counterbalanced order across participants. Consistent with previous research utilizing the TORR (e.g., Alexander et al., 2016), students could participate in this study from any computer connected to the Internet, but could not participate on a smartphone or tablet. Additionally, students were permitted to take as much time as they needed to complete the TORR, with the average time being 29.61 min (SD = 7.32). No student took more than 50 min to complete the measure. After students had completed the TORR, they provided demographic information and logged out of the study website.
Analysis Overview
In order to evaluate DIF using a MIRT paradigm, iterative multi-group models were fit to the TORR data. The procedure followed methodological recommendations formalized through simulation work in the MIRT context by Stark et al. (2006), but that have been meaningfully employed in the unidimensional IRT context for some time (e.g., Reise et al., 1993). This procedure began by fitting a “free-baseline” two-group bifactor model across the groups being compared (e.g., males and females). Within this two-group model, referent items, whose parameters are constrained to be equal across groups, were specified. In the case of the bifactor model, one referent item must be specified for each specific latent ability being measured, and the loading of each of those items on both their general and specific ability factors was set to equality across groups.
Then, the free-baseline model, in which only the parameters associated with the referent items are constrained across groups, was run, and its chi-square fit statistic was recorded. Next, a model that additionally constrained the parameters associated with another of the items was fit and its chi-square fit statistic recorded. The increase in the model chi-square value associated with that more-constrained model was tested for significance at 4° of freedom, which was the difference in degrees of freedom between the free-baseline and constrained models. Specifically, the difference between the free-baseline and constrained models is 4° of freedom because the constrained model has four additional parameters constrained equal across groups: 1 guessing parameter, 1 item intercept, and 2 discrimination parameters. Because of the bifactor structure of this model, each TORR item has two discrimination parameters, one for the general relational reasoning factor, and another for the scale specific residualized factor (see Figure 1 for a visual depiction). Whether or not this chi-square increase reached significance allowed for inferences about whether or not the constrained item displayed significant DIF across the groups being compared. In this way, DIF was examined across each of the parameters associated with a given item on the TORR, meaning that the test was not specifically for DIF in the item intercept (i.e., uniform DIF) or DIF in either of the discrimination parameters (i.e., non-uniform DIF), but for DIF across each of those parameters. If DIF across all of the item parameters was detected, then specific likelihood-ratio DIF tests that specifically targeted an individual item parameter would have been conducted. However, as will be demonstrated, such parameter-specific DIF tests were unnecessary, because no item-level DIF was detected.
This procedure was repeated for each of the non-referent items on the TORR. Then, in order to test the referent items, the TORR item from each scale that, when constrained, displayed the lowest chi-square increase from the free-baseline model (and, therefore, the least DIF) was chosen as a new referent item. With these four empirically chosen referents, the procedure was repeated in order to test the referent items for DIF. Interestingly, the opposite-direction of this procedure (i.e., comparing a constrained-baseline model to a free model) is more typical in the field but such a procedure, in this case, actually risks breaking an assumption of the critical likelihood ratio test; namely, that the baseline model must fit the data in order for the likelihood-ratio statistic to follow a chi-square distribution (Stark et al., 2006). It should be noted that all MIRT analysis in this investigation was conducted using flexMIRT (Cai, 2013) software utilizing the expectation-maximization (EM) algorithm and priors of 2.0 for the estimation of item parameters (Bock et al., 1988). Also, the supplemented EM algorithm (Cai, 2008) was utilized for the calculation of standard errors. Sample FlexMIRT code that was used for the likelihood ratio procedure is included in this document as Appendix SA in Supplementary Material. Such a procedure is in contrast to other previous work which utilized a MIMIC approach with an adjusted weighted least-squares estimator (e.g., Suh and Cho, 2014).
It should be noted here that a variety of other DIF detection procedures exist in the literature, including “constrained-baseline” MIRT methods (Chun et al., 2016; Bulut and Suh, 2017), the Mantel–Haenszel (MH) test (Fischer, 1993), logistic regression methods (Paek, 2012), and item purification methods (Magis and Facon, 2013). However, the method chosen in this study is the most appropriate given the bifactor structure of the TORR. Specifically, classic procedures such as MH tests and logistic regression generally do not account for the existence of multiple latent dimensions contributing to variance in item-responses, as the bifactor model posits. In contrast, constrained-baseline likelihood-ratio procedures in MIRT are capable of accounting for multidimensionality, but unfortunately, break an assumption of the likelihood ratio test: that the baseline model fit the data adequately for nested-model comparison (Chun et al., 2016). Therefore, it should be expected that different DIF detection methods may yield different results, but only the results of the most theoretically appropriate method in which all assumptions are met should be run and interpreted.
Moreover, this procedure required 32 consecutive model comparisons (one for each TORR item) on the same set of group data. Importantly, 32 chi-square tests conducted on the same data would greatly inflate the family wise Type-I error rate of each full likelihood-ratio procedure (Klockars and Hancock, 1994). In addition, the generally large sample size included in this study allows for a highly powered chi-square test of the likelihood-ratio between nested models (Rivas et al., 2009). Therefore, the Bonferroni correction was applied to the Type-I error rate, in order to maintain a family wise error rate of 0.05, as is recommended in the MIRT measurement invariance literature (Stark et al., 2006).
Results
Choice of Referent Items
Simulation research (e.g., Rivas et al., 2009) has been conducted to determine what types of items, in terms of their estimated parameters, are most suitable to be referent items in a DIF detection procedure. Specifically, Rivas et al. (2009) recommend the use of items that are highly, but not too highly, discriminating (ideally 1.0 < a < 2.0), and that have a difficulty parameter close to the level of theta at which the test is most informative (on the TORR b ≈ 0.8). Moreover, the guessing parameters of referent items should be relatively close to the expected guessing parameter given the number of answer choices (with four answer choices on the TORR c ≈ 0.25). For this investigation, referent items were chosen based on these criteria, using item parameters estimated in a previous MIRT calibration of the TORR with the bi-factor model (Dumas and Alexander, 2016). Specifically, the items that were chosen as referent items in this investigation were: Analogy 1, Anomaly 7, Antinomy 8, and Antithesis 4.
Gender
Results from each of the likelihood-ratio tests for DIF between males and females are displayed in Table 2. As already mentioned, the Bonferroni correction was applied to these tests in order to hold the type-I error rate at 0.05 across each group comparison. Therefore, the critical chi-square value, which would indicate that significant DIF existed on an item of the TORR, was 18.50. As can be seen in Table 2, none of the items on the TORR displayed significant DIF between gender groups based on that criterion. In fact, only three items on the TORR displayed a chi-square increase from the free-baseline model that was at least half of the magnitude of the critical value. One item, Anomaly 6, came within two chi-square units of the critical value, but did not reach significance.
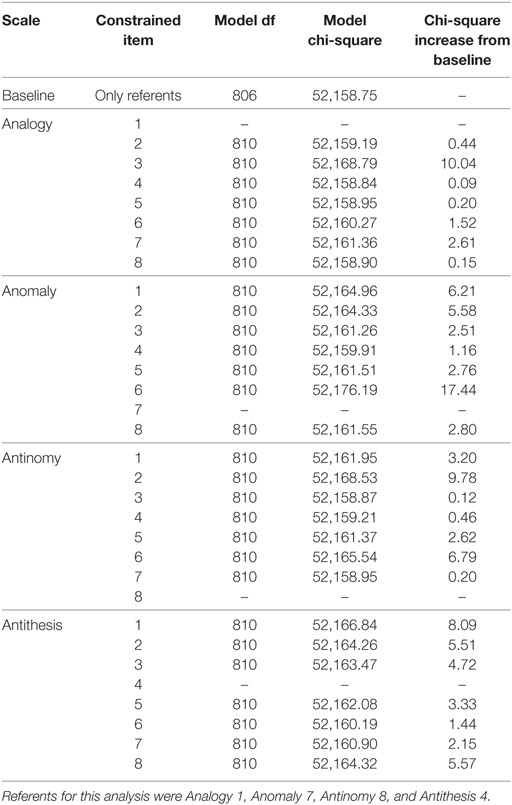
Table 2. Likelihood-ratio tests for differential item functioning between males and females.
As noted, the items on each scale that displayed the lowest chi-square increase were used as new-referents when testing the previously selected referents for DIF. As can be seen in Table 3, the referent items did not display DIF, and all showed a chi-square increase less than a third of the critical value. This finding implies that the statistical criteria used to select referent items were effective at determining items that were appropriate referent items. Therefore, Tables 2 and 3 converge on the finding that no significant DIF exists on TORR items across gender groups.
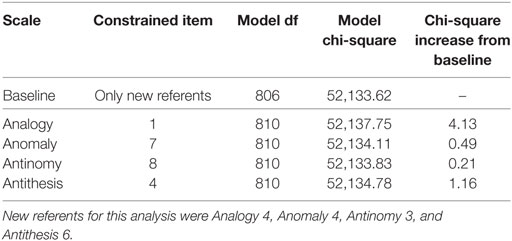
Table 3. Likelihood-ratio tests for differential item functioning between males and females: testing referents.
Language Background
Analogously to Tables 2 and 3, which pertain to gender groups, Tables 4 and 5 present the results of likelihood-ratio tests for DIF across language groups. It should be noted that, although the TORR is a visuospatial measure designed to limit the need for reading in responding to the test, the directions for the TORR are written in English and, therefore, English language ability may affect TORR item responses. Therefore, language groups were simply defined as (a) those students who reported English as their first language and (b) those students who reported having a language other than English as their first. None of the items tested in Table 4 showed chi-square increases greater than the Bonferroni corrected critical value of 18.50. In fact, none of the items showed chi-square increases that were half the magnitude of that critical value. The items that showed the smallest chi-square increase per scale were Analogy 7, Anomaly 5, Antinomy 4, and Antithesis 7. Therefore, these items were used as referent items to test for DIF in the original referent items, none of which displayed significant DIF (See Table 5). Interestingly, none of the items that displayed the lowest chi-square increases per scale when testing for DIF among language groups were the same as those that displayed the lowest chi-square increase when testing across gender groups. This finding may imply that, despite the fact that no significant DIF was uncovered among language groups in this study, the underlying mechanisms that drive differences among gender and language groups differ in important ways.
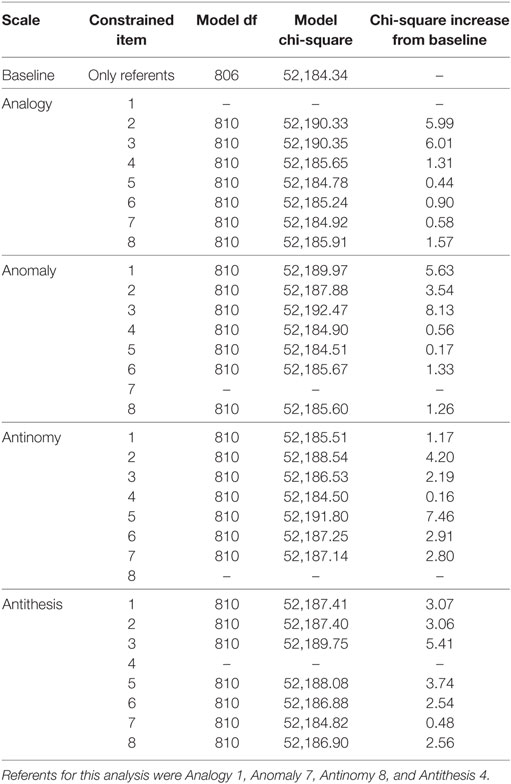
Table 4. Likelihood-ratio tests for differential item functioning between language groups.
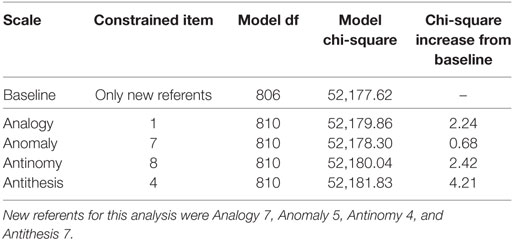
Table 5. Likelihood-ratio tests for differential item functioning between language groups: testing referents.
Race/Ethnicity
In this investigation, tests for DIF among race/ethnicity groups were conducted by fitting multi-group MIRT models to one focal group and one reference group at a time. In this way, despite there being five race/ethnicity groups included in this analysis (i.e., White, Black, Hispanic, and Asian), each of the likelihood-ratio procedures featured two-group models. Specifically, White participants were chosen as the reference group for each model comparison procedure. This choice was made because White students were the most populous group in the sample, and White students remain the majority in the population of interest (i.e., U.S. undergraduate population). Therefore, separate likelihood-ratio procedures were conducted to detect DIF between White and Black participants, White and Hispanic participants, and White and Asian participants. The results of each of these procedures are detailed below.
Black/African American
Tables 6 and 7 contain information related to the likelihood-ratio tests for DIF between White and Black participants. No TORR item displayed significant DIF across these groups (See Table 6). The items that displayed the lowest chi-square increases per scale were Analogy 2, Anomaly 4, Antinomy 2, and Antithesis 6. These items were used as new-referent items to test the original referent items for DIF, none of which displayed a significant chi-square increase (see Table 7). Interestingly, Anomaly 4 was the item with the lowest chi-square increase on the Anomaly scale across both male and female and White and Black participants. This finding may indicate that item is particularly suited for measuring relational reasoning across demographic groups.
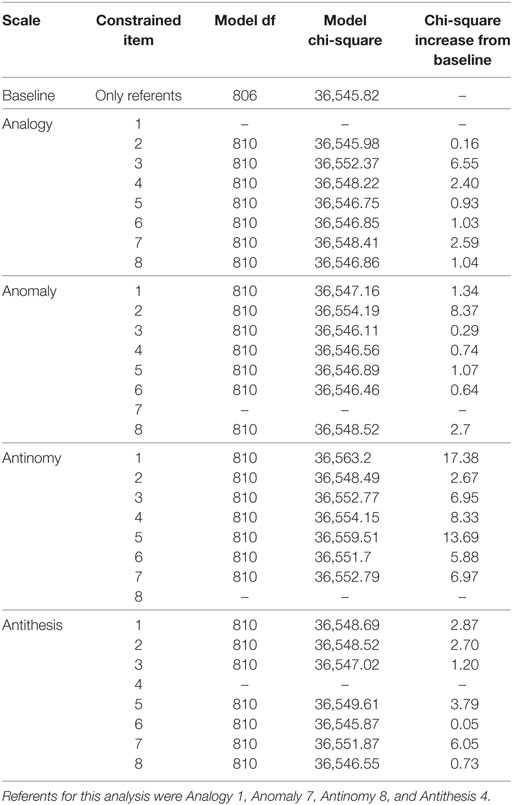
Table 6. Likelihood-ratio tests for differential item functioning between white and black participants.
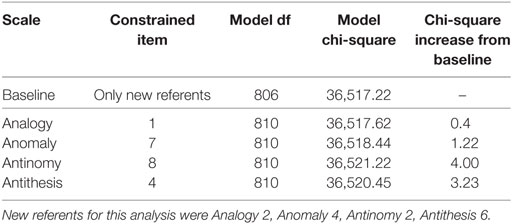
Table 7. Likelihood-ratio tests for differential item functioning between white and black participants: testing referents.
Hispanic/Latino
As with the likelihood ratio tests for DIF between White and Black participants, no item on the TORR displayed significant DIF between White and Hispanic students. As seen in Table 8, no item, when constrained across groups, produced a chi-square increase from the baseline model greater than the critical value. The items from each scale that displayed the smallest chi-square increases from the baseline were: Analogy 7, Anomaly 4, Antinomy 4, and Antithesis 5. It should be noted that Anomaly 4 displayed the least chi-square increase on the Anomaly scale in the likelihood-ratio tests pertaining to gender, Black participants, and Hispanic participants. This convergent finding suggests that this particular item is highly invariant across groups. As before, these new-referent items were used to test the original referent items for DIF, which none displayed significantly (see Table 9 for details).
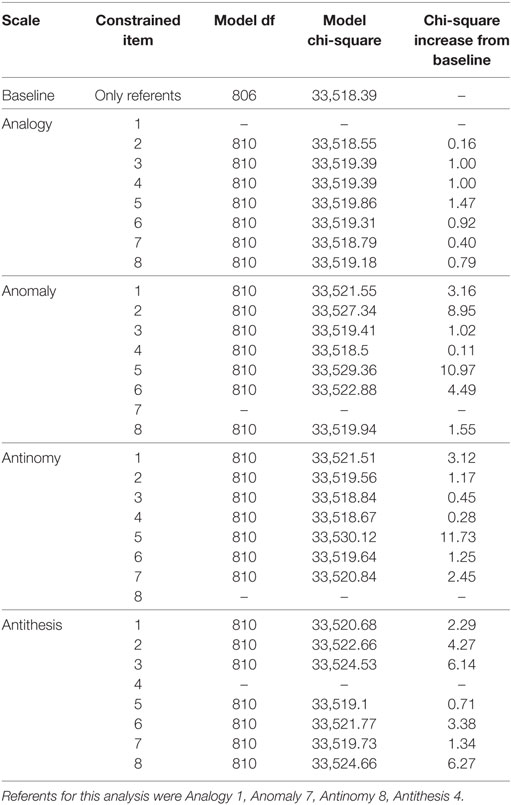
Table 8. Likelihood-ratio tests for differential item functioning between white and Hispanic participants.
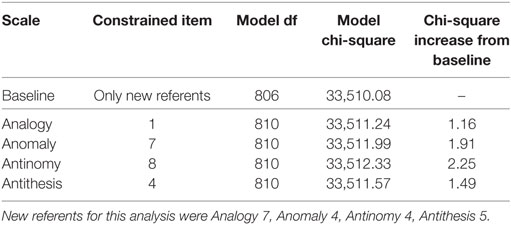
Table 9. Likelihood-ratio tests for differential item functioning between white and hispanic participants: testing referents.
Asian
At this point in the analysis, no significant DIF had been uncovered on any TORR items across any of the demographic groups being tested. The likelihood ratio tests for DIF between White and Asian participants were no exception to this pattern, with no item producing a significant chi-square increase when constrained across groups (see Table 10 for full information on these likelihood-ratio tests). The items on each scale that produced the smallest chi-square increase were: Analogy 6, Anomaly 2, Antinomy 2, and Antithesis 2. As in the previous analyses, these items were used as new-referents to confirm that the original referents did not display significant DIF (see Table 11).
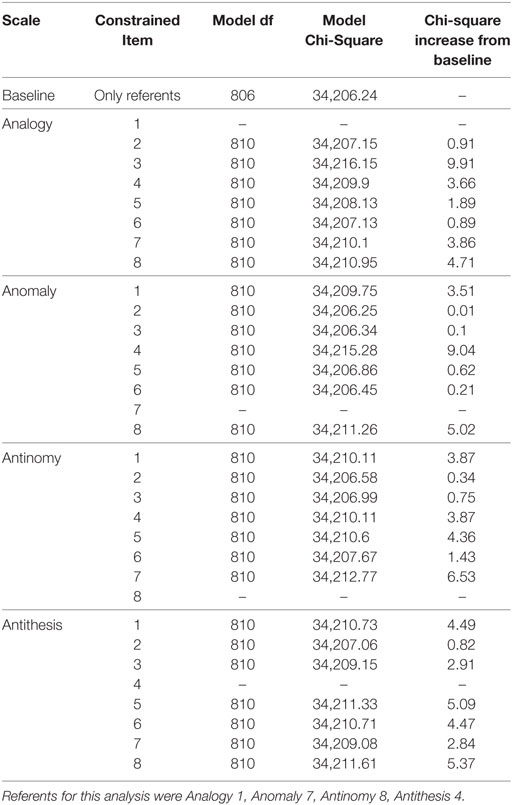
Table 10. Likelihood-ratio tests for differential item functioning between white and asian participants.
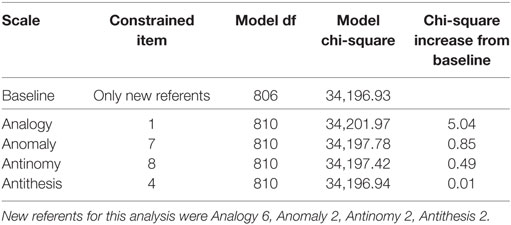
Table 11. Likelihood-ratio tests for differential item functioning between white and asian participants: testing referents.
Conclusion
One important assumption of the bi-factor model, and most other psychometric models used to measure cognitive abilities or psychological traits, is that the parameters of the measurement model used to estimate participants’ ability are invariant across those participants, regardless of the demographic group from which they come (Cai et al., 2011). Unfortunately, in the psychological assessment literature, whether or not a given measure and its accompanying measurement model meet this assumption is not always empirically tested (Sternberg, 2008). After this investigation, empirical evidence exists to bolster the argument that the TORR can be meaningfully calibrated, normed, and scored in adolescent and adult populations like those enrolled in higher education, without explicitly accounting for the demographic group membership of participants from that population. Interestingly, the invariance assumption has been found to be untenable for a number of cognitive assessments (Poortinga, 1995; Rosselli and Ardila, 2003). Therefore, it is interesting to discuss what aspects of the TORR or TORR administration may have contributed to no significant DIF being detected in the present study, so that these aspects may be used in future psychometric work as strategies for creating culturally fair measures.
First and foremost, the visuospatial nature of the TORR stimuli may have contributed to its invariance, because such stimuli elicit more fluid cognitive processing from participants, and are less effected by abilities that are formally taught in school (Cattell, 1987). However, a number of more subtle test-administration choices may have also contributed to the invariance of the TORR. For example, stereotype threat (Steele and Aronson, 1995) may have been avoided on the TORR because participants were asked to supply demographic information only after they had completed the full measure. Further, students were able to participate in this study from any computer connected to the Internet, which meant that students who may have otherwise felt anxiety upon entering a psychological laboratory and completing a cognitive measure were able to complete the TORR in their own private space, without necessarily feeling the anxiety a laboratory may produce. Because there is evidence that psychological-assessment related anxiety is disproportionally distributed among demographic groups (Palumbo and Steele-Johnson, 2014), this choice may have helped abate DIF.
Finally, in this study, the TORR was administered as an untimed measure, allowing students the time they needed to perform their best. While dominant White-American culture typically holds the belief that those students who are more adept at a given cognitive skill can perform that skill more quickly, increasing evidence suggests that other cultures, namely Asian and Latin-American, hold the inverse belief—that greater time spent on a given task reflects a greater depth of processing, and thus better performance (Rosselli and Ardila, 2003; Chen, 2005). Some empirical evidence does exist that untimed tests are more capable at identifying high-ability students from non-dominant cultures (Shaunessy et al., 2004). For this reason, it may be that untimed tests, such as the TORR, are more likely to be culturally fair than timed tests, although such a hypothesis requires future empirical testing.
Despite these encouraging empirical findings, there are of course a number of limitations and required future directions that are necessitated by this study. For example, for a variety of economic, cultural, and social reasons, the population of undergraduate students in the United States is substantially less diverse—especially on economic variables related to educational attainment—than the population of the nation as a whole (Census Bureau U.S., 2010). For that reason, although the findings of this investigation speak directly to the cultural fairness of the TORR within the U.S. undergraduate population, inferences cannot necessarily be drawn to the population of older adolescents and adults across the country. For example, those non-native English speakers who are actively engaged in undergraduate education are likely systematically different on a number of relevant variables from non-native English speakers of the same age who are not enrolled in college. Of course, the same could be said for nearly any demographic variable analyzed here or elsewhere. Moreover, whether or not the TORR is invariant across samples of undergraduate students from different countries or continents remains an open question. For example, after translating the directions, can the TORR be a reliable measure of relational reasoning in Japan, or Israel, for example? Additionally, it remains to be seen whether the TORR may allow for invariant measurement across students who differ on their age or level of schooling (e.g., middle-, high-school, or undergraduate) or whether the measurement parameters may necessarily differ across these age ranges. Empirical investigations of such questions still lie in the future, but should be conducted if international or developmental inferences are desired from TORR scores.
Second, it is critical to note that a number of alternative DIF detection methods exist (e.g., logistic regression; Paek, 2012; item purification; Magis and Facon, 2013) and that the results of each of these methods are not always equivalent to one another. In the present study, a MIRT based likelihood ratio test was adopted as the most theoretically appropriate DIF detection procedure, given the multidimensional structure of TORR data, and the theoretical necessity to account for that multidimensionality within the DIF test. This is because, no DIF detection procedure can be valid if the measurement model on which the procedure is based does not fit the test data. Therefore, unidimensional DIF detection techniques would not have been appropriate here, and would have yielded different (invalid) results. Also importantly, the Bonferroni correction, used in this study to hold the Type-I error rate at 0.05, strongly affected the way the results were interpreted here. Specifically, the Bonferroni correction was utilized following methodological recommendations within the multidimensional context (Stark et al., 2006) and represented a conservative approach to testing DIF. If such a conservative approach was not utilized, the Type-I error rate across all the likelihood ratio tests would have been greatly inflated, and therefore some DIF—whether it be a Type-I error or not—would have been identified. Finally, it should be reiterated that the TORR data analyzed here was collected via the Internet, and as such the respondents did not complete the test in a standardized setting. In this case, totally haphazard responses are extremely unlikely given the reliability of the measurement model fit to the data, but it cannot be totally ruled out that some participants had low motivation to do their best on this study. For this reason, an investigation of DIF on the TORR in a higher-stakes testing environment, in which participant motivation is more assured, may be warranted in the future. However, given the findings of the present study, strong evidence now exists for the invariance of TORR items across demographic sub-groups of the American undergraduate population, and the appropriateness of the TORR for assessing relational reasoning in diverse groups of undergraduate students.
Ethics Statement
This study was approved by the institutional review board of the University of Maryland, where the study took place. In addition, this research followed all guidelines of the American Educational Research Association (AERA), and the American Psychological Association (APA). Following these guidelines, all participants in this study provided informed consent prior to participating.
Author Contributions
Statistical analysis and write-up: DD. Measure development and construct conceptualization: PA.
Conflict of Interest Statement
The authors declare that the research was conducted in the absence of any commercial or financial relationships that could be construed as a potential conflict of interest.
Supplementary Material
The Supplementary Material for this article can be found online at http://www.frontiersin.org/articles/10.3389/feduc.2018.00014/full#supplementary-material.
References
Alexander, P. A., Dumas, D., Grossnickle, E. M., List, A., and Firetto, C. (2016). Measuring relational reasoning. J. Exp. Educ. 84, 119–151. doi: 10.1080/00220973.2014.963216
Alexander, P. A., and The Disciplined Reading and Learning Research Laboratory. (2012). Reading into the future: competence for the 21st century. Educ. Psychol. 47, 259–280. doi:10.1080/00461520.2012.722511
Bassok, M., Dunbar, K. N., and Holyoak, K. J. (2012). Introduction to the special section on the neural substrate of analogical reasoning and metaphor comprehension. J. Exp. Psychol. Learn. Mem. Cogn. 38, 261–263. doi:10.1037/a0026043
Bock, R. D., Gibbons, R., and Muraki, E. (1988). Full-information item factor analysis. Appl. Psychol. Meas. 12, 261–280. doi:10.1177/014662168801200305
Bulut, O., and Suh, Y. (2017). Detecting multidimensional differential item functioning with the multiple indicators multiple causes model, the item response theory likelihood ratio test, and logistic regression. Front. Educ. 2:51. doi:10.3389/feduc.2017.00051
Cai, L. (2008). SEM of another flavour: two new applications of the supplemented EM algorithm. Br. J. Math. Stat. Psychol. 61, 309–329. doi:10.1348/000711007X249603
Cai, L. (2013). flexMIRT Version 2: Flexible Multilevel Multidimensional Item Analysis and Testscoring [Computer Software]. Chapel Hill, NC: Vector Psychometric Group.
Cai, L., Yang, J. S., and Hansen, M. (2011). Generalized full-information item bifactor analysis. Psychol. Methods 16, 221–248. doi:10.1037/a0023350
Census Bureau, U. S. (2010). Statistical Abstract of the United States, 2010. Washington, DC: Government Printing Office.
Chen, J. Effects of Test Anxiety, Time Pressure, Ability and Gender on Response Aberrance [Dissertation abstracts international]. US: ProQuest Information & Learning (2005).
Chi, M. T. H. (2013). “Thinking about relations in learning,” in Exploring and Leveraging Relational Thinking for Academic Performance. Symposium Conducted at the Meeting of the American Educational Research Association, ed. J. M. Kulikowich (San Francisco).
Chinn, C. A., and Brewer, W. F. (1993). The role of anomalous data in knowledge acquisition: a theoretical framework and implications for science instruction. Rev. Educ. Res. 63, 1–49. doi:10.2307/1170558
Chun, S., Stark, S., Kim, E. S., and Chernyshenko, O. S. (2016). MIMIC methods for detecting DIF among multiple groups: exploring a new sequential-free baseline procedure. Appl. Psychol. Meas. 40, 486–499. doi:10.1177/0146621616659738
Dumas, D., and Alexander, P. A. (2016). Calibration of the test of relational reasoning. Psychol. Assess. 28, 1303–1318. doi:10.1037/pas0000267
Dumas, D., Alexander, P. A., Baker, L. M., Jablansky, S., and Dunbar, K. N. (2014). Relational reasoning in medical education: patterns in discourse and diagnosis. J. Educ. Psychol. 106, 1021–1035. doi:10.1037/a003677
Dumas, D., Alexander, P. A., and Grossnickle, E. M. (2013). Relational reasoning and its manifestations in the educational context: a systematic review of the literature. Educ. Psychol. Rev. 25, 391–427. doi:10.1007/s10648-013-9224-4
Dumas, D., and Schmidt, L. (2015). Relational reasoning as predictor for engineering ideation success using analogies in TRIZ. J. Eng. Des. 26, 74–88. doi:10.1080/09544828.2015.1020287
Dumas, D., Schmidt, L. C., and Alexander, P. A. (2016). Predicting creative problem solving in engineering design. Think. Skills Creativity 21, 50–66. doi:10.1016/j.tsc.2016.05.002
Ehri, L. C., Satlow, E., and Gaskins, I. (2009). Grapho-phonemic enrichment strengthens keyword analogy instruction for struggling young readers. Read. Writ. Q. 25, 162–191. doi:10.1080/10573560802683549
Fischer, G. H. (1993). Notes on the Mantel-Haenszel procedure and another chi-squared test for the assessment of DIF. Methodika 7, 88–100.
Grossnickle, E. M., Dumas, D., Alexander, P. A., and Baggetta, P. (2016). Individual differences in the process of relational reasoning. Learn. Instruct. 42, 141–159. doi:10.1016/j.learninstruc.2016.01.013
Holyoak, K. J. (2012). “Analogy and relational reasoning,” in The Oxford Handbook of Thinking and Reasoning, eds K. J. Holyoak and R. G. Morrison (New York: Oxford University Press), 234–259.
Klockars, A. J., and Hancock, G. R. (1994). Per-experiment error rates: the hidden costs of several multiple comparison procedures. Educ. Psychol. Meas. 54, 292–298. doi:10.1177/0013164494054002004
Krawczyk, D. C. (2012). The cognition and neuroscience of relational reasoning. Brain Res. 1428, 13–23. doi:10.1016/j.brainres.2010.11.080
Livingston, S. A. (2012). “Item analysis,” in Handbook of Test Development, eds S. M. Downing and T. M. Haladyna (Hillsdale, NJ: Erlbaum), 421–441.
Magis, D., and Facon, B. (2013). Item purification does not always improve DIF detection: a counterexample with Angoff’s Delta plot. Educ. Psychol. Meas. 73, 293–311. doi:10.1177/0013164412451903
Naglieri, J. A., and Insko, W. R. (1986). Construct validity of the matrix analogies test—expanded form. J. Psychoeduc. Assess. 4, 243–255. doi:10.1177/073428298600400308
O’Neill, K. A., and McPeek, W. M. (1993). “Item and test characteristics that are associated with differential item functioning,” in Differential Item Functioning, eds P. W. Holland and H. Wainer (Hillsdale, NJ: Erlbaum), 255–276.
Paek, I. (2012). A note on three statistical tests in the logistic regression DIF procedure. J. Educ. Meas. 49, 121–126. doi:10.1111/j.1745-3984.2012.00164.x
Palumbo, M. V., and Steele-Johnson, D. (2014). Do test perceptions influence test performance? Exploring stereotype threat theory. North Am. J. Psychol. 16, 1–12. doi:10.1037/t08580-000
Poortinga, Y. H. (1995). Cultural bias in assessment: historical and thematic issues. Eur. J. Psychol. Assess. 11, 140–146. doi:10.1027/1015-5759.11.3.140
Raven, J. C. (1941). Standardization of progressive matrices. Br. J. Med. Psychol. 19, 137–150. doi:10.1111/j.2044-8341.1941.tb00316.x
Reise, S. P., Widaman, K. F., and Pugh, R. H. (1993). Confirmatory factor analysis and item response theory: two approaches for exploring measurement invariance. Psychol. Bull. 114, 552–566. doi:10.1037/0033-2909.114.3.552
Richland, L. E., Zur, O., and Holyoak, K. J. (2007). Cognitive supports for analogies in the mathematics classroom. Science 316, 1128–1129. doi:10.1126/science.1142103
Rivas, G. E. L., Stark, S., and Chernyshenko, O. S. (2009). The effects of referent item parameters on differential item functioning detection using the free baseline likelihood ratio test. Appl. Psychol. Meas. 33, 251–265. doi:10.1177/0146621608321760
Rosselli, M., and Ardila, A. (2003). The impact of culture and education on non-verbal neuropsychological measurements: a critical review. Brain Cogn. 52, 326–333. doi:10.1016/S0278-2626(03)00170-2
Shaunessy, E., Karnes, F. A., and Cobb, Y. (2004). Assessing potentially gifted students from lower socioeconomic status with nonverbal measures of intelligence. Percept. Mot. Skills 98, 1129–1138. doi:10.2466/pms.98.3c.1129-1138
Sinatra, G. M., and Broughton, S. H. (2011). Bridging reading comprehension and conceptual change in science education: the promise of refutation text. Read. Res. Q. 46, 374–393. doi:10.1002/RRQ.005
Stark, S., Chernyshenko, O. S., and Drasgow, F. (2006). Detecting differential item functioning with confirmatory factor analysis and item response theory: toward a unified strategy. J. Appl. Psychol. 91, 1292–1306. doi:10.1037/0021-9010.91.6.1292
Steele, C. M., and Aronson, J. (1995). Stereotype threat and the intellectual test performance of African Americans. J. Pers. Soc. Psychol. 69, 797–811. doi:10.1037/0022-3514.69.5.797
Sternberg, R. J. (2008). “Culture, instruction, and assessment,” in Western Psychological and Educational Theory in Diverse Contexts, eds J. Elliott and E. Grigorenko (New York: Routledge), 5–22.
Suh, Y., and Cho, S. J. (2014). Chi-square difference tests for detecting differential functioning in a multidimensional IRT model: a Monte Carlo study. Appl. Psychol. Meas. 38, 359–375. doi:10.1177/0146621614523116
Keywords: differential item functioning, relational reasoning, cultural fairness, educational testing and assessment, psychometrics
Citation: Dumas D and Alexander P (2018) Assessing Differential Item Functioning on the Test of Relational Reasoning. Front. Educ. 3:14. doi: 10.3389/feduc.2018.00014
Received: 18 September 2017; Accepted: 15 February 2018;
Published: 02 March 2018
Edited by:
Christopher Charles Deneen, RMIT University, AustraliaCopyright: © 2018 Dumas and Alexander. This is an open-access article distributed under the terms of the Creative Commons Attribution License (CC BY). The use, distribution or reproduction in other forums is permitted, provided the original author(s) and the copyright owner are credited and that the original publication in this journal is cited, in accordance with accepted academic practice. No use, distribution or reproduction is permitted which does not comply with these terms.
*Correspondence: Denis Dumas, ZGVuaXMuZHVtYXNAZHUuZWR1