 Ludovic Jourdin
 Sanne M. T. Raes1
 David P. B. T. B. Strik
- 1Sub-Department of Environmental Technology, Wageningen University and Research, Wageningen, Netherlands
- 2Advanced Water Management Centre, University of Queensland, Brisbane, QLD, Australia
Current challenges for microbial electrosynthesis include the production of higher value chemicals than acetate, at high rates, using cheap electrode materials. We demonstrate here the continuous, biofilm-driven production of acetate (C2), n-butyrate (nC4), and n-caproate (nC6) from sole CO2 on unmodified carbon felt electrodes. No other organics were detected. This is the first quantified continuous demonstration of n-caproate production from CO2 using an electrode as sole electron donor. During continuous nutrients supply mode, a thick biofilm was developed covering the whole thickness of the felt (1.2-cm deep), which coincided with high current densities and organics production rates. Current density reached up to −14 kA m−3electrode (−175 A m−2). Maximum sustained production rates of 9.8 ± 0.65 g L−1 day−1 C2, 3.2 ± 0.1 g L−1 day−1 nC4, and 0.95 ± 0.05 g L−1 day−1 nC6 were achieved (averaged between duplicates), at electron recoveries of 60–100%. Scanning electron micrographs revealed a morphologically highly diverse biofilm with long filamentous microorganism assemblies (~400 μm). n-Caproate is a valuable chemical for various industrial application, e.g., it can be used as feed additives or serve as precursor for liquid biofuels production.
Introduction
The envisioned circular economy is depending on efficient raw materials (re)use without any harmful emissions into the environment (Sharon and Kamp, 2016). Water is already a scarce good while four billion people face severe water shortage at least 1 month per year (Mekonnen and Hoekstra, 2016). Evidently clean recycling technologies must be developed that are efficient in usage of water, nutrients, and carbon. Carbon building blocks can be recycled from biomass residues, organic wastes, and CO2 sources. Microbial electrosynthesis is an emerging clean technology in which CO2 can be converted into biochemicals like acetate, with an electrode as sole direct electron source (Rabaey and Rozendal, 2010). MES uses minimal amounts of water and naturally occurring microorganisms as cheap, robust, and self-repairing catalysts.
To date, mainly acetate or methane has been produced in MESs from CO2. Other products such as n-butyrate, propionate, ethanol, butanol, and isopropanol were also produced in relatively small amounts and rates in MESs from CO2 (Ganigue et al., 2015; Arends et al., 2017; Batlle-Vilanova et al., 2017; LaBelle and May, 2017). n-Caproate formation in MES occurred incidental (at concentration of 0.739 g L−1) from acetate (Van Eerten-Jansen et al., 2013) or was reported as a non-quantified trace compound (Sharma et al., 2013; Batlle-Vilanova et al., 2017). As such n-caproate formation in MES is principally feasible; though a continuous quantified production was never reported. Medium-chain fatty acids (MCFAs) like n-caproate can become important platform chemical while they can be used as feed additives after extraction or further converted into other products such as liquid biofuels, plastics, and lubricants (Agler et al., 2011). Once these latter products would reach their end-of-life time, they can conceptually be recycled by, e.g., incineration or digestion into methane which will release CO2 that can be re-used as building block for the same products. We define the latter CO2 as “circular CO2.”
Recently, Jourdin and co-workers developed novel electrodes which led to the highest acetate production rates to date when normalized to electrode dimension (Jourdin et al., 2014, 2015a,b, 2016a,b). These MES systems converted electrons and CO2 into acetate at high rates, up to 133 kg m−3electrode day−1 (Jourdin et al., 2015b, 2016a). It was shown that a well-developed biofilm over the whole surface of the electrode was an important prerequisite for a productive biocathode. The use of electrodes without a biofilm but relying on bacteria in suspension has achieved lower rates (Blanchet et al., 2015). Recently, LaBelle and May (2017) enhanced acetate volumetric productivity up to 18.7 g L−1 day−1 (when normalizing to catholyte volume) by optimizing the cathode to catholyte volume ratio (LaBelle and May, 2017).
An opportunity for practical implementation of MES is to produce continuously longer carbon-chain (>C2) organic compounds like n-caproate from CO2 which have higher values than acetate (Jourdin and Strik, 2017; LaBelle and May, 2017). To date, MCFA production has been achieved by chain elongation fermentation with open cultures (i.e., reactor microbiome) or pure cultures, using organics as both electron and carbon sources (Angenent et al., 2016). Typically, acetate is fermentative elongated to MCFAs using ethanol (Grootscholten et al., 2013a), lactate (Kucek et al., 2016a), or methanol (Chen et al., 2016) as electron donor. A life cycle assessment on an ethanol and food waste chain elongation biorefinery process showed that the use of ethanol had a dominant impact on the environmental performance; specifically on the global warming potential, acidification potential, and eutrophication potential (Chen et al., 2017). Using electricity (i.e., MES coupled to solar or wind power) may present several advantages over supplying organics as electron donor, e.g., no biomass or (bio)waste source is needed and water is saved, of which huge amount is required during agricultural processes to produce, e.g., ethanol (Raes et al., 2017).
The focus of the present study was to investigate the feasibility of (i) elongating CO2 to n-caproate with an electrode as sole electron source and (ii) reaching continuous production at high rates using a cheap commercially available electrode material. Accordingly, we report on the development of a microbial electrosynthesis process achieving elongation of CO2 (sole carbon source) to n-butyrate (nC4) and n-caproate (nC6), using an electrode as electron donor and a carbon felt cathode with a densely populated multispecies microbiome as catalyst. For this study, duplicate bioelectrochemical reactors were operated in batch and consequently continuous nutrient supply mode. Bioelectrochemical performance and scanning electron microscopy (SEM) were applied to analyze the results.
Results and Discussion
The results shown in Figures 2–4 below were obtained from one of the two reactors. The results obtained on the duplicate reactor followed the same trends as discussed below, and are shown in the supporting information, as well as in Figure 5. Relevant reactor performance values are summarized in Table S1 in Supplementary Material for both reactors, normalized to projected surface area (psa) of the electrode, electrode volume, as well as to the catholyte volume in the cathode chamber. These ways of normalization have been extensively discussed previously (Patil et al., 2015b; Jourdin and Strik, 2017).
Continuous Supply of Nutrients Allowed for the Development of a Thick, Uniform, and Electroactive Biofilm throughout Unmodified Carbon Felt Electrode
During the first 133 days, while the reactors were operated in fed-batch mode, biofilm development was visually observed only on the carbon felt surface facing the membrane (Figures S1A–C in Supplementary Material). Within the first few days after the continuous nutrients supply started, biofilm growth could be observed with naked-eyes on the opposite side of the carbon felt (side not facing the membrane) as well as throughout the felt (Figures S1D–H in Supplementary Material). The continuous supply of nutrients supported the growth of a thick biofilm, which was seemingly more effective than adding nutrients in a fed-batch manner every 3–4 days. Macronutrients (N, P, C) were measured not to be limiting during the fed-batch period (data not shown). Micronutrients may have become limiting during this period, though 65% of the catholyte was replaced with fresh medium at day 50, which did not lead to an increase of biofilm coverage and electron uptake (see below). Further investigation into optimal nutrient requirement will be needed.
Scanning electron microscopy performed at the end of the experiment confirmed that the whole surface of the sampled carbon felt, on both sides was covered with a thick and uniform biofilm (Figures 1A,B). Figures S2A–E in Supplementary Material shows images of all locations. It can be observed that not only the fibers of the carbon felt were covered with biofilm but also the macro-pores between carbon fibers, bridging gaps of over several 100 micrometers. It raises the question as to how the electrons were transferred over such long distance, i.e., microorganisms far away from the supply source of electrons, namely the electrode surface, need to take up electrons to function. Furthermore, we observed that the biofilm was developed throughout the whole thickness of the carbon felt (1.2 cm; Figures 1C–H), with individual carbon fibres at different depths from the surface covered with biofilm, as well as their interspace (see Figures S2F–H in Supplementary Material for more images, at different locations throughout the electrode).
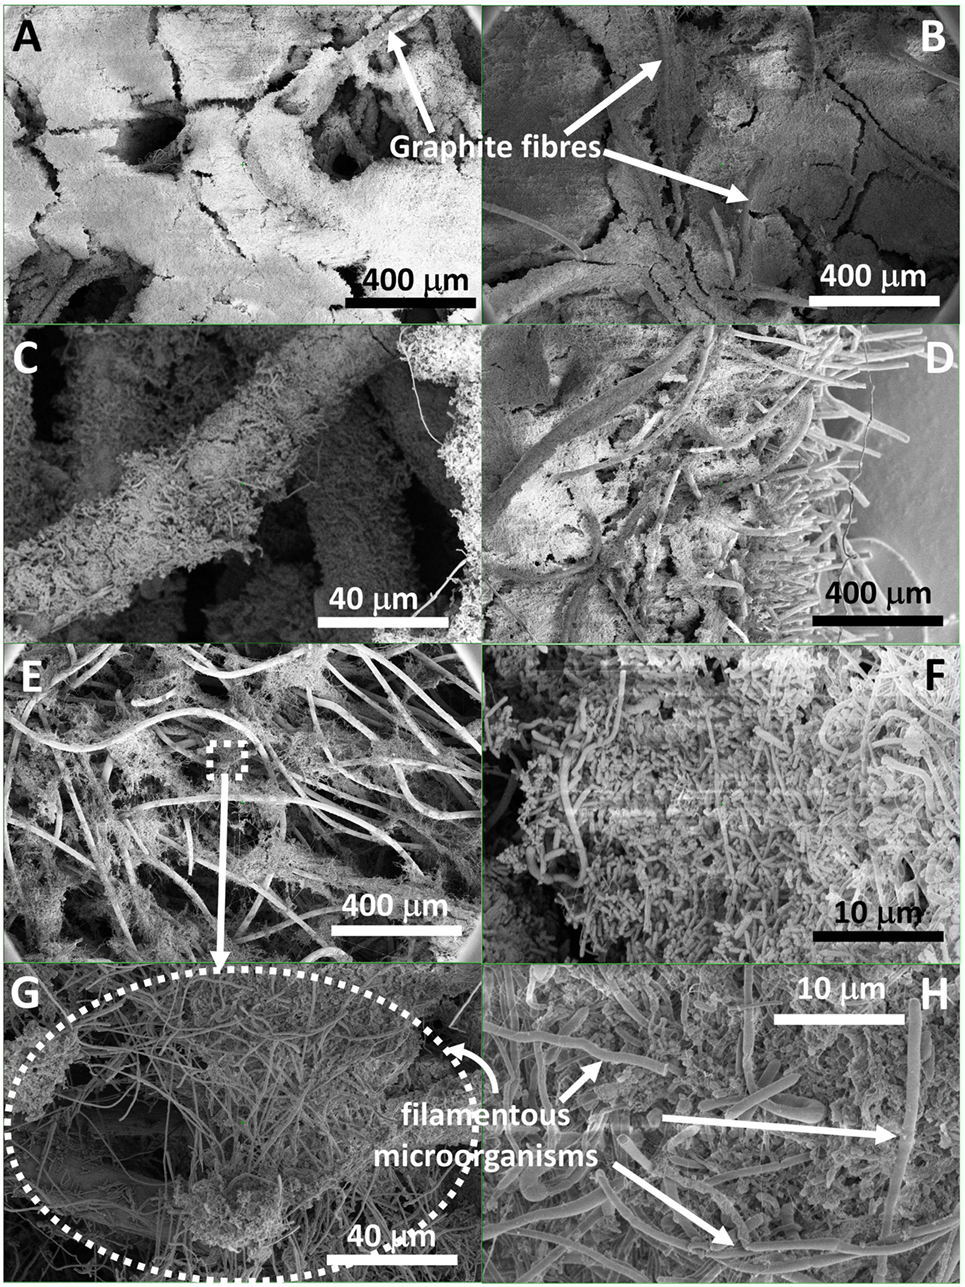
Figure 1. Scanning electron micrograph images at different magnification of a biofilm developed (A) on the carbon felt surface facing the membrane (I–III, annotation used on Figure S3 in Supplementary Material), (B) on the felt surface facing the opposite side (VII–VIII), (C) on individual carbon fibers at different depth, (D) through the thickness of the carbon felt (side-view), (E) in the middle, width-wise, of the carbon felt electrode (i.e., ca. 0.6 cm deep; IV–V), and showing (F–H) a wide variety of shape and size of microorganisms colonizing the electrode, and (G,H) long filamentous microorganism assemblies.
Such biofilm coverage in the three directions, i.e., not only on the surface but also deeper in the carbon felt, has not been reported to date for microbial electrosynthesis studies using unmodified carbon felt as electrode material. Recently, Cui et al. (2017) reported the formation of a multi-layered biofilm around the carbon fibers of a metal-oxide-modified carbon felt electrode, using a pure culture of Sporomusa ovata (Cui et al., 2017). Relatively low current densities were achieved, between −1.8 and −2.5 A m−2, at −0.7 V vs. standard hydrogen electrode (SHE). However, microorganisms only attached sporadically to unmodified carbon felt in that study. Similarly, Aryal et al. (2016) and Im et al. (2016) showed only few microorganisms attaching to the surface of unmodified carbon felt, while a more developed biofilm covered the surface of graphene-modified carbon felt (Aryal et al., 2016). All these studies were carried out in H-type reactors with magnetic stirring.
Unlike biofilm formation as observed here, Bajracharya et al. (2017a) and Arends et al. (2017) have both observed that microorganisms in suspension were responsible for most of the CO2 reduction to reduced products, as biomass was washed out upon switching their systems from fed-batch to continuous mode. Once finding the optimal HRT to prevent biomass washout, Arends et al. (2017) suggested that the increased supply of trace elements and vitamins could be linked to the better performance of their MES systems, along with a higher growth rate imposed by the shorter HRT, a better control of pH, and continuous removal of reduced products. Our work suggests that in addition of the positive effect of continuously adding nutrients, a combination of the following factors that were different than applied in the literature may also have played a role in the observed biofilm development: the forced-flow through regime, the long-term operation, and/or the microbial inoculum. A forced-flow through regime using graphite felt electrode was also adopted by Bajracharya et al. (2017a), though in that study it did not lead to biofilm development as observed here.
Oxygen transfer from the anode to the cathode likely did not play a significant role on the formation of the biofilm. To provide conditions for this, oxygen was actively flushed out with continuous CO2 and CO2/N2 gas sparging of both anolyte and catholyte, respectively, as also suggested by Marshall et al. (2017). As such, it is expected that under the applied experimental conditions, the role of oxygen was minor; though we cannot fully exclude a potential role as shown by Marshall et al. (2017) that provided evidence that microaerobic conditions (due to oxygen cross-over) may provide a supportive role to develop the microbial community within mixed culture MES.
Electron Uptake Rate Significantly Enhanced with Dense Biofilm Development
Electron uptake rate (current) at a fixed cathode potential of −0.85 V vs. SHE was recorded during 314 days. The current normalized to electrode volume is depicted in Figure 2A. Because carbon felt is a three-dimensional electrode with pore diameters in the order of 10–100 µm, normalization to its volume is particularly relevant (Jourdin and Strik, 2017). The current evolution normalized to psa is shown in Figure S4A in Supplementary Material.
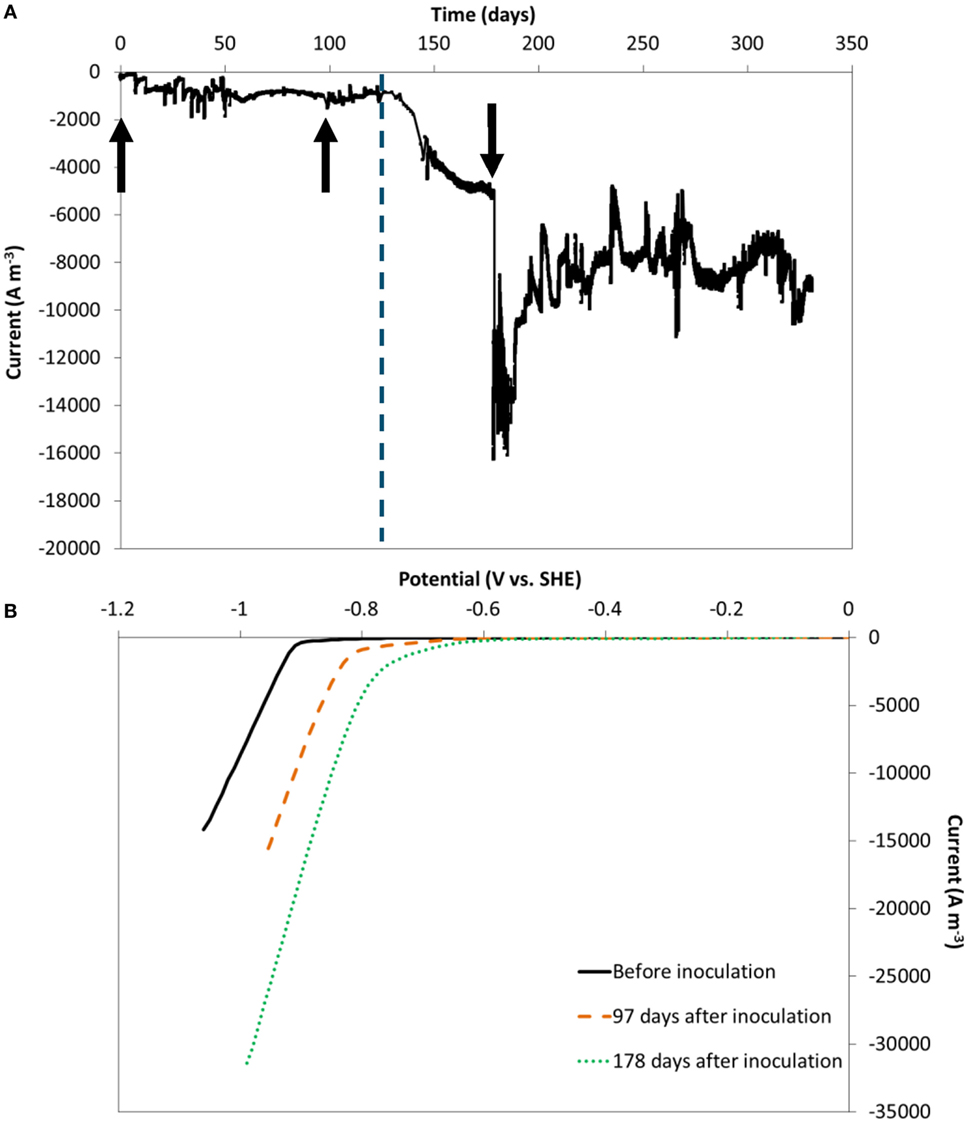
Figure 2. (A) Current evolution over time, at an applied cathode potential of −0.85 V vs. standard hydrogen electrode (SHE), normalized to electrode volume. The vertical dashed line represents the time when nutrients addition was switched from fed-batch mode to continuous mode. (B) Reductive scan of CV recorded in the absence of microorganisms (black full line), 97 (orange dashed line) and 178 days after inoculation (green dotted line). The arrows indicate the moments chronoamperometry was momentarily stopped to run cyclic voltammetry.
In the first 20 days after inoculation the current increased from ca. −200 A m−3 to ca. −1,000 A m−3 and remained largely constant during the remaining of the fed-batch period until 133 days. During this period, electron uptake rate was not affected by the change of carbon dioxide source (bicarbonate, periodic pure CO2, or continuous CO2:N2 30–70%), as previously reported (Jourdin et al., 2016a,b).
From day 133 onward, the reactors were switched to continuous operation mode with an hydraulic retention time of 4 days. Within the first few days after the change, the electron uptake rate greatly increased, up to ca. −5.2 kA m−3 at day 178 and further to between −8 and −10 kA m−3 (−100 to 130 A m−2 psa) from day 194 to the end of the experiment. A similar significant increase was observed on the duplicate reactor, on which the current was recorded for 390 days (Figures S4B and S5A in Supplementary Material). The maximum current reached on the duplicate reactor was similar: ca. −7 to 10 kA m−3 at the end of the experiment (−90 to 130 A m−2 psa, days 369–390). These correspond to the highest biocathode current densities recorded on carbon felt to date, a relatively cheap electrode material (62 € m−2 from the provider of the carbon felt used here, for lab-use). The obtained current densities are of the same order of magnitude as the highest electron uptake rates reported using carbon nanotube-modified reticulated vitreous carbon electrodes for MES of acetate from CO2 at the same applied potential (−10 kA m−3 to −102 A m−2 psa) (Jourdin et al., 2015b, 2016a,b). An overview of the performance indicators of most MES studies that used carbon felt as cathode material, in comparison to the highest performing MES systems, is shown in Table S2 in Supplementary Material. A more complete comparison of all MES studies up to 2016 has recently been reviewed (Jourdin and Strik, 2017).
Cyclic voltammetry experiments at day 0, at the end of the fed-batch period (day 97) and after 45 days of continuous operation (Figure 2B) confirmed (bio-)electrocatalytic activity. The onset potential of the reductive catalytic wave shifted from day 0 (ca. −0.9V vs. SHE) to higher potentials at day 97 (ca. −0.75V vs. SHE). Another increase in onset potential was observed at the last CV at day 178 (ca. −0.6V vs. SHE). The same trends were observed in the duplicate reactor (Figure S5B in Supplementary Material), in which the onset potential increased even further to −0.5 V vs. SHE at day 366. The increase in onset potential suggests an increase in biological catalytic activity in the systems over time, which is in line with the observed increase of biofilm coverage throughout the electrode (i.e., higher biocatalysts density) and the subsequent increase of electron uptake rate observed (Figure 2A).
Cyclic Voltammograms Triggered Further Increases of Biocatalytic Activity Which Was Sustained for Long Term
After the CV recorded on day 178, the electron uptake rate abruptly increased from −5.2 kA m−3 before the CV to between −11 and −14 kA m−3 (>210% increase) and sustained for over 12 days, after which the current stabilized between −8 and −10 kA m−3 for the remaining 124 days (Figure 2A). Similarly, the current on the duplicate reactor increased by 200% after the CV recorded on day 178, and again after the CV on day 366 (Figure S5 in Supplementary Material). However, the current was not influenced after the CVs ran before inoculation and on day 97 on both duplicates. The main difference was the biofilm coverage which was much less developed on day 97, as discussed above. This finding, though in need of more investigation, could present a novel and easy strategy to boost electron uptake rate, and sustain it for a long period of time.
Caproate (C6) and Butyrate (C4) Continuous Bioelectrochemical Production from CO2
Short and MCFAs (C2–C8) as well as alcohols (C2–C6) production were followed for each reactor throughout the course of the experiments. The cumulative production, production rates, and electron recovery into acetate (C2), n-butyrate (nC4), and n-caproate (nC6), over time, are shown in Figure 3. Figure S6 in Supplementary Material shows these results obtained on the duplicate reactor. The production rates normalized to the other parameters mentioned earlier are also shown in Figure S7 and Table S1 in Supplementary Material for both duplicates. No alcohols or other organics were detected throughout the experiment in both reactors.
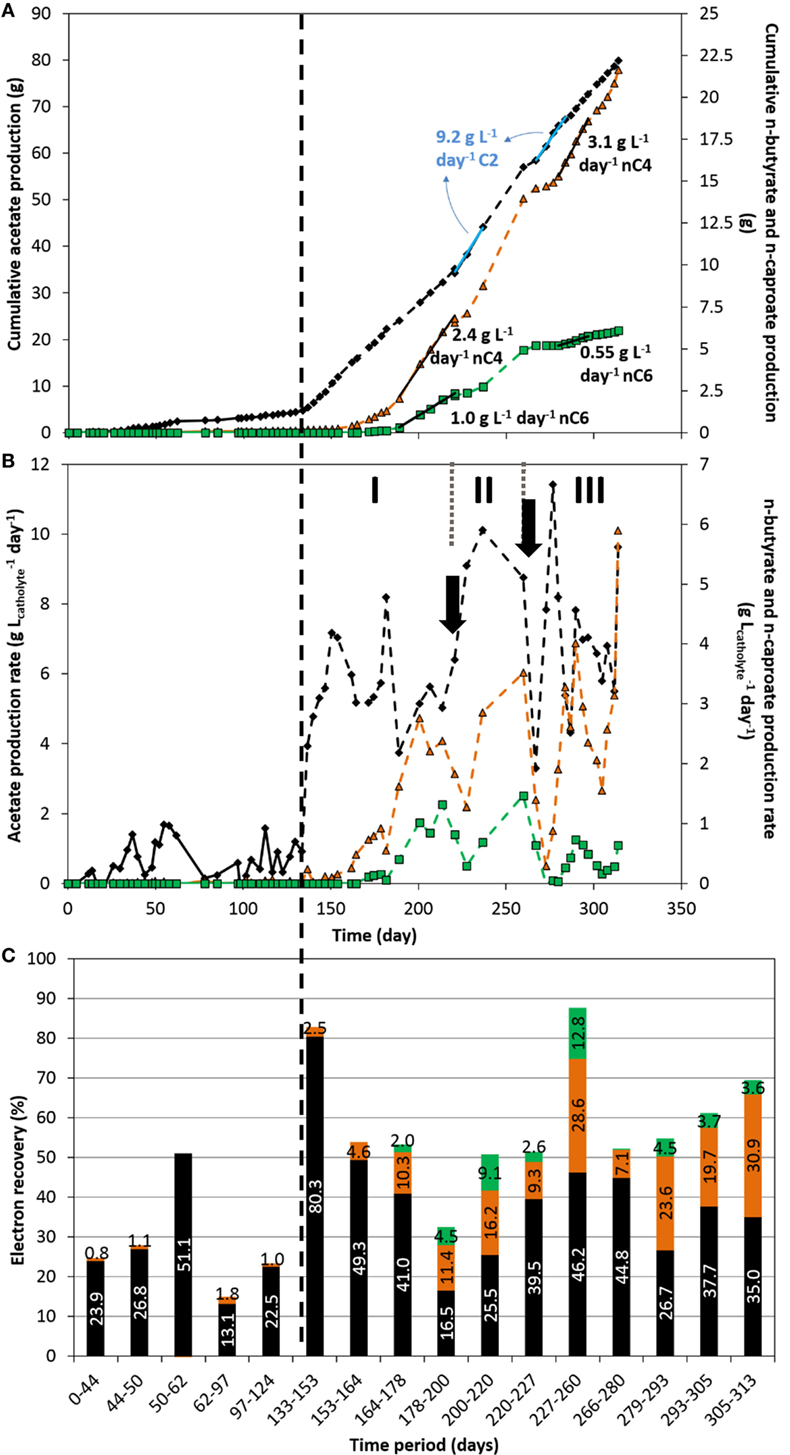
Figure 3. Acetate (black diamond), n-butyrate (orange triangle), and n-caproate (green square) cumulative production (A), production rate (B), and electron recovery into each product (C) over time. The vertical dashed line represents the time when nutrients addition was switched from fed-batch mode to continuous mode. The two arrows indicate the time at which significant leakage of the catholyte occurred. The three periods I, II, and III indicate periods of interest discussed in the text.
First, it can be observed that mostly acetate was produced in the fed-batch period, with a maximum production rate of about 1.83 ± 0.15 g L−1 day−1 (average and SD between both reactors) and a fairly low electron recovery into acetate. Technical issues (e.g., small leakages, gas mixture inflow instability) occurred between days 62 and 97 which affected the conversion of CO2 to organics up to the end of the fed-batch period, as can be seen in Figures 3B–C. In line with the increase of electron uptake seen above directly after the switch from fed-batch to continuous mode (Figure 2), the production rate of acetate immediately and significantly increased up to 7.2 g L−1 day−1 just few days after the operational change (day 150, period I, Figure 3B). Maximum acetate production rates sustained for over 4–5 sampling dates (>17 days) of 9.85 ± 0.65 g L−1 day−1 were reached (average and SD between both reactors; days 220–237 and 267–284 (Figure 3A) and 373–390 (Figure S6A in Supplementary Material), respectively). Rates in the range from 5 to 9 g L−1 day−1 could be maintained throughout the period from day 133 to the end (Figure 2B), which are one order of magnitude higher than the highest rates ever reported on carbon felt-based MES (Table S2 in Supplementary Material). Our acetate production rates were comparable to rates achieved in industrial biological processes such as fermentation and anaerobic digestion (Angenent et al., 2002; Graves et al., 2006; Martin et al., 2013; Richter et al., 2013). If MES is to be implemented, productivity must at least be within the range of already industrially relevant bioproduction/bioconversion processes, such as bioethanol from starch plants (commercialized at 30–90 g L−1 day−1)(Graves et al., 2006; Richter et al., 2013), or biogas anaerobic digesters, with maximum productivities of 12 g L−1 day−1 using synthetic substrates, which will not easily be achieved with real substrate (Angenent et al., 2002; Martin et al., 2013; Kucek et al., 2016b).
About 10–15 days after the feeding strategy change, n-butyrate production started slowly and increased abruptly after day 153. Remarkably, 10 days later (around day 164), n-caproate production started as well, with a sharper increase in production rate after day 182. n-butyrate production in microbial electrosynthesis systems from carbon dioxide has been reported by couple of other groups recently (Ganigue et al., 2015; Arends et al., 2017; Bajracharya et al., 2017a; Batlle-Vilanova et al., 2017; LaBelle and May, 2017), but to the best of the authors’ knowledge, continuous n-caproate has not been reported to date from CO2-based MES. A maximum continuous production rate of n-butyrate of 3.2 ± 0.1 g L−1 day−1 was achieved here (averaged between both reactors; days 279–297, Figure 2A, and 374–390, Figure S6A in Supplementary Material), which is about 14 times higher than the highest rate reported to date in a similar system (LaBelle and May, 2017). In our study, a fairly high continuous production of 0.95 ± 0.05 g L−1 day−1 of n-caproate was also achieved, averaged between extended periods from both reactors, from days 188–220 (Figure 3A) and days 374–390 (Figure S6A in Supplementary Material). Though the production of organics was unstable (see explanations below in Section “Dense Biofilm-Based Carbon Biocathode Allowed Successive Production of Acetate, n-Butyrate, and n-Caproate from CO2”), continuous production of n-butyrate and n-caproate was demonstrated from days 143 to 260 without interruption, and from day 272 to the end of the experiment. We achieved here a total concomitant production of 6.65 gC L−1 day−1 into C2, nC4, and nC6 (days 374–390, Figure S6A in Supplementary Material), which is similar to the highest rate (when normalized to catholyte volume) reported by LaBelle and May (2017) who recently reported a production rate of 7.61 gC L−1 day−1 into sole acetate, at 35% electron recovery (see Table S2 in Supplementary Material).
A Biofilm-Driven Microbial Electrosynthesis System
Remarkably, electron recoveries into organics increased up to 83% after switching to continuous feeding, concomitantly with the increase in current densities (days 133–153, Figure 3C). The observed increase in biofilm coverage throughout the carbon felt over time (Figure 1; Figure S2 in Supplementary Material), could explain that more of the electrons converted ended up in organic products. Furthermore, the switch from fed-batch to continuous mode decreased the concentration of microorganisms in suspension (Optical density660nm < 0.1). The increase in performance (rates and recoveries) while the concentration of microorganisms in suspension decreased highlight the activity of the biofilm in the conversion of CO2 to products of interest, over the microorganisms in suspension, as previously reported by Jourdin et al. (2016a,b). A leakage of the catholyte on day 266 also removed all, or most of the microorganisms in suspension. Despite this, catalytic activity remained and organics production immediately restarted at similar rates after replenishing the system with fresh catholyte (Figures 2 and 3).
Up to 12.8% of the electrons were recovered in n-caproate in the most productive period (days 227 to 260, Figure 3), while 28.6 and 46.2% were recovered into n-butyrate and acetate, respectively, to a total of 87.6% coulombic efficiency. In our study, a small fraction of the electrons taken up were not recovered into identified soluble organics. The remaining electrons may have ended up in biomass or unused hydrogen for example (Jourdin et al., 2015a). Overall, higher electron recoveries from 65 to 100% were achieved on the duplicate reactor in the continuous-feeding phase (Figure S6C in Supplementary Material), which may be explained by less damaging events (e.g., leaks) occurring on this reactor (see below). The lower current density recorded for most of the duplicate reactor lifetime cannot explain the higher electron recoveries. Indeed, an electron recovery into organics of 89.7% was achieved in the last period on the duplicate reactor (days 369–390), during which the current density was the highest (−7 to 10 kA m−3, −90 to 130 A m−2, Figure S5A in Supplementary Material). A similar product distribution was achieved with 7.7, 28.4, and 53.6% of electron recovered into nC6, nC4, and acetate, respectively. These results demonstrate that high electron recoveries at high current densities can be achieved on unmodified carbon felt (Table S2 in Supplementary Material).
Dense Biofilm-Based Carbon Biocathode Allowed Successive Production of Acetate, n-Butyrate and n-Caproate from CO2
Figure 4 and Figure S8 in Supplementary Material show the concentration profile of each of the products over time of both duplicates. On day 50, 65% of the catholyte was replaced, causing the decrease in concentrations observed. Apart from that, acetate concentration increased fairly quickly over the first 62 days. A maximum acetate concentration of 6.2 g L−1 was reached in fed-batch conditions.
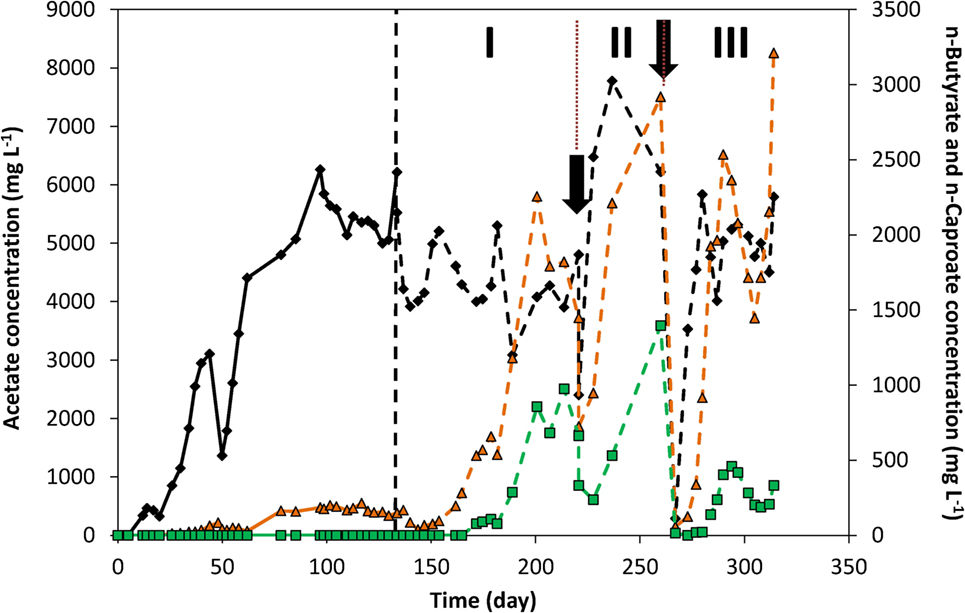
Figure 4. Acetate (black diamond), n-butyrate (orange triangle), and n-caproate (green square) concentrations over time. The vertical dashed line represents the time when nutrients addition was switched from fed-batch mode to continuous mode. The two arrows indicate the time at which significant leakage of the catholyte occurred. The three periods I, II, and III indicate periods of interest discussed in the text.
From the switch to continuous addition of nutrients on day 133 to day 220 (period I in Figure 4), acetate concentrations around 4–5 g L−1 were maintained. During that period, n-butyrate and n-caproate were successively produced, as mentioned above, up to reaching concentrations from days 200 to 220 around 1.5–2.2 g L−1 for n-butyrate and ca. 0.7–1 g L−1 of n-caproate. From days 200 to 220 the current density was also constant around −8.5 kA m−3, which led to define this period as a quasi-stable continuous reactor performance. After sampling on day 220 (first arrow in Figure 4), a leak in the recirculation pump tubing led to a loss of half of the catholyte which was immediately replaced with fresh catholyte. This led to C2, nC4, and nC6 concentrations to fall to 2.4, 0.6, and 0.3 g L−1 on day 220, respectively. In the 7 days that followed that leak (start of period II, Figure 4), acetate concentration significantly increased up to 6.5 g L−1, corresponding to an increase of production rate from 6.4 to 9.1 g L−1 day−1 (see Figure 3B, period II), while current density remained constant (Figure 2A). In those 7 days, n-butyrate only slightly increased to 0.95 g L−1 while n-caproate decreased further to 0.24 g L−1. In the following 9 days, n-butyrate concentration rose to 2.2 g L−1, likely due to the higher acetate availability, which coincided with n-caproate production rising up again as well. The next 23 days (from days 237 to 260, end of period II, Figure 4) corresponded to the highest n-caproate production period reaching a maximum of 1.5 g L−1 and 1.5 g L−1 day−1 (Figure 3B), during which high acetate and n-butyrate concentrations were observed. During that period, it can be observed that acetate concentration decreased while both nC4 and nC6 concentrations increased. On day 266 (second arrow, Figure 4), all organics concentration fell to 0 due to another (complete) leakage of the catholyte. However, this allowed to observe the same phenomenon after adding fresh catholyte. First, acetate rapidly started being produced at similar rates right after the addition (day 266). Six days later (day 272), n-butyrate production rose rapidly as well up to 2.5 g L−1 on day 289 (max concentration of 3.2 g L−1 on day 313), followed by n–caproate production from day 280. This successive-production phenomenon can also be observed on the duplicate reactor (Figure S8 in Supplementary Material). From these observations, it would seem that an apparent C2 “threshold” concentration of 2–4 g L−1, needed to be reached before nC4 production started, and a concentration of 0.5–2 g L−1 nC4 for nC6 to start being produced.
Figure 5 shows the current density and organics’ concentration profiles over the period of continuous supply of nutrients recorded on the duplicate reactor, from days 133 to 390. It can be observed that lower products’ concentrations and production rates were achieved up to day 368 (end of period III, Figure 5B). This can be explained by a process which performance and product spectrum was controlled by current density level and products’ concentration. First of all, during most of periods I through III, a lower current density was recorded, ca. −3.5 ± 0.5 kA m−3, than on the reactor presented above. This lower electron uptake rate led to a generally lower acetate concentration of around 2 to 4 g L−1 (Figure 5). As discussed above, this corresponds to the concentration range in which n-butyrate production was apparently triggered. However, this lower acetate concentration did not allow to steer the cathodic reaction to high n-butyrate concentration, which ranged around 0.4–0.9 g L−1 in that period (III, Figure 5B). Similarly, this allowed n-caproate production to only low concentrations of about 0.15 ± 0.05 g L−1 (period III, Figure 5), though being continuously produced over a long period (see production rates in Figure S6B in Supplementary Material). The first period in which current densities were higher, 5–6 kA m−3 from days 189 to 200 (period I, Figure 5), allowed to reach higher acetate concentration of up to 8.6 g L−1. However, this could also be explained by a response to the CO2-limitation stress the biofilm was subjected to during the 7 days prior (from day 182, arrow in Figure 5), due to a malfunction of the CO2 supply, which explains the drop in products’ concentrations. In the following 20 days (period II), n-butyrate and n-caproate concentrations successively increased to higher values, likely in response to a higher acetate availability, while acetate concentration decreased. This observation is in line with the concentration-driven production described above. The link between current density and reactor performance can be observed in the last period of the experiment (IV, Figure 5). From day 369, current densities rose to and remained around 7–8 kA m−3 for 21 days until the experiment was stopped. Consequently, all products’ concentration (Figure 5) and production rate (Figure S6B in Supplementary Material) increased significantly up to reaching similar performance as observed in Figures 3 and 4, when current densities were similar in both reactors (Table S1 in Supplementary Material).
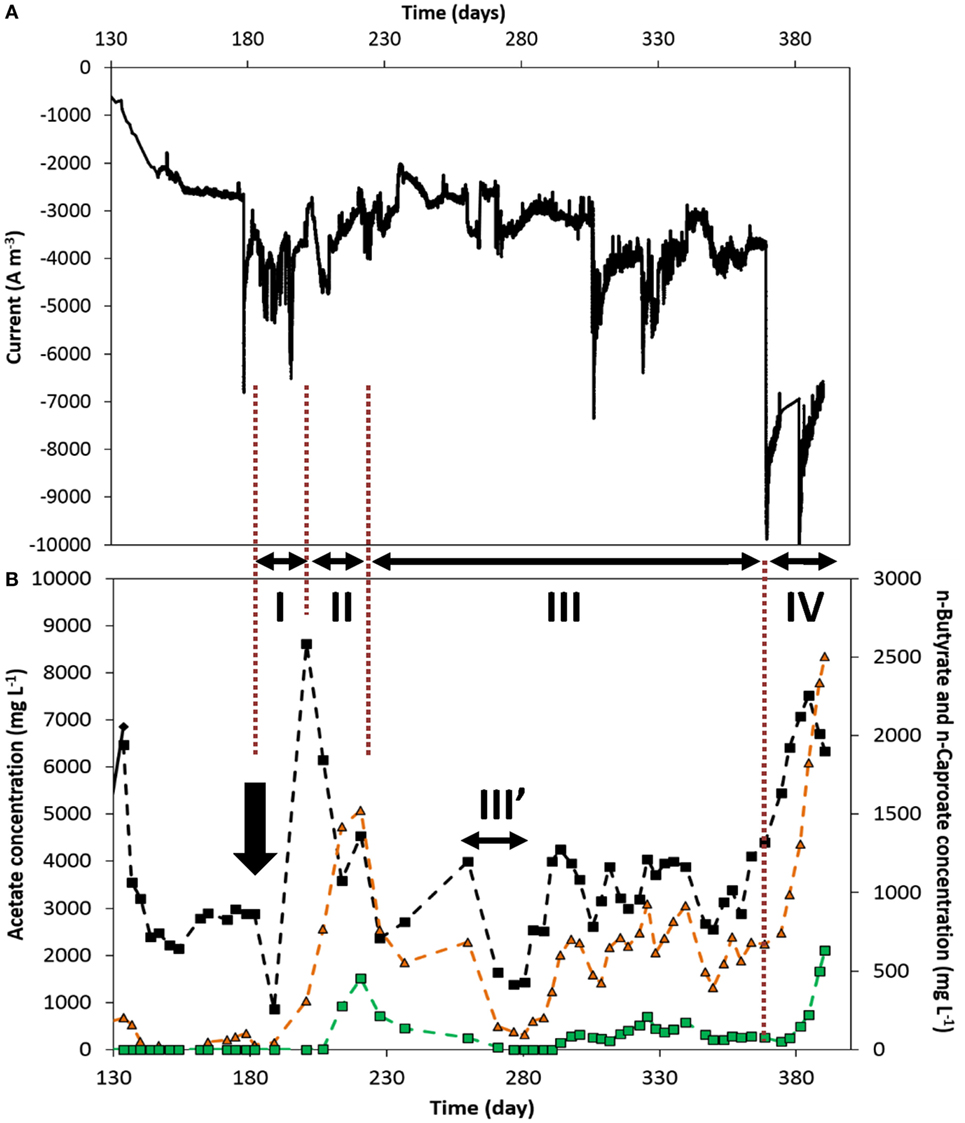
Figure 5. Duplicate reactor: (A) current normalized to electrode volume and (B) acetate (black diamond), n-butyrate (orange triangle), and n-caproate (green square) concentration evolutions over time, from the switch to continuous addition of nutrients. The two arrows indicate the time at which significant leakage of the catholyte occurred. The three periods I, II, and III indicate periods of interest discussed in the text. III′: technical difficulties that led to multiple leakages. The whole period from inoculation can be seen in Figures S5 and S8 in Supplementary Material.
Successive production of nC4 and nC6 were also observed in the start-up phase of typical chain elongation fermentation studies from acetate plus ethanol (Steinbusch et al., 2011; Grootscholten et al., 2013b). In those studies, a first elongation of C2 to nC4 can be observed, before longer chains are produced. Though, once short VFAs become limited (e.g., C2), longer VFAs (nC4) become primary available and are elongated to nC6. In the latter, upon addition of more soluble electron donor, i.e., ethanol, the higher reducing equivalent availability also typically leads to the production of more reduced compounds, i.e., longer carbon-chain compounds such as nC6, which quickly becomes the main product accumulating (Angenent et al., 2016).
Yeast extracts and vitamin B have been reported to be essential nutrients for chain elongating fermentative microorganisms (Barker, 1947; Grootscholten et al., 2013b; Angenent et al., 2016). It is worth noting that none of them were added at any time in our reactors. Addition of yeast extracts and vitamin solutions has often been linked to high operational costs for biological processes (Koutinas et al., 2016). While exact metabolic mechanisms remain to be elucidated in our systems, not adding these nutrients could lead to financial benefit and reduced costs. On the contrary, the addition of a chemical methanogenesis inhibitor, as used in our study, would negatively affect the application perspective. It is worth mentioning that tungsten and selenium-based nutrients were not added in our reactors. Both W and Se were reported to be essential for hydrogenotrophic methanogenic microorganisms to convert CO2 into methane using H2 as electron donor (Blaut, 1994). Additionally, acetoclastic methanogenesis would likely be inhibited at low pH such as applied in our study (pH 5.8) (Chen et al., 2002). Other strategies, such as inoculum pretreatment and several culture transfers, have showed successful at suppressing methanogenesis activity without adding an expensive chemical inhibitor (Patil et al., 2015a; Bajracharya et al., 2017b). Further experiments will need to be carried out without adding a chemical methanogenesis inhibitor in our MES systems, to verify whether methane production is inhibited.
High Microorganism Morphology Diversity with Filamentous Microorganism Assemblies
Figures 1F–H and Figure S9 in Supplementary Material are high magnification SEM images that show the electrodes were colonized by a high diverse-shaped microbial community. Both cocci and rod-shaped microorganisms can be observed, of which the size of the rod-shaped microbes vary from 1 to 10 µm. In most MES studies to date, the morphology of the microorganisms colonizing the cathode was shown to be fairly homogeneous, mainly small rods (ca. 1- to 2-µm long) (Jourdin et al., 2014, 2015b). The highly diverse morphology in our reactors may be attributed to the complexity of metabolic pathways and wider spectrum of reduced end-products obtained here, vs. only acetate and H2 being produced in most MES studies (Table S2 in Supplementary Material).
The long rods (Figures 1E–H), 50 µm and longer (up to 300–400 µm, Figure 1E; Figures S2F–H in Supplementary Material) that can be observed throughout the biofilm are actually smaller rod-shaped microorganisms interconnected to each other length-wise forming long filaments (Figure 1H; Figure S9G–R in Supplementary Material). These filaments were observed to connect two or more far-apart carbon felt fibers, as well as to connect to other microorganisms. To the best of the authors’ knowledge, such structures were never observed in biocathode biofilms to date. Microscopic observations of chain elongation fermentation reactor microbiomes have rarely been performed. Zhang et al. (2013) showed bacteria that were mainly rod-shaped of about 2-µm long, attached as biofilm on the outer surface of their CO2:H2 fed hollow-fiber membrane (Zhang et al., 2013). Rod-shaped microorganisms between 1 and 4 µm were also observed in other chain elongation fermentation studies (Liu et al., 2017; Zhu et al., 2017). Roghair et al. (2016) also showed a high diversity in morphologies in their granular chain elongation sludge that may be ascribed to the fundamentally different biological processes than granule formation requires, with rods up to 10 µm, and cocci (Roghair et al., 2016).
Our observation raises the question of the functionality of these filamentous microorganism assemblies in our systems. The filamentous morphology resembles that of so-called sulfur oxidizing filamentous “cable bacteria,” which have mostly been found in marine and freshwater sediments, though the latter were observed to have a stripy morphology (Marzocchi et al., 2014; Schauer et al., 2014; Larsen et al., 2015; Risgaard-Petersen et al., 2015). These cable bacteria have been reported to conduct electrons over centimeter-long distances and thereby electrically couple sulfide oxidation and oxygen reduction (Schauer et al., 2014; Larsen et al., 2015; Risgaard-Petersen et al., 2015), as well as nitrate reduction (Marzocchi et al., 2014) in sediments. This raises the question whether the observed filamentous microorganism assemblies in our biofilm conducted intracellular electrons over long distance, which may have allowed the formation of such thick biofilm, i.e., delivering electrons to far-away microorganisms. However, at this stage, it also cannot be excluded that the filamentous microorganism assemblies were simply growing on the decay of the biofilm and its extracellular polymers and provided a structure to develop a thick biofilm. In addition, (bio)electrochemically produced hydrogen may also have diffused through the biofilm, and served as electron shuttle to microorganisms, e.g., for the CO2 reduction to acetate, thus allowing the biofilm to grow thick. The role of H2 as electron mediator in MES systems has been extensively discussed (Blanchet et al., 2015; Jourdin et al., 2016b; LaBelle and May, 2017; Puig et al., 2017) and some biofilms were showed to be very effective at capturing it before it could escape the biofilm (Jourdin et al., 2016b). Some methanogens belonging to genera such as Methanosaeta and Methanospirillum were also showed to form long filaments over hundreds of micrometers in anaerobic granular sludge (Parshina et al., 2014; Li et al., 2015; Zhou et al., 2015). However, methanogenesis activity was inhibited in our reactors by continuously feeding a chemical inhibitor. Therefore, the filamentous microorganism assemblies observed in our reactors are unlikely methanogens.
Furthermore, thin filaments (nm diameter) were also observed everywhere throughout the biofilm (Figure 1H; Figure S9 in Supplementary Material), either between two or more microorganisms (Figures S9A–I in Supplementary Material) or between microorganism and the carbon fiber surface (Figures S9M–P in Supplementary Material). These filaments might be extracellular polymeric-like substance that hold the biofilm together. However, they possibly can also be electron-conductive nanowire filaments for long-range electron transfer, as observed in bioanode biofilms (Lovley, 2011).
Bioelectrochemical Chain Elongation Perspective
To the best of the authors’ knowledge, only one study claimed to have elongated carbon dioxide to n-butyrate and n-caproate, using H2 as electron donor, in a membrane biofilm reactor (Zhang et al., 2013). Production rates of 0.057 and 0.031 g L−1 day−1 of n-butyrate and n-caproate were achieved, respectively. However, subsequent reports in this field have argued the somewhat slower production rates achieved must have been due to the rate-limiting in situ production of ethanol which then acted as electron donor for elongation of acetate (Spirito et al., 2014; Angenent et al., 2016). In our reactors, CO2 was used as sole carbon source, and a solid-state electrode as sole electron source. The acetate, n-butyrate, and n-caproate volumetric production rates (normalized to medium volume) obtained in our study were 51, 56, and 31 times higher than those obtained by Zhang et al. (2013). Remarkably though, ethanol, lactate, methanol, or other organics that could have acted as intermediate electron donor were not detected in our reactors. However, at this stage, it cannot be ruled out that an intermediate could have been produced and consumed immediately within the biofilm, before detection could be possible. Our findings seem to indicate conceptually different mechanisms than recently reported by Batlle-Vilanova et al. (2017). In that study, CO2 was elongated to n-butyrate with an electrode as electron donor, in batch-mode bioelectrochemical reactors. However, it was demonstrated that CO2 reduction to acetate and further elongation to n-butyrate occurred in the bulk catholyte and not in the biofilm. Furthermore, partial pressure of H2 had to build up in the headspace, along with low enough pH (ca. pH 5) and low CO2 availability, to allow acetate reduction to ethanol and further chain elongation of acetate to n-butyrate (Batlle-Vilanova et al., 2017). In our study, we show that CO2 elongation to n-butyrate and n-caproate is possible within the biofilm, in continuous mode, while CO2–N2 is continuously flushed, i.e., no H2 build up in the headspace. Most other microbial electrosynthesis studies reporting n-butyrate production also detected ethanol (Ganigue et al., 2015; Arends et al., 2017; Bajracharya et al., 2017a; Batlle-Vilanova et al., 2017). We kindly refer to Raes et al. (2017) for more in-depth discussions about the potential biological pathways and extracellular electron flows that may be occurring in bioelectrochemical chain elongation systems such as developed here. These potential electron transfer mechanisms are also graphically reproduced in Figure S10 in Supplementary Material. We still can suppose that, in our study, microorganisms responsible for bioelectrochemical chain elongation of produced organics (presumably done by bioelectrochemical chain elongators that elongate C2 to nC4 and nC6 via known or by Raes hypothesized pathways) did concurrently live in synergy with CO2 reducers to acetate (presumably done by bioelectrochemical acetogens). Possible competition for electron donors between both functional microbial groups still needs to be uncovered. H2 may be an electron mediator for the CO2 reduction to acetate in our systems, as previously reported for MES from CO2 to acetate studies (Blanchet et al., 2015; Jourdin et al., 2016b; LaBelle and May, 2017; Puig et al., 2017). However, a kinetic and thermodynamic modeling study predicted that direct acetate conversion to MCFAs by H2 is most likely not feasible even under high H2 partial pressures (González-Cabaleiro et al., 2013). Therefore, other electron transfer mechanisms than H2-mediated electron transfer may also be at play in our systems (Raes et al., 2017).
The reduction of CO2 to n-butyrate and n-caproate requires 20 and 32 electrons, respectively, while only 8 electrons are required to reduce CO2 to acetate. However, we show that all these three products can be formed at the same applied potential. In our reactors, which were not optimized for this purpose, a cell voltage of about 3V was measured at the highest current density. The theoretical minimal electrical power required at the measured cell voltage is 10.9 kWh kgacetate−1, 18.4 kWh kgbutyrate−1, and 22.3 kWh kgcaproate−1 (see calculations in Supplementary materials). The latter represents the electrical power required to produce 1 kg of product if 100% of the electrons were recovered into that product. Therefore, only about 1.7 and 2 times more power is required to produce n-butyrate or n-caproate than acetate, while their market values are higher than of acetate (Kleerebezem et al., 2015). Taking the period from days 227 to 260 of the main reactor where n-caproate production was the highest (Figures 3 and 4), as a representative period (similar rates and recoveries were obtained in the last operating period of the duplicate reactor as well), the actual electrical power needed were calculated at 23.5 kWh kgacetate−1, 64.3 kWh kgbutyrate−1, and 174 kWh kgcaproate−1. These high electrical power requirement for n-butyrate and n-caproate were due to the relatively low electron recoveries into those products. The latter highlights the need for further research into increasing the selectivity of the process toward the most valuable product, which will in turn decrease the power requirement. The overall electrical energy efficiency for our microbial electrosynthesis systems (i.e., electricity and CO2 to organics excluding energy need for pumping and other side equipment) was calculated at 38% (pH 5.8 cathode, pH 2 anode, and 32°C), showing efficient use of the applied power (see calculations in Supplementary material).
The findings presented here open up a new MES production platform and widen its product spectrum and potential implementations. Though the same products are generated as from chain elongation fermentation, MES does not use the same carbon and electron sources and could be complementary to that process.
Materials and Methods
MES Reactor Setup
Two identical bioelectrochemical reactors were set up and used as duplicate. A photo of the reactor and a scheme of the reactor setup is shown in supporting information (Figure S11 in Supplementary Material). Each reactor consisted of two Plexiglas flow through compartments. The anode compartment had a volume of 31 cm3 while the cathode compartment was wider (4.2 vs. 1.4 cm for the anode) and had an empty volume of 94 cm3. Both compartments were separated by a cation exchange membrane of 19.8 cm2 psa (Fumasep FKS, Fumatech BWT GmbH). Two Plexiglas support plates were used to close each compartment. A Pt/IrO2 coated with Ti (Magneto Special Anodes, Schiedam, The Netherlands) was used as anode electrode (19.8 cm2 psa). Carbon felt was used as cathode electrode material (4-mm thick, CTG Carbon GmbH, Germany). Three layers of felt (19.8 cm2 psa, total volume of 25.5 cm3) were stacked together and placed vertically in the center of the cathode compartment at about 1.65 cm of the membrane and 1.65 cm to the Plexiglas support on the other side (Figure S11B in Supplementary Material). A titanium wire (Salomon’s Metalen, The Netherlands) was weaved through the carbon felt stack and used as current collector. The catholyte was forced to flow through the carbon felt, from the bottom of the reactor on the membrane-side of the felt, to the other side where it exited at the top (Figure S11 in Supplementary Material). This forced-flow through design was adapted from the hypothesis that it would promote biofilm coverage and improve performance throughout the carbon felt electrode, as earlier observed for bioanodes (Sleutels et al., 2009).
A pH probe (QMP108X, Q-is, Oosterhout, the Netherlandsg) was placed in the catholyte recirculation circuit and a pH controller (Ontwikkelwerkplaats, Elektronica ATV, the Netherlands) was used to control the pH of the catholyte at pH 5.8 (the applied potential was also confirmed not to influence the pH measurements). A recirculation bottle was also installed in the loop. The total catholyte volume in the whole setup was 360 mL, while the catholyte volume in the cathode chamber was 64 mL. The catholyte medium composition was identical to the one described in Jourdin et al. (2015a,b) and contained 0.2 g L−1 NH4Cl, 0.04 g L−1 MgCl2⋅6H2O, 0.015 g L−1 CaCl2, 6 g L−1 Na2HPO4, 3 g L−1 KH2PO4, 1 mL L−1 of a mixed trace element solution, and 15 mM 2-bromoethanesulfonic acid to suppress methanogenic activity (Jourdin et al., 2015a). The trace element solution contained 1.5 g L−1 FeCl3·6H20, 0.15 g L−1 H3BO3, 0.03 g L−1 CuSO4⋅5H2O, 0.18 g L−1 KI, 0.12 g L−1 MnCl2⋅4H2O, 0.06 g L−1 Na2MoO4⋅2H2O, 0.12 g L−1 ZnSO4⋅7H2O, 0.15 g L−1 CoCl2⋅6H2O, 0.023 g L−1 NiCl2⋅6H2O, and 10 g L−1 EDTA. The anolyte composition was identical, but its pH was decreased to 2 by phosphoric acid addition at time 0, to favor proton crossing over the membrane over other cations, and the trace element solution was omitted. Due to the water oxidation reaction, the anolyte pH remained around 2 for the remaining of the experiments. The anolyte was operated in fed-batch and continuously sparged with CO2 to prevent oxygen accumulation and possible crossover through the membrane. The setup was verified to be air tight before starting experiments. Both catholyte and anolyte were recirculated at 12 L h−1 using a recirculation pump. The reactors were operated in a temperature controlled cabin at 32°C. The experimental setup was covered from light to avoid phototrophic activity. The inoculum was taken from a running laboratory MES reactor which produced acetate from CO2 (Jourdin et al., 2015b). The original source of the mixed microbial consortium was from both natural environments (stormwater pond sediments located on the University of Queensland, Saint Lucia campus, Brisbane, Australia) and engineered anaerobic systems (from the Luggage Point Wastewater Treatment Plant anaerobic digester, Brisbane, Australia) (Jourdin et al., 2015a). About 200 mgCOD L−1 of inoculum was added to each reactor.
MES Reactor Operation
One of the reactors was run for 314 days (results shown in the main text of the manuscript), while the other one was run for 390 days (results shown in the Supplementary materials, and Figure 5). Inoculation of the reactors was done on day 0. Different operational conditions were applied throughout the course of the experiments. From day 0 to 133, fed-batch conditions were applied, with replacement of about 5% of the catholyte every 3–4 days. 65% of the catholyte was also replaced on day 50. Different carbon source feeding strategies were applied during that period, with pure CO2 gas flushed for 60 min every 4 days (days 0–44), sodium bicarbonate addition every 3–4 days (days 44–50, and 97–133), or continuous flushing of CO2:N2 30–70% (days 50–97). If applied, gases were flushed through the recirculation bottle (Figure S11 in Supplementary Material). From day 133 to the end of the experiments, fresh catholyte was added continuously at a flow rate of 90 mL day−1 corresponding to an hydraulic retention time of 4 days, while CO2:N2 30–70% was flushed continuously in the recirculation bottle. The bottle containing the fresh catholyte was stored in a fridge at 4°C and continuously flushed with pure N2 to maintain anaerobic conditions and prevent microbial growth (no carbon source provided). Table S3 in Supplementary Material provides a summary of the operational conditions.
A multichannel potentiostat (n-stat, Ivium, the Netherlands) was connected to the three-electrode electrochemical reactors to control the cathode potential and record the current (electron uptake rate). The cathode was equipped with a 3 M Ag/AgCl reference electrode (QM710X, Q-is, Oosterhout, the Netherlands). Both reactors were controlled at −0.85 V vs. SHE throughout the course of the experiment. All potentials are reported vs. SHE unless stated otherwise. Cyclic voltammetry tests were performed at pH 6.7 by scanning potentials from 0 to −1.2 V vs. SHE at 1 mV s−1, before, 97, 178, and 366 days after inoculation. Only the reductive scans were extracted and reported here (Figure 2; Figure S5 in Supplementary Material). Several “damaging” incidents occurred over the long-term life of these two reactors, e.g., leakage of the recirculation bottle. These events are further discussed in the Section “Results and Discussion” if relevant.
Analytical Methods
The concentrations of volatile and MCFAs (C2–C8) as well as alcohols (methanol to hexanol) in the liquid phase were determined in average every 3–4 days, by gas chromatography (Agilent 7890B, USA), with some occasional longer periods where samples were taken at longer intervals, e.g., 23 days from days 237 to 260 (Figures 3B and 4). An HP-FFAP column was used (25 m × 0.32 mm × 0.50 µm). The detector (FID) and injection temperatures were 240 and 250°C, respectively. The oven temperature was 60°C for 3 min, 21°C min−1 up to 140°C, 8°C min−1 up to 150°C and constant for 1.5 min, 120°C min−1 up to 200°C and constant for 1.25 min, and finally 120°C min−1 up to 240°C and constant for 3 min. Helium was used as carrier gas at a flow of 1.25 mL min−1 for the first 3 min and 2 mL min−1 until the end of the run. 1 µL of sample was injected in the column. The production of organics as well as the electron balance were calculated as described by Raes et al. (2017). The calculations are also explained in the Supplementary materials—Calculations. The productions rates were calculated between two consecutive sampling points, and represented as such in Figure 3B and Figure S6B in Supplementary Material.
To check whether all reduced components were identified, chemical oxygen demand (COD) was measured few times throughout the course of the experiments using the Hach Lange LCK014 cuvette test, according to fabricant’s instructions.
Scanning Electron Microscopy
Carbon felt pieces were cut throughout the whole electrode as schematically represented in Figure S3 in Supplementary Material. Samples for SEM analysis were fixed within 2.5% glutaraldehyde in reactor matrix for 24 h at 4°C, washed with the original medium matrix and dehydrated in a graded series of ethanol. Removal of ethanol from the samples was done by critical point drying. Finally, the samples were sputter coated with tungsten prior to SEM analysis. SEM images were obtained with secondary electron detector. Applied acceleration voltage 2 kV and beam current of 6.3 pA.
Conclusion
MES is progressing to become a robust clean CO2 biorecycling process producing higher value chemicals at increasing rates, while minimizing the cost of electrode materials. We first showed here that continuous mode operation (i.e., continuous nutrient supply) triggered a thick biofilm to form throughout the whole thickness (1.2 cm) of unmodified carbon felt. In turn, this biocatalytically active biofilm was demonstrated to significantly enhance electron uptake rates from the electrode (−110 ± 20 A m−2 or −8.5 ± 1.5 kA m−3) and allowed elongation of CO2 to higher value chemicals than acetate, namely n-butyrate and n-caproate. Bioelectrochemical biofilm-driven chain elongation to caproate was demonstrated for over 100 days continuously. Production rates and concentrations of 9.85 ± 0.65 g L−1 day−1 and 8.2 ± 0.4 g L−1 of acetate, 3.2 ± 0.1 g L−1 day−1 and 2.9 ± 0.3 g L−1 of n-butyrate, and 0.95 ± 0.05 g L−1 day−1 and 1.1 ± 0.03 g L−1 of n-caproate (average of two reactors) were achieved at electron recoveries of 60–100%. Cyclic voltammetry “treatment” was also shown to impact developed biocathodes into converting electrons into organics at twice higher rates after treatment, and sustained these rates over long term. Finally, a high diversity of microbial morphology was observed to colonize the electrode’s carbon fibers and their interspace.
We showed that higher value chemicals can be produced from carbon dioxide, and that unmodified carbon felt, a relatively cheap electrode material (62 € m−2), could be a good approach for high performance and economic viability of the technology. These results represent a step forward to practical implementation of the technology. Further research should focus into improving the selectivity of the process and understanding its mechanisms.
Author Contributions
LJ designed and executed experiments, performed analyses, interpreted data, and drafted the manuscript. DS planned the study, contributed to experimental design and data interpretation, and revised the manuscript. SR contributed to data interpretation and revised the manuscript. CB participated in the planning of the study, data interpretation, and revised the manuscript. All authors read and approved the final manuscript.
Conflict of Interest Statement
The authors declare that the research was conducted in the absence of any commercial or financial relationships that could be construed as a potential conflict of interest.
Acknowledgments
Financial support from the Dutch Technology Foundation NWO-TTW and the company Paques (project nr. STW-Paques 12999) is gratefully acknowledged. The authors thank Rene Rozendal and João Sousa for valuable discussions. The authors would like to thank the Wageningen Electron Microscopy Centre for equipment access. The authors thank Dainis Sudmalis for SEM samples preparation and imaging.
Funding
This work was supported by the Dutch Technology Foundation NWO-TTW and the company Paques (project nr. STW-Paques 12999).
Supplementary Material
The Supplementary Material for this article can be found online at http://www.frontiersin.org/articles/10.3389/fenrg.2018.00007/full#supplementary-material.
References
Agler, M. T., Wrenn, B. A., Zinder, S. H., and Angenent, L. T. (2011). Waste to bioproduct conversion with undefined mixed cultures: the carboxylate platform. Trends Biotechnol. 29, 70–78. doi: 10.1016/j.tibtech.2010.11.006
Angenent, L. T., Richter, H., Buckel, W., Spirito, C. M., Steinbusch, K. J. J., Plugge, C. M., et al. (2016). Chain elongation with reactor microbiomes: open-culture biotechnology to produce biochemicals. Environ. Sci. Technol. 50, 2796–2810. doi:10.1021/acs.est.5b04847
Angenent, L. T., Zheng, D., Sung, S., and Raskin, L. (2002). Microbial community structure and activity in a compartmentalized, anaerobic bioreactor. Water Environ. Res. 74, 450–461. doi:10.2175/106143002X140242
Arends, J. B. A., Patil, S. A., Roume, H., and Rabaey, K. (2017). Continuous long-term electricity-driven bioproduction of carboxylates and isopropanol from CO2 with a mixed microbial community. J. CO2 Util. 20, 141–149. doi:10.1016/j.jcou.2017.04.014
Aryal, N., Halder, A., Tremblay, P.-L., Chi, Q., and Zhang, T. (2016). Enhanced microbial electrosynthesis with three-dimensional graphene functionalized cathodes fabricated via solvothermal synthesis. Electrochim. Acta 217, 117–122. doi:10.1016/j.electacta.2016.09.063
Bajracharya, S., Vanbroekhoven, K., Buisman, C., Strik, D., and Deepak, P. (2017a). Bioelectrochemical conversion of CO2 to chemicals: CO2 as next generation feedstock for the electricity-driven bioproduction in batch and continuous mode. Faraday Discuss. 202, 433–449. doi:10.1039/C1037FD00050B
Bajracharya, S., Yuliasni, R., Vanbroekhoven, K., Buisman, C. J. N., Strik, D. P. B. T. B., and Pant, D. (2017b). Long-term operation of microbial electrosynthesis cell reducing CO2 to multi-carbon chemicals with a mixed culture avoiding methanogenesis. Bioelectrochemistry 113, 26–34. doi:10.1016/j.bioelechem.2016.09.001
Barker, H. (1947). Clostridium kluyveri . Antonie Van Leeuwenhoek 12, 167–176. doi:10.1007/BF02272663
Batlle-Vilanova, P., Ganigué, R., Ramió-Pujol, S., Bañeras, L., Jiménez, G., Hidalgo, M., et al. (2017). Microbial electrosynthesis of butyrate from carbon dioxide: production and extraction. Bioelectrochemistry 117, 57–64. doi:10.1016/j.bioelechem.2017.06.004
Blanchet, E., Duquenne, F., Rafrafi, Y., Etcheverry, L., Erable, B., and Bergel, A. (2015). Importance of the hydrogen route in up-scaling electrosynthesis for microbial CO2 reduction. Energy Environ. Sci. 8, 3731–3744. doi:10.1039/C5EE03088A
Blaut, M. (1994). Metabolism of methanogens. Antonie Van Leeuwenhoek 66, 187–208. doi:10.1007/BF00871639
Chen, C.-C., Lin, C.-Y., and Lin, M.-C. (2002). Acid–base enrichment enhances anaerobic hydrogen production process. Appl. Microbiol. Biotechnol. 58, 224–228. doi:10.1007/s002530100814
Chen, W.-S., Strik, D. P., Buisman, C. J., and Kroeze, C. (2017). Production of caproic acid from mixed organic waste – an environmental life cycle perspective. Environ. Sci. Technol. 51, 7159–7168. doi:10.1021/acs.est.6b06220
Chen, W. S., Ye, Y., Steinbusch, K. J. J., Strik, D. P. B. T. B., and Buisman, C. J. N. (2016). Methanol as an alternative electron donor in chain elongation for butyrate and caproate formation. Biomass Bioenergy 93, 201–208. doi:10.1016/j.biombioe.2016.07.008
Cui, M., Nie, H., Zhang, T., Lovley, D., and Russell, T. P. (2017). Three-dimensional hierarchical metal oxide-carbon electrode material for high efficient microbial electrosynthesis. Sustainable Energy Fuels 1, 1171–1176. doi:10.1039/C7SE00073A
Ganigue, R., Puig, S., Batlle-Vilanova, P., Balaguer, M. D., and Colprim, J. (2015). Microbial electrosynthesis of butyrate from carbon dioxide. Chem. Commun. 51, 3235–3238. doi:10.1039/C4CC10121A
González-Cabaleiro, R., Lema, J. M., Rodríguez, J., and Kleerebezem, R. (2013). Linking thermodynamics and kinetics to assess pathway reversibility in anaerobic bioprocesses. Energy Environ. Sci. 6, 3780–3789. doi:10.1039/c3ee42754d
Graves, T., Narendranath, N. V., Dawson, K., and Power, R. (2006). Effect of pH and lactic or acetic acid on ethanol productivity by Saccharomyces cerevisiae in corn mash. J. Ind. Microbiol. Biotechnol. 33, 469. doi:10.1007/s10295-006-0091-6
Grootscholten, T. I. M., Steinbusch, K. J. J., Hamelers, H. V. M., and Buisman, C. J. N. (2013a). Chain elongation of acetate and ethanol in an upflow anaerobic filter for high rate MCFA production. Bioresour. Technol. 135, 440–445. doi:10.1016/j.biortech.2012.10.165
Grootscholten, T. I. M., Steinbusch, K. J. J., Hamelers, H. V. M., and Buisman, C. J. N. (2013b). Improving medium chain fatty acid productivity using chain elongation by reducing the hydraulic retention time in an upflow anaerobic filter. Bioresour. Technol. 136, 735–738. doi:10.1016/j.biortech.2013.02.114
Im, C. H., Song, Y. E., Jeon, B.-H., and Kim, J. R. (2016). Biologically activated graphite fiber electrode for autotrophic acetate production from CO2 in a bioelectrochemical system. Carbon Lett. 20, 76–80. doi:10.5714/CL.2016.20.076
Jourdin, L., Freguia, S., Donose, B. C., Chen, J., Wallace, G. G., Keller, J., et al. (2014). A novel carbon nanotube modified scaffold as an efficient biocathode material for improved microbial electrosynthesis. J. Mater. Chem. A 2, 13093–13102. doi:10.1039/C4TA03101F
Jourdin, L., Freguia, S., Donose, B. C., and Keller, J. (2015a). Autotrophic hydrogen-producing biofilm growth sustained by a cathode as the sole electron and energy source. Bioelectrochemistry 102, 56–63. doi:10.1016/j.bioelechem.2014.12.001
Jourdin, L., Grieger, T., Monetti, J., Flexer, V., Freguia, S., Lu, Y., et al. (2015b). High acetic acid production rate obtained by microbial electrosynthesis from carbon dioxide. Environ. Sci. Technol. 49, 13566–13574. doi:10.1021/acs.est.5b03821
Jourdin, L., Freguia, S., Flexer, V., and Keller, J. (2016a). Bringing high-rate, CO2-based microbial electrosynthesis closer to practical implementation through improved design and operating conditions. Environ. Sci. Technol. 50, 1982–1989. doi:10.1021/acs.est.5b04431
Jourdin, L., Lu, Y., Flexer, V., Keller, J., and Freguia, S. (2016b). Biologically-induced hydrogen production drives high rate/high efficiency microbial electrosynthesis of acetate from carbon dioxide. ChemElectroChem 3, 581–591. doi:10.1002/celc.201500530
Jourdin, L., and Strik, D. P. B. T. B. (2017). “Electrodes for cathodic microbial electrosynthesis processes: key-developments and criteria for effective research & implementation,” in Functional Electrodes for Enzymatic and Microbial Bioelectrochemical Systems, eds V. Flexer and N. Brun (Wageningen: World Scientific), 429–473.
Kleerebezem, R., Joosse, B., Rozendal, R., and Van Loosdrecht, M. C. M. (2015). Anaerobic digestion without biogas? Rev. Environ. Sci. Biotechnol. 14, 787–801. doi:10.1007/s11157-015-9374-6
Koutinas, A. A., Yepez, B., Kopsahelis, N., Freire, D. M. G., De Castro, A. M., Papanikolaou, S., et al. (2016). Techno-economic evaluation of a complete bioprocess for 2,3-butanediol production from renewable resources. Bioresour. Technol. 204, 55–64. doi:10.1016/j.biortech.2015.12.005
Kucek, L. A., Nguyen, M., and Angenent, L. T. (2016a). Conversion of l-lactate into n-caproate by a continuously fed reactor microbiome. Water Res. 93, 163–171. doi:10.1016/j.watres.2016.02.018
Kucek, L. A., Spirito, C. M., and Angenent, L. T. (2016b). High n-caprylate productivities and specificities from dilute ethanol and acetate: chain elongation with microbiomes to upgrade products from syngas fermentation. Energy Environ. Sci. 9, 3482–3494. doi:10.1039/C6EE01487A
LaBelle, E. V., and May, H. D. (2017). Energy efficiency and productivity enhancement of microbial electrosynthesis of acetate. Front. Microbiol. 8:756. doi:10.3389/fmicb.2017.00756
Larsen, S., Nielsen, L. P., and Schramm, A. (2015). Cable bacteria associated with long-distance electron transport in New England salt marsh sediment. Environ. Microbiol. Rep. 7, 175–179. doi:10.1111/1758-2229.12216
Li, L., Zheng, M., Ma, H., Gong, S., Ai, G., Liu, X., et al. (2015). Significant performance enhancement of a UASB reactor by using acyl homoserine lactones to facilitate the long filaments of Methanosaeta harundinacea 6Ac. Appl. Microbiol. Biotechnol. 99, 6471–6480. doi:10.1007/s00253-015-6478-4
Liu, Y., He, P., Shao, L., Zhang, H., and Lü, F. (2017). Significant enhancement by biochar of caproate production via chain elongation. Water Res. 119, 150–159. doi:10.1016/j.watres.2017.04.050
Lovley, D. R. (2011). Live wires: direct extracellular electron exchange for bioenergy and the bioremediation of energy-related contamination. Energy Environ. Sci. 4, 4896–4906. doi:10.1039/c1ee02229f
Marshall, C., Ross, D., Handley, K., Weisenhorn, P., Edirisinghe, J., Henry, C., et al. (2017). Metabolic Reconstruction and Modeling Microbial Electrosynthesis. BioRxiv 059410. 7. doi:10.1038/s41598-017-08877-z
Martin, M. R., Fornero, J. J., Stark, R., Mets, L., and Angenent, L. T. (2013). A single-culture bioprocess of Methanothermobacter thermautotrophicus to upgrade digester biogas by CO2-to-CH4 conversion with H2. Archaea 2013, 157529. doi:10.1155/2013/157529
Marzocchi, U., Trojan, D., Larsen, S., Meyer, R. L., Revsbech, N. P., Schramm, A., et al. (2014). Electric coupling between distant nitrate reduction and sulfide oxidation in marine sediment. ISME J. 8, 1682–1690. doi:10.1038/ismej.2014.19
Mekonnen, M. M., and Hoekstra, A. Y. (2016). Four billion people facing severe water scarcity. Sci. Adv. 2, e1500323. doi:10.1126/sciadv.1500323
Parshina, S. N., Ermakova, A. V., Bomberg, M., and Detkova, E. N. (2014). Methanospirillum stamsii sp. nov., a psychrotolerant, hydrogenotrophic, methanogenic archaeon isolated from an anaerobic expanded granular sludge bed bioreactor operated at low temperature. Int. J. Syst. Evol. Microbiol. 64, 180–186. doi:10.1099/ijs.0.056218-0
Patil, S. A., Arends, J. B. A., Vanwonterghem, I., Van Meerbergen, J., Guo, K., Tyson, G. W., et al. (2015a). Selective enrichment establishes a stable performing community for microbial electrosynthesis of acetate from CO2. Environ. Sci. Technol. 49, 8833–8843. doi:10.1021/es506149d
Patil, S. A., Gildemyn, S., Pant, D., Zengler, K., Logan, B. E., and Rabaey, K. (2015b). A logical data representation framework for electricity-driven bioproduction processes. Biotechnol. Adv. 33, 736–744. doi:10.1016/j.biotechadv.2015.03.002
Puig, S., Ganigué, R., Batlle-Vilanova, P., Balaguer, M. D., Bañeras, L., and Colprim, J. (2017). Tracking bio-hydrogen-mediated production of commodity chemicals from carbon dioxide and renewable electricity. Bioresour. Technol. 228, 201–209. doi:10.1016/j.biortech.2016.12.035
Rabaey, K., and Rozendal, R. A. (2010). Microbial electrosynthesis – revisiting the electrical route for microbial production. Nat. Rev. Microbiol. 8, 706–716. doi:10.1038/nrmicro2422
Raes, S. M. T., Jourdin, L., Buisman, C. J. N., and Strik, D. P. B. T. B. (2017). Continuous long-term bioelectrochemical chain elongation to butyrate. ChemElectroChem 4, 386–395. doi:10.1002/celc.201600587
Richter, H., Martin, M., and Angenent, L. (2013). A two-stage continuous fermentation system for conversion of syngas into ethanol. Energies 6, 3987–4000. doi:10.3390/en6083987
Risgaard-Petersen, N., Kristiansen, M., Frederiksen, R. B., Dittmer, A. L., Bjerg, J. T., Trojan, D., et al. (2015). Cable bacteria in freshwater sediments. Appl. Environ. Microbiol. 81, 6003–6011. doi:10.1128/AEM.01064-15
Roghair, M., Strik, D. P. B. T. B., Steinbusch, K. J. J., Weusthuis, R. A., Bruins, M. E., and Buisman, C. J. N. (2016). Granular sludge formation and characterization in a chain elongation process. Process Biochem. 51, 1594–1598. doi:10.1016/j.procbio.2016.06.012
Schauer, R., Risgaard-Petersen, N., Kjeldsen, K. U., Bjerg, J. J. T., Jørgensen, B. B., Schramm, A., et al. (2014). Succession of cable bacteria and electric currents in marine sediment. ISME J. 8, 1314–1322. doi:10.1038/ismej.2013.239
Sharma, M., Aryal, N., Sarma, P. M., Vanbroekhoven, K., Lal, B., Benetton, X. D., et al. (2013). Bioelectrocatalyzed reduction of acetic and butyric acids via direct electron transfer using a mixed culture of sulfate-reducers drives electrosynthesis of alcohols and acetone. Chem. Commun. 49, 6495–6497. doi:10.1039/c3cc42570c
Sharon, D. A. M., and Kamp, H. G. J. (2016). A Circular Economy in the Netherlands by 2050. The Hague: Government of the Netherlands.
Sleutels, T. H. J. A., Lodder, R., Hamelers, H. V. M., and Buisman, C. J. N. (2009). Improved performance of porous bio-anodes in microbial electrolysis cells by enhancing mass and charge transport. Int. J. Hydrogen Energy 34, 9655–9661. doi:10.1016/j.ijhydene.2009.09.089
Spirito, C. M., Richter, H., Rabaey, K., Stams, A. J. M., and Angenent, L. T. (2014). Chain elongation in anaerobic reactor microbiomes to recover resources from waste. Curr. Opin. Biotechnol. 27, 115–122. doi:10.1016/j.copbio.2014.01.003
Steinbusch, K. J., Hamelers, H. V., Plugge, C. M., and Buisman, C. J. (2011). Biological formation of caproate and caprylate from acetate: fuel and chemical production from low grade biomass. Energy Environ. Sci. 4, 216–224. doi:10.1039/C0EE00282H
Van Eerten-Jansen, M. C., Ter Heijne, A., Grootscholten, T. I., Steinbusch, K. J., Sleutels, T. H., Hamelers, H. V., et al. (2013). Bioelectrochemical production of caproate and caprylate from acetate by mixed cultures. ACS Sustainable Chem. Eng. 1, 513–518. doi:10.1021/sc300168z
Zhang, F., Ding, J., Zhang, Y., Chen, M., Ding, Z.-W., Van Loosdrecht, M. C. M., et al. (2013). Fatty acids production from hydrogen and carbon dioxide by mixed culture in the membrane biofilm reactor. Water Res. 47, 6122–6129. doi:10.1016/j.watres.2013.07.033
Zhou, L., Yu, H., Ai, G., Zhang, B., Hu, S., and Dong, X. (2015). Transcriptomic and physiological insights into the robustness of long filamentous cells of Methanosaeta harundinacea, prevalent in upflow anaerobic sludge blanket granules. Appl. Environ. Microbiol. 81, 831–839. doi:10.1128/AEM.03092-14
Keywords: bioelectrochemical chain elongation, microbial electrosynthesis, carbon dioxide utilization, biofilm, caproate, biocatalysis
Citation: Jourdin L, Raes SMT, Buisman CJN and Strik DPBTB (2018) Critical Biofilm Growth throughout Unmodified Carbon Felts Allows Continuous Bioelectrochemical Chain Elongation from CO2 up to Caproate at High Current Density. Front. Energy Res. 6:7. doi: 10.3389/fenrg.2018.00007
Received: 15 December 2017; Accepted: 14 February 2018;
Published: 01 March 2018
Edited by:
Sebastià Puig, University of Girona, SpainReviewed by:
Pascal E. Saikaly, King Abdullah University of Science and Technology, Saudi ArabiaMohanakrishna Gunda, Flemish Institute for Technological Research (VITO), Belgium
Copyright: © 2018 Jourdin, Raes, Buisman and Strik. This is an open-access article distributed under the terms of the Creative Commons Attribution License (CC BY). The use, distribution or reproduction in other forums is permitted, provided the original author(s) and the copyright owner are credited and that the original publication in this journal is cited, in accordance with accepted academic practice. No use, distribution or reproduction is permitted which does not comply with these terms.
*Correspondence: Ludovic Jourdin, bHVkb3ZpYy5qb3VyZGluQHd1ci5ubA==;
David P. B. T. B. Strik, ZGF2aWQuc3RyaWtAd3VyLm5s