 Samuel Bimenyimana
 Godwin N. O. Asemota
 Lingling Li1
- 1State Key Laboratory of Reliability and Intelligence of Electrical Equipment, Department of Electrical Engineering, Hebei University of Technology, Tianjin, China
- 2African Centre of Excellence in Energy for Sustainable Development, University of Rwanda, Kigali, Rwanda
The Government of Rwanda through its power sector has very ambitious targets to achieve 512 MW installed power generation capacity, from its current 216 MW power generation and have universal access (100%) by 2023/24. It is also determined to achieve 52% on-grid connections and 48% off-grid connections by 2023/24. Literature review, analyses, and site visits to various branch offices of the Rwanda Energy Group (REG) were used to evaluate and determine the success of the power sector in achieving its goals, targets and aspirations. Also, hydropower has a high generation percentage (46.8%), because it has longer plant life, higher capacity factor and availability, numerous rivers coupled with Rwanda embarking upon upgrade and vigorous expansion programmes. Furthermore, the potential to generate electricity economically with local resources including, hydropower, peat, lake gas methane and geothermal energy has however, been estimated to total around 1,613 MW. The country is therefore, utilizing < 10% of its local electricity potential, excluding a substantial solar resource, while incurring a large foreign outflow. The Rwanda's electricity tariff was estimated to be about 22.2% more expensive, compared to the highest electricity tariff of other East African Community (EAC) countries. The reports of Electricity Access Roll-out Programme (EARP) also show that the number of new customer connections increased from 364,000 households in June 2012 to more than 700,000 households (31% of the total households in Rwanda) in 2017.
Introduction
Rwanda, is a small country in East Africa with 12,089,721 (NISR, 2018) people on a total area of 26,338 km2, with 94.7% of it, land and the rest 5.3% is occupied by water (World Bank, 2012). Its geography is within latitudes 1.050 and 2.840°S, and longitudes 28.860 and 30.900°E (World Atlas, 2017), and has two rainy seasons in a year, which naturally feed the numerous rivers systems in the country. It is sandwiched by Uganda, Burundi, Tanzania, and Democratic Republic of Congo (World Bank, 2012; World Atlas, 2017). Rwanda has achieved rapid economic growth in recent decades and is endowed with considerable energy resources which have yet to be fully exploited (REG; RDB, 2018). Although Rwanda has considerable natural energy resources such as hydro, solar, peat, gas, and biomass, it currently has only about 216 MW of installed electricity capacity to serve the whole nation (RDB, 2018). Despite commendable economic growth, it has a low per capita Gross Domestic Product (GDP) of US$ 696 and a low per capita electricity consumption (30 kWh) compared to Uganda (66 kWh), Kenya (140 kWh), and Tanzania (85 kWh) as shown in Table 1, Figure 1 (Hakizimana et al., 2016; Munyaneza et al., 2016). Furthermore, using the highest regional electricity tariff of between US$0.12 and US$0.18/kWh (Hakizimana et al., 2016), to compare with the local Rwandan electricity tariff of US$0.22/kWh (REG, 2018c), we find that Rwanda's electricity price is about 22.2% more expensive than the highest electricity tariff in the EAC.
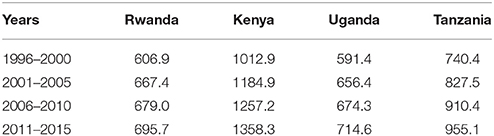
Table 1. Per capita GDP US$ in (4) Eastern African countries (Munyaneza et al., 2016).
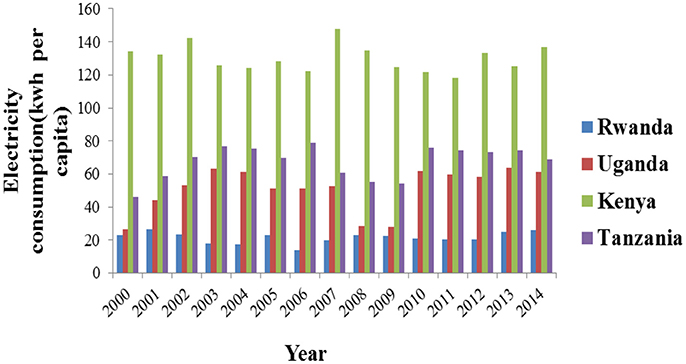
Figure 1. Per capita electricity consumption in four (4) East African countries (Munyaneza et al., 2016).
The Rwanda government objective, targets a reliable, efficient and affordable power supply to improve living standards of all its population as shown in Figure 2 (Rwanda Population Projection per year) (AFDB, 2013a; USAID, 2016). The electric power production capacity and electricity access are low and the size of infrastructure is insufficient to meet the demand. Ageing infrastructure, inefficiencies, exacerbated by high technical and power losses (REG, 2017g), require urgent and timely intervention to achieve the avowed energy targets (World Bank, 2017). Based on available information from REG Report, currently, 42% of the population has access to electricity: 31% grid-connected and 11% off-grid (EDCL, 2018a). The electricity per capita annual consumption for half of its consumers is below 20 kWh per month (SE4All, 2014). In order to fulfill its mission and vision, the Rwanda Energy Group (REG) decided to: “increase generation, improve transmission, diversify energy sources, reduce costs, and produce elaborate conducive legal and regulatory frameworks” (REG).
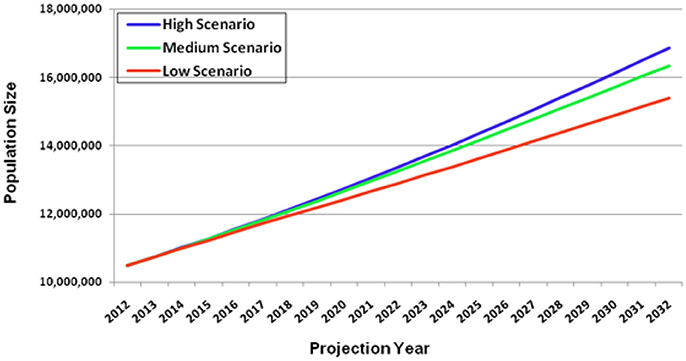
Figure 2. Projected Rwandan Population (Millions), 2012–2032 (NISR, 2014).
The objective of this paper is to carry out a critical review of Rwanda's progress in developing its electricity sector and extending access to its citizens. The research questions include: (a) How far is Rwanda progressing in developing its electricity sector? (b) To what extent has electricity access been extended to its citizens?
This paper is organized into: Introduction, Methodology, Energy sector policy, and strategic plan, Energy resources in Rwanda, Electrical power status, Discussion, and Conclusion.
Methodology
This paper used literature review, analyses and site visits to Rwanda National Electricity Control Centre and other installations of REG, to obtain data and information for the study. These enabled us to evaluate the state of the power sector in Rwanda through its targets such as the 512 MW installed power generation capacity by 2023/24, its electrification strategies, and its available energy resources and the challenges to exploiting them. It is also expected to provide universal access (100%) by 2023/24, and achieve 52% on-grid connections and 48% off-grid connections (EDCL, 2018a).
Some of the data gathered from REG installations nationwide include: (a) Power generation capacity (MW) by plant type, which enabled us to determine power generation by technology, (b) Details of transmission lines in kilometers, which enabled us to determine the High Voltages (110 and 220 kV) in the network and the capacity to handle the planned future power generation, (c) Record of grid connected users from 2006 up to June 2016 (d) Cost of electricity, (e) Fuel and Peat Analysis Report, which enabled us to determine energy equivalent of peat bogs resources in Rwanda and carry out corrosion analyses.
Energy Sector Policy and Strategic Plan
This section comprises a succinct study of the energy policies, strategic, and rural electrification plans of Rwanda energy sector (Bensch et al., 2011; MININFRA, 2015a,b,c).
Energy Policy
The Rwanda energy sector has mission objectives for energy policy summarized as follow (MININFRA, 2015a): “(a) To make sure sufficient, reliable and affordable energy supplies are available to all the population in Rwanda, (b) To set up and promote an enabling environment for increased private sector participation in energy supply and service provision, (c) Encouraging and incentivizing more rational, efficient use of energy in public institutions, and amongst industrial and household end-users, (d) Ensuring the sustainability of energy exploration, extraction, supply, and consumption so as to prevent damage to the environment and habitats, (e) Promoting safe, efficient, and competitive production, procurement, transportation, and distribution of energy, and (f) Developing the requisite institutional, organizational, and human capacity to increase accountability, transparency, national ownership and decentralized implementation capacity for sustainable energy service delivery.”
Strategic Plan
The targets of energy strategic plan can be summarized as follow (MININFRA, 2015b):
“(a) Raise the electricity capacity up to 563 MW by 2018 (Capacity reviewed downwards to 512 MW by 2023/24), (b) 48% on grid and 22% off grid access to electricity allowing 70% of the population to gain access to electricity by 2018, (c) Reduction of losses in the national electrical grid and sustain energy efficiency measure of 10% by the help of demand management, (d) Reduce the carbon intensity of the grid by 10% by 2018 and 25% by 2025, (e) To be sure 80% of all households use clean, efficient, sustainable, modern, and affordable cooking energy technologies.”
Rural Electrification Strategy
This strategy is shown in four distinct programmes (MININFRA, 2015c):
1. “Government will set up facilities allowing low-income households to gain access to modern, clean, and sustainable energy services using basic solar power systems.
2. Government will create policy which facilitate private sector and users so that solar power products will be made more financially affordable.
3. Private sector will be allowed to develop and create mini-grids and the government will provide the help of sites identification and proper framework
4. Government will keep extending the electricity network through Energy roll out programs.”
Although the Rwanda energy sector still faces challenges such as lack of sufficient investments (REG, 2000; Brew-Hammond, 2010; Munyaneza et al., 2016) and high cost of electricity, the government has set out motivations for investors interested in this sector as follow (EUCL, 2018; REG, 2018a): “(a) Provision of transmission access to all power projects on government's cost, (b) Authorized road access, water service and all infrastructure needed during energy projects development, (c) Free tax on power equipment during energy projects development, and (d) Provision of land on power projects by the government or compensation to private developers on the cost of land.”
Energy Resources in Rwanda
The energy resources in Rwanda include biomass and fossil fuels. Biomass resources in Rwanda include biogas, peat, wood, methane gas, and other organic wastes, which constitutes about 85% of national energy consumption and contributes about 5% to the GDP (Vander Plas, 2009; REMA, 2011, 2013). Wood is still the main and most affordable energy source for domestic activities such as cooking and heating in Rwanda (Munyaneza et al., 2016). Also, Kigali is home to about 8% of the population but accounts for over 20% of annual wood fuel consumption (Munyaneza et al., 2016). Apart from wood, liquefied petroleum gas (LPG) usage for cooking in cities is increasing but its usage rate is low (Gasore and Babijja1; RURA, 2012; Esiara, 2015a). Biogas technology and the national biogas development programmes have been organized since 2007 by the government to help decrease wood dependence from over 90 to 50% by 2020 (Landi et al., 2013). Bio-digester sizes for households is between 4 and 10 m3 (Rakotojaona, 2013; IOB Evaluation, 2014). They are mostly used in schools and prisons to drastically reduce wood resources spent for cooking and minimize air pollution (Sinaruguliye and Hategekimana, 2013). There are about 155 million tons dry peat reserves, which can be used to generate electricity. About 77% of this resource is near Akanyaru and Nyabarongo Rivers (Epd Rwanda, 2013a; MININFRA, 2015b). This dry peat reserves is estimated to be about 2.1 × 10¹⁸ J energy equivalent, using the Gishoma peat bogs “Applied low calorific value of 13,360 kJ/kg” (FAO2; MININFRA, 2014). The Gishoma peat to power plant, that had been under construction since February 2015, became operational in April, 2017 and ready to add 15 MW to the national electrical grid (ESI-Africa, 2014; CR, 2017), while the Gisagara peat to power plant is expected to generate 80 MW by 2019 (CR, 2017). Furthermore, a US$260 million injection into the current 80 MW Gisagara peat to power plant project should add 40 MW, bringing its total capacity to 120 MW. The peat to power project has considerable popular support because of the high price of electricity (ESI-Africa, 2014). There is a considerable extractable methane gas in Kivu Lake and KivuWatt project has been set up since 2011 for the purpose of producing 700 MW of electricity from methane over 55 years (PIDG3; Remington, 2013). Rwanda, however, has currently not discovered petroleum oil resources (Zeller, 2011; Munyaneza et al., 2016). The daily national petroleum products consumption is about 6,000 bbl (US liquid barrel) and most of the oil fuels used is imported from Kenya and Tanzania (Munyaneza et al., 2016). The most commonly available renewable energy resources in Rwanda are solar, geothermal and hydro. Furthermore, the largest proportion of power generated in Rwanda is from hydro, which derives from its very numerous rivers and waterfalls (Hategeka and Karenzi, 1997; Karekezi and Majoro, 2002; Martinot et al., 2002; Brew-Hammond, 2010; Safari, 2010; Barry et al., 2011; AFDB, 2013b).
Electrical Power Status
Generation Sector
The Table 2 below shows each installed power generation capacity by technology employed in Rwanda between 2010 and 2017 (inclusive).
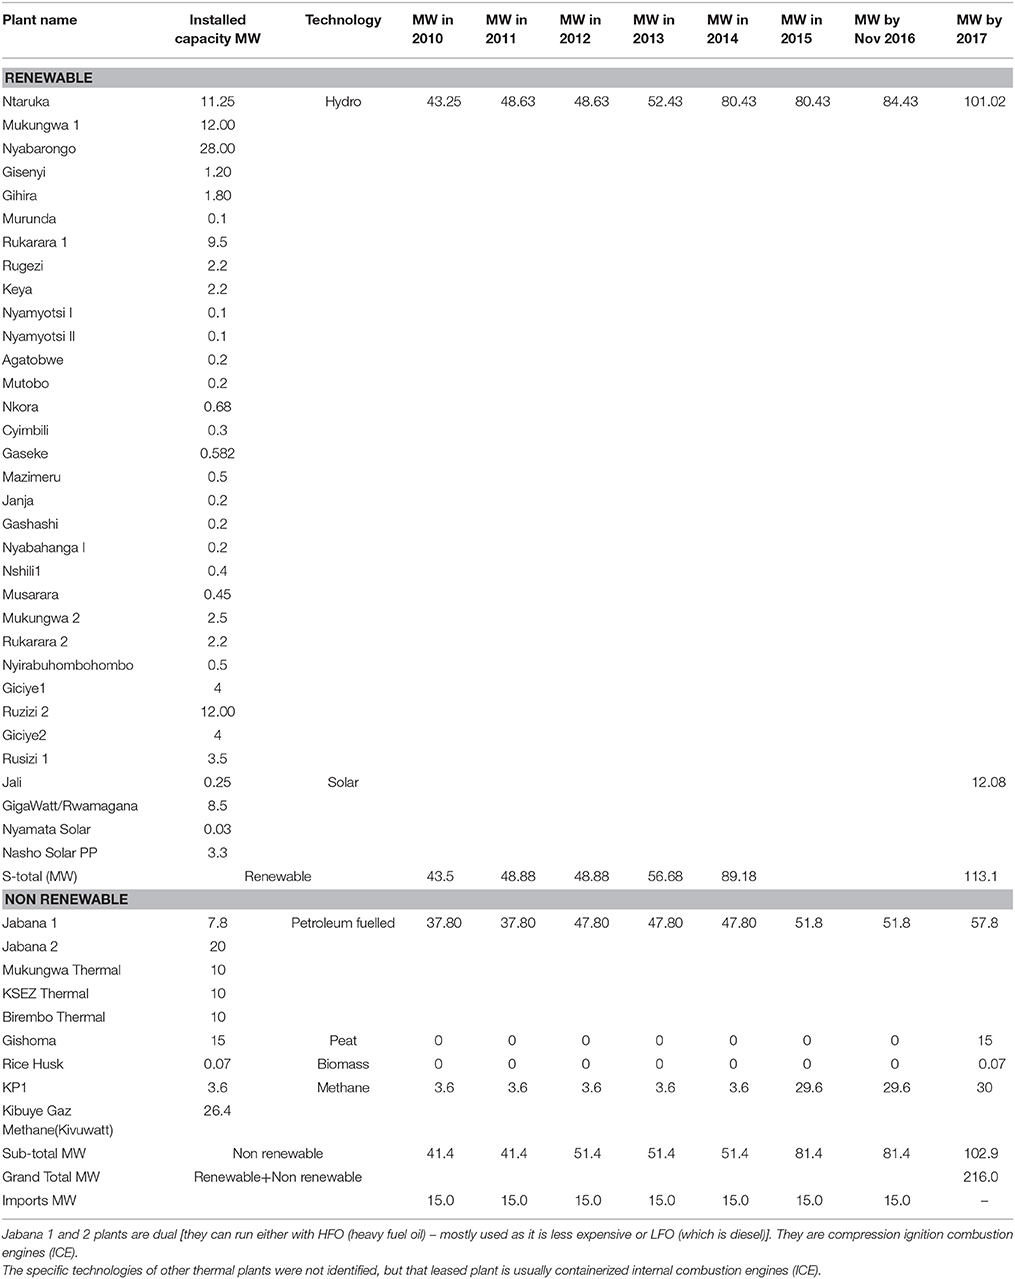
Table 2. Power generation capacity (MW) by plant type for Rwanda in 2010–2017 (REG, 2017a, 2018b).
Reports from generation Unit in REG show hydropower generation (46.8%) is still dominant because of its numerous sources scattered all around the country. Its longer plant life, higher capacity factor and availability, coupled with upgrade and vigorous expansion programmes in hydropower, have been responsible for this amount of contribution to electricity generation in Rwanda (REG, 2017a). The government is increasing core maintenance for the existing hydropower plants because some of them have been constructed a long time ago and work is progressing on the feasibility studies of many mini hydropower plants (REG, 2017a). Besides hydropower sector, careful maintenance programmes are considered for many power plants related to diesel and methane (REG, 2017a). In addition, the government is greatly emphasizing the exploitation and development of other forms of electricity sources such as solar.
Table 3, which is shown below contains both the installed and potential electricity supply resources for Rwanda in 2017.
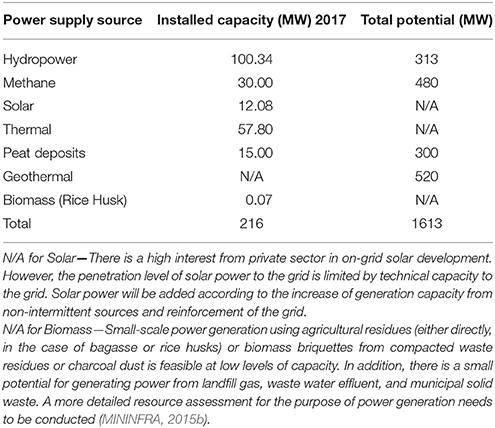
Table 3. Electricity supply resources.
The 216 MW installed electricity generation capacity is about 13.4% of the total potential generation capacity of 1,613 MW in 2017.
Transmission Sector
Rwanda's transmission network is of 3 main voltage levels; 70, 110, and 220 kV transmission infrastructure and the high voltage lines layout are shown in Figure 3. By the end of March 2017 (See Table 4), about 744.7 km of High Voltage (HV) transmission lines had been laid, evacuating power from various points of generation across the country, as well as facilitating regional interconnectivity. Of the total network laid so far, 480.4 km (64.5%) are 110 kV and 264.3 km (35.5%) are 220 kV transmission lines. The remaining 70 kV lines previously running through Birembo-Musha to Kabarondo substation that existed until 2013 were upgraded to 110 kV to improve network reliability and power supply stability amidst the country's changing power demand profile.
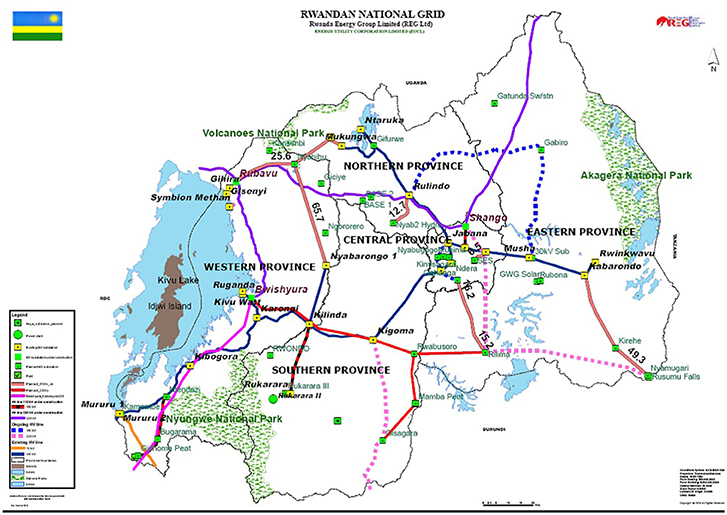
Figure 3. High voltage (110 and 220 kV) network layout (Source: Gathered at REG during the visit).
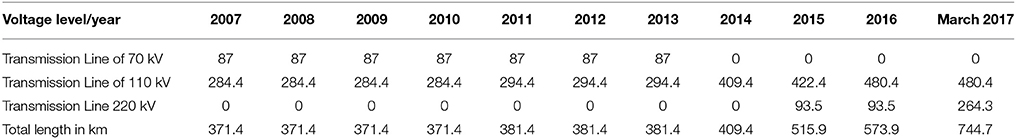
Table 4. Details of transmission lines in Km (REG, 2017b).
It is expected that US$7 billion would be required to finance the Rwanda power sector investment plans from 2013 to 2025 in generation, transmission, and distribution. As a result of the constraints on the domestic budget, external financing would be required (STIC, 2016). Specifically, an estimated US$400 million would be required for transmission infrastructure between 2013 and 2025. This level of investments in the transmission system are planned to make adjustments and allowances for the increases in generation capacity as well as increases in regional power trade (STIC, 2016). Furthermore, both transmission and distribution overnight costs have been estimated at the same value of US$1120/kW each (Hakizimana et al., 2016). By extension the amount to be earmarked for distribution infrastructure upgrade and strengthening would not be < US$400 million, between 2013 and 2025.
Distribution Sector
The Distribution network is composed of 15 sub-stations (high and medium voltage) that include: Ntaruka, Mukungwa, Gifurwe, Rulindo (in the North); Jabana, Gikondo, Gasogi, Mont Kigali (in Kigali); Musha, Kabarondo, Rwinkwavu (in the East); and Kigoma, Kilinda, Karongi, Kibogora, Mururu1, Mururu 2 (in the South) (REG, 2017d).
Reports show remarkable strides that have been made by the Electricity Access Roll-out Programme (EARP), under which access to the grid has increased from 364,000 households in June 2012 to more than 700,000 households in 2017 (EDCL, 2018b,c), See also Figure 4. The solar Rwanda Programme which was scheduled for a period of 4 years (2012–2015) was expecting a goal of installing 12,000 Solar Water Heaters (SWH) by the end of 2015 with a total yearly saving of 23.328 MWh after installing these SWHs. But, only 2,464 SWHs had been installed in different households across the country by the end of 2017 and the programme is still under intense implementation (EDCL, 2018c; Solar Rwanda Program4.
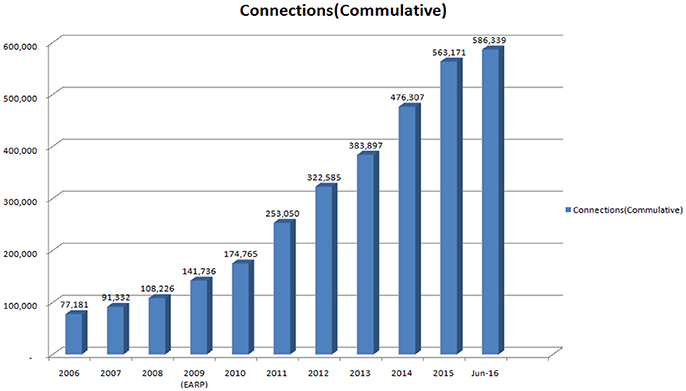
Figure 4. Record of grid connected users from 2006 up to June 2016 (cumulative) (REG, 2017f).
Electricity Tariff
The cost of electricity depends on the usage level and it is from 1/1/2017 as shown in Table 5:
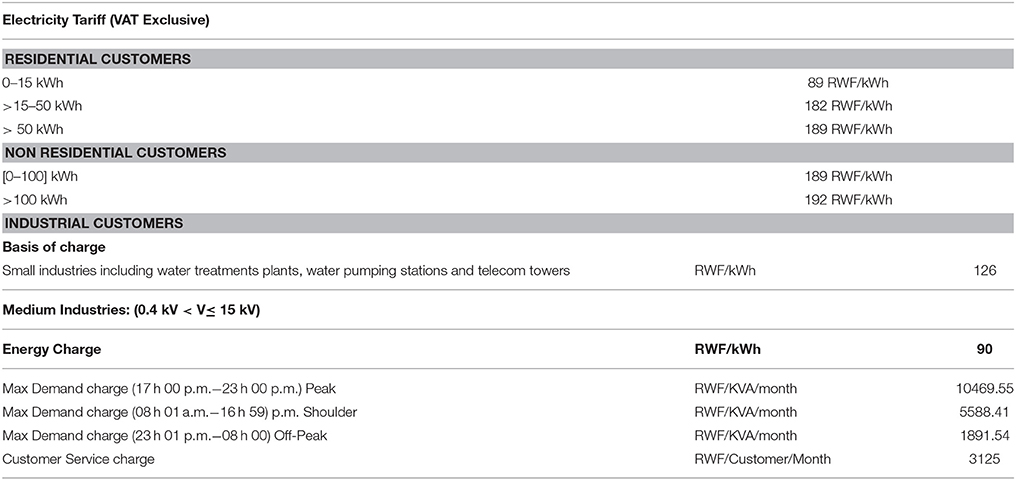
Table 5. Electricity Tariff in Rwanda since January 2017 (VAT exclusive) (REG, 2018c).
Currently, many projects are in the process for the purpose of increasing electricity generation capacity in Rwanda as well as importation of electricity from foreign countries. There are: Gishoma peat power plant, Lake Kivu Symbion power plant, Hakan peat to power plant, Rusumo falls Hydropower plant. The Nyabarongo 2 Hydropower plant, Rusizi 3 Hydropower plant and KivuWatt power plants are under development. Besides these generation projects, many transmission lines and sub-stations are under construction such as 180 km 220 kV Rwanda–Democratic Republic of Congo (DRC) interconnector, 119 km 110 kV Rulindo–Gicumbi–Gabiro–Musha transmission line, 27 km 110 kV Kigali Ring transmission. Others under procurement process are: 64 km 220 kV Rwanda–Burundi interconnector, 53 km 220 kV Mamba-Rwabusoro-Bugesera transmission line, 74 km 220 kV Kibuye-Kilinda–Kigoma–Rwabusoro transmission line and 29 km 110 kV Gahanga–Rilima transmission line (REG, 2017b, 2018a,b; RDB, 2018).
However, in the Policy Section above, Energy Efficiency Awareness Programmes are in Place. In addition to supply side interventions, the Rwandan government has rolled out extensive Energy Efficiency Awareness programmes (REG, 2017e).
Discussion, Assessment of Policy Guidelines, and Implications
This section presents the discussion, assessment of policy guidelines and implications to the study.
General Energy Sector Demand and Supply Scenarios
Rwanda's net electricity production in 2015 was 500 GWh, comprising fossil fuels, hydro, solar, and the electricity consumed was 419 GWh. This implies a loss of 16.2%. Furthermore, out of the estimated 313 MW hydropower potential, about 226 MW is realizable (72.1%). This aggregate is a combination of micro, mini, small, medium and larger hydropower plants already exploited in the country, which include resources shared with neighboring countries of Burundi, Democratic Republic of the Congo (DRC) and Tanzania (UNEP, 2016).
The 55 billion cubic meter methane resource in Lake Kivu could viably support 700 MW of power production capacity which is to be shared equally between Rwanda and the DRC. There are plans to produce 310 MW of geothermal energy by 2017, financial, technical and other constraints have not made this possible. The major geothermal electricity generation fields, are Karisimbi (estimated-320 MW, potential−160 MW), Gisenyi (150 MW), Kinigi (120 MW), Bugarama (60 MW), and other regions (40 MW). These geothermal resources identified in the 1980s by Bureau de Recherches Géologiques et Minières (BRGM) have resources temperatures higher than 150°C. The 700 MW potential power production capacity from Methane gas resource in Lake Kivu has about 55 billion cubic meters, which is to be shared equally at 350 MW apiece between Rwanda and DRC. The average solar insolation for Rwanda is about 5.5 kWh/m2/day but so far only the 250 kW Mount Kigali solar PV plant has been connected to the grid. Between 40,000 and 55,000 ha peat bogs have been mapped to produce about 300 MW of power and the major peat bogs sites include: Akanyaru, Bahimba, Bisika, Cyato, Gasaka, Gihitasi, Gishoma (Hakizimana and Kim, 2016; Hakizimana et al., 2016; STIC, 2016; UNEP, 2016).
Biomass dependence for energy reduced from 95% to about 85% in the past two decades, but the ratio is still high, which is hurting forest resources. The population that has access to electricity was about 20% in June 2014. The rural electrification was close to eight percent (7.7%), and the urban electrification was about sixty two percent (61.5%). While more than three quarters (75.3%) of renewable energy was consumed as traditional biofuels, Rwanda aims to reduce its biomass dependency from 86.3 to 50% by 2020, increase access to electricity to 70% by 2017 and all (100%) public institutions connected to electricity in 2017 and these did not get accomplished. Also, planning for distribution expansion to households, small and medium enterprises, is robust because, it will use spatial maps, locational descriptors from the grid and terrain to price electricity for consumers (SE4All, 2014; UNEP, 2016).
About 20 mini-hydropower plants with a 9 MW total capacity were expected to be completed between 2014 and 2015, while 12–17 MW Nyabarongo II medium hydro and 145 MW Rusizi III regional hydro power plants were under construction to boost power output. High population density, high dependence on rain fed agricultural practices, and high incidence of natural disasters like flash floods and landslides have made Rwanda very susceptible to climate change. The Rwanda Energy Policy $(2008) and National Energy Strategy (2008–2020), emphasize diversification of energy sources to develop available domestic energy resources and phase out fossil fuel plants (Hakizimana and Kim, 2016; Hakizimana et al., 2016; STIC, 2016; UNEP, 2016).
Rwanda's renewable energy target relies on small hydro power projects, to provide about 42 MW. The strategy was expected to generate 188 MW from small hydro, biomass and geothermal by 2017, while 30,000 solar water heaters and 100,000 digesters were also expected to be installed by 2017. Whereas these prioritization and clear policy targets to integrate sustainable energy forms into electricity generation are vital, such levels of aggression are yet to be seen in cook stoves policy drive. Development partners have immensely contributed to improved cook stoves usage, as more than 50% Rwandan households owned improved cook stoves by 2008 and more progress is still being witnessed (ECA, 2014).
However, the level of energy access depends on affordability and supply as well as institutions, policies, and regulatory bodies. This huge challenge requires far-sighted vision, strong implementation strategy and regional cooperation. Furthermore, the willingness to pay, ability to switch to modern energy services for cooking, lighting, and acquisition of electrical appliances depend on income, which changes with time. As a result, lower income people predominantly consume biomass and charcoal. Sometimes, those at higher income brackets may be unwilling to switch because of traditional beliefs and possible long time of use (ECA, 2014).
Rwanda Power Sector
Rwanda per capita electricity consumption (30 kWh) is the lowest in the East African Community (EAC), when compared to Kenya (140 kWh), Tanzania (85 kWh), and Uganda (66 kWh); where about 25% of the imported petroleum products is used for electricity generation at the thermal power plants (Hakizimana et al., 2016). The high costs of fuel used to operate the thermal power plants have made the Government of Rwanda to subsidize domestic electricity tariffs (by about US$40 million annually) to make them comparable with the regional price range of between US$ 0.12 and US$ 0.18.
Although the electricity access had more than quadrupled from 5% in 2005 to about 20% in 2014, Rwanda's average electricity access rate was low when compared to Sub-Saharan Africa (31%) and African (40%) values, respectively (Hakizimana et al., 2016). Currently, Rwanda has achieved 42% electricity access rate, according to the reports from REG (RDB, 2018), which is now at par with the African electricity access rate. The important constraints, which have confronted Rwanda power sector include: (a) Electricity demands almost equal with generation, with little reserves, (b) High petroleum products expenditures, (c) Lack of investment finances, (d) Government subsidies, which cushion electricity retail prices, and (e) Inability to engage in much electricity export and trade because of relatively uncompetitive pricing regimes.
From the late 1950s until 2004, electricity was supplied by hydro power. Oil thermal plants were connected to the national grid to supply close to 46% of national grid total because of dire hydropower electricity shortages that occurred between 2000 and 2007 (Hakizimana et al., 2016). The drastic capacity reduction of Ntaruka hydropower plant that used to supply about 90% of total Rwanda electricity, occurred because of: (a) Decreased precipitation, (b) Defective management of upstream Rugezi wetlands and other watershed headwaters, (c) Increased human activities in the Rugezi-Burera-Ruhondo watersheds, which led to environmental degradation, and (d) Possible dam water capacity utilization overdrive in the face of long droughts, which complicated and further exacerbated the already dismal performance of the power plant and the troubled national grid. A discussion of technologies being used and future technologies for the power sector in Rwanda, follows.
Methane Gas Power Plants
Lake Kivu, which borders Rwanda and Democratic Republic of the Congo (DRC) contain about 60 billion cubic meters (bcm) of methane (CH4) and 300 billion cubic meters of carbon dioxide (CO2). These gases are from surrounding volcanic activities and bacterial action on decomposing organic materials, which is used to generate electricity of about 960 MW for both Rwanda and DRC. Hence, exploiting methane gas from Kivu Lake for electricity generation helps to avoid widespread catastrophes that could emanate from limnic (overturns) eruptions, which arise because of increasing and consequently, depressurized methane gas concentrations. Limnic reactions occurred in the Cameroons' Lakes Monoun (August, 1984) and Nyos (August, 1986), killing 37 people and more than 1,700 people, respectively (Rosen, 2015; Kling, 2016). In the world, only Lakes Monoun and Nyos of the Cameroons and Lake Kivu of Rwanda and DRC (former Zaire) contain dangerous levels of CO2, where the gases released are stored in the bottom waters of the lakes (Kling, 2016).
The conditions for CO2 (or CH4) to reach dangerous levels in the Cameroons Lakes Nyos and Monoun, and Lake Kivu, include: (a) Abundant source of CO2 (or CH4), (b) Strongly stratified lake, a situation where bottom and surface waters do not mix, which trap CO2 (or CH4) in bottom waters, and (c) The lake is deep enough to contain gas at very high pressures. Stratification is weakest where surface waters lose heat because of decreasing air temperatures or decreasing solar energy in the monsoon seasons. Gas build-up usually occurs from either sub-normal temperatures or heavier rainfalls (Rosen, 2015; Kling, 2016).
While the actual mechanisms for gas outburst are unknown, any occurrence that moves deep, gas-rich water nearer the surface can release the gas, which causes the hydrostatic pressure to decrease and gas bubbles are quickly released carrying along depressurized additional deep water upwards that could release large amounts of deadly CO2. Lakes are degassed by pumping gas-rich bottom waters to the surface using pipes, where dissolved gas leaves the solution as bubbles to lower gas-water mixture density to safer levels (Kling, 2016).
Lake Nyos degassing began in 2001 and that for Lake Monoun in 2003, but Lake Kivu contains 1,000 times more CO2 than Lake Nyos, and degassing it would attract prohibitively high costs and wastage of valuable methane gas resource. Furthermore, the methane gas stored in Kivu Lake ranks as the 5th largest natural gas (methane) deposit of any country in the world. It is also one of the world's disaster prone areas, because at least two million people live around Lake Kivu shoreline, where dissolved methane gas pressure has been increasing over time. At current estimates, build-up rates of the combined total gas pressure of CO2 with CH4, is expected to reach saturation in about 100 years or at the turn of this century, which could set off deadly gas blasts (Rosen, 2015; Kling, 2016).
The geochemistry of Lake Kivu is strange, because local sub-organic springs absorb carbon dioxide from the volcanic soil in the region to feed the gas into the lake's deepest waters, where much of the methane is from decomposing organic matter, and the remainder is either from volcanic soil or bacteria converting the CO2 into CH4. While the springs are salty, fresh water sources feed Kivu Lake upper layers, leading to density gradients that prevent gas diffusing upwards (stratification) and finally into the atmosphere. Another major complication is that Kivu Lake consists of five different basins, which vary in depth and each with its unique physiochemical properties (Rosen, 2015).
Methane extraction technology consists of lifting up gas and nutrient-rich deep water, which automatically degasses in a separator near the surface. The gas passes through washing water to remove the CO2 in a scrubber. Purified gas is sent to the generators to produce electricity, while both degassed and washing water are re-injected back into the lake (Pasche et al., 2010).
Both technical and economic feasibilities of methane to power were demonstrated since 1963 by Bralirwa Breweries at Cape Rubona in Gisenyi, and the 4.5 MW KivuWatt Power 1 (KP1) had operated at 1.5 MW capacity since 2008. Furthermore, the REG developed a 3.6 MW capacity methane power plant and the 25 MW capacity (US$ 200 million) KivuWatt Power 2 plant, by Contour Global (United States of America) Subsidiary, was commissioned on 16 May 2016 after 3 years delay from contractual disagreements between the Principal (Contour Global) and one of her Kenyan subcontractors (Civicon Engineering). This plant is to be scaled up to 100 MW capacity plant (Pasche et al., 2010; Esiara, 2015b; Rosen, 2015; Hakizimana et al., 2016). While Symbion power was constructing a 50 MW plant, the DRC Government was considering its first bid reviews for Kivu Lake gas concession in 2015. However, a methane project, which produced 2.4 MW in 2010, was removed from Kivu Lake because its equipment was destroyed by a storm (Rosen, 2015).
The KivuWatt large-scale extraction facility is a barge consisting of four plastic pipes that draw up water from about 350 m below water surface, and anchored 13 km offshore. Bubbles of methane and carbon dioxide begin to form as the water rises into a separator, where the partially degassed water is reintroduced deep into the lake, whose gas composition is close to 30% methane and 70% carbon dioxide, with trace hydrogen sulfide (H2S), which continue to one of the four towers on the barge. Wash water taken from about 40 m below the surface is mixed with the gas to remove as much remaining CO2 as possible. The wash water is later returned to 60 m below lake water surface, but the final product is about 85% methane gas, which is pressurized and sent to the onshore power plant to produce electricity. Furthermore, degassing operations could change the stratification structure and properties of the lake (Pasche et al., 2010; Esiara, 2015b; Rosen, 2015; Hakizimana et al., 2016; Kling, 2016).
The 2009 Management Prescriptions (MPs) for the Development of Lake Kivu Gas Resources ensure that both Rwanda and DRC have adopted the guidelines for gas extraction and re-injection of degassed water, where the most important consideration from an energy viewpoint is how the gas extraction will perform. KivuWatt is expected to extract two-thirds of methane in the drawn up water and the remaining one-third is lost in the separation process and wash towers. Some of the gas in reintroduced water could be re-extracted later in time, in smaller concentrations and may be uneconomical to capture (Rosen, 2015), as these could migrate. Mainly because, projections have been based on simulations, the actual plant efficiencies cannot be determined before the barge starts operation. Whereas the two countries signed agreements in 1975 to share the methane resource equally, the earlier exploitation of methane by Rwanda before DRC is capable of causing conflicts, especially because, gas levels at certain depths of Kivu Lake's main basin are uniform (Rosen, 2015), and it is also not known how the earlier extraction of gas from the Rwandan waters would impact the quantity available to DRC.
Diesel Thermal Power Plants
Petroleum fuelled thermal power plants were first introduced into the Rwanda electricity mix in 2005, when there were droughts (2000–2007) and the hydropower systems could not supply the nation with its electricity requirements. The diesel thermal power plants operations have been very expensive, resulting in increased retail electricity tariffs by more than 100%, which have significantly reduced Rwanda's electricity pricing advantage and competitiveness in the EAC. While these thermal power plants were earmarked for phase-out by 2017, this policy scenario may not be realized by now, because the facilities would still be in use until that time, when more renewable electricity resources and other peat-to-power plants with relatively much cheaper generation costs are sufficient to make diesel power plants capacity inputs, unnecessary.
Whereas these thermal power plants were rented since installation in 2005, they currently incur a daily operational expense of about US$65,000.00 (Hakizimana et al., 2016). Furthermore, both Esiara (2014) and Tumwebaze (2014) report that it costs an average of FRW 260 million a day and FRW 41 billion annually, to operate Jabana I and II, and Aggreko-run Gikondo and Mukungwa rental power. Thus, the utility spends more on heavy fuel oil (HFO), than it makes from sales. At phase out, decommissioning of these diesel thermal power plants would still be at a very high cost, apart from depreciation, carriage and freight, insurance, and salvage value considerations. Also, it was not known why Lease and Buy Back arrangements were not considered since 2005. Consequently, rental agreements for the diesel thermal power plants may not make provision for combined heat and power (CHP) options, which would require some adjustments and additional equipment and costs of implementation.
Consequently, heat recovery would be necessary because, more than one-half of the potential energy of original fuel is usually wasted as low grade heat for steam turbines, gas turbines, or diesel engines in electricity generation (Dryden, 1982). Therefore, a feasibility study would be required to establish the power rating and the cost implications for each CHP proposal.
Peat Power Plants
Peat layers are in bogs, marshes, moors, and fens, and is, extracted by hand cutting, machine dredgers or high pressure water jets. It is prepared on site for the market, because of very high moisture content. Lignite, brown and black coals have seams within stratified rocks of Devonian to Tertiary age, while most lignites and brown coals are tertiary or cretaceous. Their deposits are widely distributed throughout the world. Peat is cut into sods or made into pellets to reduce its very high moisture content by drying (Over 90% initially), which can be briquetted after drying and used locally because they are 2–2 times denser than coal. Dried peat can be pulverized or used as briquetted peat, whose carbonization products are peat-coke, tar, liquor or gas. Producer gas is made from peat gasification and the solvent extraction products are montan, wax, and fuel residues. Peat can be used as domestic fuel, in power stations and agriculture (Dryden, 1982; Miley and Clapp, 2000; Hakizimana and Kim, 2016).
Unit size, steam pressure, steam temperature, fuel, furnace, superheaters, reheaters, and economisers influence boiler design, typical example is shown in Table 7. Peat is the most common fuel in Rwanda and equally the most difficult to burn. Ash in peat has many distasteful chemical elements and compounds, and high ash percentage content from peat can have damaging effects on furnace performance (Some details in Table 6). High temperatures from burning fuel in the furnace, makes fractions of ash to become partially fused and sticky. The amount of ash and fusion temperature can cause partially fused ash to stick to surfaces in contact with ash-containing gases to form slag, where chemicals in ash attack materials like alloy steels used in superheaters and reheaters. Also, the air-heater (coolest part) may corrode and block gas passages from Sulfur compounds in the fuel, which has contact with moisture in flue gases (Dryden, 1982; Miley and Clapp, 2000).
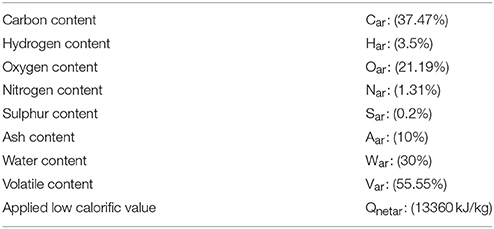
Table 6. Fuel and Peat Analysis Report by Shandong Runh Power Plant Engineering Technology Co., Ltd (Information data gathered at Gishoma Peat Power plant about Fuel and peat analysis).
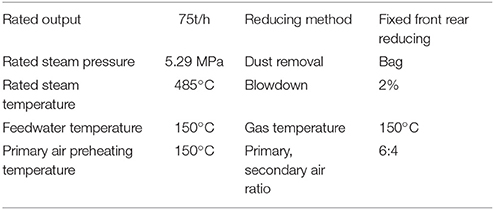
Table 7. Boiler Technical Specifications (Main Parameters), (Information and data gathered at REG about Fuel and peat analysis).
Heat generated in combustion shows as furnace radiation and sensible heat in combustion products, where only about 50% of the heat is used to generate steam by evaporation. The most important factor for fuel on boiler design is ash contents of combustion. Therefore, peat burning boilers have larger furnaces, ash-handling and particulate control equipment and lower velocities, which is expensive and demands substantial space. Also, the calorific values, moisture content, and mass of fuel, enable us to determine the size of peat storage, handling, crushing and pulverizing equipment (Miley and Clapp, 2000).
Also, the percentage of contents of peat varies from day to day, because of rapid extraction; transportation; consumption, and weather conditions (on-site gathered information at REG). RUNH Power Corporation Ltd is the firm which was contracted to construct Gishoma peat power plant (ESI-Africa, 2017) and information of this power plant, peat, furnace, etc., was gathered from both REG and RUNH Power Corporation Ltd.
The boiler is a natural circulation water tube design, which uses the circulating combustion system. It consists of combustion room, furnace, water cooling cyclone separator, and reverse device. The furnace is constructed using water wall membranes, and the super heater is divided into high and low temperature stages. The design employs one or two stages of water spray temperature reducers between two super heaters. There are also two stages of economisers coupled with primary/secondary air preheated in the tail region (on-site gathered data information).
Peat slags comprise, SiO2, Al2O3, Fe2O3, CaO, and MgO, and when deposited on metal surfaces cause corrosion of underlying metal, which reduces tubes life, damage protective oxide films by surface erosion. Furthermore: (a) Ash abrasiveness, (b) Velocity of imparting particles, (c) Angles of impact, (d) Metal temperatures, (e) Overheating from bad flame distribution or poor coolant flow causes local corrosion, while reduced gas atmospheres around tubes from escaped and unburnt peat particles, cause sodium chloride (NaCl) deposit to aggressively attack metal. Although there is between 1,000 and 5,000 h of plant operation before this happens, it occurs in peat with high NaCl contents. Hence, making mills and classifiers provide acceptable particle size distribution or adjust combustion equipment air/fuel distribution and burner angle, can address some of these ash corrosion problems (Dryden, 1982; Beaty, 2000; Miley and Clapp, 2000; Stubbins, 2000).
Furthermore, alloys with higher chromium content can be used to provide better corrosion resistance, while factors like: (a) Temperature of interface between outer metal oxide and innermost layer of deposit, (b) Position of tube in a bank (corrosion rate of leading tube is 2 or 3 times higher than tube six rows in), (c) Temperature of local flue gas and (d) Overall heat flux, tend to accelerate corrosion (Miley and Clapp, 2000; Stubbins, 2000).
However, useful by-products of the peat plant like Ammonia could be converted to fertilizer for agricultural purposes, after conducting feasibility studies to determine their viability. Sinking fund, amortization, equipment replacement, and renewal funds, as well as depreciation provisions can be used to fund some of these vertical integration projects like ammonia fertilizer plant.
Rwanda Power Sector Economics
The estimated overnight costs are: (a) US$2990/kW, and (b) US$1910/kW for regional (≥3.5 MW) and local (0.228.0 MW) hydropower technologies, respectively. The estimated cost for solar is US$3540/kW. The estimated cost for geothermal resource is US$2620/kW at 15% plant efficiency. Also the estimated overnight cost for Gas power plant is US$700/kW at 30% efficiency, while the estimated overnight cost for Peat power plant is US$2010/kW at 40% efficiency (Hakizimana et al., 2016). Furthermore, the two methane gas-to-electricity projects (Contour Global and Symbion) are expected to reduce the high cost of electricity in Rwanda from an average of US$0.24 per kilowatt-hour (compared to US$0.15 in Kenya and US$0.17 in Uganda), to US$0.15 and later US$0.12 (PSIC, 2016). In addition, Lake Kivu electricity costs around US$0.06–0.07/kWh, but the technology used presently is not extracting the gas as efficiently as expected (Okereke and Tyldesley, 2011).
While production costs of US$0.06–0.07 have been reported for the earlier Lake Kivu projects (Okereke and Tyldesley, 2011) there is a lack of public information on the electricity production and fuel costs of the new Lake Kivu projects and the peat projects and this needs to be addressed in future work to fully assess the least cost generation options for Rwanda.
Although Contour Global and Symbion are expected to sell the generated power to the utility for < 15 cents per kilowatt-hour, the preceding rate is expected to be competitive with peat power plants, which should be less than half the cost of power generated from imported fossil fuels. This rate is also expected to fall < 12 cents per kWh, later. However, future work should consider the projected impacts of Contour Global and Symbion on the electricity price, to be able to determine an optimal power generation mix for Rwanda.
Additionally, peat bogs sources are expected to be < 15 km from Peat power plant to reduce raw materials transportation costs. The assumed operational plant times for: (a) Gas is 80%, (b) Peat is 91%, (c) Hydro is 50%, (d) Diesel is 80%, (e) Geothermal is 70%, and (f) Solar is 18% (Dryden, 1982; Hakizimana and Kim, 2016; Hakizimana et al., 2016).
The transmission and distribution overnight costs have been assumed to be the same at US$1120/kW, while the estimated operational time is 98%. The economic lifespan of power plants is the duration for which the power plant investment completely offsets its installation and commissioning costs. After that period, the power plant has zero cost or value in the Books of Accounts. It could be said to be economically obsolete from that time henceforward, although it is still technically sound and useful. Any operations from then onwards is seen as a profit to the power utility. In that regard, therefore, technical lifespan is much longer than economic life of the power plant (Hakizimana et al., 2016).
In consonance with the above, the economic lifespan of hydropower plants has been assumed to be between 30 and 50 years, while those for transmission systems have been assumed to be 60 years. Furthermore, those for gas-fired, peat-fired, diesel thermal, geothermal and solar power plants have been assumed to be 25 years, each (IRENA, 2012; IEA, 2015; Hakizimana et al., 2016).
Using the highest regional electricity tariff of between US$0.12 and US$0.18/kWh (Hakizimana et al., 2016), to compare with the local Rwandan electricity tariff of US$0.22/kWh (Table 3), we find that Rwanda's electricity price is about 22.2% more expensive than the highest electricity tariff in the EAC.
The Table 8 below shows the Public Economic Data for Rwanda's Generation, Transmission, and Distribution Options. The Table 8 specifies the plant efficiency, capacity factor, electricity production cost, economic life, and overnight capital costs for each technology used in the power sector in Rwanda.
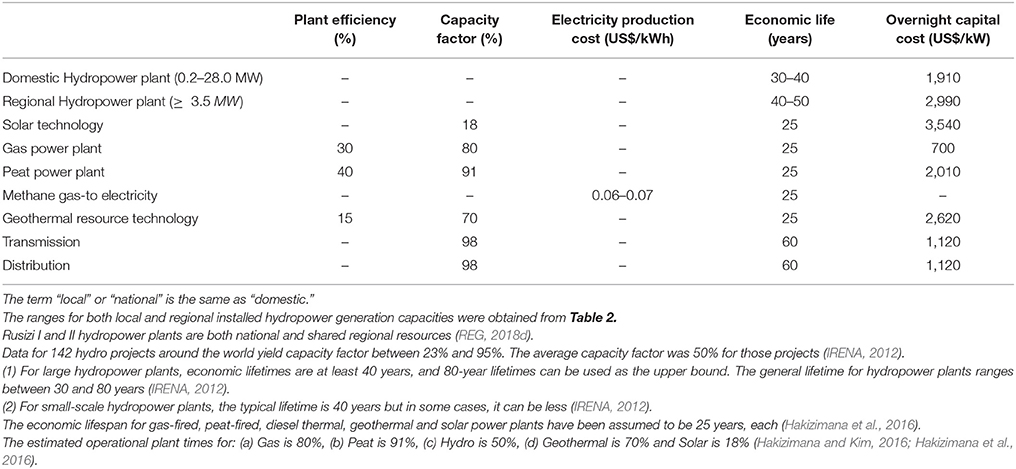
Table 8. Public Economic Data for Rwanda's Generation, Transmission and Distribution Options (Okereke and Tyldesley, 2011; Hakizimana et al., 2016).
Conclusion
Rwanda has experienced and endured energy crises in the last three decades, and has begun to make giant strides and significant improvements in electrification for the past few years, because of its vision, policies, and implementation strategies and plans. Rwanda has more than doubled the capacity of its 100 MW electricity generation in 2010 to 216 MW, by December 2017, which is about 42% of the target generation (512 MW), with universal access (100%) by 2023/24.
Also, Rwanda power sector is among the fastest growing, as it provides opportunities and incentives for those interested in energy business or other activities related to its furtherance. The target of government is to increase electricity generation capacity to 512 MW by 2023/24, which satisfies 100% of the population reliably and sustainably, where 52% of the population would be connected to the grid, while the remaining 48% would be connected off-grid.
In addition, business opportunities are available in hydropower, solar energy, geothermal, peat to power and methane gas to power projects, for energy production, prospecting and exploitation. Opportunities are equally available for strengthening transmission lines and links, on- and off-grid solutions like electrification of schools, hospitals and institutions located far from transmission lines, through energy roll-out programmes and electricity distribution links. The government is also using policies, plans, strategies, legal frameworks, incentives, assets and guarantees to attract investors and private sector energy developers, who would assist in achieving the aspirations and fulfill the ambitious mission targets of 100% electricity access to the whole Rwanda population by 2023/24.
However, the level of energy access depends on demand and supply as well as institutions, policies and regulatory bodies. This huge challenge requires far-sighted vision, strong implementation strategies and regional cooperation. Therefore, the willingness to pay, ability to switch to modern energy services for cooking, lighting, and acquisition of electrical appliances depend on income, which changes with time. As a result, lower income people predominantly consume biomass and charcoal. Sometimes, those at higher income brackets may be unwilling to switch either because of traditional beliefs or possible long time of use.
In 2017 the installed generation capacity in Rwanda was 216 MW of which 57.8 MW was thermal plant most of it leased and operating on imported petroleum fuel. The potential to generate electricity economically with local resources including, hydropower, peat, lake gas methane and geothermal energy has however, been estimated to total around 1,613 MW. The country is therefore, utilizing < 10% of its local electricity potential, excluding a substantial solar resource, while incurring a large foreign outflow.
It is recommended that the ammonia from peat power plants could be converted into fertilizers for agriculture and subsidiary companies could be established to exploit these resources, after feasibility studies have been conducted to determine their viability.
Future research should consider off-grid connections based on the level of electricity access using the Global Tracking Framework (Tier 0–Tier 5). It is further suggested that future research should consider determining the technologies of thermal power plants as well as the all-inclusive operational costs for methane gas and peat power plants to assist decision makers in planning further development and expansion.
Author Contributions
SB and GA wrote the paper. GA and LL checked and supervised the paper writing from its first point up to the last step.
Conflict of Interest Statement
The authors declare that the research was conducted in the absence of any commercial or financial relationships that could be construed as a potential conflict of interest.
Acknowledgments
This work was funded by the National Natural Science Foundation of China (program No. 51475136), Natural Science Foundation of Hebei Province, China (Program No. E2014202230), Universities in Hebei Province, China Science and Technology Research Youth Fund (Program No. QN20151002), University Innovation Team Leader Program in Hebei Province (LJRC003). Authors acknowledge the support ideas of Aimable Ishimwe and Cicilia Mesa Kemunto during the first drafting of this paper.
Footnotes
1. ^LPG Gas for Sustainability. Available online at: http://www.newtimes.co.rw/PDF_ads/LPG%20GAS%20for%20sustainability.pdf.
2. ^Energy use of peat. Available online at: http://www.fao.org/docrep/x5872e/x5872e0b.htm.
3. ^Private Infrastructure Development Group. Rwanda, KivuWatt Methane-Fired Power. Available online at: http://www.pidg.org/impact/case-studies/kivuwatt.
4. ^Solar Rwanda Program. Residential Solar Water Heating Program. Available online at: http://www.reg.rw/images/pdf/Description%20of%20SolaRwanda%20Program%20Updated%202014%2002%2011.pdf)
References
AFDB (2013a). Rwanda Energy Sector: Review and Action Plan. Available online at: https://www.afdb.org/fileadmin/uploads/afdb/Documents/Project-and-Operations/Rwanda_-_Energy_Sector_Review_and_Action_Plan.pdf
AFDB (2013b). Rwanda-Scaling up Energy Access Project. Available online at: https://www.afdb.org/fileadmin/uploads/afdb/Documents/Project-and-Operations/Rwanda%20-%20Scaling%20Up%20Energy%20Access%20Project%20-%20Appraisal%20Report.pdf
Barry, M. L., Steyn, H., and Brent, A. (2011). Selection of renewable energy technologies for Africa: eight case studies in Rwanda, Tanzania and Malawi. Renew. Ener. 36, 2845–2852. doi: 10.1016/j.renene.2011.04.016
Beaty, H. W. (2000). “Electrochemistry and Electrometallurgy,” in Standard Handbook for Electrical Engineers, 14th edn., eds G. D. Fink, and H. W. Beaty (McGraw-Hill), 24-2–24-38.
Bensch, G., Kluve, J., Peters, J. (2011). Impacts of rural electrification in Rwanda. J. Dev. Effect. 3, 567–588. doi: 10.1080/19439342.2011.621025
Brew-Hammond, A. (2010). Energy access in Africa: challenges ahead. Energy Policy 38, 2291–2301. doi: 10.1016/j.enpol.2009.12.016
CR (Construction Review Online) (2017). Rwanda Launches First Peat-Fired Power Plant in Africa. Available online at: https://constructionreviewonline.com/2017/04/rwanda-launches-first-peat-fired-power-plant-in-africa/
Dryden, I. G. C. (1982). The Efficient Use of Energy. 2nd edn. London: Butterworth and Co Publishers Ltd.
ECA (2014). Energy Access and Security in Eastern Africa-Status and Enhancement Pathways, Sub-regional Office for Eastern Africa, Kigali, Rwanda. Addis Ababa: Publication and Documentation Section, Economic Commission for Africa.
EDCL (Energy Development Corporation Limited) (2018a). Electricity Access. Available online at: http://www.reg.rw/index.php/projects/distribution4
EDCL (Energy Development Corporation Limited) (2018b). Electricity Access in Rwanda Quadrupled in the Last 7 Years as More Households Get Connected. Available online at: http://edcl.reg.rw/index.php/media-centre/news/346-electricity-access-in-rwanda-quadrupled-in-the-last-7-years-as-more-households-get-connected
EDCL (Energy Development Corporation Limited) (2018c). About EARP. Available online at: http://www.reg.rw/index.php/partners/local-partners
Epd Rwanda (2013a). Peat to Power. Available online at: http://www.epd-rwanda.com/peat-to-power-kigali.html
ESI-Africa (2014). Rwanda Welcomes Africa's Peat to Power Plant. Africa's Power J. Available online at: https://www.esi-africa.com/news/rwanda-welcomes-africas-first-peat-power-plant
ESI-Africa. (2017). Rwanda: Gishoma Peat Power Plant is Grid Ready. Available online at: https://www.esi-africa.com/rwanda-gishoma-peat-power-plant-ready-for-commissioning/
Esiara, K. (2014). EWSA is on Right Track to Power the Nation, Says CEO. The East African. Available online at: http://www.theeastafrican.co.ke/rwanda/News/EWSA-is-on-right-track-to-power-the-nation–says-CEO-/1433218-2325086-14051l4/index.html
Esiara, K. (2015a). Dispute Delays Rwanda Power Project by 3 years, The East African. Available online at: http://www.theeastafrican.co.ke/news/Dispute-delays-Rwanda-power-project-by-3-years/2558-2660968-vofxmrz/index.html
Esiara, K. (2015b). Rwandan Households Slow to Switch to Gas Despite Tax Incentives. Available online at: http://www.theeastafrican.co.ke/Rwanda/Business/Rwandan-households-slow-to-switch-to-gas-despite-tax-incentives-/1433224-3002470-12qbmtoz/index.html
EUCL (2018). Incentives to Investors. Energy Utility Corporation Limited. Available online at: http://reg.rw/index.php/investments/incentives
Hakizimana, J. D. K., and Kim, H.-T. (2016). Peat briquette as an alternative to cooking fuel: a techno-economic viabililty assessment in Rwanda. Energy 102, 453–464. doi: 10.1016/j.energy.2016.02.073
Hakizimana, J. D. K., Yoon, S. P., Kang, T. J., Kim, H. T., Jeon, Y. S., and Choi, Y. C. (2016). Potential for peat-to-power usage in Rwanda and associated implications. Energy Strategy Rev. 13–14, 222–235. doi: 10.1016/j.esr.2016.04.001
Hategeka, A., and Karenzi, P. C. (1997). “Guidelines for biomass energy policy implementation in Rwanda,” in Biomass Energy Policy in Africa: Selected Case Studies. Available online at: http://documents.worldbank.org/curated/en/285631468336663680/text/E28960v10P126400Box369243B00PUBLIC0.txt
IEA (2015). Projected Costs of Generating Electricity. Available online at: https://www.iea.org/publications/freepublications/publication/ElecCost2015.pdf
IOB Evaluation (2014). Access to Energy in Rwanda: Impact Evaluation of Activities supported by the Dutch Promoting Renewable Energy Program. Available online at: https://www.oecd.org/derec/netherlands/Access-to-Energy-in-Rwanda.pdf
IRENA (2012). “International Renewable Energy Agency (IRENA), renewable energy technologies: cost analysis series,” in IRENA Working paper, Vol. 1: Power Sector, Issue 3/5. Hydopower. Available online at: https://www.irena.org/documentdownloads/publications/re_technologies_cost_analysis-hydropower.pdf
Karekezi, S., and Majoro, L. (2002). Improving modern energy services for Africa's urban poor. Energy Policy 30, 1015–1028. doi: 10.1016/S0301-4215(02)00055-1
Kling, G. W. (2016). Using Science to Solve Problems: The Killer Lakes of Cameroon. Available online at: https://globalchange.umich.edu/globalchange1/current/lectures/kling/killer_lakes/killer_lakes.html
Landi, M., Sovacool, B. K., and Eidsness, J. (2013). Cooking with gas: policy lessons from Rwanda's National Domestic Biogas Program (NDBP). Energy Sustain. Dev. 17, 347–356. doi: 10.1016/j.esd.2013.03.007
Martinot, E., Chaurey, A., Lew, D., Moreira, J. R., and Wamukonya, N. (2002). Renewable energy markets in developing countries. Ann. Rev. Energy Environ. 27, 309–348. doi: 10.1146/annurev.energy.27.122001.083444
Miley, G. H., and Clapp, A. L. (2000). “Generation,” in Standard Handbook for Electrical Engineers, 14th edn, eds G. D. Fink and H. W. Beaty (McGraw-Hill). 5-2-5-17.
MININFRA (2014). Peat Energy. Available online at: http://www.mininfra.gov.rw/index.php?id=82 (Accessed 12 April 2018).
MININFRA (2015a). Rwanda Energy Policy. Available online at: http://www.mininfra.gov.rw/rw/fileadmin/user_upload/new_tender/REP_17th_March_2015.pdf
MININFRA (2015b). Energy Sector Strategic Plan. Available online at: http://www.mininfra.gov.rw/fileadmin/user_upload/new_tender/Energy_Sector_Strategic_Plan.pdf
MININFRA (2015c). Rural Electrification Strategy. Available online at: http://www.mininfra.gov.rw/fileadmin/user_upload/aircraft/Rural_Electrification_Strategy.pdf
Munyaneza, J., Wakeel, M., and Chen, B. (2016). Overview of Rwanda energy sector: from energy shortage to sufficiency. Energy Procedia 104, 215–220. doi: 10.1016/j.egypro.2016.12.037
NISR (2014). National Institute of Statistics Rwanda. RPHC4: Population Projections. Available online at: http://www.statistics.gov.rw/publication/rphc4-population-projections
NISR (2018). National Institute of Statistics Rwanda. Key figures. Available online at: http://www.statistics.gov.rw/
Okereke, C., and Tyldesley, S. (2011). Low- Carbon Africa: Rwanda. Available at: https://docplayer.net/21199338-Chukwumerije-okereke-and-sally-tyldesley-smith-school-of-enterprise-and-the-environment-university-of-oxford-november-2011-1.html
Pasche, N. T., Mugisha, A., Rwandekwe, L., and Umutoni, A. (2010). Monitoring the Effects of Methane Extraction in Lake Kivu. MININFRA Report, Kigali, Rwanda.
PSIC (2016).“Rwanda and DRC: Lake Kivu methane gas projects,” in Private Sector Investment Conference (PSIC) for the Great Lakes Region of Africa (Kinshasha). Available online at: http://psicinvest.com/en/project-details/rwanda-drc-lake-kivu-methane-gas-development#
Rakotojaona, L. (2013). Domestic Biogas Development in Developing Countries Available online at: http://www.enea-consulting.com/wp-content/uploads/2015/05/Open-Ideas-Domestic-biogas-projects-in-developing-countries.pdf
RDB (2018). Overview. Available online at: http://rdb.rw/investment-opportunities/energy/
REG (2000). Energy- The opportunity in Rwanda. Available online at: http://www.reg.rw/images/pdf/Energy%20The%20Opportunity%20in%20Rwanda.pdf
REG (2017a). Power generation. Available online at: http://reg.rw/index.php/our-business/generation/624-power-generation-2
REG (2017b). Power Transmission Line Length. Available online at http://reg.rw/index.php/projects/transmission
REG (2017d). Distribution Network. Available online at http://reg.rw/index.php/our-business/distributions/146-distribution-information
REG (2017e). Energy Saving Tips. Available online at: http://reg.rw/index.php/energy-saving-tips
REG. (2017f). EARP Background. Available online at: http://www.reg.rw/images/Documents/EARP.pdf
REG (2017g). Brief Note on Loss Reduction Project Funded by European Union. Available online at: http://reg.rw/images/pdf/BRIEFNOTEONPROJECTS002.pdf
REG (2018a). Investment Information Pack, Investment Opportunities In Hydropower Sector-Rwanda, Key Energy Investment Opportunities. Available online at: http://reg.rw/index.php/investments/opportunities
REG (2018b). Current Installed Generation Capacity. Available online at: http://www.reg.rw/index.php/projects/generation/744-current-status-of-power-generation-in-rwanda
REG (2018c). Electricity New Tariff. Available online at: http://www.reg.rw/index.php/our-business/electricity-tariff
REG (2018d). Hydro Power in Rwanda. Available online at: http://reg.rw/index.php/projects/generation/169-hydro-power
REMA (2011). Green Growth and Climate Resilience' National Strategy for Climate Change and Low Carbon Development'. Available online at: http://www.rema.gov.rw/~remagov/rema_doc/RGG&CRS%202011/Rwanda%20Green%20Growth%20Strategy%20FINAL%20high%20res.pdf
REMA (2013). ChapVIII:Energy Resources. Available online at: http://www.rema.gov.rw/soe/chap8.php
Remington, C. (2013). Project KivuWatt Generates Electricity from Rwanda's Explosives Lake Kivu, Revolt, World Watch Institute. Available online at: http://blogs.worldwatch.org/revolt/project-kivuwatt-generates-electricity-from-rwandas-explosive-lake-kivu-2/
Rosen, J. W. (2015). Lake Kivu's Great Gas Gamble. MIT Technology Review. Available online at: https://www.technologyreview.com/s/536656/lake-kivus-great-gas-gamble/
RURA (2012). Liquefied Petroleum Gas Regulations. Available online at: http://www.rura.rw/fileadmin/docs/Board_Decisions/LIQUEFIED_PETROLEUM_GAS_REGULATIONS.pdf
Safari, B. (2010). A review of energy in Rwanda. Renew. Sustainable Energy Rev. 14, 524–529. doi: 10.1016/j.rser.2009.07.009
SE4All (2014). Rapid Assessment Gap Analysis Rwanda. Available online at: http://www.se4all.org/sites/default/files/Rwanda_RAGA_EN_Released.pdf
Sinaruguliye, J. C., and Hategekimana, J. B. (2013). Biogas Development Scenarios Towards 2020 in Rwanda: The Contribution to the Energy Sector and Socio-Economic and Environmental Impacts. Master's thesis, University of Gavle Sweden. Available online at: https://www.usaid.gov/sites/default/files/documents/1860/RwandaCountryFactSheet__2016.09%20FINAL.pdf
STIC (2016). Opportunities Within the Energy Sector in Rwanda. Nairobi: The Sweden Trade and Invest Council, Business Sweden in Kenya. 1–9.
Stubbins, J. (2000). “Structural Materials,” in Standard Handbook for Electrical Engineers, 14th edn, eds G. D. Fink, and H. W. Beaty (McGraw-Hill), 4-164–4-196.
Tumwebaze, P. (2014). EWSA Asked to Sash Electricity Costs. The New Times. Available online at http://www.newtimes.co.rw/section/read/74829
UNEP (2016). Rwanda. Available at: https://wedocs.unep.org/bitstream/handle/20.500.11822/20519/Energy_profile_Rwanda.pdf?sequence=1&isAllowed=y
USAID (2016). Rwanda Energy Sector Overview. Available online at: https://www.usaid.gov/sites/default/files/documents/1860/RwandaCountryFactSheet__2016.09%20FINAL.pdf
Vander Plas, R. J. (2009). Biomass Energy Strategy (Best), Rwanda. Available online at: http://cleancookstoves.org/resources_files/best-summary-biomass-energy.pdf
World Bank (2012). Republic of Rwanda Ministry of Agriculture and Animal Resources (MINAGRI) Rural Sector Support Project (RSSP 3). Available online at: http://documents.worldbank.org/curated/en/285631468336663680/text/E28960v10P126400Box369243B00PUBLIC0.txt
World Atlas (2017). Where is Rwanda? Available online at: http://www.worldatlas.com/af/rw/where-is-rwanda.html
World Bank (2017). Rwanda Electricity Sector Strengthening Project. Available online at: http://projects.worldbank.org/P150634?lang=en
Keywords: distribution, generation, methane gas to power, peat to power, tariffs, transmission
Citation: Bimenyimana S, Asemota GNO and Li L (2018) The State of the Power Sector in Rwanda: A Progressive Sector With Ambitious Targets. Front. Energy Res. 6:68. doi: 10.3389/fenrg.2018.00068
Received: 01 August 2017; Accepted: 21 June 2018;
Published: 20 July 2018.
Edited by:
Sonia Yeh, Chalmers University of Technology, SwedenReviewed by:
Adrian Stone, Sustainable Energy Africa, South AfricaFrancesco Dalla Longa, Energy Research Centre of the Netherlands, Netherlands
Copyright © 2018 Bimenyimana, Asemota and Li. This is an open-access article distributed under the terms of the Creative Commons Attribution License (CC BY). The use, distribution or reproduction in other forums is permitted, provided the original author(s) and the copyright owner(s) are credited and that the original publication in this journal is cited, in accordance with accepted academic practice. No use, distribution or reproduction is permitted which does not comply with these terms.
*Correspondence: Samuel Bimenyimana, czA3ODUyMTMxMjJAZ21haWwuY29t