 Annika Wahl1,2†
 Erik van den Akker3,4†
 Lucija Klaric5,6,7†Jerko Štambuk5Elisa Benedetti8Rosina Plomp9
 Genadij Razdorov5
 Irena Trbojević-Akmačić5
 Joris Deelen3,10
 Diana van Heemst11P. Eline Slagboom3Frano Vučković5Harald Grallert1,2,12Jan Krumsiek8,12Konstantin Strauch13,14Annette Peters2
 Thomas Meitinger15Caroline Hayward6Manfred Wuhrer9
 Marian Beekman3
 Gordan Lauc5,16‡
 Christian Gieger1,2*‡
- 1Research Unit Molecular Epidemiology, Helmholtz Zentrum München – German Research Center for Environmental Health, Neuherberg, Germany
- 2Institute of Epidemiology 2, Helmholtz Zentrum München – German Research Center for Environmental Health, Neuherberg, Germany
- 3Molecular Epidemiology, Department of Biomedical Data Sciences, Leiden University Medical Center (LUMC), Leiden, Netherlands
- 4Pattern Recognition and Bioinformatics, Delft University of Technology, Delft, Netherlands
- 5Genos Glycoscience Research Laboratory, Zagreb, Croatia
- 6MRC Human Genetics Unit, Institute of Genetics and Molecular Medicine, University of Edinburgh, Edinburgh, United Kingdom
- 7Centre for Global Health Research Population Health Sciences, School of Molecular, Genetic and Population Health Sciences, Usher Institute of Population Health Sciences and Informatics, University of Edinburgh, Edinburgh, United Kingdom
- 8Institute of Computational Biology, Helmholtz Zentrum München – German Research Center for Environmental Health, Neuherberg, Germany
- 9Center for Proteomics and Metabolomics, Leiden University Medical Center (LUMC), Leiden, Netherlands
- 10Max Planck Institute for Biology of Ageing, Köln, Germany
- 11Department of Internal Medicine, Section Gerontology and Geriatrics, Leiden University Medical Center (LUMC), Leiden, Netherlands
- 12German Center for Diabetes Research (DZD), Neuherberg, Germany
- 13Institute of Genetic Epidemiology, Helmholtz Zentrum München – German Research Center for Environmental Health, Neuherberg, Germany
- 14IBE, Faculty of Medicine, LMU Munich, Munich, Germany
- 15Institute of Human Genetics, Helmholtz Zentrum München – German Research Center for Environmental Health, Neuherberg, Germany
- 16Faculty of Pharmacy and Biochemistry, University of Zagreb, Zagreb, Croatia
Immunoglobulin G (IgG), a glycoprotein secreted by plasma B-cells, plays a major role in the human adaptive immune response and are associated with a wide range of diseases. Glycosylation of the Fc binding region of IgGs, responsible for the antibody’s effector function, is essential for prompting a proper immune response. This study focuses on the general genetic impact on IgG glycosylation as well as corresponding subclass specificities. To identify genetic loci involved in IgG glycosylation, we performed a genome-wide association study (GWAS) on liquid chromatography electrospray mass spectrometry (LC–ESI-MS)—measured IgG glycopeptides of 1,823 individuals in the Cooperative Health Research in the Augsburg Region (KORA F4) study cohort. In addition, we performed GWAS on subclass-specific ratios of IgG glycans to gain power in identifying genetic factors underlying single enzymatic steps in the glycosylation pathways. We replicated our findings in 1,836 individuals from the Leiden Longevity Study (LLS). We were able to show subclass-specific genetic influences on single IgG glycan structures. The replicated results indicate that, in addition to genes encoding for glycosyltransferases (i.e., ST6GAL1, B4GALT1, FUT8, and MGAT3), other genetic loci have strong influences on the IgG glycosylation patterns. A novel locus on chromosome 1, harboring RUNX3, which encodes for a transcription factor of the runt domain-containing family, is associated with decreased galactosylation. Interestingly, members of the RUNX family are cross-regulated, and RUNX3 is involved in both IgA class switching and B-cell maturation as well as T-cell differentiation and apoptosis. Besides the involvement of glycosyltransferases in IgG glycosylation, we suggest that, due to the impact of variants within RUNX3, potentially mechanisms involved in B-cell activation and T-cell differentiation during the immune response as well as cell migration and invasion involve IgG glycosylation.
Introduction
Glycosylation is among the most abundant post-translational protein modifications (1) and defects therein can lead to severe diseases (2–4), and aberrant glycosylation patterns are likewise associated with different types of cancer (5–12). A complex dynamic network, including genetic and epigenetic factors, regulates the glycosylation pathways, involving various enzymes taking part in these processes (13–15). Whereas most of the enzyme activities, as well as substrate specificity, are supported by in vitro experiments, in vivo experimental validation, taking into account the complex intracellular processes, is still unfeasible (16). To deepen our understanding of glycan biosynthesis and its role in the pathophysiology of many diseases, it is imperative, however, that we identify all factors involved in glycosylation pathways.
The best described glycoprotein so far is immunoglobulin G (IgG) (17). Its glycosylation is thought to have important regulatory functions in the immune response (18) and has been associated with various diseases, such as rheumatoid arthritis (19) and different types of cancers (10, 11). Also within the healthy population, a high interindividual variability in IgG glycosylation patterns is observed, that is, partly attributable to a heritable component (14, 20). With the development of high-throughput glycosylation techniques, it has now become feasible to analyze glycosylation profiles and their relation with genetics at a population level. A first genome-wide association study (GWAS) by Lauc et al. (21)., including 2,247 individuals from four European cohorts (CROATIA-Vis, CROATIA-Korcula, Orkney Complex Disease Study and Northern Swedish Population Health Study), identified four loci encoding glycosyltransferases associated with IgG N-glycans. The authors likewise propose that five additional loci are involved in IgG glycosylation showing that a GWAS can be used to identify genetic loci controlling glycosylation of a single plasma protein (21). They replicated the association of two of their loci, MGAT3 and B4GALT1, in a cohort of MALDI–TOF MS (matrix-assisted laser desorption/ionization time-of-flight mass spectrometry) measured glycan data from the Leiden Longevity Study (LLS) (22). A recent study by Shen et al. (23) used a multiphenotype approach to analyze the genetic background of IgG glycosylation. Here, the authors examine IgG glycan structures measured by ultra-performance liquid chromatography [(UPLC) (24)] in a multivariate way and thereby detect five novel genetic loci that are associated with combinations of IgG glycan traits.
In contrast to UPLC, used by Lauc et al. and Shen et al., the liquid chromatography electrospray mass spectrometry (LC–ESI-MS) method allows for subclass-specific quantification of N-linked glycans. It has been shown that the IgG subclasses, IgG1–IgG4, not only differ in their structure, especially within the hinge region of the glycoprotein, but also in their effector functions (17, 25). Besides differences in the number of disulfide bonds and the length and flexibility of the hinge region, glycosylation profiles also differ between the four IgG subclasses (26). While IgG2 is characterized by a higher degree of core-fucosylation and a low level of galactosylation, IgG1 shows a particularly high level of galactosylation for both neutral and sialylated structures (26). IgG4, on the other hand, shows a high level of core-fucosylated complexes with bisecting N-acetylglucosamine (GlcNAc) (26). How these subclass-specific glycosylation profiles are realized and what their specific contributions are in the pathophysiology of diseases remains largely illusive.
Previous GWAS on serum metabolite levels have indicated that analyzing enzyme substrate-product ratios benefits in gain by power for detecting associated genetic loci over analyzing single metabolites (27). Due to the LC–ESI-MS method, we are able to derive different types of IgG glycan traits to address the genetic background of the IgG glycan synthesis, including within-subclass ratios representing the addition of one monosaccharide at a time, i.e., a single pathway step within IgG glycan synthesis. The same approach was utilized to validate pathway steps inferred by a network-based approach in Benedetti et al. (28). Here, the authors included GWAS data on ratios of IgG glycan structures representing specific, established and newly predicted enzymatic pathway steps. The GWAS data as well as additional laboratory experiments verified the hypotheses drawn from the network analysis. In contrast to Benedetti et al. we extend the list of ratios to all possible one-step pathway steps independent of any prior selection. Furthermore, to challenge the assumption of similar genetic control of glycan biosynthesis for all IgG subclasses (16), we additionally compute subclass-specific IgG glycan traits containing between-subclass ratios and subclass-specific IgG glycan proportions. Furthermore, we include summarizing traits for IgG glycan structures to capture general trends associated with variations in genetic loci as well as additional biologically meaningful glycosylation traits.
By means of a GWAS including these newly derived traits of the LC–ESI-MS measured IgG glycopeptides in our discovery cohort from the KORA F4 study (n = 1,823), and a replication of the results for the same glycan panel in an additional 1,800 samples from LLS, we want to further investigate the underlying genetic control of IgG glycosylation.
Results
We conducted an age- and sex-adjusted genome-wide association scan on 376 glycan traits, including 50 initial measured IgG glycopeptides, 155 summarizing derived traits, 95 within-subclass ratios, 40 between-subclass ratios, and 36 glycan proportions (see Figure 1 for an overview; Table S1 in Supplementary Material; and Section “Materials and Methods” for further details). In our discovery cohort, KORA F4 (n = 1,823, study characteristics in Table S2 in Supplementary Material), 23,277 associations between 1,694 SNPs and 260 traits reached the suggestive significance threshold (p < 5 × 10⁻⁸, Bonferroni corrected), out of which 14,425 associations (848 SNPs and 164 traits) reached genome-wide significance (p < 1 × 10⁻⁹, Bonferroni corrected). Explained variances in the discovery cohort ranged from 1.4 to 14.1% (Table S3 in Supplementary Material).
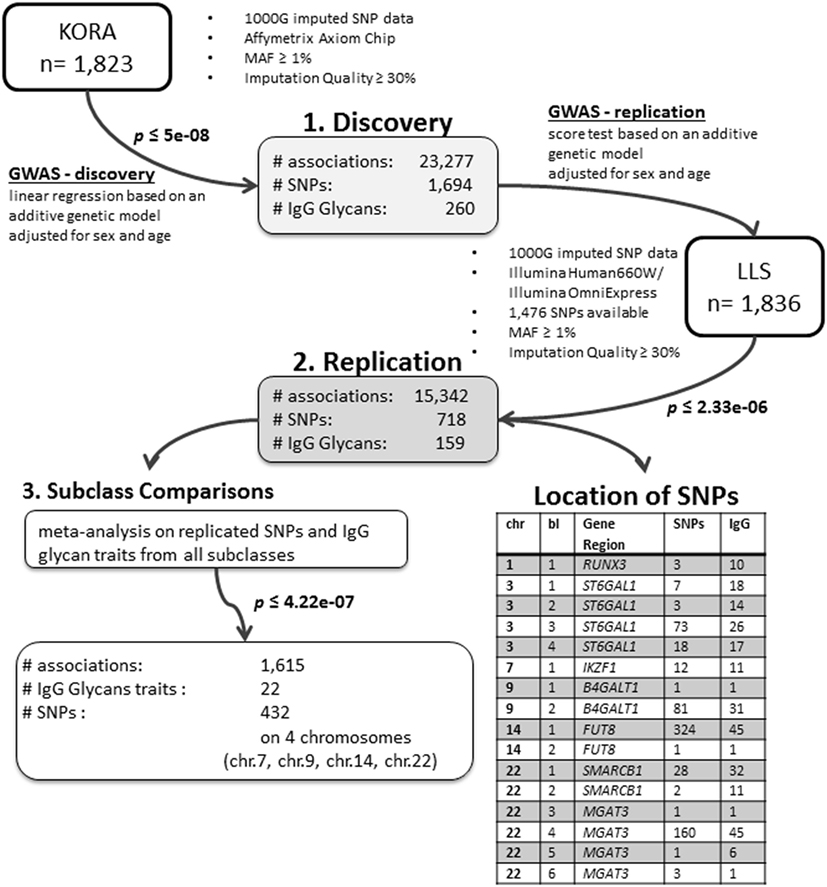
Figure 1. Overview of the study and analyses.
Out of the suggestive 1,694 SNPs in the discovery, 1,476 SNPs were available for replication in the LLS cohort. The list of 1,801 SNP-trait associations excluded from the replication can be seen in Table S4 in Supplementary Material. For the replication, we used in total 21,476 associations between 1,476 SNPs and 253 phenotypic traits and set our Bonferroni-corrected replication significance threshold to 2.33 × 10⁻⁶. From the 21,476 associations available for replication, we replicated 15,342 associations between 159 traits and 718 SNPs, which are displayed in Figure 2 (network representation) and Figure S1 (Manhattan plot) and Table S5 (all replicated results) in Supplementary Material. Table 1 summarizes the mentioned results. This table presents the associated genomic loci with p-values and effect sizes from both cohorts and associated IgG glycan traits and their directions of association.
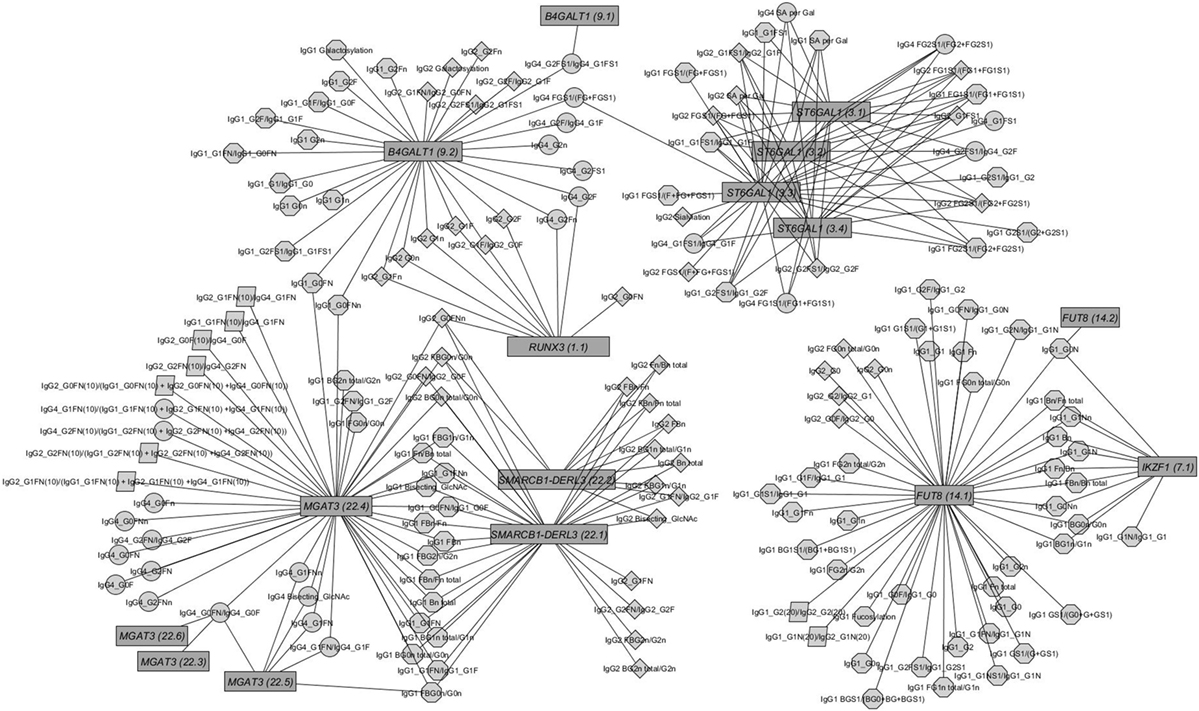
Figure 2. Network of replicated associations immunoglobulin G (IgG) glycan traits (circles) for different subclasses (octagon: IgG1; diamonds: IgG2; circles: IgG4; parallelogram: subclass comparisons) and their associations to the seven replicated loci (edges only for replicated results).
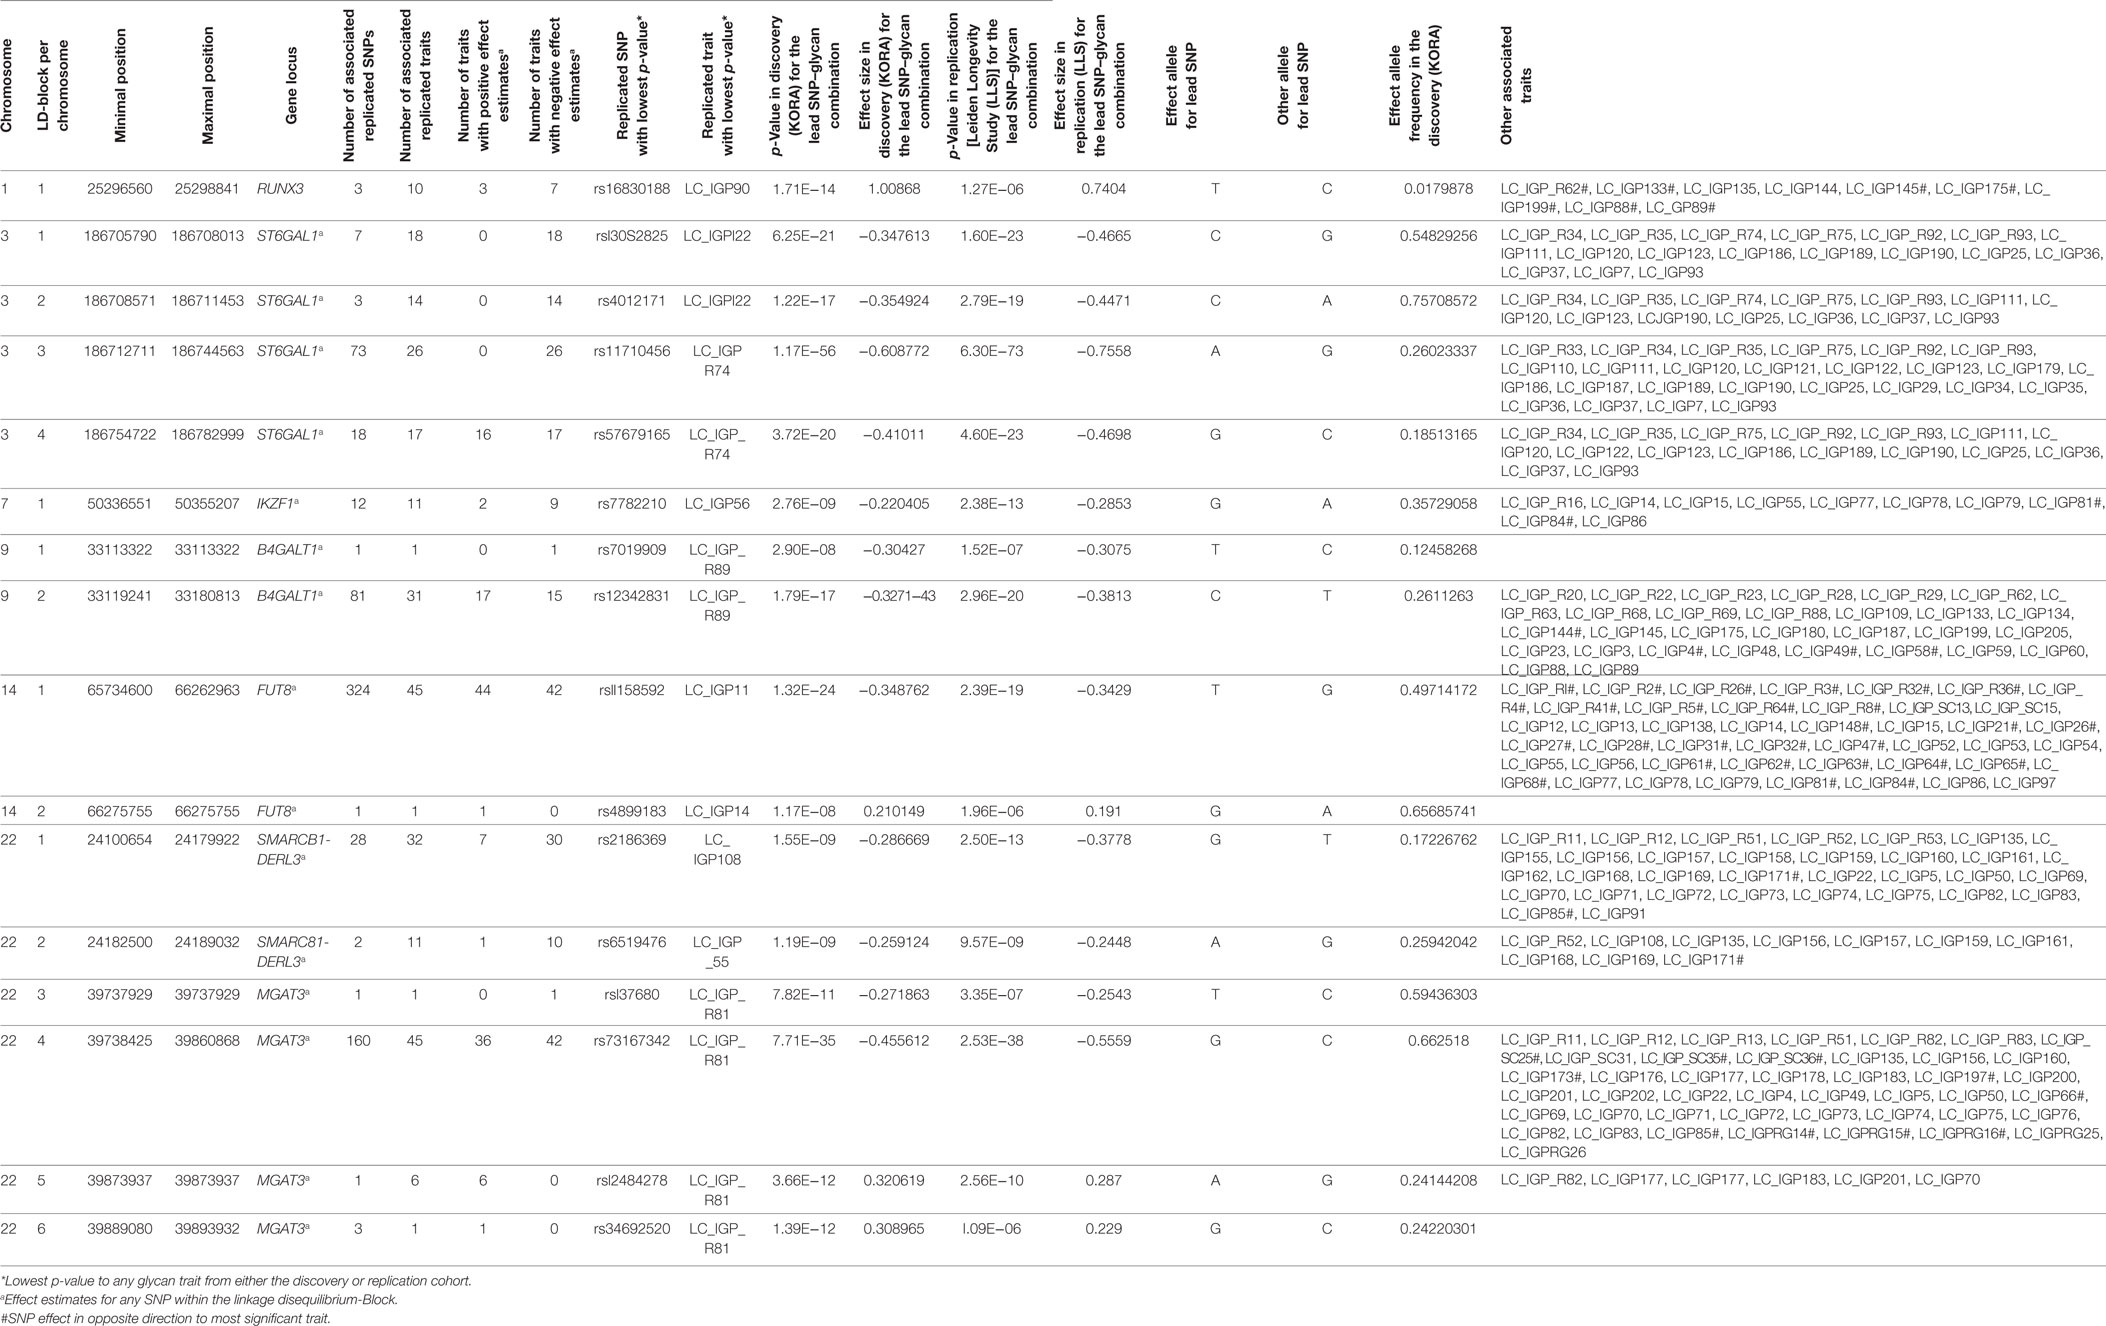
Table 1. Summarized table of replicated associations.
The replicated traits cover all types of glycan traits and all IgG subclasses: 22 (out of 50) initial IgG glycopeptides, 87 (out of 155) summarizing derived traits, 39 (out of 95) within-subclass ratios, 6 (out of 40) between-subclass ratios, and 5 (out of 36) glycan proportions. Effects for all replicated associations are in the same direction and of similar magnitude as in the discovery cohort (part 2 in Figure 1).
The replicated SNPs are spread over seven independent loci on six chromosomes [chromosome 1: 25,296,560–25,298,841 (6,809 bp upstream of RUNX3), chromosome 3: 186,705,790–186,782,999 (ST6GAL1), chromosome 7: 50,336,551–50,355,207 (IKZF1), chromosome 9: 33,113,322–33,180,813 (B4GALT1), chromosome 14: 65,734,600–66,275,755 (FUT8), chromosome 22: 24,100,654–24,189,032 (SMARCB1/DERL3), and chromosome 22: 39,737,929–39,893,932 (MGAT3)]. An overview of the associated traits per locus can be found in Table S8 in Supplementary Material and is shortly given in Table 1. With our study, we can confirm six of the loci associated with UPLC-measured IgG glycan traits (21, 23) being associated with LC–ESI-MS-measured IgG glycan structures in a comparable way (see the Supplementary note and Table S13 in Supplementary Material for additional details). In addition, we detect a novel locus at RUNX3 (chromosome 1p36.11).
On chromosome 1, three SNPs (rs16830188, rs10903120, and rs11270291) have significant impact on glycan traits. A multivariate analysis in KORA F4 reveals that the three SNPs describe one locus, with rs16830188 being the most influential SNP (see Table S10 in Supplementary Material). These SNPs are in high linkage disequilibrium (LD) (r2 ≥ 0.5) and are flanking the gene RUNX3 (see Figure S6A in Supplementary Material). The T-allele of the most significant marker for all associated glycan traits, rs16830188, is associated with an increase in agalactosylated structures and a decrease in mono- and digalactosylated structures. In addition, this SNP has the largest effect sizes for all associated glycan traits and explains 1.4 to 3.5% of the variance of the associated traits (see Table S3 in Supplementary Material). The genetic variants within RUNX3 especially affect IgG glycan traits from IgG2 and IgG4, illustrating the merit of the subclass-specific analysis.
In contrast to UPLC, LC–ESI-MS is suited for quantifying subclass-specific IgG glycan structures and thus for analyzing within-subclass ratios that represent single pathway steps in IgG glycan synthesis, as well as between-subclass ratios and glycan proportions. Using QQ-plots to compare the associations obtained with initial IgG glycan traits versus within-subclass ratios, we clearly demonstrate a gain in power for the latter analytical approach (Figure 3). These ratios even outperform the summarizing derived traits. Subclass specificity assessed by glycan proportions and between-subclass ratios perform almost as good as initial measured IgG glycopeptides, except for associations with very low p-values (1 × 10–18) (Figure S3A in Supplementary Material). In addition, we performed meta-analyses on replicated SNP–glycan associations of the two cohorts and statistically compared the strength of the associations of the same glycan trait for different subclasses.
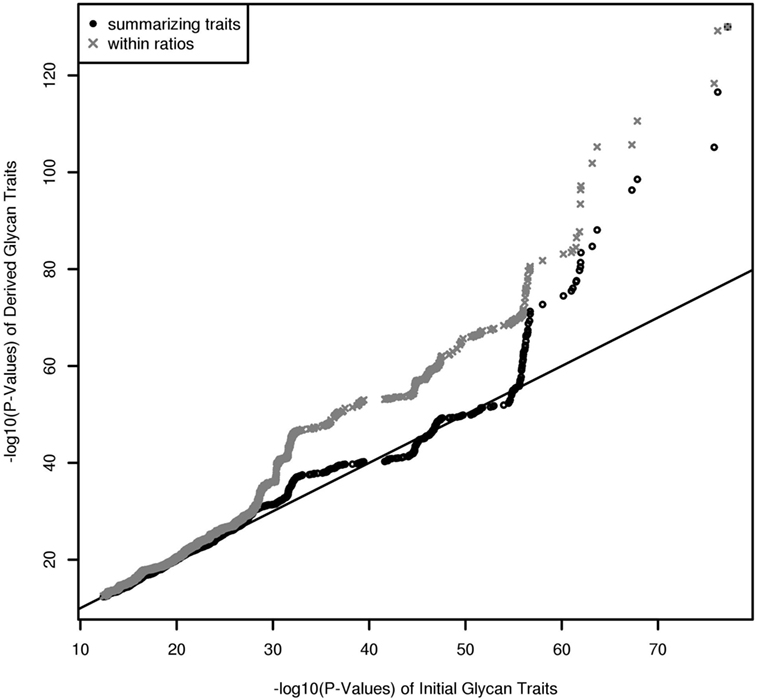
Figure 3. QQ-Plot (−log10(p-values)) for comparison of the results from initial glycopeptide traits and from within-subclass ratios and summarizing derived traits (results are obtained from a Meta-Analysis of the Replicated Associations).
Except for four IgG glycan ratios (IgG2_G2/IgG2_G1, IgG1_G2N/IgG1_G1N, IgG1_G1NS1/IgG1_G1N, and IgG1_G1S1/IgG1_G1), the associations of within-subclass ratios support the known functions of the glycosyltransferases within the IgG glycan synthesis across the subclasses (see Figures S4A–F in Supplementary Material). Ratios of monogalactosylated over agalactosylated structures are associated with SNPs within the galactosyltransferase B4GALT1 locus; ratios of structures with bisecting GlcNAc over structures without bisecting GlcNAc associate with SNPs within the N-acetylglucosaminyltransferase MGAT3 locus; ratios of sialylated over non-sialylated glycan traits associate to variants within the sialyltransferase ST6GAL1 locus and ratios of fucosylated over non-fucosylated structures associate with fucosyltransferase FUT8.
Besides known pathway steps in IgG glycan synthesis and inferred reactions from network analyses (28), the results hint at hitherto unknown enzymatic reaction steps catalyzed by the known glycosyltransferases, e.g., associations between variants of FUT8 and IgG1_G0FN/IgG1_G0N.
Subclass comparisons of meta-analyzed data revealed that 22 glycan traits are significantly different associated with 432 SNPs on 4 chromosomes (Table S7 in Supplementary Material contains all results from the statistical tests, an overview is given in Table S8 in Supplementary Material and, graphically, in Figures S2 and S4F in Supplementary Material). In addition, as stated before, associations to five between-subclass ratios and six glycan proportions were replicated. Taken together, the major difference of IgG glycan traits on different subclasses lies in bisecting and fucosylation. We found 13 IgG glycans to be significantly different associated with SNPs at FUT8 between IgG1 and IgG2. In addition, the neutral glycan traits G0n, G1n, and G2n showed significantly different behaviors between IgG1 and IgG2 as well as between IgG2 and IgG4 as the T-allele of the strongest SNP in this locus (FUT8), rs11158592, was significantly negative associated with these traits in IgG1 and IgG2 but not in IgG4.
Furthermore, for the association between SNPs within MGAT3 and IgG glycan traits, we detected two traits being significantly different between IgG1 and IgG2, 10 glycan traits differing between IgG2 and IgG4, and only one glycan trait being different for IgG1 and IgG4 (G1FN). Almost all of the significantly differing glycan structures contain a bisecting GlcNAc. In addition, within-subclass ratios representing the addition of a GlcNAc (G1FN/G1F, G2FN/G2F, and G0FN/G0F) are significantly differently associated with the MGAT3 locus for the IgG subclasses.
Discussion
Our study attempts to deepen the knowledge of genetic influence on IgG glycosylation and to disclose possible subclass specificity in the synthesis pathways. We used the LC–ESI-MS-measured glycopeptides in both the discovery and replication cohort. In contrast to the UPLC and MALDI–TOF MS data used in Ref. (21, 23), we quantify subclass-specific attached N-glycans, and the traits are comparable between the discovery and replication study.
With the new analytical method, LC–ESI-MS, we confirmed the association of IgG glycosylation to six of the loci previously identified with UPLC (21, 23) and, moreover, detect a novel locus, RUNX3, on chromosome 1p36.11. Unfortunately, we could not verify any of the additional proposed loci proposed by Shen et al. (23), probably due to power reasons and difference in statistical methodology (multivariate vs univariate approach). In addition, it has to be highlighted, however, that IgG glycan traits originating from the two analytical methods cannot be combined straightforwardly (see the Supplementary note and Table S10 in Supplementary Material).
RUNX3 encodes for a transcription factor of the runt domain-containing family. It is located on chromosome 1 and three variants within this locus are associated with 10 phenotypic traits. All three SNPs are in high LD to each other (r2 ≥ 0.5). RUNX3 and other transcription factors of the runt-family have a large impact on hematopoiesis (29). Methylation of RUNX3 promoters has an impact on several diseases (30–32), as well as on inflammation and immune response (33–35). In particular, RUNX3 could be linked to B-cell maturation (36).
In addition, the transcription factor has been shown to contribute greatly to the regulation of apoptosis in cancer metastasis in general (37) and in the differentiation of T-cells to CD4+ and CD8+ T-cells in particular (38–41). While IgG is secreted by differentiated B-cells, it nonetheless has been shown that IgG1 glycosylation is dependent on B cell stimuli during their differentiation. These stimuli include T-cell derived cytokines and metabolites (42). By influencing T-cell differentiation, RUNX3 could likely indirectly influence the glycosylation of antibodies produced by B-cells. Thus, T-cell differentiation may stimulate B-cell activation and influence the glycosylation of their secreted antibodies.
The opposing effect directions for structures with and without attached galactose lead to the hypothesis that the RUNX3 locus plays an important role in galactosylation. There is a striking overlap between glycan traits associated with the RUNX3 locus and the B4GALT1 locus, supporting this hypothesis. Interestingly, a similar feature as for RUNX3, namely altering the differentiation process of T-cells, is attributed to the enzymes of the Ikaros family including IKZF1 (43, 44). However, in our study no glycan traits overlapped for the two loci. Potentially, the two transcription factors regulate different glycosyltransferases.
While the other six loci have been described before in Ref. (21, 23) to be associated with N-glycan biosynthesis, variants in the RUNX3 locus are novel candidates from our study. Since only glycan traits from less abundant IgG2 (IgG2/3 in KORA) and IgG4 were associated (17), it is reasonable to assume that the reason why the locus on chromosome 1 could not be detected before by the UPLC is because this technique does not provide information about N-glycosylation that is subclass specific, but instead results in total IgG N-glycans quantification and thus, a larger sample size may have been needed for UPLC data. Indeed, subclass-specific analyses reveal this association presumably due to higher power for the subclass-specific associations.
The IgG glycan traits based upon the two analytical methods, UPLC and LC–ESI-MS are not entirely comparable. A benefit of the LC–ESI-MS method is the subclass-specific IgG glycosylation measurements, with the drawback of non-separable IgG2 and IgG3 in the discovery cohort, which is due to the identical peptide moieties (E293EQFNSTFR301) of their tryptic Fc glycopeptides in Caucasians (45). Nevertheless, we were able to compare SNP associations for similar glycan traits between the subclasses and examine the IgG glycan synthesis separately for each subclass.
The within-subclass ratios representing enzymatic pathway steps are mainly associated with the assumed genetic loci coding for known glycosyltransferases (16) (see Figures S4C–E in Supplementary Material). These traits contain not only well-known enzymatic reactions within IgG glycan synthesis (Figure S4A in Supplementary Material), inferred reactions based on network analysis as in Ref. (28) but also all possible ratios representing the addition of one monosaccharide at a time (Figure S4B in Supplementary Material). Comparing the results from the known enzymatic steps and other possible one-step pathway relations suggests the existence of several of the latter (see Figure S3B in Supplementary Material), even in addition to the pathway steps supposed by Benedetti et al. (28). However, few of the within-subclass ratios are associated with variants from different genetic loci (see Figure 2).
The comparison of IgG glycan traits across subclasses leads to the hypothesis that fucosylation catalyzed by Fut8 and the addition of bisecting GlcNAc supported by Mgat3 is realized to different extent between the IgG subclasses. Fucosylation seems to be especially different between IgG1 and IgG2 while bisection is mostly differing between IgG2 and IgG4. For more details, see the supplementary note in Data Sheet S1 Supplementary Material. Still, functional studies are needed to elucidate the underlying mechanisms, especially with regard to subclass specificity. Indeed, it has been shown that specific subclasses and their attached glycan structure are highly relevant as biomarkers for diseases and even more when used in antibody therapy (46–50).
The obtained results help to broaden our knowledge on the pathway steps of IgG glycan synthesis in general, and, specifically the differences for each IgG subclass. While the initial glycan traits outperform the between-subclass ratios and glycan proportions, the findings from comparing SNP–glycan associations across subtypes (Table S5 and Figures S2 and S4F in Supplementary Material) hint at altered glycan synthesis for the different IgG subclasses.
Conclusion
Summarizing, our analysis yields 159 phenotypic traits based on LC–ESI-MS measured IgG glycopeptide structures being significantly associated with 718 genetic variants on seven distinct loci. For UPLC-measured IgG glycans, six out of the seven loci have been shown to influence IgG glycosylation (21, 23). The new gene found to be associated with LC–ESI-MS measured IgG glycopeptide traits is RUNX3 on chromosome 1. Ratios of IgG glycans representing enzymatic pathway steps within the N-glycan biosynthesis are predominantly associated with genetic variants within regions of a priori suggested genes encoding for known glycosyltransferases. Subclass comparisons point to specific behavior of variants covering the MGAT3 locus on chromosome 22 and the FUT8 locus on chromosome 14.
Materials and Methods
Discovery Cohort—KORA F4
The KORA F4 study, conducted in 2006–2008, is an independent population-based health survey (51) and was performed as a follow-up of the KORA S4 study (1999–2001) (52). The study followed the recommendations of the Declaration of Helsinki and was approved by the local ethical committees. In the F4 follow-up, a total of 3,080 persons participated of whom 1,823 individuals were available for the genome-wide association scan of IgG glycopeptides traits. Genotyping was realized with the Affymetrix Axiom Chip (53, 54). Prephasing was done by SHAPEIT v2 and imputation was carried out by IMPUTE v2.3.0 using 1000 Genome (phase 1 integrated haplotypes CEU) as a reference panel. SNPs were non-monomorphic and filtered based on their call rate (98%), their minor allele frequency (>1%) and were excluded if they significantly aberrated from the Hardy–Weinberg Equilibrium (p < 5 × 10⁻⁶). All individuals were of European ancestry and samples with mismatching phenotypic and genetic gender were excluded. These criteria led to a total of 18,185,628 SNPs. After the analysis, we additionally excluded SNPs with imputation quality defined by IMPUTE lower than 30%.
A total of 1,823 individuals from the KORA F4 cohort were used for discovery. The samples include 935 women and 888 men ranging from 32 to 81 years, with mean age of 62.56 years (SD = 9.89) (see Table S2 in Supplementary Material for more details).
Replication Cohort—LLS
The LLS followed the recommendations of the Declaration of Helsinki, the study protocol was approved by the local medical ethical committee and good clinical practice guidelines were maintained.
The LLS examined long-lived siblings of European descent together with their offspring and the partners of the offspring. Families with at least two long-lived siblings (age ≥89 for man, age ≥91 for women) were recruited. This age category represented <0.5% of the Dutch population in 2001 (22). In total, 944 long-lived individuals (age range 89–104), 1,671 of their offspring (age range 39–81), and 744 partners thereof (60 years, 36–79) were included (55). DNA genotyping for LLS was performed at baseline as described in detail in Ref. (56) with the Illumina Human660W and Illumina OmniExpress arrays. Genotype imputation was performed using IMPUTE v2.2 (beta) with the 1000 Genome (phase 1 integreated haplotypes CEU) as reference panel. Quality control included SNP-wise call rate (95%), their minor allele frequency (>1%) and derivation from the Hardy–Weinberg equilibrium (p < 1 × 10⁻⁴). As for KORA F4, we excluded SNPs with imputation quality lower than 30% as provided by IMPUTE. For the current genome-wide association analysis with IgG glycopeptide measurements, 1,836 samples of offspring and their partners were available.
Measurement of IgG Glycosylation
IgG Isolation
As described in Ref. (20), IgG was isolated from plasma by affinity chromatography using 96-well protein G monolithic plates (BIA Separations, Ljubljana, Slovenia) for KORA F4 samples and Protein A Sepharose Fast Flow beads (GE Healthcare, Uppsala, Sweden) for the LLS samples. For the KORA F4 sample analysis, 100 µL of plasma was first diluted 10× with 1× PBS and then filtered through 0.45 µm GHP filter plate (Pall Corporation, Ann Arbor, MI, USA). Following, it was applied to the protein plate and instantly washed. With 1 mL of 0.1 M formic acid (Merck, Darmstadt, Germany), the IgGs were eluted from the protein plate and neutralized with 1 M ammonium bicarbonate (Acros Organics, NJ, USA). For the LLS sample analysis, 2 µL of plasma was incubated together with 15 µL of Protein A beads in a total volume of approximately 180 µL PBS in 96-well filter plates. The samples were then washed thrice with PBS and thrice with MilliQ-purified water, before elution with 0.1 M formic acid (Fluka, Steinheim, Germany). The samples were subsequently dried in a vacuum concentrator for 2 h at 60°C.
Due to the different IgG isolation procedures for KORA F4 and LLS, we obtained subclass-specific measurements for IgG1, IgG2/IgG3, and IgG4 in KORA F4 and IgG1, IgG2, and IgG4 in LLS. IgG3 is less abundant compared with IgG2 and we thus denote the IgG2/IgG3 mixture in KORA as IgG2 only.
IgG Tryptic Digestion and Purification
Isolated IgG (approximately 25 µg) was resuspended in 40 µL of ammonium bicarbonate containing 200 ng of trypsin (Worthington, USA for KORA F4 samples; sequencing grade modified trypsin, Promega, Madison, WI, USA for LLS samples) and digested at 37°C over night. The KORA F4 samples underwent an additional purification step: resulting tryptic glycopeptides were purified by reverse phase solid phase extraction using Chromabond C18 ec beads (Macherey-Nagel, Germany). C18 beads were activated by 80% acetonitrile (ACN), 0.1% trifluoroacetic acid (TFA) (Sigma-Aldrich, USA) and conditioned with 0.1% TFA. Tryptic digest was diluted 10× with 0.1% TFA and loaded onto C18 beads. Beads were washed with 0.1% TFA and glycopeptides eluted with 20% ACN and 0.1% TFA. Tryptic glycopeptides were dried by vacuum centrifugation and dissolved in 20 µL of ultrapure water.
LC–ESI-MS/MS Analysis of IgG Tryptic Glycopeptides
For the KORA F4 study, tryptic glycopeptides were analyzed on nanoACQUITY UPLC system (Waters, USA) coupled to Compact mass spectrometer (Bruker Daltonics, Germany) via a capillary electrophoresis electrospray (ESI) interface (Agilent Technologies, Santa Clara, CA, USA). A sheath liquid (50% isopropanol, 20% proprionic acid) was pumped at a flow rate of 2 µL/min. Nine µL of IgG tryptic glycopeptides was loaded on Acclaim PepMap100 C8 (5 mm × 300 μm i.d.) trap column. The glycopeptides were washed 1 min with 0.1% TFA (solvent A) at a flow rate of 40 µL/min and separated on an HALO C18 nanoLC column (50 mm × 75 μm i.d., 2.7 µm HALO fused core particles) (Advanced Materials Technology, USA) at 30°C, using a 3.5 min gradient from 19 to 25% solvent B (80% ACN) at 1 µL/min flow rate. Mass spectra were acquired from 500 to 2,000 m/z units with two averages at a frequency of 0.5 Hz. The quadrupole ion energy and collision energy were set to 4 eV. NanoACQUITY UPLC system was operated under MassLynx software version 4.1 and the Bruker micrOTOF-Q was operated under HyStar software, version 3.2. Data extraction was performed using an in-house Python script. In short, data were m/z recalibrated based on a subset of hand-picked analytes having a high signal-to-noise ratio and the expected isotopic distribution. Intensities for the top four isotopologues were extracted using a 10 ppm m/z window. Retention times were aligned toward the cohort median and retention time bins were determined for the analytes. All of the signals belonging to a single analyte for every sample were summed up.
For the LLS study, the IgG glycopeptide samples were analysed using an Ultimate 3000 RSLCnano liquid chromatography system (Dionex, Sunnyvale, CA, USA) coupled to a Maxis Impact quadrupole time-of-flight-MS (micOTOF-Q, Bruker Daltonics), as described previously (57). Samples were run over a trap column (Acclaim PepMap100 C18, 5 mm × 300 µm i.d., Dionex, Sunnyvale, CA, USA) and a separation column (Ascentis Express C18 nanoLC, 50 mm× 75 µm i.d., 2.7 µm HALO fused core particles; Supelco, Bellefonte, PA, USA). A linear gradient was used with a flow rate of 0.9 µL/min, with solvent A consisting of 0.1% TFA and B of 95% ACN: t = 0, 3% solvent B; t = 2, 6%; t = 4.5, 18%; t = 5, 30%; t = 7, 30%; t = 8, 0%; t = 11, 0%. The LC was coupled to the MS via a sheath-flow electrospray (ESI) interface (Agilent Technologies, Santa Clara, CA, USA). A sheath flow, consisting of 50% isopropanol, 20% proprionic acid, and 30% MilliQ-purified water, was applied with a flow rate of 2 µL/min, along with nitrogen gas at 4 L/min. Mass spectra were acquired within an m/z range of 600–2,000 at a frequency of 0.5 Hz. LC–MS data were examined and calibrated using Compass Data Analysis 4.2 (Bruker Daltonics), and retention time alignment was done using Msalign. In-house developed software Xtractor 2D (see http://ms-utils.org/Xtractor/) was used to extract signal intensity data. For each type of glycopeptide, the background-subtracted signal intensity of the first three isotopic peaks in both 2+ and 3+ charge state were summed.
For the following analyses we used the most prominent measureable 20 glycopeptides in subclasses IgG1 and IgG2 (a mixture of IgG2 and IgG3 in KORA F4, IgG2 only in LLS) and the most prominent and identifiable 10 fucosylated glycopeptides in IgG4, since peaks belonging to afucosylated IgG4 glycans overlapped with those of earlier eluting and much higher abundant IgG1 glycans.
Preprocessing of IgG Glycopeptides
Glycosylation is highly differing between individuals. Absolute values of peaks obtained by the LC–ESI-MS method are not comparable. We normalize glycopeptides per subclass by total area normalization as defined in the R-package “glycanr” (R-package version 0.3.0) (58), taking their relative abundance within subclasses as phenotypes and input variables for ratios. Batch correction per subclass was performed with the ComBat (59) algorithm of the R-package “sva” (R-package version 3.14.0) (60). To meet the assumptions for ComBat batch correction, samples were log-transformed before applying the algorithm and exponentiated afterward to regain the original scale. Derived traits have been computed from batch corrected glycan measurements.
Summarizing derived traits per subclass were computed as described in S1 using the ildt function from glycanr package (58). Ratios within subclasses were defined as product over substrate for all possible one-step reactions in the pathways, based on the assumption that single sugar molecules can only be added and not removed (61). Ratios between subclasses were calculated as described in Data Sheet S1 in Supplementary Material. Here, we do not assume an actual product-substrate relationship. For ratios including glycopeptides traits from IgG4, we renormalized the glycopeptide traits on all corresponding fucosylated traits only. All ratios were log-transformed.
For the glycan proportions, i.e., normalization per specific glycopeptide trait in total Fc IgG glycopeptides, we also used the total area normalized traits as input. We only calculated per glycan normalization for core-fucosylated glycopeptides as others are not available for IgG4. In addition, we computed the sums per IgG subclass as ratios of these sums. Again, the ratios were log-transformed before any further analyses. For the discovery cohort, characteristics of all IgG glycan traits can be found in Table S2 in Supplementary Material.
IgG Glycan Traits
With LC–ESI-MS, 50 initial glycopeptides from different IgG subclasses were measured and quantified. For IgG1 and IgG2 (IgG2/3 in KORA), 20 initial glycopeptides are available, for IgG4, only glycopeptides with core-fucosylation (10 glycopeptides) were measured.
From these 50 initial glycopeptides, summarizing traits per subclass were derived [as seen in Table S1 in Supplementary Material and in Ref. (24)], including, e.g., “Percentage of IgG1 Fucosylation” (sum of all fucosylated glycan traits in IgG) or the “ratio of afucosylated monosialylated structures with and without bisecting GlcNAc in total IgG1 glycans” (the ratio of sum of afucosylated monosialylated structures with bisecting GlcNAcs over the sum of afucosylated monosialylated structures without bisecting GlcNAcs in total IgG1 glycan traits).
In addition, we included all one-step pathway ratios of product over substrate possible within each subclass, e.g., IgG1_G0F/IgG1_G0 (see Figure S4B in Supplementary Material). The ratios describe reactions that are already known to be part of the IgG glycosylation biosynthesis as well as reactions that can be derived on the assumption of the addition of one monosaccharide at a time, but which are hitherto unknown.
To analyze differing glycosylation pathways for the subclasses, we included ratios of glycopeptides across subclasses in our analysis, e.g., IgG1_G0/IgG2_G0. Glycopeptide traits being used for ratios with IgG4 were additionally normalized on their respective fucosylated glycopeptides only.
For detecting genetic influence on the abundances of the IgG subclasses, we additionally normalized the traits “per glycan” [e.g., IgG1_G0F/(IgG1_G0F + IgG2_G0F + IgG4_G0F)] and included the newly normalized glycopeptides, the subclass-specific sums, and ratios thereof in the analyses. These traits describe the relative abundance of the attached glycopeptide structure for the specific subclass.
All traits declared as “ratios” were log-transformed before any statistical analysis.
For a complete list of all 376 phenotypic traits, please see Table S1 in Supplementary Material.
Genome-Wide Association Analysis and Meta-analysis
We performed a genome-wide association analysis in the discovery cohort, KORA F4. First, each phenotype (see “IgG glycan traits” for explanation) was adjusted for sex and age and regression residuals were inverse normal rank transformed to assure normal distribution. The transformed residuals were used for association analysis in a linear model performed with snptest v2.5.1 software (62) using an additive genetic model.
The threshold determining the suggestive SNPs was set to 5 × 10⁻⁸. Given that we performed 376 different GWASs, the genome-wide significant threshold for the discovery was additionally adjusted for the number of initially measured glycopeptide traits and thus set to 1 × 10⁻⁹ (5 × 10⁻⁸/50 initially measured glycopeptides). All derived traits and different ratios are a function of initially measured glycan traits and are therefore dependent on these traits. We acknowledge that there might be less independent traits within initially measured glycans, but we decided to be more conservative and correct for 50 tests.
For the LLS cohort, we computed linear regression models for the suggestive associations from the discovery only. Similar to the discovery cohort, each trait was adjusted for sex and age first, and the obtained residuals were normally rank transformed. For LLS, a score test including family information (63) was conducted with the C++ program QTassoc [see http://www.lumc.nl/uh, under GWAS Software (63)]. The Bonferroni-corrected replication threshold was set to 2.33 × 10⁻⁶ (0.05/number of replicated associations).
For all replicated trait-SNP associations (p < 2.33 × 10⁻⁶), we additionally performed an inverse variance-weighted fixed effects meta-analysis on the summary statistics of the two cohorts. The meta-analysis was performed using the software METAL (64). We included similar traits for all three IgG subclasses. Based on the results from the meta-analysis, we performed t-tests to determine statistical significant differences between the same traits for the different IgG subclasses. In the subclass comparisons, we included all glycopeptide traits being available in at least two of the subclasses. We then analyzed parallels between the significantly different glycopeptide traits for the IgG subclasses and the replicated associations for ratios of IgG glycopeptides from different subclasses.
Relation of Replicated SNPs
For all replicated SNPs, we obtain the information on their LD from SNiPA (65) (last update version from November 2015, setting: GRCh 37, 1000 Genomes Phase 3 v5, European, Ensembl82). As for some variants, LD information is missing, we next generated LD-blocks of replicated markers. All variants in LD with r2 ≥ 0.5 were assigned to the same LD-block. Hereby, SNPs could be assigned to more than one LD-block. We then merged LD-blocks that were overlapping position-wise (see Figures S5A–F in Supplementary Material). This step takes care of SNPs for which no LD information was available but which are still situated in a highly heritable genetic region. The remaining (now larger) LD blocks can thus be clearly separated by positions on the chromosome and can be more easily observed by specific regional plots (see Figure S6 in Supplementary Material). This approach helps to summarize variants within loci. However, it does not account for functional similarity between markers or their relevance on IgG glycopeptide traits.
Information on the position of SNPs and their genetic features are obtained from the UCSC Genome Browser on Human [February 2009 (GRCh37/hg19)] (66).
For replicated SNPs on chromosome 1, we additionally performed multivariate linear models with the data from the discovery cohort, KORA F4, and settings as in the original model. For associated glycopeptide traits, models included one up to all three of the replicated SNPs on chromosome 1. We compared the significance of the single SNPs in the joint models as well as the added explained variance of the glycan traits.
Ethics Statement
The KORA study was carried out in accordance with the recommendations of good clinical practice guidelines and the guidelines of the KORA study group, with written informed consent from all subjects. All subjects gave written informed consent in accordance with the Declaration of Helsinki. The protocol was approved by the KORA study group. The LLS study was carried out in accordance with the recommendations of good clinical practice guidelines and the guidelines of the medical ethics committee of the Leiden University Medical Center, with written informed consent from all subjects. All subjects gave written informed consent in accordance with the Declaration of Helsinki. The protocol was approved by the medical ethics committee of the Leiden University Medical Center.
Author Contributions
Performed wet lab experiments and data extraction: JŠ, IT-A, and GR, and RP. Performed data cleaning: LK, FV, EA, AW, JD, and MB. Performed GWAS: AW and EA. Analyzed the data: AW, EA, LK, JŠ, IT-A, GR, and EB. Contributed data/reagents/material/analysis tools: MB, JD, DH, RP, HG, JK, KS, AP, TM, MW, PS, GL, and CG. Supervised the research: M, CH, PS, GL, and CG. Wrote the manuscript: AW, EA, and LK. All the authors discussed the results and reviewed the final manuscript.
Conflict of Interest Statement
GL is the founder and owner of Genos Ltd., a private research organization that specializes in high-throughput glycomic analysis and has several patents in this field. LK, JŠ, IT-A, GR, and FV are employees of Genos Ltd.
Acknowledgments
The KORA study was initiated and financed by the Helmholtz Zentrum München—German Research Center for Environmental Health, which is funded by the German Federal Ministry of Education and Research (BMBF) and by the State of Bavaria. Furthermore, KORA research was supported within the Munich Center of Health Sciences (MC-Health), Ludwig-Maximilians-Universität, as part of LMUinnovativ. This study was supported by the German Center for Diabetes Research (DZD e.V.). For this publication, biosamples from the KORA Biobank as part of the Joint Biobank Munich have been used.
Funding
Glycan analysis was supported in part by European Community’s Seventh Framework Programme HighGlycan (contract #278535), MIMOmics (contract #305280), HTP-GlycoMet (contract #324400) grants and Croatian National Science foundation project EpiGlycoIgG (contract #3361), as well as the funding for the Croatian National Center of Research Excellence in Personalized Healthcare. The Leiden Longevity Study has received funding from the European Union’s Seventh Framework Programme (FP7/2007–2011) under grant agreement no. 259679. This study was supported by a grant from the Innovation-Oriented Research Program on Genomics (SenterNovem IGE05007), the Center for Medical Systems Biology, and the Netherlands Consortium for Healthy Aging (grant 050-060-810), all in the framework of the Netherlands Genomics Initiative, Netherlands Organization for Scientific Research (NWO), Unilever Colworth and by BBMRI-NL, a Research Infrastructure financed by the Dutch government (NWO 184.021.007). JD is financially supported by the Alexander von Humboldt Foundation.
Supplementary Material
The Supplementary Material for this article can be found online at http://www.frontiersin.org/articles/10.3389/fimmu.2018.00277/full#Supplementary-Material.
Figure S1. Mirrored Manhattan plot of all suggestive (p < 5 × 10⁻⁸) and replicated (p < 2.33 × 10⁻⁶) SNPs with their minimal p-values for any association.
Figure S2. Network of significantly different associated IgG glycopeptide traits and SNPs summarized by linkage disequilibrium-blocks IgG glycan traits (circles) for different subclass comparisons (red: IgG1 vs. IgG4; light green: IgG1 vs. IgG2; blue: IgG2 vs. IgG4; purple: glycan proportions for IgG4; and green: glycan proportions for IgG2) and their associations to the replicated loci (edges only for replicated results).
Figure S3. (A) QQ-Plot (−log10(p-values)) for comparison of results from initial glycopeptide traits and from between-subclass ratios and glycan proportions (results are obtained from the discovery cohort only). (B) QQ-Plot (−log10(p-values)) for comparison of results from all known pathway steps and additionally suggested pathway steps (known relations include associations as displayed in Figures S4; predicted relation includes associations represented with dashed lines in Figures S4; results are obtained from the meta-analysis).
Figure S4. Enzymatic pathway steps in IgG glycosylation. (Colors indicate the enzymes responsible for the attachment of monosaccharides.) (A) Known enzymatic pathway steps in IgG glycosylation (the glycosylation pathways are assumed to be the same for all IgG subclasses). (B) Known and suggested (dashed) one-step enzymatic pathway steps in IgG glycosylation (the glycosylation pathways are assumed to be the same for all IgG subclasses). (C) Replicated associations for IgG1 within the IgG glycan synthesis. (D) Replicated associations for IgG2 (IgG2/3) within the IgG glycan synthesis. (E) Replicated associations for IgG4 within the IgG glycan synthesis.(F) Replicated associations for between-subclass ratios and glycan proportions as well as significant subclass comparisons based on meta-analyzed data.
Figure S5. (A–G) Representation of the linkage disequilibrium-blocks summarizing the replicated SNPs for each gene region. (A) RUNX3 (chr.1), (B) ST6GAL1 (chr.3), (C) IKZF1 (chr.7), (D) B4GALT1 (chr.9), (E) FUT8 (chr.14), (F) SMARCB1-DERL3 (chr.22), and (G) MGAT3 (chr.22).
Figure S6. (A–G) Regional association plots for SNPs and their lowest p-values for any association for each linkage disequilibrium (LD)-block (only if LD information was available). (A) RUNX3 (chr.1), LD-block 1, [(B), i–iv] ST6GAL1 (chr.3), LD-block 1–LD-block 4, (C) IKZF1 (chr.7), LD-block 1, [(D) i, ii] B4GALT1 (chr.9), LD-block 1, and LD-block 2, [(E), i, ii] FUT8 (chr.14), LD-block 1, and LD-block 2, [(F), i, ii] SMARCB1-DERL3 (chr.22), LD-block 1, and LD-block 2, and [(G), i–iii] MGAT3 (chr.22), LD-block 2–LD-block 4.
Table S1. Description of immunoglobulin G (IgG) glycopeptide traits.
Table S2. Study characteristics of the discovery cohort KORA.
Table S3. Explained variance of the immunoglobulin G (IgG) glycopeptide traits by the single SNPs in KORA.
Table S4. List of association in KORA F4 to SNPs excluded for the replication due to unavailability in Leiden Longevity Study.
Table S5. List of all replicated associations.
Table S6. List of replicated phenotypic traits for each gene region.
Table S7. Complete list of results for subclass comparisons of immunoglobulin G (IgG) glycopeptide traits.
Table S8. Overview of results from subclass comparisons of immunoglobulin G (IgG) glycopeptide traits.
Table S9. Results from joint linear models for replicated SNPs on chromosome 1.
Table S10. Comparison of ultra-performance liquid chromatography (UPLC)-measured and LC/MS-measured immunoglobulin G (IgG) glycan traits [adapted from Huffman et al. (24)].
Table S11. Replicated association and comparison to the study by Lauc et al. (21).
Table S12. Summary of replicated association and comparison to study by Lauc et al. (21).
Table S13. Confirmation of loci reported in Lauc et al. (21).
References
1. Arnold JN, Wormald MR, Sim RB, Rudd PM, Dwek RA. The impact of glycosylation on the biological function and structure of human immunoglobulins. Annu Rev Immunol (2007) 25:21–50. doi:10.1146/annurev.immunol.25.022106.141702
2. Trbojevic Akmacic I, Ventham NT, Theodoratou E, Vuckovic F, Kennedy NA, Kristic J, et al. Inflammatory bowel disease associates with proinflammatory potential of the immunoglobulin G glycome. Inflamm Bowel Dis (2015) 21(6):1237–47. doi:10.1097/MIB.0000000000000372
3. Barrios C, Zierer J, Gudelj I, Stambuk J, Ugrina I, Rodriguez E, et al. Glycosylation profile of IgG in moderate kidney dysfunction. J Am Soc Nephrol (2016) 27(3):933–41. doi:10.1681/ASN.2015010109
4. Wiederschain G. Introduction to Glycobiology and Human Diseases. CRC Press (2016). p. 1–27. doi:10.1201/b20120-2
5. Zhang D, Chen B, Wang Y, Xia P, He C, Liu Y, et al. Disease-specific IgG Fc N-glycosylation as personalized biomarkers to differentiate gastric cancer from benign gastric diseases. Sci Rep (2016) 6:25957. doi:10.1038/srep25957
6. Sethi MK, Hancock WS, Fanayan S. Identifying N-glycan biomarkers in colorectal cancer by mass spectrometry. Acc Chem Res (2016) 49(10):2099–106. doi:10.1021/acs.accounts.6b00193
7. Ruhaak LR, Kim K, Stroble C, Taylor SL, Hong Q, Miyamoto S, et al. Protein-specific differential glycosylation of immunoglobulins in serum of ovarian cancer patients. J Proteome Res (2016) 15(3):1002–10. doi:10.1021/acs.jproteome.5b01071
8. Lemjabbar-Alaoui H, McKinney A, Yang YW, Tran VM, Phillips JJ. Glycosylation alterations in lung and brain cancer. Adv Cancer Res (2015) 126:305–44. doi:10.1016/bs.acr.2014.11.007
9. Mehta A, Herrera H, Block T. Glycosylation and liver cancer. Adv Cancer Res (2015) 126:257–79. doi:10.1016/bs.acr.2014.11.005
10. Pinho SS, Reis CA. Glycosylation in cancer: mechanisms and clinical implications. Nat Rev Cancer (2015) 15(9):540–55. doi:10.1038/nrc3982
11. Taniguchi N, Kizuka Y. Glycans and cancer: role of N-glycans in cancer biomarker, progression and metastasis, and therapeutics. Adv Cancer Res (2015) 126:11–51. doi:10.1016/bs.acr.2014.11.001
12. Chen G, Wang Y, Qiu L, Qin X, Liu H, Wang X, et al. Human IgG Fc-glycosylation profiling reveals associations with age, sex, female sex hormones and thyroid cancer. J Proteomics (2012) 75(10):2824–34. doi:10.1016/j.jprot.2012.02.001
13. Kizuka Y, Taniguchi N. Enzymes for N-glycan branching and their genetic and nongenetic regulation in cancer. Biomolecules (2016) 6(2):E25. doi:10.3390/biom6020025
14. Menni C, Keser T, Mangino M, Bell JT, Erte I, Akmacic I, et al. Glycosylation of immunoglobulin g: role of genetic and epigenetic influences. PLoS One (2013) 8(12):e82558. doi:10.1371/journal.pone.0082558
15. Maratha A, Stockmann H, Coss KP, Estela Rubio-Gozalbo M, Knerr I, Fitzgibbon M, et al. Classical galactosaemia: novel insights in IgG N-glycosylation and N-glycan biosynthesis. Eur J Hum Genet (2016) 24(7):976–84. doi:10.1038/ejhg.2015.254
17. Hamilton RG. In: Mohan C, editor. The Human IgG Subclasses. Baltimore, MD: Calbiochem-Novabiochem Corporation (2001).
18. Marth JD, Grewal PK. Mammalian glycosylation in immunity. Nat Rev Immunol (2008) 8(11):874–87. doi:10.1038/nri2417
19. Parekh RB, Dwek RA, Sutton BJ, Fernandes DL, Leung A, Stanworth D, et al. Association of rheumatoid arthritis and primary osteoarthritis with changes in the glycosylation pattern of total serum IgG. Nature (1985) 316(6027):452–7. doi:10.1038/316452a0
20. Pucic M, Knezevic A, Vidic J, Adamczyk B, Novokmet M, Polasek O, et al. High throughput isolation and glycosylation analysis of IgG-variability and heritability of the IgG glycome in three isolated human populations. Mol Cell Proteomics (2011) 10(10):M111010090. doi:10.1074/mcp.M111.010090
21. Lauc G, Huffman JE, Pucic M, Zgaga L, Adamczyk B, Muzinic A, et al. Loci associated with N-glycosylation of human immunoglobulin G show pleiotropy with autoimmune diseases and haematological cancers. PLoS Genet (2013) 9(1):e1003225. doi:10.1371/journal.pgen.1003225
22. Schoenmaker M, de Craen AJ, de Meijer PH, Beekman M, Blauw GJ, Slagboom PE, et al. Evidence of genetic enrichment for exceptional survival using a family approach: the Leiden Longevity Study. Eur J Hum Genet (2006) 14(1):79–84. doi:10.1038/sj.ejhg.5201508
23. Shen X, Klaric L, Sharapov S, Mangino M, Ning Z, Wu D, et al. Multivariate discovery and replication of five novel loci associated with Immunoglobulin G N-glycosylation. Nat Commun (2017) 8(1):447. doi:10.1038/s41467-017-00453-3
24. Huffman JE, Pucic-Bakovic M, Klaric L, Hennig R, Selman MH, Vuckovic F, et al. Comparative performance of four methods for high-throughput glycosylation analysis of immunoglobulin G in genetic and epidemiological research. Mol Cell Proteomics (2014) 13(6):1598–610. doi:10.1074/mcp.M113.037465
25. Vidarsson G, Dekkers G, Rispens T. IgG subclasses and allotypes: from structure to effector functions. Front Immunol (2014) 5:520. doi:10.3389/fimmu.2014.00520
26. Wuhrer M, Stam JC, van de Geijn FE, Koeleman CA, Verrips CT, Dolhain RJ, et al. Glycosylation profiling of immunoglobulin G (IgG) subclasses from human serum. Proteomics (2007) 7(22):4070–81. doi:10.1002/pmic.200700289
27. Petersen AK, Krumsiek J, Wagele B, Theis FJ, Wichmann HE, Gieger C, et al. On the hypothesis-free testing of metabolite ratios in genome-wide and metabolome-wide association studies. BMC Bioinformatics (2012) 13:120. doi:10.1186/1471-2105-13-120
28. Benedetti E, Pucic-Bakovic M, Keser T, Wahl A, Hassinen A, Yang JY, et al. Network inference from glycoproteomics data reveals new reactions in the IgG glycosylation pathway. Nat Commun (2017) 8(1):1483. doi:10.1038/s41467-017-01525-0
29. Voon DC, Hor YT, Ito Y. The RUNX complex: reaching beyond haematopoiesis into immunity. Immunology (2015) 146(4):523–36. doi:10.1111/imm.12535
30. He SY, Jiang RF, Jiang J, Xiang YS, Wang L. Investigation of methylation and protein expression of the Runx3 gene in colon carcinogenesis. Biomed Rep (2015) 3(5):687–90. doi:10.3892/br.2015.479
31. Estecio MR, Maddipoti S, Bueso-Ramos C, DiNardo CD, Yang H, Wei Y, et al. RUNX3 promoter hypermethylation is frequent in leukaemia cell lines and associated with acute myeloid leukaemia inv(16) subtype. Br J Haematol (2015) 169(3):344–51. doi:10.1111/bjh.13299
32. Zhang X, He H, Zhang X, Guo W, Wang Y. RUNX3 promoter methylation is associated with hepatocellular carcinoma risk: a meta-analysis. Cancer Invest (2015) 33(4):121–5. doi:10.3109/07357907.2014.1003934
33. Lotem J, Levanon D, Negreanu V, Bauer O, Hantisteanu S, Dicken J, et al. Runx3 at the interface of immunity, inflammation and cancer. Biochim Biophys Acta (2015) 1855(2):131–43. doi:10.1016/j.bbcan.2015.01.004
34. Hor YT, Voon DC, Koo JK, Wang H, Lau WM, Ashktorab H, et al. A role for RUNX3 in inflammation-induced expression of IL23A in gastric epithelial cells. Cell Rep (2014) 8(1):50–8. doi:10.1016/j.celrep.2014.06.003
35. Tserel L, Kolde R, Limbach M, Tretyakov K, Kasela S, Kisand K, et al. Age-related profiling of DNA methylation in CD8+ T cells reveals changes in immune response and transcriptional regulator genes. Sci Rep (2015) 5:13107. doi:10.1038/srep13107
36. Whiteman HJ, Farrell PJ. RUNX expression and function in human B cells. Crit Rev Eukaryot Gene Expr (2006) 16(1):31–44. doi:10.1615/CritRevEukarGeneExpr.v16.i1.30
37. Chen F, Liu X, Bai J, Pei D, Zheng J. The emerging role of RUNX3 in cancer metastasis (Review). Oncol Rep (2016) 35(3):1227–36. doi:10.3892/or.2015.4515
38. Steinke FC, Yu S, Zhou X, He B, Yang W, Zhou B, et al. TCF-1 and LEF-1 act upstream of Th-POK to promote the CD4(+) T cell fate and interact with Runx3 to silence Cd4 in CD8(+) T cells. Nat Immunol (2014) 15(7):646–56. doi:10.1038/ni.2897
39. Mookerjee-Basu J, Kappes DJ. New ingredients for brewing CD4(+)T (cells): TCF-1 and LEF-1. Nat Immunol (2014) 15(7):593–4. doi:10.1038/ni.2927
40. Overgaard NH, Jung JW, Steptoe RJ, Wells JW. CD4+/CD8+ double-positive T cells: more than just a developmental stage? J Leukoc Biol (2015) 97(1):31–8. doi:10.1189/jlb.1RU0814-382
41. Xiong Y, Castro E, Yagi R, Zhu J, Lesourne R, Love PE, et al. Thpok-independent repression of Runx3 by Gata3 during CD4+ T-cell differentiation in the thymus. Eur J Immunol (2013) 43(4):918–28. doi:10.1002/eji.201242944
42. Wang J, Balog CI, Stavenhagen K, Koeleman CA, Scherer HU, Selman MH, et al. Fc-glycosylation of IgG1 is modulated by B-cell stimuli. Mol Cell Proteomics (2011) 10(5):M110004655. doi:10.1074/mcp.M110.004655
43. Harker N, Naito T, Cortes M, Hostert A, Hirschberg S, Tolaini M, et al. The CD8alpha gene locus is regulated by the Ikaros family of proteins. Mol Cell (2002) 10(6):1403–15. doi:10.1016/S1097-2765(02)00711-6
44. Prasad RB, Hosking FJ, Vijayakrishnan J, Papaemmanuil E, Koehler R, Greaves M, et al. Verification of the susceptibility loci on 7p12.2, 10q21.2, and 14q11.2 in precursor B-cell acute lymphoblastic leukemia of childhood. Blood (2010) 115(9):1765–7. doi:10.1182/blood-2009-09-241513
45. Balbin M, Grubb A, de Lange GG, Grubb R. DNA sequences specific for caucasian G3m(b) and (g) allotypes: allotyping at the genomic level. Immunogenetics (1994) 39(3):187–93. doi:10.1007/BF00241259
46. Abes R, Teillaud JL. Impact of glycosylation on effector functions of therapeutic IgG. Pharmaceuticals (Basel) (2010) 3(1):146–57. doi:10.3390/ph3010146
47. Dorokhov YL, Sheshukova EV, Kosobokova EN, Shindyapina AV, Kosorukov VS, Komarova TV. Functional role of carbohydrate residues in human immunoglobulin G and therapeutic monoclonal antibodies. Biochemistry (Mosc) (2016) 81(8):835–57. doi:10.1134/S0006297916080058
48. Irani V, Guy AJ, Andrew D, Beeson JG, Ramsland PA, Richards JS. Molecular properties of human IgG subclasses and their implications for designing therapeutic monoclonal antibodies against infectious diseases. Mol Immunol (2015) 67(2 Pt A):171–82. doi:10.1016/j.molimm.2015.03.255
49. Mimura Y, Katoh T, Saldova R, O’Flaherty R, Izumi T, Mimura-Kimura Y, et al. Glycosylation engineering of therapeutic IgG antibodies: challenges for the safety, functionality and efficacy. Protein Cell (2017) 9(1):47–62. doi:10.1007/s13238-017-0433-3
50. Reusch D, Tejada ML. Fc glycans of therapeutic antibodies as critical quality attributes. Glycobiology (2015) 25(12):1325–34. doi:10.1093/glycob/cwv065
51. Wichmann HE, Gieger C, Illig T, Group MKS. KORA-gen – resource for population genetics, controls and a broad spectrum of disease phenotypes. Gesundheitswesen (2005) 67(Suppl 1):S26–30. doi:10.1055/s-2005-858226
52. Holle R, Happich M, Lowel H, Wichmann HE, Group MKS. KORA – a research platform for population based health research. Gesundheitswesen (2005) 67(Suppl 1):S19–25. doi:10.1055/s-2005-858235
53. Livshits G, Macgregor AJ, Gieger C, Malkin I, Moayyeri A, Grallert H, et al. An omics investigation into chronic widespread musculoskeletal pain reveals epiandrosterone sulfate as a potential biomarker. Pain (2015) 156(10):1845–51. doi:10.1097/j.pain.0000000000000200
54. Ha NT, Freytag S, Bickeboeller H. Coverage and efficiency in current SNP chips. Eur J Hum Genet (2014) 22(9):1124–30. doi:10.1038/ejhg.2013.304
55. Westendorp RG, van Heemst D, Rozing MP, Frolich M, Mooijaart SP, Blauw GJ, et al. Nonagenarian siblings and their offspring display lower risk of mortality and morbidity than sporadic nonagenarians: the Leiden Longevity Study. J Am Geriatr Soc (2009) 57(9):1634–7. doi:10.1111/j.1532-5415.2009.02381.x
56. Beekman M, Blauw GJ, Houwing-Duistermaat JJ, Brandt BW, Westendorp RG, Slagboom PE. Chromosome 4q25, microsomal transfer protein gene, and human longevity: novel data and a meta-analysis of association studies. J Gerontol A Biol Sci Med Sci (2006) 61(4):355–62. doi:10.1093/gerona/61.4.355
57. Selman MH, Derks RJ, Bondt A, Palmblad M, Schoenmaker B, Koeleman CA, et al. Fc specific IgG glycosylation profiling by robust nano-reverse phase HPLC-MS using a sheath-flow ESI sprayer interface. J Proteomics (2012) 75(4):1318–29. doi:10.1016/j.jprot.2011.11.003
58. Ugrina I, Klaric L, Vuckovic F. glycanr: Tools for Analysing N-Glycan Data (R Package Version 0.3.0.). (2016). Available from: https://cran.r-project.org/web/packages/glycanr/index.html
59. Johnson WE, Li C, Rabinovic A. Adjusting batch effects in microarray expression data using empirical Bayes methods. Biostatistics (2007) 8(1):118–27. doi:10.1093/biostatistics/kxj037
60. Leek JT, Johnson WE, Parker HS, Jaffe AE, Storey JD. The sva package for removing batch effects and other unwanted variation in high-throughput experiments. Bioinformatics (2012) 28(6):882–3. doi:10.1093/bioinformatics/bts034
61. Taniguchi N. Handbook of Glycosyltransferases and Related Genes. Springer (2014). doi:10.1007/978-4-431-54240-7
62. Marchini J, Howie B, Myers S, McVean G, Donnelly P. A new multipoint method for genome-wide association studies by imputation of genotypes. Nat Genet (2007) 39(7):906–13. doi:10.1038/ng2088
63. Uh HW, Beekman M, Meulenbelt I, Houwing-Duistermaat JJ. Genotype-based score test for association testing in families. Stat Biosci (2015) 7(2):394–416. doi:10.1007/s12561-015-9128-6
64. Willer CJ, Li Y, Abecasis GR. METAL: fast and efficient meta-analysis of genomewide association scans. Bioinformatics (2010) 26(17):2190–1. doi:10.1093/bioinformatics/btq340
65. Arnold M, Raffler J, Pfeufer A, Suhre K, Kastenmuller G. SNiPA: an interactive, genetic variant-centered annotation browser. Bioinformatics (2015) 31(8):1334–6. doi:10.1093/bioinformatics/btu779
Keywords: genome-wide association study, immunoglobulin G, glycosylation, RUNX3, LC–ESI-MS
Citation: Wahl A, van den Akker E, Klaric L, Štambuk J, Benedetti E, Plomp R, Razdorov G, Trbojević-Akmačić I, Deelen J, van Heemst D, Slagboom PE, Vučković F, Grallert H, Krumsiek J, Strauch K, Peters A, Meitinger T, Hayward C, Wuhrer M, Beekman M, Lauc G and Gieger C (2018) Genome-Wide Association Study on Immunoglobulin G Glycosylation Patterns. Front. Immunol. 9:277. doi: 10.3389/fimmu.2018.00277
Received: 15 November 2017; Accepted: 31 January 2018;
Published: 26 February 2018
Edited by:
Deborah K. Dunn-Walters, University of Surrey, United KingdomReviewed by:
Katie J. Doores, King’s College London, United KingdomBruce David Mazer, Research Institute of the McGill University Health Center, Canada
Copyright: © 2018 Wahl, van den Akker, Klaric, Štambuk, Benedetti, Plomp, Razdorov, Trbojević-Akmačić, Deelen, van Heemst, Slagboom, Vučković, Grallert, Krumsiek, Strauch, Peters, Meitinger, Hayward, Wuhrer, Beekman, Lauc and Gieger. This is an open-access article distributed under the terms of the Creative Commons Attribution License (CC BY). The use, distribution or reproduction in other forums is permitted, provided the original author(s) and the copyright owner are credited and that the original publication in this journal is cited, in accordance with accepted academic practice. No use, distribution or reproduction is permitted which does not comply with these terms.
*Correspondence: Christian Gieger, Y2hyaXN0aWFuLmdpZWdlckBoZWxtaG9sdHotbXVlbmNoZW4uZGU=
†These authors should be regarded as joint first authors.
‡These authors should be regarded as joint last authors.