 Marcos G. Sotillo1*
 Baptiste Mourre2
 Marc Mestres3
 Pablo Lorente1,4
 Roland Aznar1,4
 Manuel García-León1,3
 Maria Liste3
 Alex Santana2
 Manuel Espino3
 Enrique Álvarez1
- 1Área de Medio Físico, Puertos del Estado, Madrid, Spain
- 2Balearic Islands Coastal Observing and Forecasting System, Balearic Islands ICTS, Palma de Mallorca, Spain
- 3Laboratori d’Enginyeria Marítima, Universitat Politècnica de Catalunya, BarcelonaTech, Barcelona, Spain
- 4Nologin Consulting S.L., Zaragoza, Spain
Storm Gloria was the 10th named storm in Europe for the 2019–2020 winter season, and it severely affected Spain and France. This powerful storm represents an excellent study case to analyze the capabilities of the different ocean model systems available in the Spanish Mediterranean coasts to simulate extreme events, as well as to assess their suitability to enhance preparedness in maritime disasters with high impacts on coastal areas. Five different operational ocean forecasting services able to predict the storm-induced ocean circulation are evaluated. Three of the systems are delivered by the Copernicus Marine Service (hereafter CMEMS): the CMEMS global scale solution (GLO-1/12°), the specific Mediterranean basin scale one (MED-1/24°), and the regional solution for the Atlantic façade (IBI-1/36°), which includes also part of the western Mediterranean. These CMEMS core products are complemented with two higher resolution models focused on more limited areas, which provide operational forecasts for coastal applications: the WMOP system developed at the Balearic Islands Coastal Observing and Forecasting System (SOCIB) with a horizontal resolution of roughly 2 km and the Puertos del Estado (PdE) SAMOA systems with a 350-m resolution that cover the coastal domains of the Spanish Port Authorities of Barcelona, Tarragona, Castellón and Almeria. Both the WMOP and SAMOA models are nested in CMEMS regional systems (MED and IBI, respectively) and constitute good examples of coastal-scale-oriented CMEMS downstream services. The skill of these five ocean models in reproducing the surface dynamics in the area during Gloria is evaluated using met-ocean in situ measurements from numerous buoys (moored in coastal and open waters) and coastal meteorological stations as a reference to track the effects of the storm in essential ocean variables such as surface current, water temperature, and salinity throughout January 2020. Furthermore, modeled surface dynamics are validated against hourly surface current fields from the two high-frequency radar systems available in the zone (the SOCIB HF-Radar system covering the eastern part of the Ibiza Channel and the PdE one at Tarragona, which covers the Ebro Delta, one of the coastal areas most impacted by Gloria). The results assess the performance of the dynamical downscaling at two different levels: first, within the own CMEMS service (with their regional products, as enhanced solutions with respect to the global one) and second in the coastal down-streaming service side (with very high-resolution models reaching coastal scales). This multi-model study case focused on Storm Gloria has allowed to identify some strengths and limitations of the systems currently in operations, and it can help outlining future model service upgrades aimed at better forecasting extreme coastal events.
Introduction
Worldwide, coastal zones are considered among the most important environmental resources. They act as attractors for population settlements, and they are used extensively and increasingly for a large number of human activities (i.e., agriculture, trade, industry and amenity). As a result, the coastal fringe is a unique resource system that requires special management and planning approaches (FAO Report, Clark, 1992).
Coastal population becomes more exposed to specific natural hazards (i.e., coastal flooding of low-lying lands, tsunamis, hurricanes, etc.), which are directly linked to extreme weather events and their associated storm surges, severe ocean conditions and high sea wave states. Two-thirds of the coastal disasters recorded yearly are associated with extreme weather events, such as storms and flooding, which are likely to become more prevalent and continuous due to climate change and sea-level rise scenarios (Adger et al., 2005). Moreover, the growing coastal population densities, combined with climate change projections, suggests that the number of people exposed to these coastal hazards will increase in the future. According to Nicholls (2004), 10 million people experienced coastal flooding each year at that time due to storm surges and landfall typhoons, and 50 million could be at risk by 2080. The increase of coastal vulnerability linked to socio-economic scenarios requires more adaptive responses to cope with a rise of similar hazards derived from global environmental change, as stated in the IPCC WorkingGroup II report on impacts, adaptation, and vulnerability (McCarthy et al., 2001).
With this in mind, there is a need for conceptual frameworks to strengthen the capacity of society at all its levels (including governments, organizations, and the general public) to respond and to adapt to the impacts of these natural hazard impacts, enhancing thus the resilience to extreme weather events (Linnenluecke and Griffiths, 2011). Understanding the physical processes behind natural weather-related hazards is a crucial issue to mitigate their negative effects, to support prompt anticipatory adaptation strategies, and eventually to strengthen the community resilience at multiple scales. In that sense, Adger et al. (2005) included the promotion of early warning services as one of the potential actions (at national and international level) to enhance resilience in socio-ecological coastal systems exposed to abrupt changes.
This call for adequate coastal met-ocean information to enhance resilience in coastal areas is, amongst other factors, a driver for the currently growing demand, both in quantity and quality, of operational oceanographic products and services in coastal areas. An adequate management of the main issues related to the anthropic impacts and resource exploitation activities along the coast requires a deep understanding of the physical behavior of these areas. Because these activities are affected by met-ocean conditions, and especially by extreme events, their development demands accurate and customized real-time and forecast information on the environmental conditions. Thus, many of the existing operational oceanographic service focuses on regional coastal waters, in which most of the sea-related human activities take place (e.g., ports, fishing, recreational use) and most marine sensitive habitats exist (De Mey-Frémaux et al., 2019).
The European Copernicus Marine Environment Monitoring Service (CMEMS) provides regular and systematic reference information on the physical and biogeochemical state for the global ocean and the European regional seas (CMEMS, 2020)1. One of the goals of the CMEMS mission includes providing short-term forecasting for marine conditions and, as appropriate, to downstream services for warnings and/or quick responses to extreme or hazardous events (Le Traon et al., 2019). However, not all the CMEMS core products currently delivered are necessarily suitable for coastal purposes. Le Traon et al. (2019) points out the necessity to significantly evolve products toward finer scales to improve monitoring and forecasting of the coastal zone as one of the main drivers for the longer-term CMEMS service evolution.
The sustained availability of CMEMS global and regional scale core products has fostered the development of “downstream” services devoted to coastal monitoring and forecasting. Capet et al. (2020) in their review of the current European capacity on operational marine and coastal modeling systems, map 49 organizations around Europe delivering 104 operational model systems simulating mostly hydrodynamics, biogeochemistry and sea waves at regional and coastal scales, in some cases on overlapping areas. In this context, with different model products available in some specific coastal areas, the opportunity and the need arise to compare model solutions, thus identifying the strengths and shortcomings of each model system.
Linked to this increase of global, regional and coastal model systems (used in near-real-time operations, for multi-year runs or R&D purposes), there has been an increase in the number of multi-model comparison exercises, with many examples in the literature: Earlier, common efforts to evaluate operational ocean models were organized in the global ocean modeling community, mainly around the Global Ocean Data Assimilation Experiment (GODAE; Bell et al., 2009; Dombrowsky et al., 2009). The operational modeling community at global and basin scales has kept some partnership to share and standardize validation methodologies, mutually benefitting from inter-comparing their operational ocean products (Oke et al., 2012; Schiller et al., 2015; GODAE-OceanView Program, 2020; currently in transition to new OceanPredict framework). Within CMEMS, coordinated model validation activities among different operational and oceanographic research centers have been promoted, assessing a wider range of ocean parameters and comparing different systems (Hernandez et al., 2015). Juza et al. (2016) and Lorente et al. (2019a) pointed out the need for defining assessment strategies to quantify error propagation through downscaling (from global to regional scales), as well as for specific areas where different model products overlap. To this aim, different multi-parameter multi-platform model validation toolboxes are being developed (i.e., the NARVAL one, used by the CMEMS IBI Monitoring Forecasting Centre to assess its model solutions in terms of mean circulation and water mass properties).
In the particular case of the western Mediterranean, there have been different R&D projects and initiatives to promote such multi-model intercomparison exercises. The MEDESS-4MS project (Zodiatis et al., 2016), whose main goal was to set-up a multi-model oil spill prediction service dedicated to strengthen maritime safety related to oil spill pollution and to assist response agencies, performed several actions to enhance the integration of existing national ocean forecasting systems in the region. In this project, Capó et al. (2016) assessed the capacity of four CMEMS and non-CMEMS operational model systems (all included in the present study) to forecast trajectories of hypothetical surface oil spills in the Balearic region. In a similar manner, Sotillo et al. (2016) showed the effectiveness of a dynamical downscaling performed through a high-resolution model nested into the core regional CMEMS solution to better simulate the Atlantic jet in Gibraltar and the later evolution of these surface Atlantic waters through the Alboran Sea and the southwestern Mediterranean basin, providing an objective measure of the added value related to this proposed CMEMS downstream service. Similarly, Aguiar et al. (2020) analyzed dynamical downscaling effects in the western Mediterranean Sea circulation and mesoscale activity. Mourre et al. (2018) specifically addressed the issues associated with the validation of high-resolution models in the western Mediterranean Sea, in particular the double-penalty affecting conventional error metrics when computed with model fields representing eddies and fronts with small spatial and temporal mismatches. Also, in the western Mediterranean region, Mason et al. (2019) provided new insights into the mesoscale content of three CMEMS operational model products, using a sea-surface-height-based eddy identification and tracking tool for the period 2013–2016. This model performances assessment through eddy properties and three-dimensional composite structures is an innovative validation diagnostic for operational model products. One conclusion from all these operational multi-model comparisons, it can be that the inability of numerical models to realistically reproduce sub-mesoscale structures can be one of the main causes of model underperformance, especially in the western Mediterranean region. Such limitations may jeopardize their later use in operational tracking systems for maritime emergencies such as oil spill accidents or SAR operations.
In all cases, the use of observations from specific in situ observational campaigns is a key factor to render the model skill assessments more meaningful. The availability of these extra in situ observational data bases enhances the multi-model validation exercises, but at the same time conditions their temporal extent. Initiatives such as the comprehensive Calypso campaign (Mahadevan et al., 2020) held in the Alboran Sea region to monitor high-frequency processes and transports associated with intense frontal areas, can certainly contribute positively to significantly enhance the validations of currently existing operational ocean model products in the region and to guide their potential evolution toward more complex systems.
The present work focuses on evaluating the quality of CMEMS core and coastal downstream forecast products in the western Mediterranean, and more specifically, on assessing how their models perform under severe extreme weather event conditions, with an emphasis on the surface dynamics. The literature provides many ocean model assessments, performed world-wide, focusing on different aspects of the ocean response to extreme weather events. To bound the uncertainty under extreme regimes (i.e., cyclones, typhoons, severe storms), substantial efforts have been conducted operational ocean services world-wide, placing strong emphasis on atmospheric-driven barotropic transport (due either to severe winds or mean sea level pressure gradients), on resolution refinement (either for the ocean model or the atmospheric forcing), and on model coupling (atmosphere, ocean waves, sea ice or hydrology).
For instance, Sakamoto et al. (2019) reported a storm-surge error of 3 cm at the peak of Typhoon Sanba (2012) at Hamada city, using a 2-km resolution ocean model that spans the Japanese coastal areas. A similar set-up but with coarser atmospheric forcing data (55 km vs. 5 km of the operational system), led to an error close to 8 cm. Another way to bound the uncertainty, at the expense of computational cost, is the use of ensembles. Bernier and Thompson (2015) proposed an ensemble storm surge forecast system for Atlantic Canada. The deterministic 5-day forecast underestimated the storm peak by 20 cm on 22/03/2013 at Rimouski (Canada), but overestimated the total sea level by 1 m at the decay phase. While the ensemble 5-day forecast matched the surge peak, although it also overestimated the decay by about 20 cm.
Recently, Rautenbach et al. (2020) implemented a set of depth-averaged (2DH) circulation models coupled with a spectral wave model along the South African coast. The simulations overestimated the sea level circa 20 cm on 07/06/2017 at Cape Town, due to a storm-surge driven by a surface pressure drop of 25 hPa in 48 h, whilst the measured one was 65 cm. A sensitivity analysis showed that without wave coupling, the surge error decreased to 5 cm. In the Adriatic Sea, Bora events may be particularly hazardous. Ličer et al. (2016) proposed a two-way atmosphere-ocean coupling, under an exceptional Bora on February 2012. Two-way coupling reduced ocean temperature RMSE four-fold and an improved sensible heat fluxes, compared with the one-way system. The two-way daily spatial average of the standard deviation of air temperature errors also decreased to 0.15°C, versus the one-way. However, in specific cases, the impact of atmosphere-ocean coupling can be weak. Bouin and Brossier (2020) reported that coupling did have a secondary role in modeling the surface processes of the Medicane that hit Sicilian coasts (Italy) on 07/11/2014.
Combining enhanced high-frequency ocean observations, such as high-frequency (HF) radar currents, and different operational model products, Lin et al. (2016) assessed an operational system at the Taiwan strait whose bias compared with HF-radar was close to –0.07 m/s under a calm regime; but double it (around 0.15 m/s) during typhoons Sinlaku (2008) and Morakot (2009). Likewise, Lorente et al. (2019b), takes advantage of a long-term coverage of HF-Radar surface currents in the Gibraltar Strait area to provide a deeper analysis on the surface Atlantic jet variability. This work demonstrated the steady model improvement, when moving from global to coastal scales through a multi-nesting approach. The nesting strategy realistically reproduces, not only the almost continuous incoming Atlantic flow through Gibraltar, but also when extreme events marked by anomalous reversal surface flows from the Med into the Atlantic occurred. Finally, Ruiz-Parrado et al. (2020); CMEMS OSR#4) assessed the capacity of different operational ocean models to reproduce the impact of a freshwater-pulse associated with the most extreme daily discharge episode from the Ebro river (the one with the largest discharge rate in the Spanish western Mediterranean basin) on the coastal circulation patterns. This study highlights how operational models, mostly forced with climatological river inputs, are unable to simulate realistic plume-like coastal circulation patterns in the zone during extreme river discharge events, regardless of the model spatial resolution. It proves that coastal simulations only improve when realistic daily-updated observed-derived river freshwater forcing data are used.
Hence, the effective management of the coastal zone demands forecasting services with the capacity to reproduce not only mean regime conditions, but also extreme events. A reliable prediction of coastal meteo-oceanographic extreme processes has deep implications in coastal zone sustainability, the management of anthropic activities, and enhances the resilience of coastal areas. Because of this, it is then paramount to evaluate the capability of operational ocean forecast services to realistically reproduce extreme ocean events. The present research work focuses on analyzing the ocean circulation in the western Med region, using the Western Mediterranean Storm Gloria (January 2020) as a study case, with emphasis on the more impacted Spanish coastal areas, and on evaluating how the different operational ocean forecasting services performed, reproducing the response of the surface dynamics to this extreme event. During the storm, there were five operational ocean circulation systems available in the region able to forecast the storm-induced ocean circulation: three different CMEMS forecast products (i.e., the global scale one, the specific Mediterranean basin one, and the regional solution for the Atlantic façade, whose model domain also covers part of the western Mediterranean) together with two coastal CMEMS-downstream forecasting services (the SOCIB WMOP system and the PdE SAMOA coastal domains that cover the Spanish Port regions of Barcelona, Tarragona, Castellón and Almeria). Focused on the powerful Storm Gloria, this multi-model study case aims at analyzing the response to extreme met-ocean events, in terms of near-real-time forecasting capability, increasing our knowledge on those operational forecast services performing in the western Mediterranean (i.e., a combination of both CMEMS core products and specific operational downstream coastal services). The study has also allowed identifying shortcomings and lacks in model applications that can help to align future service evolutions (both at CMEMS and at downstream service level) oriented toward a better forecasting of coastal extremes, leading to more suitable services for potential coastal extensions.
The paper is organized as follows: Section “Materials and Methods” gives a short description of the Storm Gloria, including a review of the available met-ocean in situ observations provided by the operational ocean and coastal monitoring networks that monitored in real-time the oceanographic situation during this extreme event. This Section “Materials and Methods” also describes the core CMEMS ocean forecast products available in the region, together with the two specific downstream operational coastal services (i.e., the PdE SAMOA and the SOCIB WMOP). Section “Results” shows how the Storm Gloria was forecasted by the CMEMS ocean model products and how the downstream high-resolution operational coastal models performed on the Mediterranean Iberian Coast (the SAMOA) and the Balearics (the WMOP). Section “Discussion and Conclusion” provides a detailed discussion of the results, addressing an analysis of the potential added value of coastal downstream forecast services, as well as some proposals for future research topics of interest to enhance the operational forecast capabilities of these operational model products.
Materials and Methods
The GLORIA Storm and Its Met-Ocean Real-Time Monitoring
Storm Gloria was the 10th named storm in Europe for the 2019–2020 winter season, and it severely affected northeastern Spain and southern Mediterranean France from the 19th until the 25th of January 2020. It produced a great impact along the Spanish Mediterranean coasts with some casualties and numerous material losses related to flooding of low-lying areas, damage to coastal infrastructures and intense beach erosion. The storm was marked by high easterly winds and an extreme wave state in the western Mediterranean (beating historical records in significant wave height for some of the buoys moored in the region since the 1990s). Despite this record-breaking high sea wave state, Storm Gloria cannot be considered, in pure meteorological terms, among the most intense storms in the western Mediterranean, since the event is not characterized neither by the existence of an excessively deep low-pressure system nor by a fast triggering, typical of explosive cyclogeneses. As it can be seen in Figure 1, Storm Gloria was marked by an anomalous very intense blocking anticyclone over the British Isles, with maximum values above 1050 hPa, the historical record measured by the United Kingdom MetOffice since 1957 (Met Office Factsheet, 2016). The extension of this high latitude blocking anticyclone enhanced the pressure gradient over the whole area, resulting in very strong easterly winds (“Levante”) that affected especially the western Mediterranean basin (Figure 1, illustrates with some examples of 10-m wind timeseries observed at different mooring buoys). With respect to the wind direction, it veered from initial north-easterlies to more pure easterlies in the Catalano-Balearic Sea, during the main storm peak occurred (from the 19th to the 22nd January). In addition, the synoptic situation was also marked by the previous (and unrelated to the development of Gloria) intrusion into the western Mediterranean basin of relatively warm and humid subtropical air masses that were finally transported by the Gloria low-pressure system; resulting in very intense precipitation events over Spanish coastal areas (snow in some regions), also beating some historical precipitation records for January.
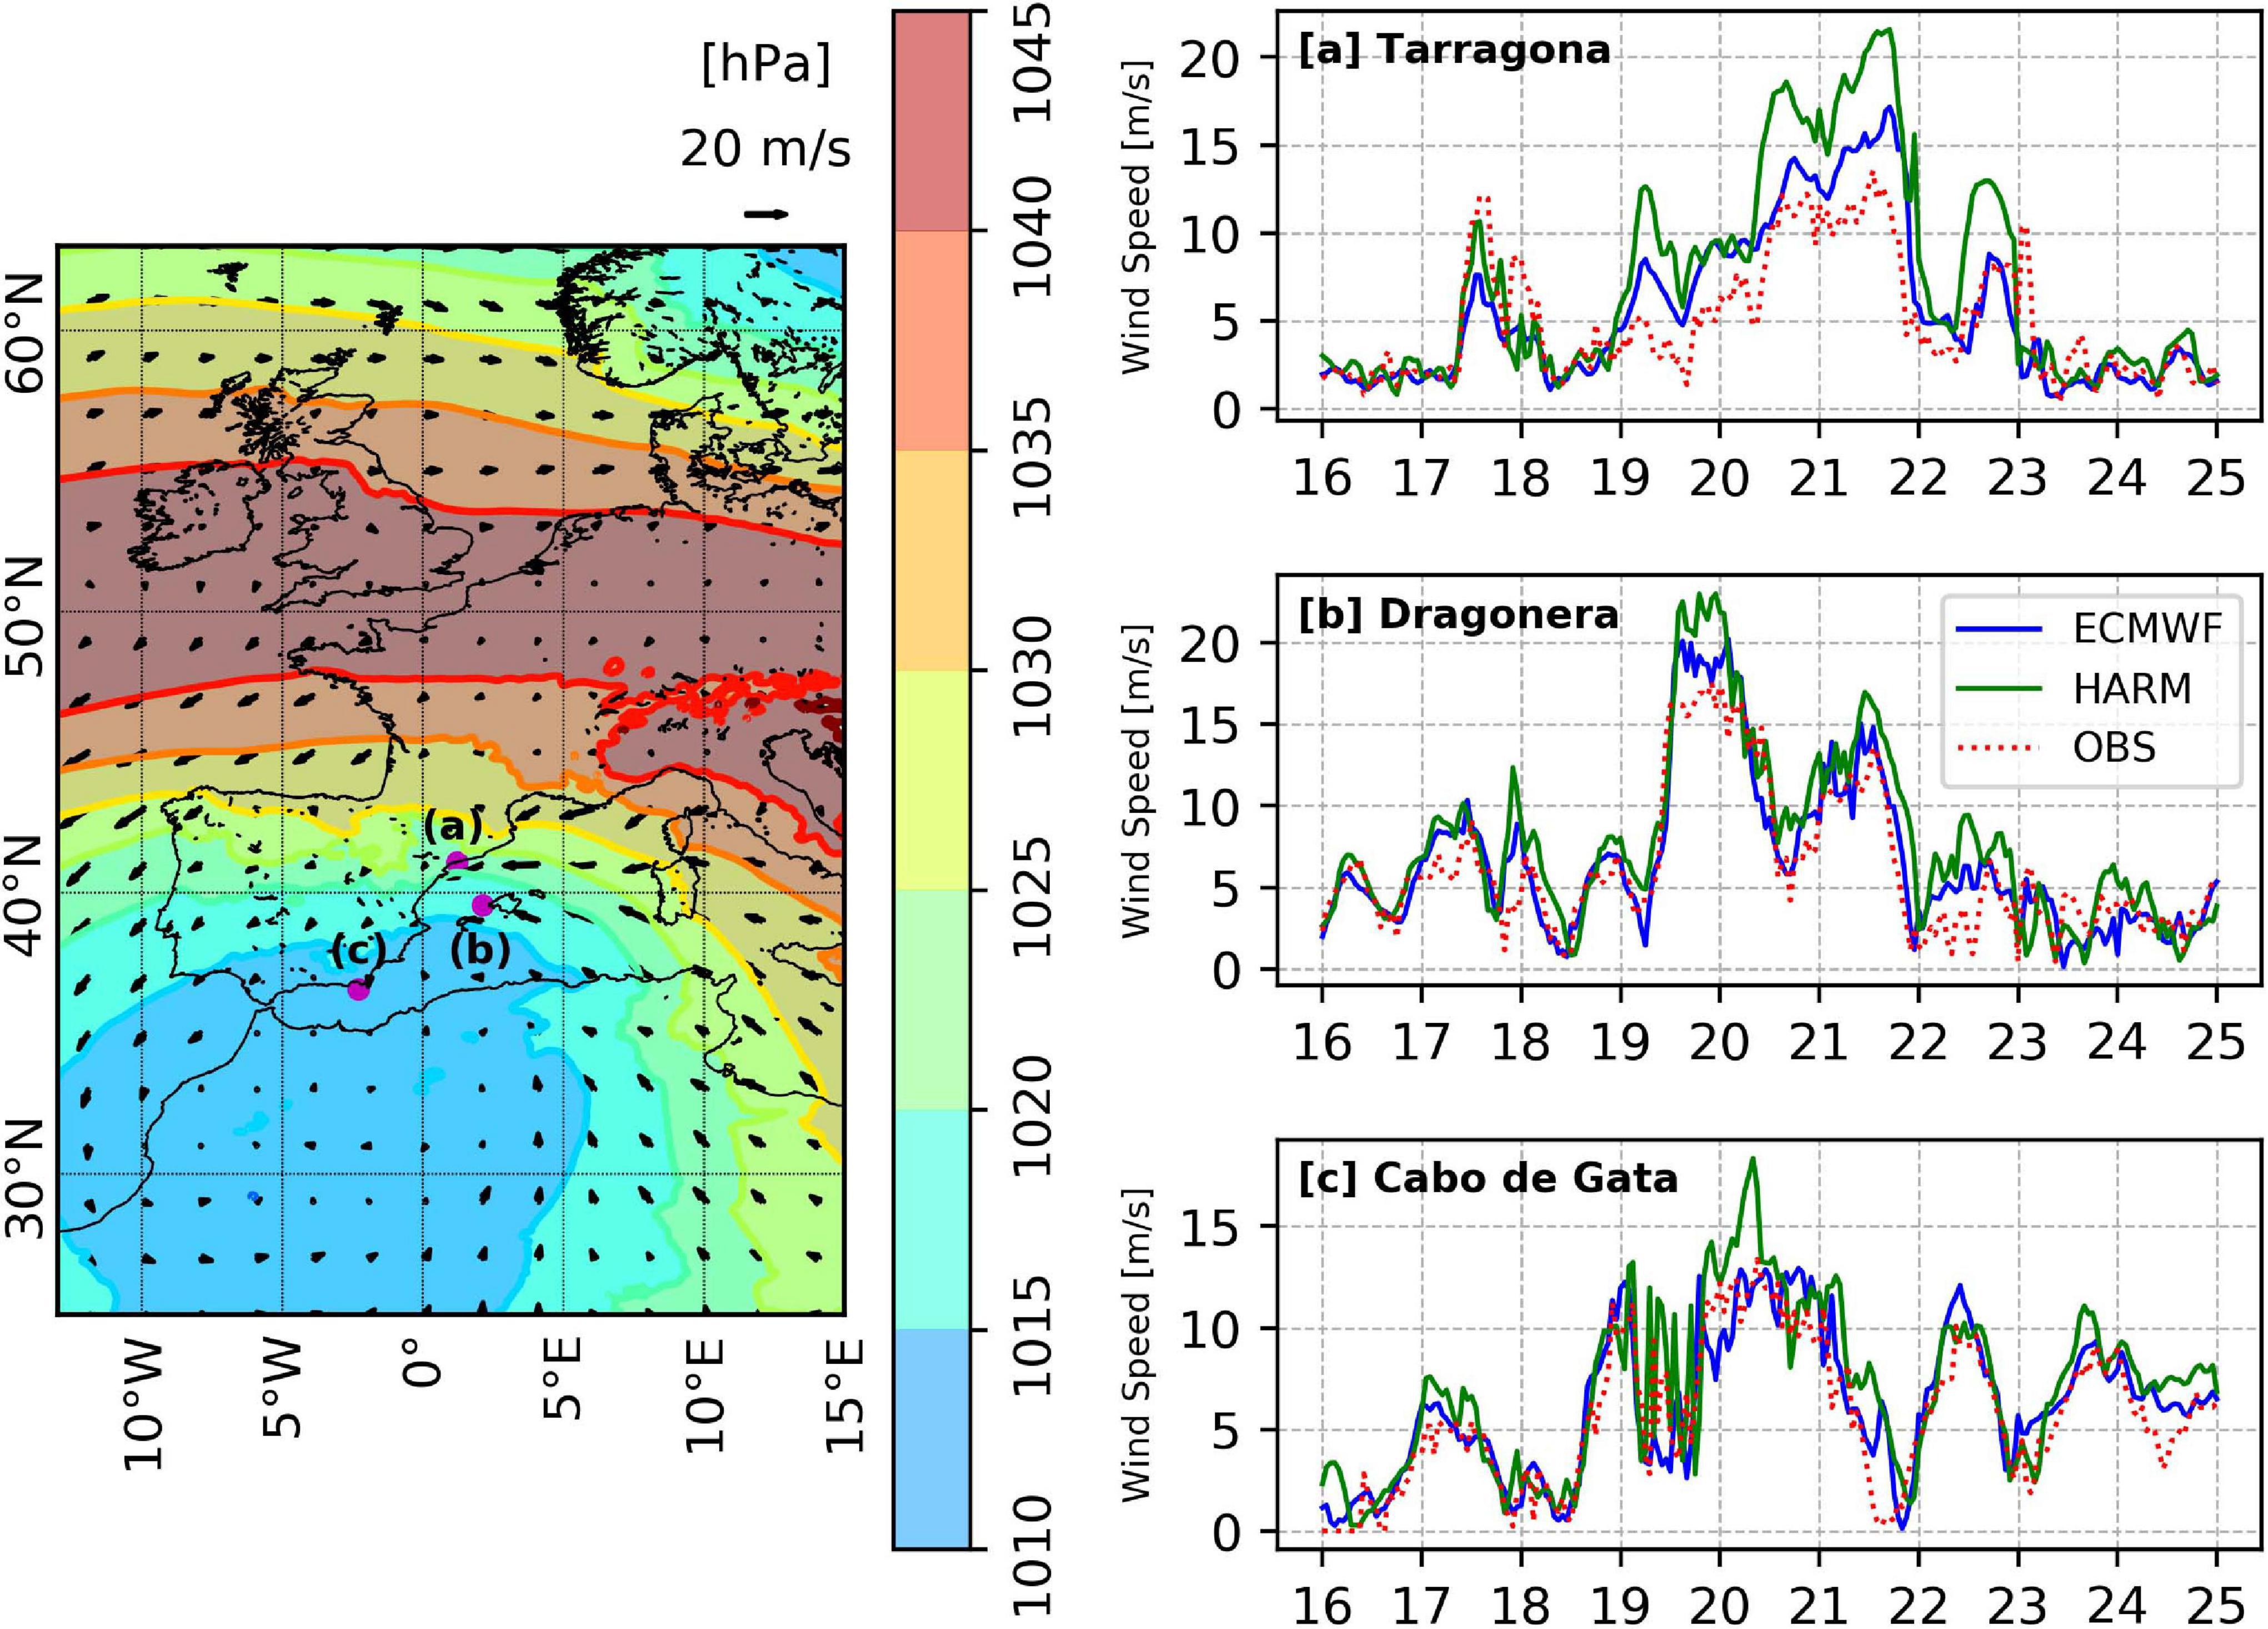
Figure 1. (left) Daily-averaged mean sea-level pressure (MSLP) and surface wind fields at Western Europe, during the storm peak (2020/01/21). The colored areas denote the MSLP and the black arrows the 10 m-wind fields. Data source: ECMWF IFS forecast model. (right) Timeseries of 10-m wind observed (red dots) and forecasted by AEMET HARMONIE 2.5 (green solid line) and ECMWF IFS systems (green blue line). Series taken at the PdE Tarragona tidal station [a], the PdE Dragonera mooring buoy [b] and the Cabo de Gata one [c].
The present work exclusively focuses on analyzing how the Storm Gloria affected the ocean circulation in the region, with emphasis on the more affected Spanish coastal areas, and on evaluating how the available operational ocean forecasting services in the area were able to predict this storm-induced ocean circulation. To this aim, the different model solutions have been validated with all the in situ and remotely sensed observations available during the storm. These data, mostly from the PdE and SOCIB operational monitoring systems and observational networks, are the same that were used during the event to make its near-real-time monitoring. Figure 2 shows the locations of the in situ platforms (mostly tide-gauge stations and mooring buoys with sensors at a 3 m depth) and the HF Radar coverages (red polygons) used to monitor the event and to perform the current multi-model validation exercise.
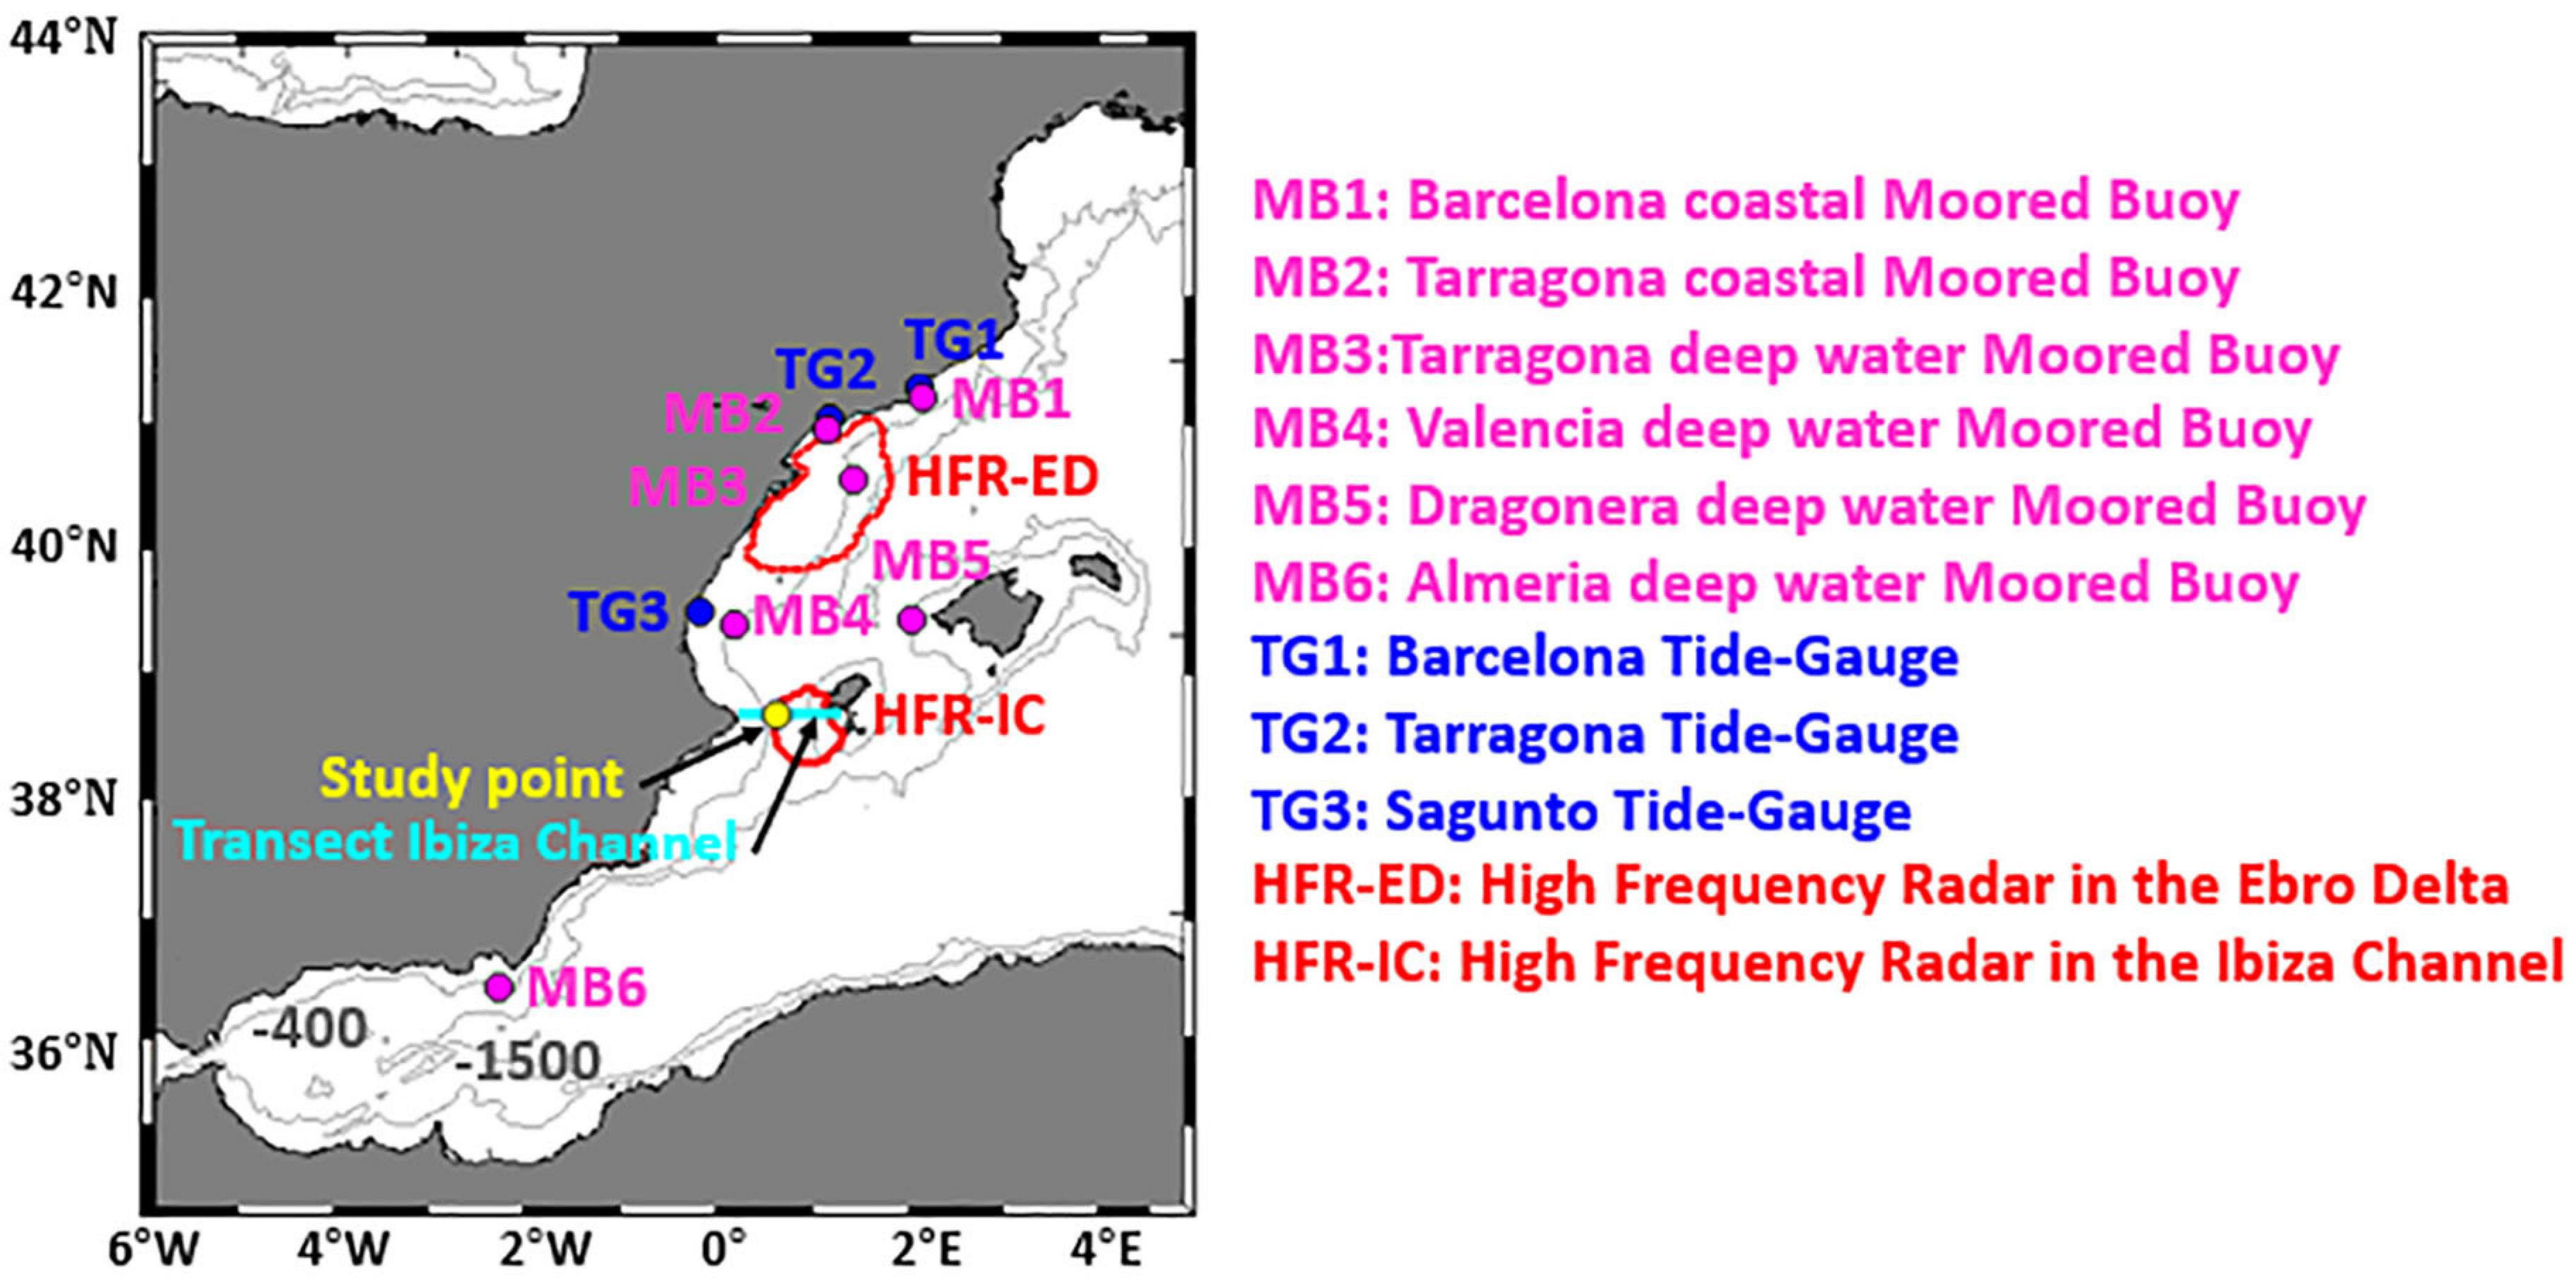
Figure 2. Location of the in situ observational stations (including mooring buoys, tide-gauges, and coastal meteorological stations) used in the model intercomparison exercise. Coverage of the two HF radars used in the study (red polygons) is also depicted.
Since this multi-model comparison is mostly focused on assessing the impacts of the Storm Gloria on the western Mediterranean ocean dynamics, the main variable that is analyzed is the surface current. However, some assessments of the surface temperature and sea level are also included as useful complementary information. Likewise, the model responses of sea surface salinity, associated with extreme precipitation events are also analyzed.
The authors emphasize that this work is only addressing the analysis of oceanographic dynamics, because it is part of a series of studies analyzing several specific aspects related to the Gloria event, including monitoring and modeling of waves, sea level evolution, and the description of coastal damages and impacts. Thus, for a more detailed description of Storm Gloria (put in context with other historical exceptional events that occurred in the region: such as the San Esteban 2008 or the November 2001 storms – Sánchez-Arcilla et al., 2008; Bolaños et al., 2009; Gràcia et al., 2013; Sánchez-Arcilla et al., 2014) or for analyses focused on the storm’s associated surge and wave states, the reader can consult Pérez-Gómez et al. (2021, unpublished data) and De Alfonso et al. (2021). With respect to the remarkably diverse coastal impacts, and especially on the severely affected Ebro Delta region (with the delta almost disappeared due to the low-lying flooding) Lorente et al. (2021) provide a specific analysis on such topic. The three last references are also published in this same issue.
CMEMS and CMEMS-Downstream Operational Ocean Forecast Products
To determine the ocean forecasting capabilities in the area, and especially the possible response that operational ocean models can provide under extreme events conditions in the region, a comparison of several state-of-the-art models has been performed. This study case combines HF radar and pointwise in situ observations with a set of operational models, some delivered by the CMEMS core service and some provided as CMEMS downstream services focused on coastal forecasting. Figure 3 illustrates the current status of the Spanish western Mediterranean waters in terms of operational model services.
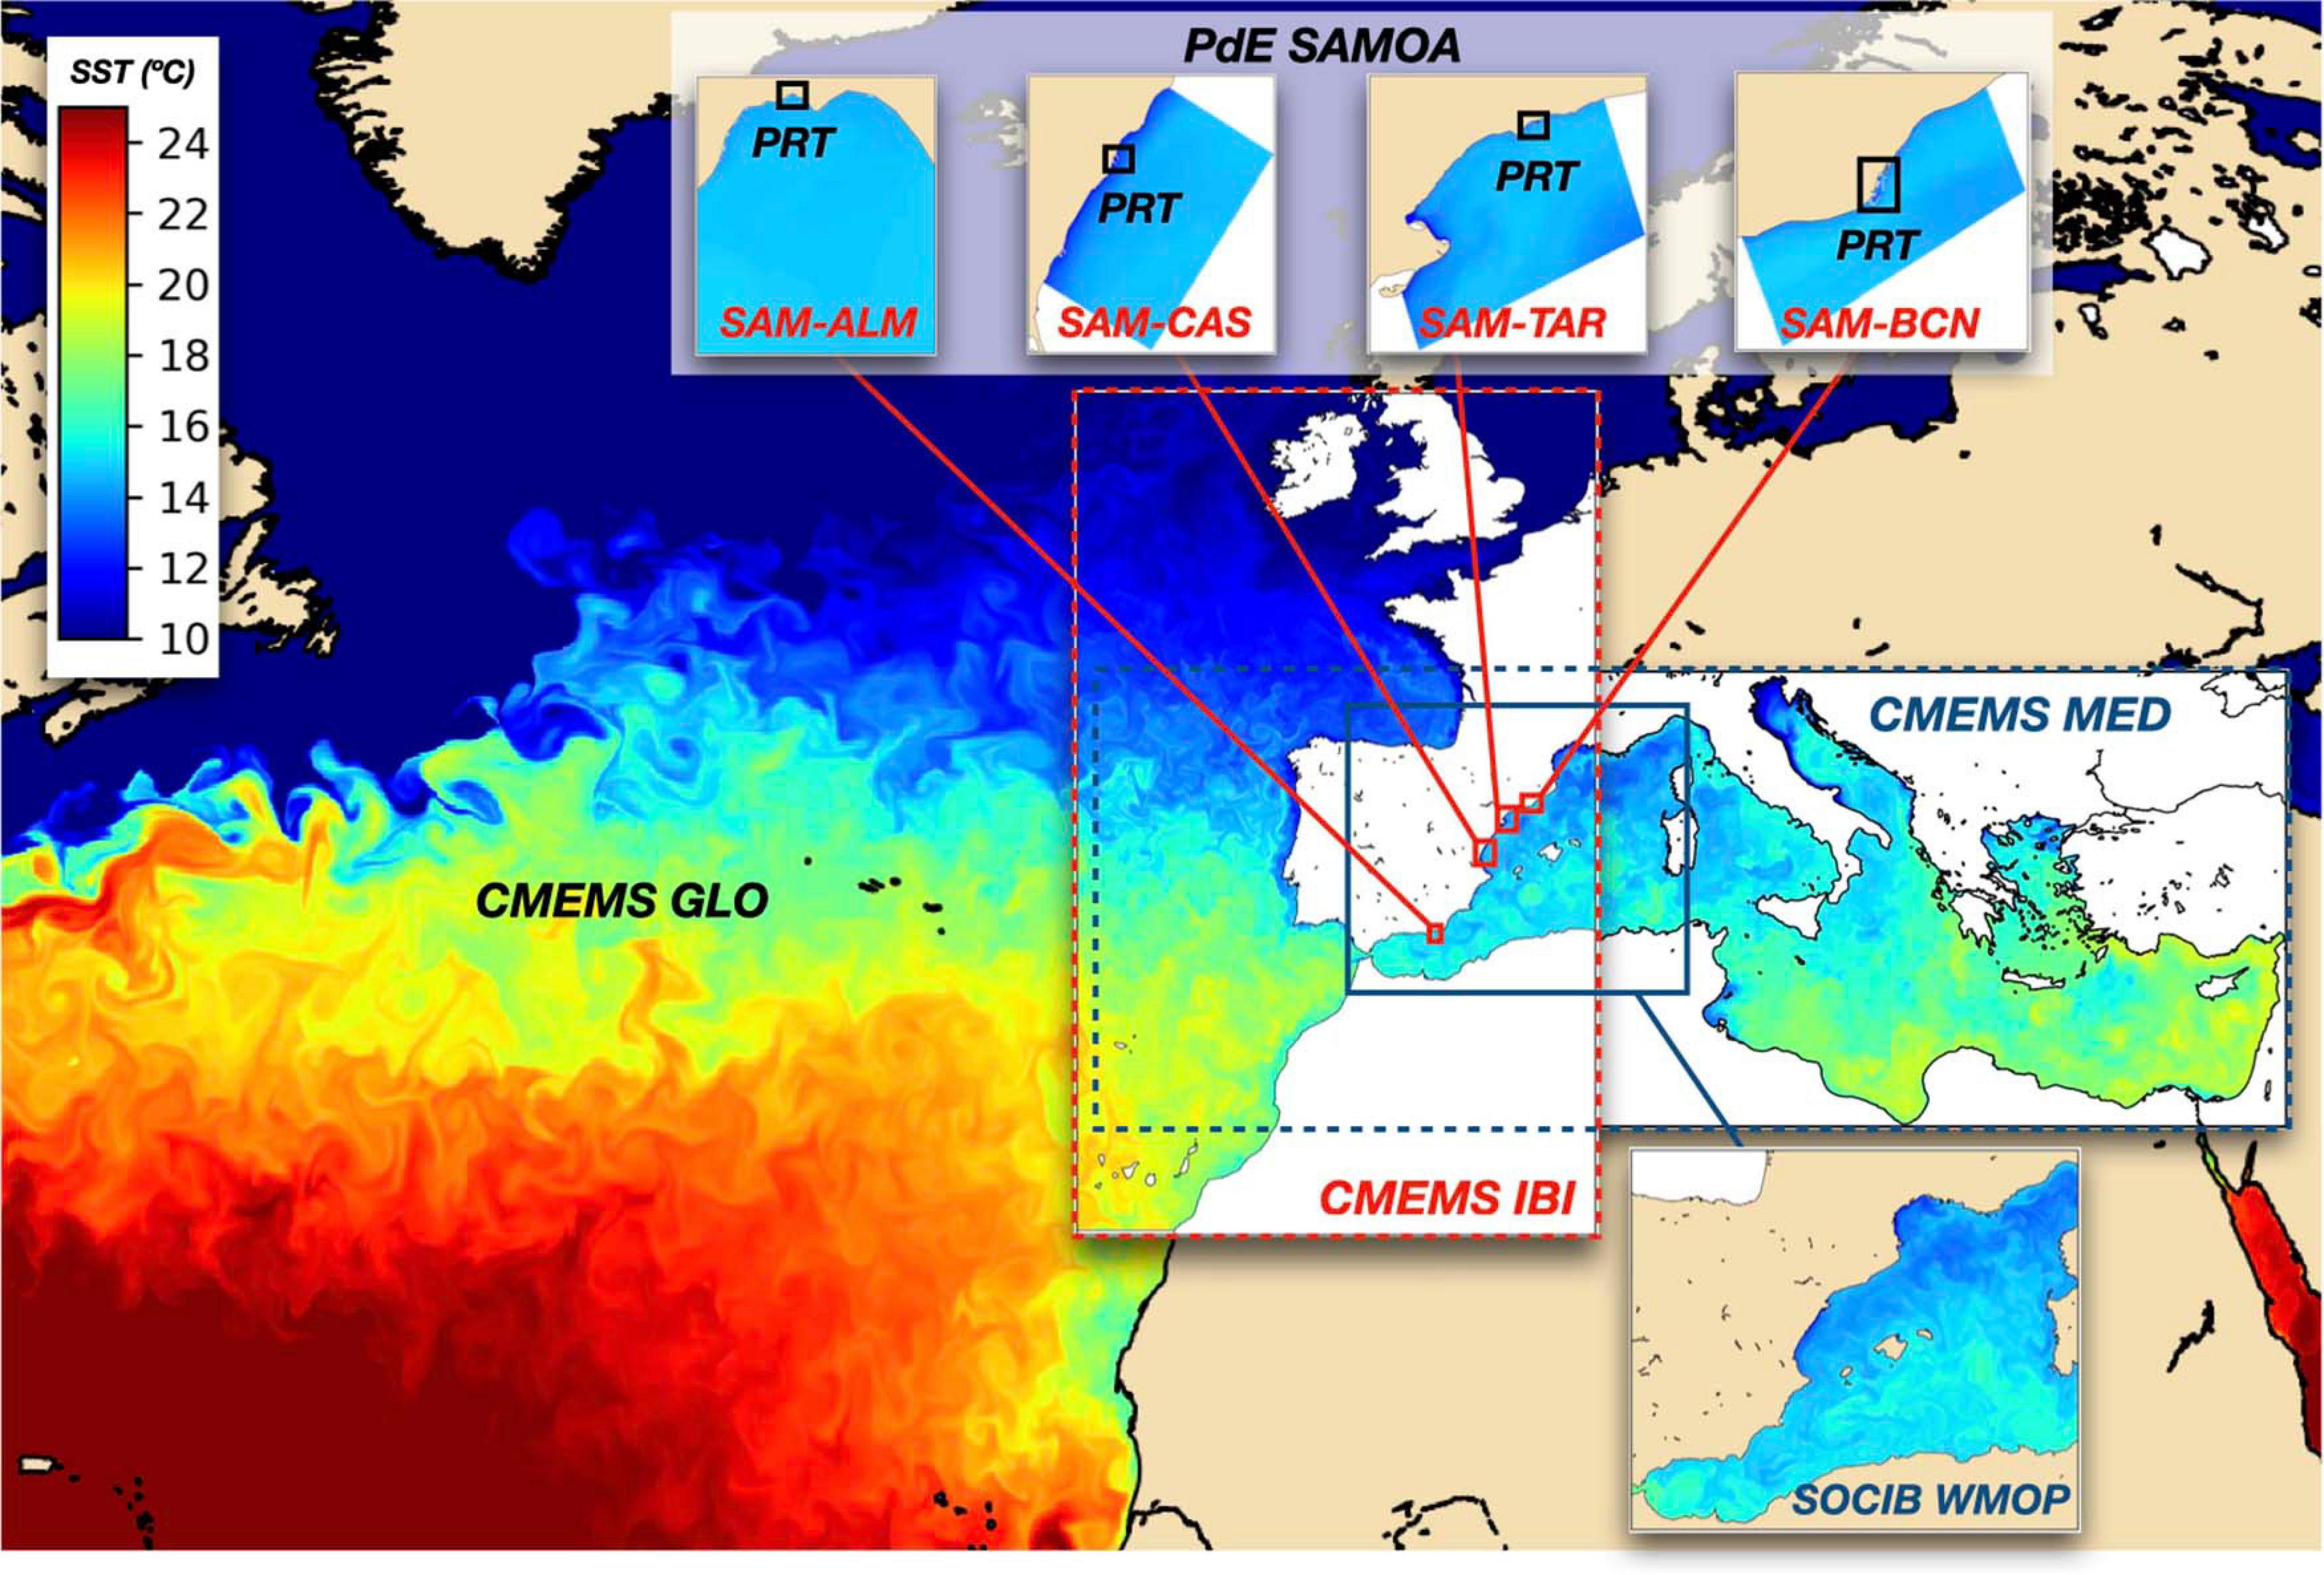
Figure 3. Map of CMEMS (GLO, IBI, and MED) and CMEMS-downstream (SOCIB WMOP and PdE SAMOA) operational ocean forecasts in the area. Links between forecast services are depicted: CMEMS regional IBI and MED systems nest into the GLO one. Coastal systems nested into CMEMS IBI and MED are depicted in red and blue, respectively.
The uneven availability, in terms of both time and spatial coverage, of instrumental observational data limits the full understanding of the regional ocean circulation during Gloria. This limitation can be overcome with the use of operational ocean forecasting systems (some of them, including analysis, generated using data assimilation systems) which provide a suitable option to investigate the mechanisms of internal variability of the surface circulation during the event. However, and because of the different mechanisms and processes incorporated into each model, the solutions obtained from the currently available operational systems can differ significantly from each other. Thus, this multi-model comparison performed for this Storm Gloria aims at (1) understanding the similarity of each model to the available observations, (2) checking the consistencies (or differences) among them, especially in coastal areas, and (3) analyzing the potential added values of the dynamical downscaling, performed both within the CMEMS framework and on the downstream side.
Whereas the basic features of the five operational ocean forecast services used in this work are summarized in Table 1, further details are provided for each forecast model service in the following subsections.

Table 1. Basic features of the five different ocean forecast systems employed in the present study.
The CMEMS Global Solution (GLO)
The CMEMS operational global ocean analysis and forecast system (Lellouche et al., 2013, 2018) provides 10 days of 3-D ocean forecasts updated daily over the global ocean. The GLO system is based on the NEMO-OPA model (Madec 2008) coupled with a sea ice model. The GLO NEMO application solves the 3-D Navier-Stokes equations, assuming the hydrostatic and Boussinesq approximations. The GLO system is driven by 3-h atmospheric forcing from the ECMWF Integrated Forecast System, reproducing the diurnal cycle with momentum and heat turbulent surface fluxes computed from bulk formulae and including radiative fluxes and rainfall fluxes in the surface heat and freshwater budgets. Pressure forcing is not included, and the GLO system does not include neither any tidal signal. Global analyses are produced on a weekly basis. Altimeter data, in situ vertical temperature and salinity profiles, and satellite sea surface temperature data are jointly assimilated to estimate initial conditions for the forecasting. The GLO products are available with a 1/12° horizontal resolution and 50 vertical levels, spanning from 0 to 5500 m. Further information on the GLO delivered products can be found in the CMEMS GLOBAL Product User Manual – PUM – (Law Chune et al., 2019).
The CMEMS Mediterranean Solution (MED)
CMEMS delivers a daily updated ocean forecast product for the whole Mediterranean Basin (Clementi et al., 2019). The physical component of this Mediterranean Forecasting System is a coupled hydrodynamic-wave model with a horizontal grid resolution of 1/24° (ca. 4 km) and with 141 unevenly spaced vertical levels. The hydrodynamics are supplied by the NEMO model while the wave component is modeled with Wave Watch-III; The MED hydrodynamic model is nested, along its Atlantic open boundary, within the CMEMS 1/12 GLO analysis and forecast system. Likewise, the Dardanelles Strait is implemented as a lateral open boundary condition, also imposed from the CMEMS GLO daily forecast, together with a daily climatology derived from a Marmara Sea box model. The ECMWF atmospheric forcing at 1/8° is used (atmospheric data with a 3-hourly frequency for the first 3 days of forecast and with 6-h frequency for the analysis period). The water balance is computed as evaporation minus precipitation and runoff, with the evaporation derived from the latent heat flux, the daily averaged precipitation provided by ECMWF and the runoff described using monthly mean climatological datasets for the 39 major Mediterranean rivers. The model solutions are corrected by a variational data assimilation scheme (3DVAR) of vertical temperature and salinity profiles and along-track Sea Level Anomaly satellite observations. Further details on the coupled system and its quality can be found in Clementi et al. (2020).
The CMEMS Iberian-Biscay-Irish Solution (IBI)
The CMEMS regional solution for the European Atlantic façade (Sotillo et al., 2015) is based on a NEMO 1/36° model application and covers part of the western Mediterranean. This extended IBI model coverage allows CMEMS to enhance its offer in terms of ocean prediction, delivering three core forecast products in the area.
The IBI model system provides daily updated 5-day forecasts including high-frequency processes of paramount importance to characterize regional scale marine processes (e.g., tidal forcing, surges related to high-frequency atmospheric forcing, and freshwater river discharges) in the Atlantic shelf areas). The IBI forecast is set up as a dynamical downscaling of the CMEMS GLO solution, with GLO forecast data imposed as boundary conditions, complemented by 11 tidal harmonics built from tidal model solutions. The atmospheric pressure component, missing in the large-scale parent system sea level outputs, is also included by assuming pure isostatic response at the open boundaries (inverse barometer approximation). The IBI forecast run is forced every 3 h with atmospheric fields derived from the ECMWF forecast system. An empirical bulk formulation is used to compute latent sensible heat fluxes, evaporation, and surface stress, while, solar penetration is parameterized with a scheme that considers attenuation derived from climatological satellite ocean color imagery. Further details on the IBI (1/36°, 50 levels) model application and on its capacities to perform in coastal and shelf areas can be found in Aznar et al. (2016). Since 2018, the IBI system produces analysis on a weekly basis. Altimeter data, in situ vertical temperature and salinity profiles, and satellite sea surface temperature data are jointly assimilated to estimate initial conditions for the IBI model forecasts. Further information on the IBI delivered products can be found in the CMEMS IBI Product User Manual – PUM (Amo et al., 2019).
The PdE Coastal Solution (SAMOA)
The PdE SAMOA service for Spanish Port Authorities includes high-resolution coastal operational prediction systems in domains such as harbors and nearby coastal waters. This PdE SAMOA ocean coastal forecast service (Sotillo et al., 2019) is currently fully operational (and gives service since January 2017) at 10 Spanish ports in the Mediterranean, the Iberian Atlantic side and the Canary Islands. Each SAMOA model application is based on the ROMS model (Shchepetkin and McWilliams, 2005) and consists of two nested regular grids with a spatial resolution of ∼350 m and ∼70 m for the coastal and harbor domains, respectively. The vertical discretisation consists of 20 sigma levels for the coastal domains (except for the Canary set-ups, in which 30 levels are used where due to the deepest bathymetry) and 15 levels for all the port domains. To provide a sufficiently detailed representation of bathymetric features, the SAMOA bathymetries result from combining global (GEBCO) and specific local data sources in the port (being the last one regularly updated). The SAMOA models are nested into the CMEMS IBI regional ocean forecasts described above (with daily updates of this forcing data). At the sea surface, the SAMOA models are driven by high frequency (hourly) wind stress, joint with atmospheric pressure and fluxes of water (evaporation minus precipitation) and surface heat derived from the Spanish Meteorological Agency forecast (based on the AEMET HARMONIE model 2.5 km application nested into the ECMWF IFS forecast). To consider some land-sea interactions, some SAMOA model set-ups include forcing due to freshwater discharges from the main rivers, using climatological data. This is the case for the SAMOA domains of Barcelona and Tarragona used in this work, which include the freshwater contribution of the Llobregat and Ebro rivers, respectively.
The use of SAMOA products in this study is limited to those systems covering the Spanish Mediterranean coastal areas affected by the Storm Gloria (i.e., Barcelona, Tarragona, Castellón and Almeria). Furthermore, in this multi-model exercise, only the coastal SAMOA products are used, discarding the higher-resolution harbor domains due to their very limited spatial coverage. Geographical coverages of the SAMOA systems used herein are shown in Figure 3.
The SOCIB Regional Solution (WMOP)
The Western Mediterranean Operational system (WMOP, Juza et al., 2016; Mourre et al., 2018) downscales CMEMS-MED ocean conditions to provide refined simulations with a 2 km horizontal resolution over the Western Mediterranean Sea. It is based on the ROMS modeling system (Shchepetkin and McWilliams, 2005), using 32 terrain-following vertical levels, which results in a vertical resolution between 1 and 2 m at the surface. The high-resolution HARMONIE model from the Spanish Meteorological Agency (AEMET) provides the surface atmospheric forcing through the application of bulk formulae (Fairall et al., 2003). The turbulent vertical mixing of momentum and tracers is computed through the generic model of the two-equation Generic Length Scale turbulence closure scheme (Umlauf and Burchard, 2003, with parameters p = 2.0; m = 1.0; n = −0.67 as in line 1 of their Table 7).
The Western Mediterranean Operational system is used to generate 72-h daily predictions made available on the SOCIB website2 together with near real-time comparisons with recent observations. Details of the forecasting system and further model evaluations can be found in Juza et al. (2016), Mourre et al. (2018), and Aguiar et al. (2020). In particular, by analyzing downscaling effects in a free-run WMOP simulation, Aguiar et al. (2020) showed that the 2 km-resolution simulation was able to improve the mean circulation pattern in the Balearic Sea with respect to its parent model. The WMOP prediction system includes assimilation of satellite sea level and sea surface temperature measurements, as well as Argo temperature and salinity profiles and Ibiza Channel High-Frequency radar velocities, using the Ensemble Optimal Interpolation method described in Hernandez-Lasheras and Mourre (2018). The model was successfully used in a number of recent applications including the analysis of larval drift (Calò et al., 2018; Kersting et al., 2020), plastics or parasite dispersion (Cabanellas-Reboredo et al., 2019; Ruiz-Orejón et al., 2019; Compa et al., 2020), simulation of high-resolution observations (Fablet et al., 2018; Gómez-Navarro et al., 2018) or for dedicated products designed for instance for beach lifeguards or sustainable marine resources managers (Heslop et al., 2019).
Results
How Was Storm GLORIA Forecasted by CMEMS Ocean Models?
Three CMEMS models (GLO, MED, and IBI) cover the area that was most damaged by the Storm Gloria. This area of study is delimited by the Iberian Mediterranean coast and the Strait of Gibraltar to the west, the Gulf of Lions to the north, Corsica and Sardinia to the east and the North African coastline to the south. The comparison of the CMEMS models solution has been focused on daily-averaged sea surface currents, height, salinity and temperature, within the 6 days period between the 18th and 23rd of January 2020, i.e., 2 days before the impact of the Storm Gloria, the following days when the storm was at its peak and its effects were particularly damaging, and finally when the storm reduced in intensity in the region as it moved toward the central Mediterranean.
As for the general circulation patterns forecasted by the CMEMS models during these days, MED and particularly IBI present more complex mesoscale structures than GLO (Figure 4), mainly due to their higher resolution (1/12° in GLO, but 1/24° in MED and 1/36° in IBI). In any case, the three models feature, in the studied region, well-known patterns widely referred to in the literature (Béthoux et al., 1999; Pinardi and Masetti, 2000): the presence of the Atlantic Water jet entering the Alboran Sea through the Strait of Gibraltar, the Ligurian-Provençal-Catalan current hugging the north-eastern Iberian coastal area from the Gulf of Lion toward the southwest, and the Algerian current flowing along the north African coast, being the two latter structures more stressed in the MED and IBI solutions. On the 19th of January, MED and GLO model solutions share more similarities than IBI at first sight. In all the CMEMS model solutions, the Ligurian-Provençal-Catalan current is present, showing decreased intensities as it moves coastward.
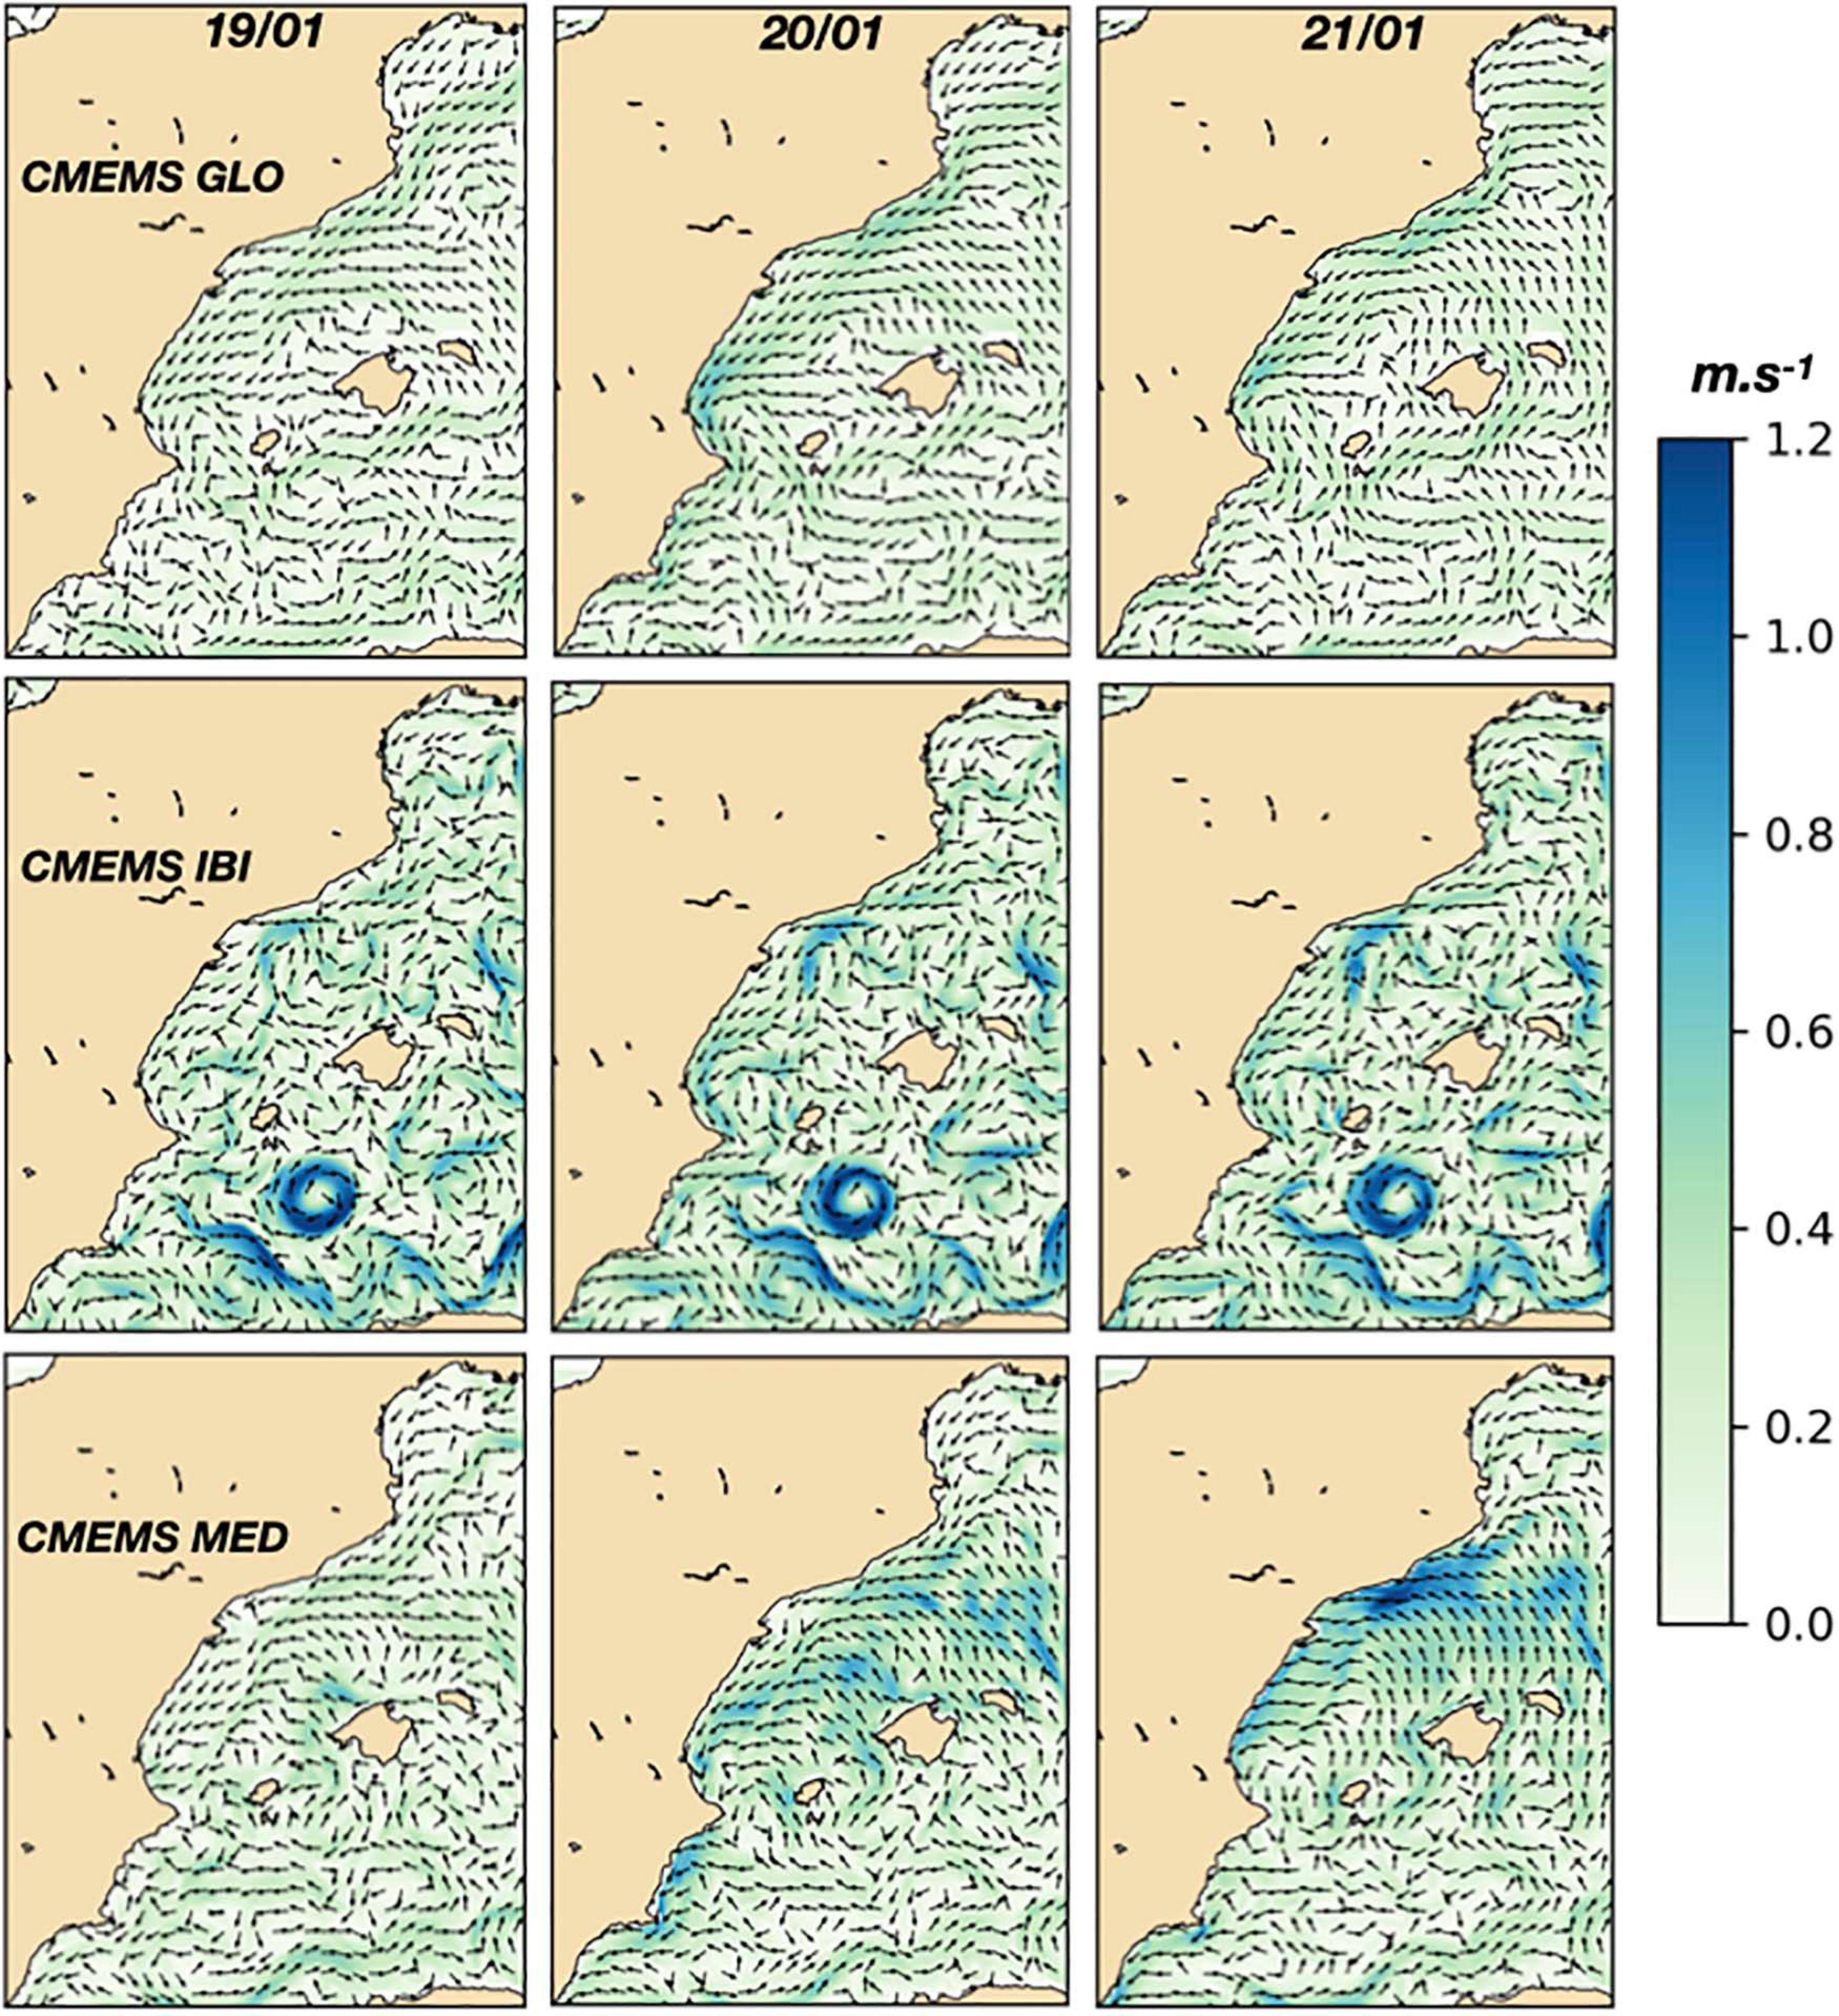
Figure 4. CMEMS GLO (top), IBI (middle), and MED (bottom) operational forecasts of surface currents (in m.s– 1; normalized vectors indicate current direction) in the area for the 19th (left), 20th (middle), and 21st (right) of January 2020.
On the contrary, when the low associated with Gloria moves onward to the western Mediterranean on the 20th of January, all three CMEMS models start to show an intensified current oriented toward the eastern Iberian coastline, reaching up to 1 m.s–1 in both MED and IBI predictions. The most visible changes with respect to the previous day appear in the MED model results, where a perceptible north-westward to westward current settles in the Catalano-Balearic Sea, a pattern that is not discernible in neither the GLO nor the IBI outputs.
It is worth noting that IBI displays on these days a set of intricated mesoscale meanders and eddies south of the Balearic Islands, that are not apparent, at least with the same intensity, in the other two CMEMS models. This kind of features are frequently reproduced by IBI in that particular area, independently of weather conditions and they do not seem related to the Storm Gloria; despite being quite eye-catching, they are located out of the target area affected by Gloria and their analysis is not considered here.
No significant evolution is perceived the day after (21st of January) in GLO and IBI currents, with maintained offshore structures. By contrast, the aforementioned vast sharp pattern in MED tends to move toward the north-eastern Iberian coasts, strengthening and turning to a more northward component in open waters. As it approaches the north-eastern Iberian coastline, the current shifts to a clearer westward surge, impacting directly on these coastal areas. In addition, the MED westward currents increase in intensity on this day as they get closer to the coast, exceeding 1.2 m.s–1 in the vicinity of the Catalan coast. Interestingly enough, the persistence of these intensified current patterns toward the coast during the Gloria event, results in the three CMEMS models projecting a sharp increase of the sea surface height along the Mediterranean Iberian coastal areas [not shown, Pérez-Gómez et al., 2021 (unpublished data; this issue)]. The piling up of water mass fluxes, mainly driven by wind-induced currents and barotropic transports from the Adriatic and the Eastern Mediterranean becomes evident in the Western Mediterranean at two specific coastal areas: the Ebro Delta and Gandía.
In general, the currents intensification projected by the CMEMS models for the 20th of January agrees with the in situ observations recorded by the deep-water buoys. Figure 5 shows the observed and modeled timeseries at the Tarragona and Valencia mooring. As shown in this figure, the setting of an westward current and its increased speed evidenced by the buoy data is also present in GLO (black line) and particularly in MED (green line). At Tarragona buoy location, the observed current speed spike is fairly well detected by MED and GLO, with correlation values for both models of roughly 0.40 during the Gloria event (see Table 2), compared to the lower MED and even negative GLO values obtained for the period prior to the storm (0.32 and −0.14, respectively). At Valencia buoy, the maximum current speed peak detection is less performant in both MED (correlation of 0.16 vs. 0.21 for pre-Gloria period) and GLO (0.18 vs. 0.37). As for IBI (red line), even though the peaks at both buoys are detected, they seem to be more masked due to IBI’s high variability, since other maxima, possibly linked to the presence of particular structures affecting the model solution at the buoy location point, are also revealed earlier in January. This results in an acceptable IBI capture of the Valencia buoy speed spike (0.41 of correlation compared to 0.07 for the pre-Gloria days), but a poor performance at the Tarragona one (0.13 during the Gloria event and −0.12 for previous days). In fact, variability is more pronounced in IBI than in the two other CMEMS models at both buoy locations, although probably more due to the presence of nearby mesoscale eddies such as those seen in Figure 4 than to an appropriate detection of the real high frequency variability. On the other hand, the GLO smaller temporal variability may be mainly related to its lower resolution and to lacking physical processes (i.e., barotropic transport due to atmospheric pressure and tides). In any case, although the CMEMS models catch the general increase of current speed caused by Gloria, none of them seems able to properly capture the observed in situ high frequency variability. Another interesting aspect highlighted particularly by the Valencia timeseries is that no model can effectively reproduce the duration (roughly 1 week) of the strong currents episode that was measured by this deep-water buoy. Note that discussion on the performance of the high resolution WMOP and SAMOA models (timeseries also shown in the Figure 4) is later provided in the specific Sections dedicated to these coastal downstream services.
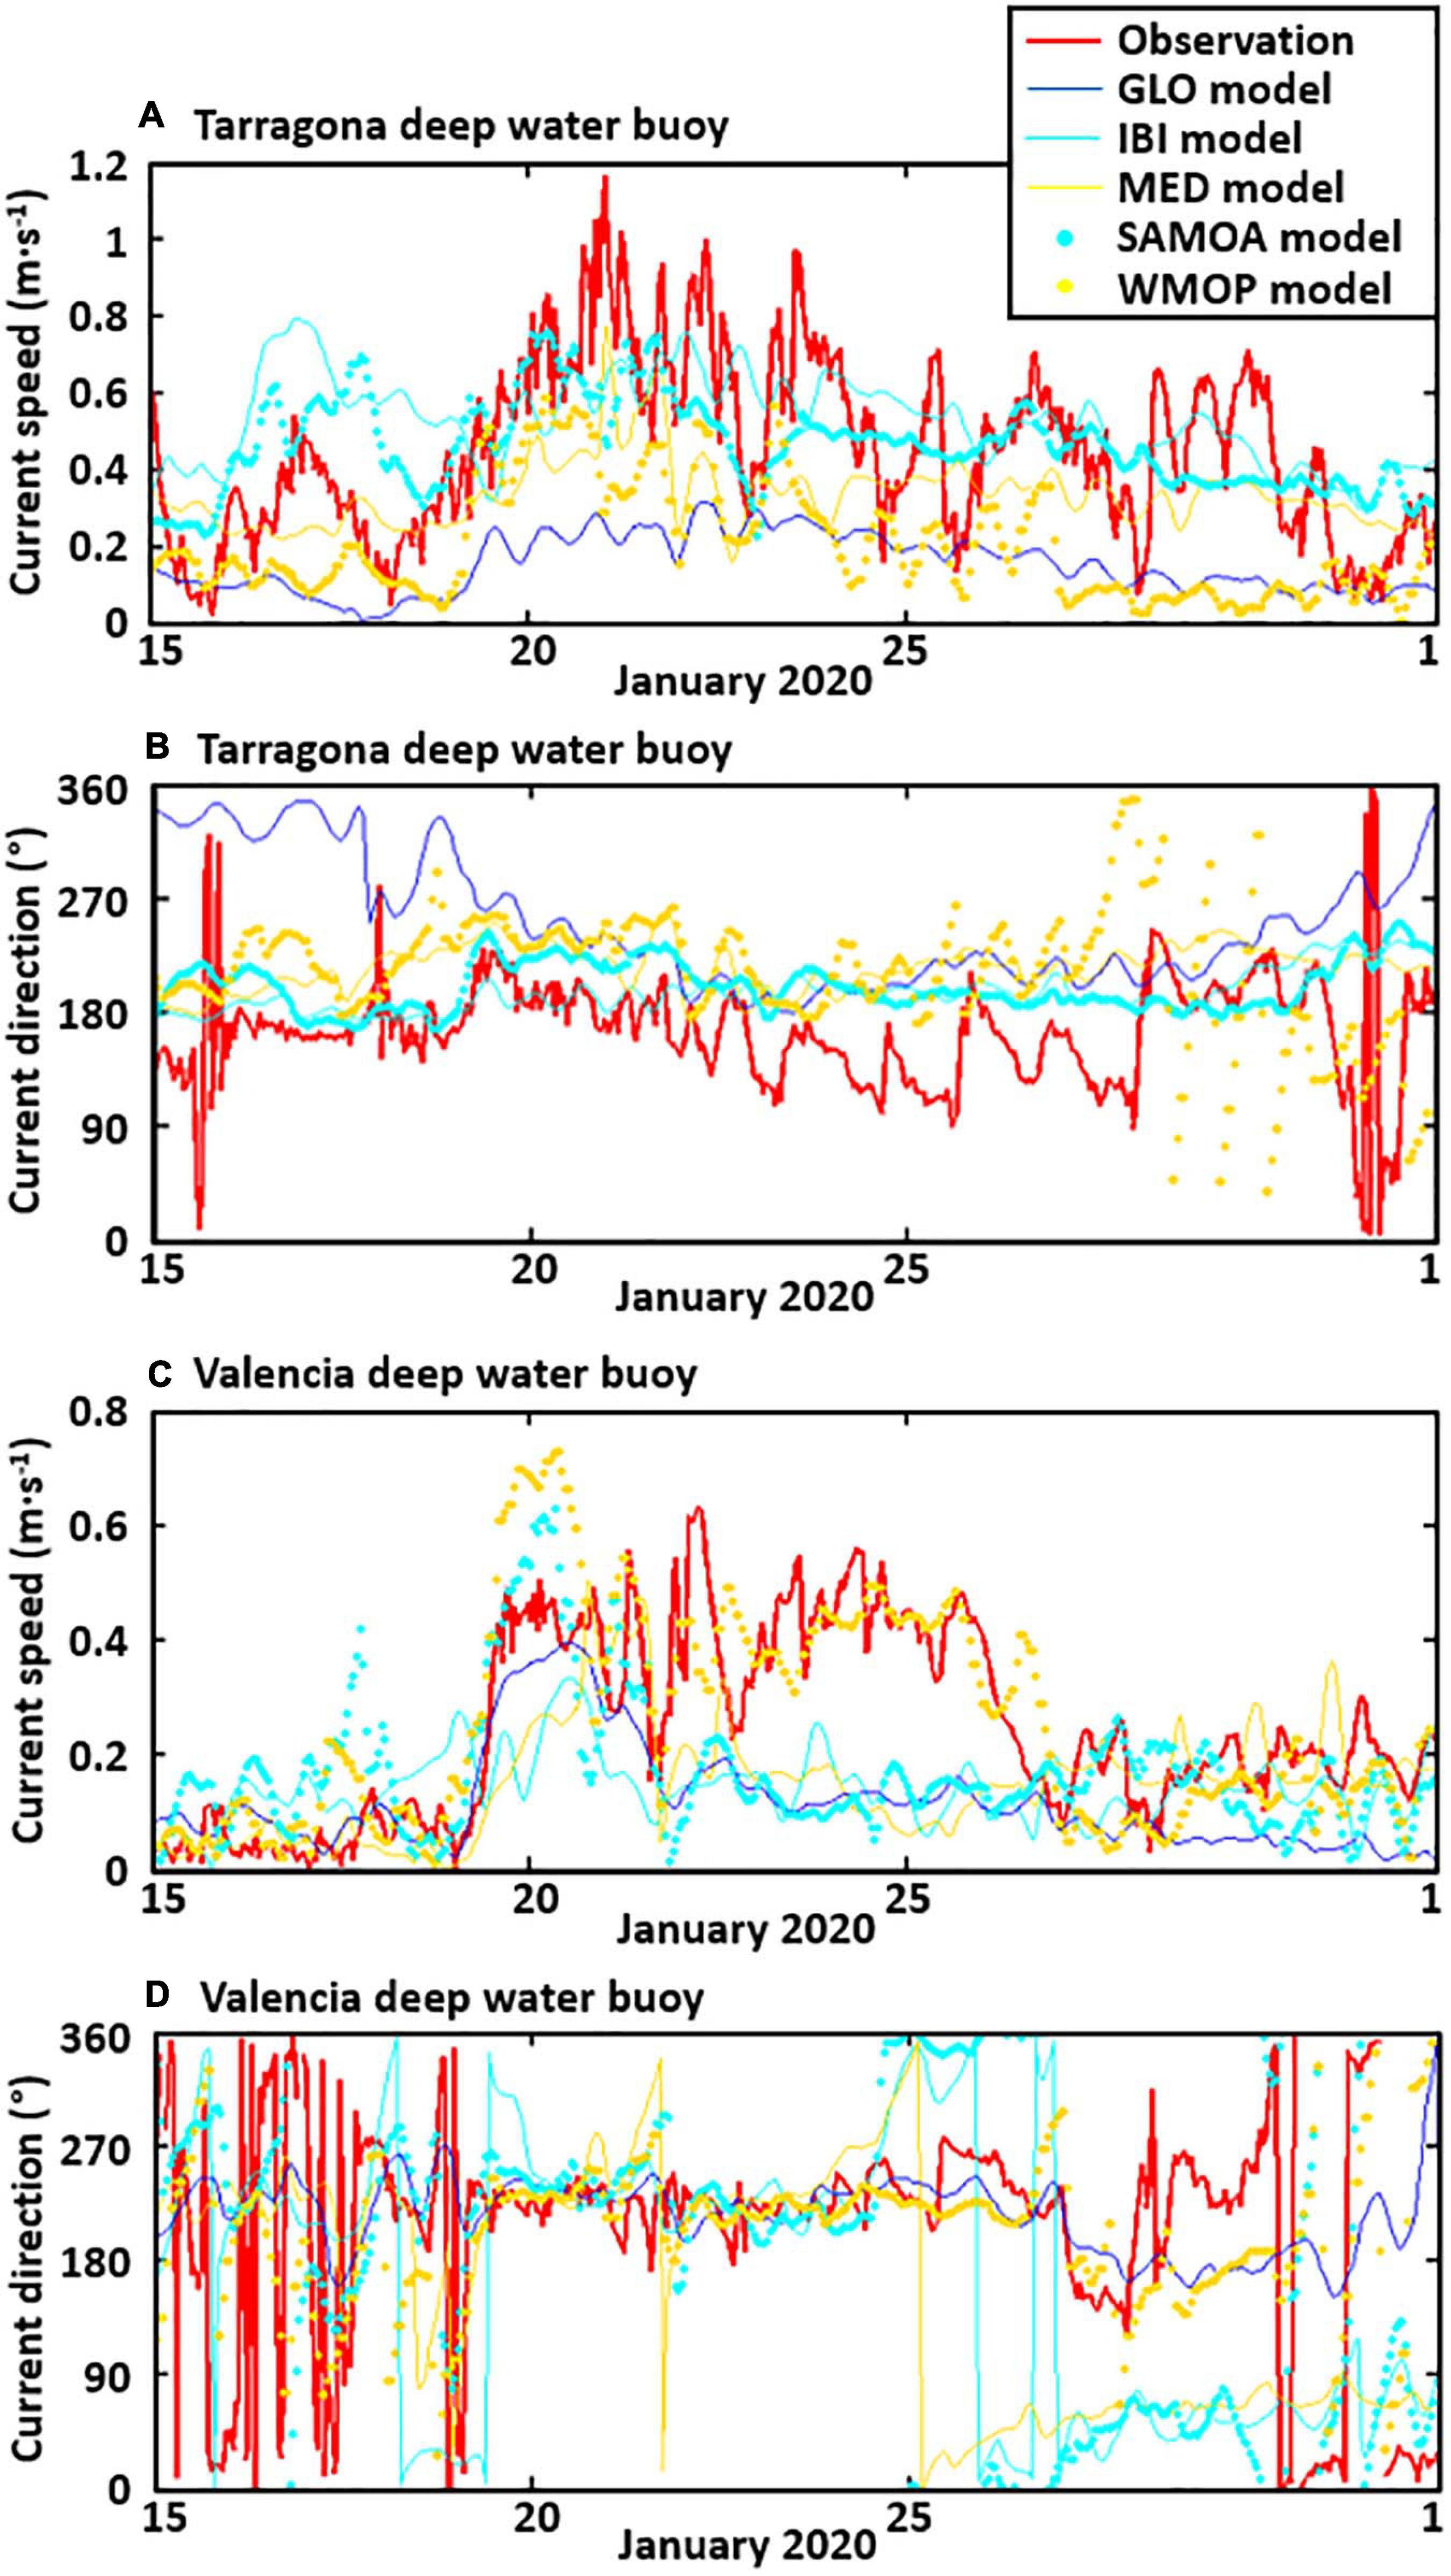
Figure 5. Validation of operational ocean models with in situ observations buoys: Timeseries of surface current [speed (in ms−1) and direction (deg)] at Tarragona (A,B, respectively) and Valencia (C,D) moorings. Observed and simulated (by the five model services: CMEMS GLO, IBI, MED, and SOCIB WMOP and PdE SAMOA) timeseries depicted.
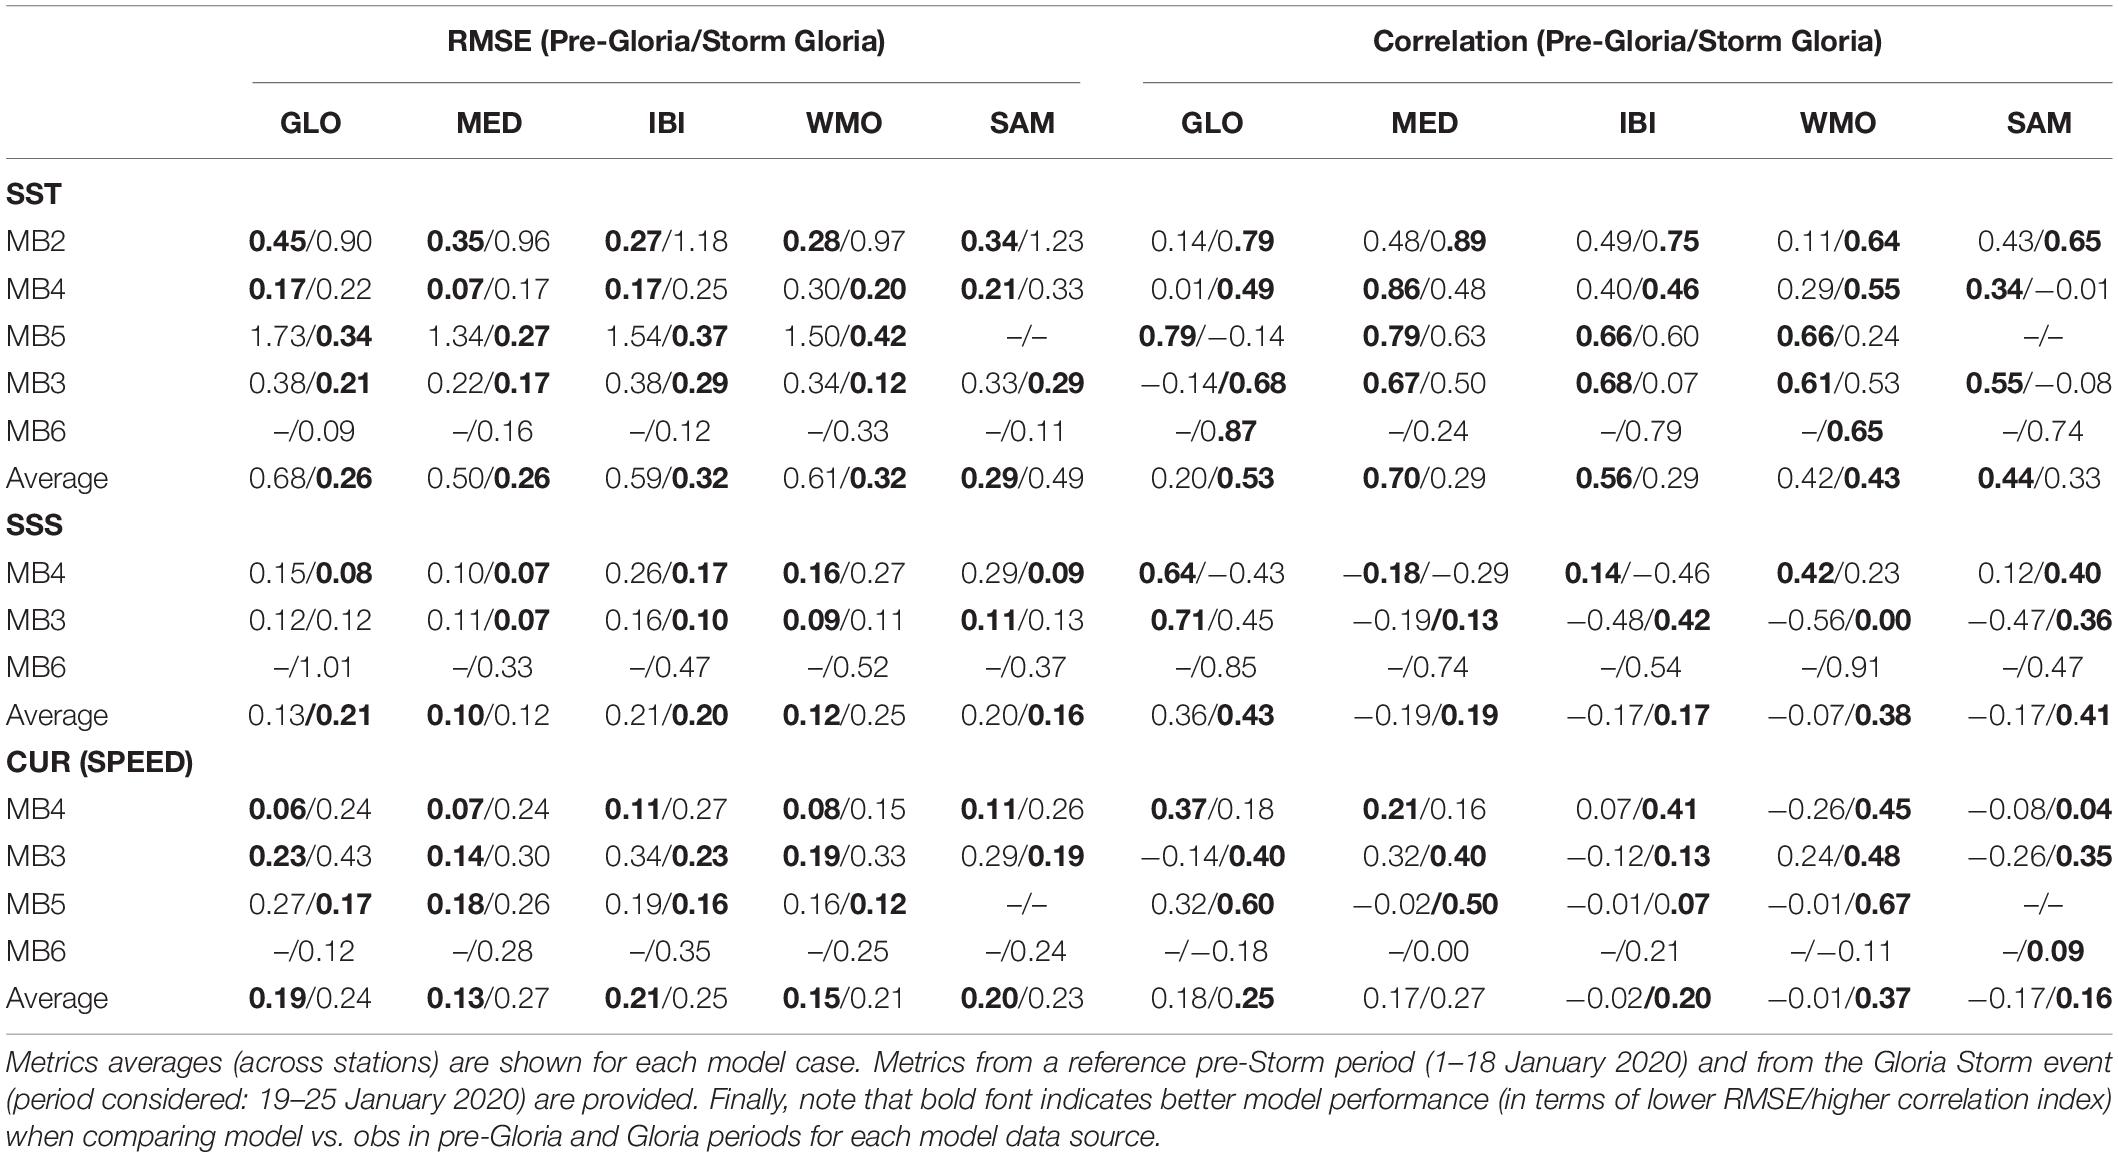
Table 2. Model validation metrics (RMSE and correlation values) computed for the five different models when compared with observations of Sea Surface Temperature (SST), Salinity (SSS), and Current speed (CUR) at the different mooring buoys available during storm Gloria.
Together with the buoys, the high-frequency (HF) radar deployed close to the Ebro delta provides surface current estimations to validate the circulation patterns modeled by GLO, IBI and MED near the eastern Iberian coastline, during the Gloria event. Unlike before the arrival of Gloria on the 19th of January, when the Ligurian-Provençal-Catalan current is visible but presents a moderate velocity, the HF radar illustrates during the following 2 days (20th and 21st), both a perceptible intensification of the surface currents and a broadening of the strong currents zone as a direct response to the intense winds, as shown in Figure 6. This intensification and expansion is slightly observed in GLO, whereas IBI, which depicts intricate structures already seen in Figure 4 and a boost in the current speed on the 20th, does not predict the observed spread of intense currents on the 20th and 21st. With regards to MED, the weak Ligurian-Provençal-Catalan current existing on the 19th distinctly turns the following days into a wider area of acute north-easterly currents.
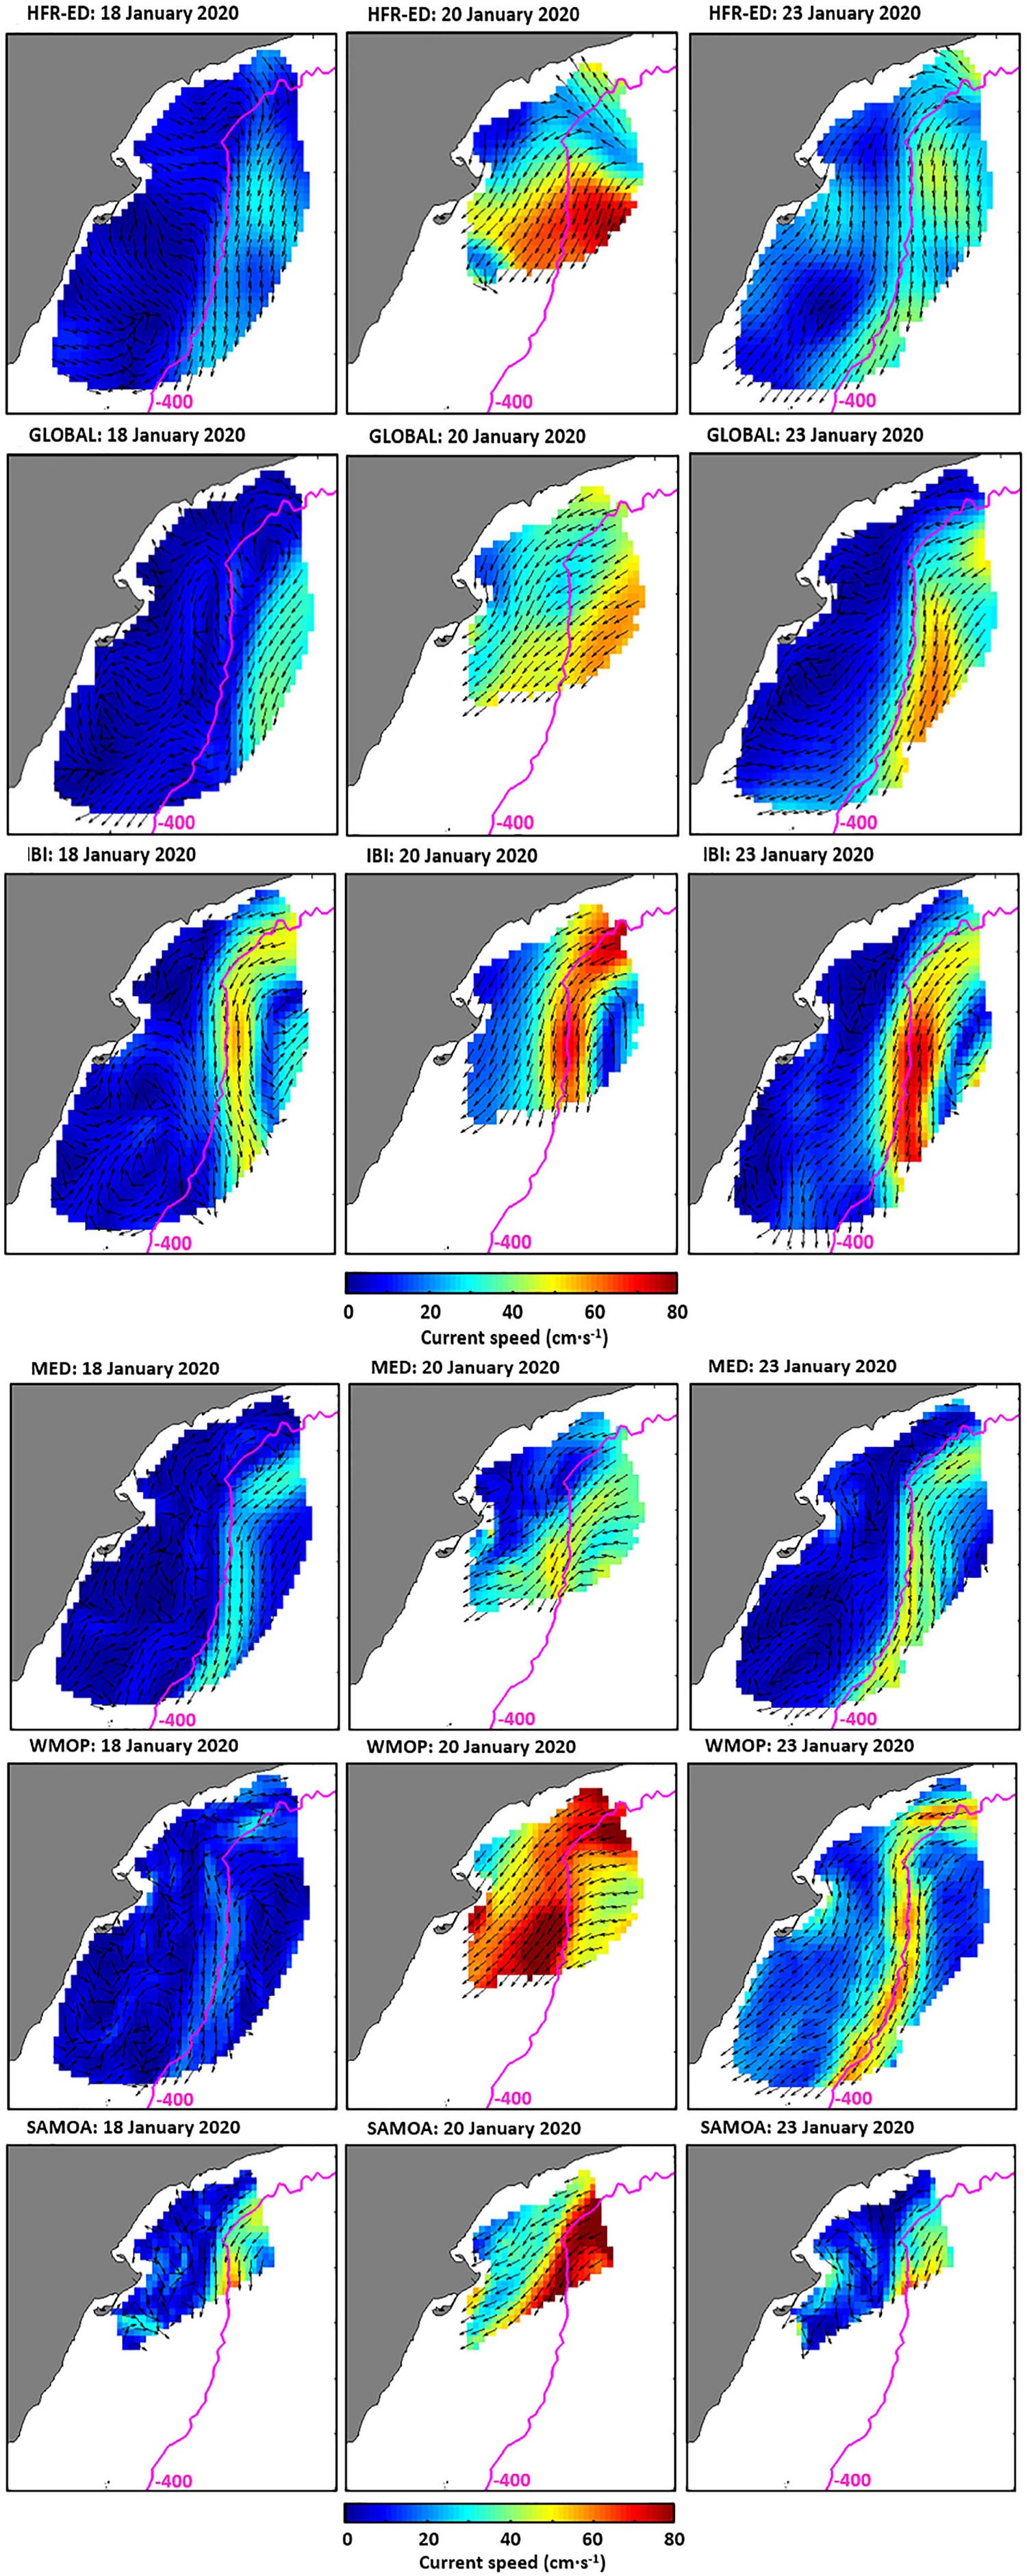
Figure 6. Model validation with HF radars observations: currents at the Ebro delta observed by the HF radar (1st row) and simulated by GLO (2nd row), MED (3rd row), IBI (4th row), WMOP (5th row) and SAMOA (6th row), on the 19th (1st column), 20th (2nd column), and 21st (3rd column) of January. Model validation with HF radars observations: currents at the Ebro delta observed by the HF radar (1st row) and simulated by GLO (2nd row), MED (3rd row), IBI (4th row), WMOP (5th row) and SAMOA (6th row), on the 19th (1st column), 20th (2nd column), and 21st (3rd column) of January.
This qualitative comparison against HF radar maps is complemented with a variety of skill metrics (RMSE and temporal correlation), spatially averaged over the common domain, to provide further insight into the models’ performance (Table 3). Note that the specific geometry of the HF radar domain handicapped the accuracy of the total current vectors resolved at each grid point. Such a source of uncertainty is quantified by the GDOP (Geometrical Dilution of Precision), a dimensionless parameter that typically increases with distance to the land-based radar stations (Chapman and Graber, 1997). Therefore, to perform consistent comparisons between models and the HF radar, all those grid points with higher GDOP (i.e., affected by higher uncertainties) were removed from the analysis (see Lorente et al., 2021, for further technical specifications). Since we discarded the outer limits of the HF radar footprint, the comparisons were undertaken using the zonal (U) and meridional (V) current components over the continental shelf (with depths above 400 m).
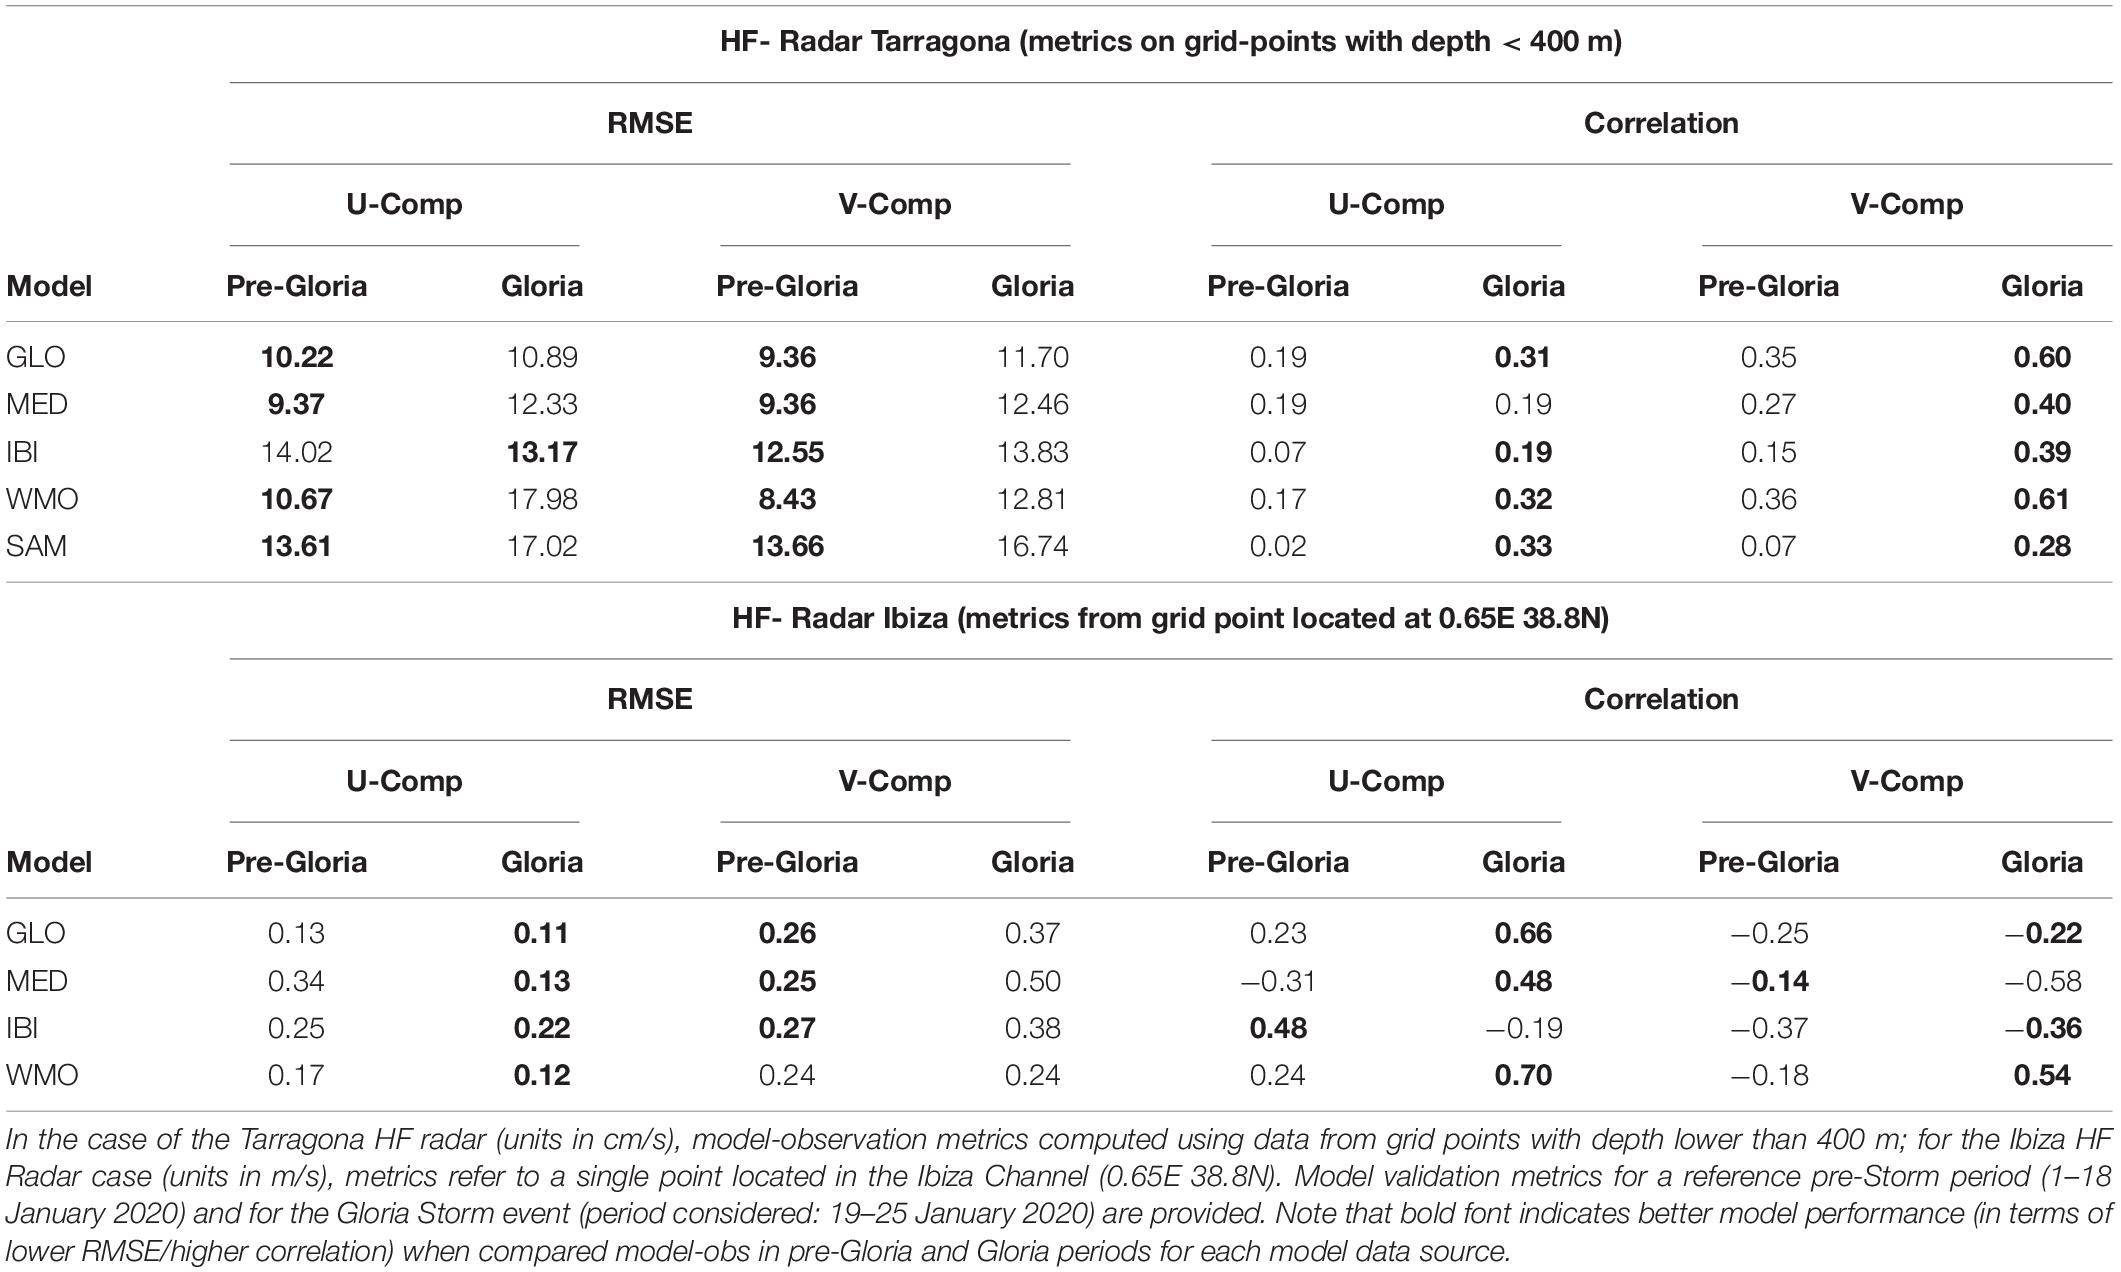
Table 3. Model validation metrics (RMSE and correlation) for simulated surface currents (U and V components) when compared with HF Radar observations from two systems (Tarragona and Ibiza).
The statistical results gathered in Table 3 revealed that the models’ accuracy was higher for the meridional current component, not only during Storm Gloria but also under pre-storm conditions. WMOP was fairly consistent during Gloria, slightly outperforming its parent system (MED) in terms of correlation. The performance of GLO was sound, as reflected by a meridional correlation of 0.60 and moderate RMSE values between 9.36 and 11.70 cm/s. Although GLO underpredicted the variability and intensification of the current speed over the continental shelf, the metrics confirm the ability of this large-scale system to reproduce basic features of the surface circulation in the study-area. As IBI clearly overpredicted the SW slope jet and underestimated the current speed in nearshore areas, the comparison against the HF radar led to lower meridional correlation (0.39) and higher RMSE values, ranging from 12.55 to 14.02 cm/s. Finally, the SAMOA system behaved similarly to its parent system (IBI) in terms of metrics. Although SAMOA presented the higher zonal correlation during the storm (0.33), its performance is highly dependent on the features already simulated by its IBI parent solution.
Regarding the sea surface temperature, the CMEMS GLO, IBI and MED models reproduce essentially a classical pattern that shows higher values as we move toward the Strait of Gibraltar (roughly 15–16°C in the Alboran Sea during the studied period), with finer structures being especially distinguishable in the higher-resolution MED and IBI (not shown). The warmer Atlantic Water entering the Mediterranean through the Strait of Gibraltar is visible in the three CMEMS models, more so in GLO and MED, as well as the colder water (around 13°C) moving along the Gulf of Lions coastline. Similarly, a cooler water strip also appears along the eastern Iberian coastline, wider in CMEMS GLO, although more eye-catching in IBI. In any case, this cooler surface temperature close to the Iberian Mediterranean shoreline shows a small decrease throughout the Gloria storm episode (19th–24th of January).
Validation with in situ observations shows how CMEMS model products are generally able to correctly reproduce local SST. It must be stressed that all these forecast systems count with data assimilation schemes to include information from satellite and in situ (mostly Argo) observational products in the solution. When compared to independent (in the sense of non-assimilated) local in situ observations, each model reproduces its own variability (not always coincident with the observed one), but in general, they show no major biases (less than 1°C) and low RMSE (around 0.60; values obtained for the whole month of January 2020). The model agreement with observations is notably seen in those buoys moored in deeper waters and located far away from the coast (see in Figure 7 the cases for the deep-water buoys moored at Valencia and Tarragona). However, it is worth mentioning that model solutions, especially at specific coastal locations, may differ significantly from the observations due mostly to the model’s inability to accurately predict coastal processes at local scales.
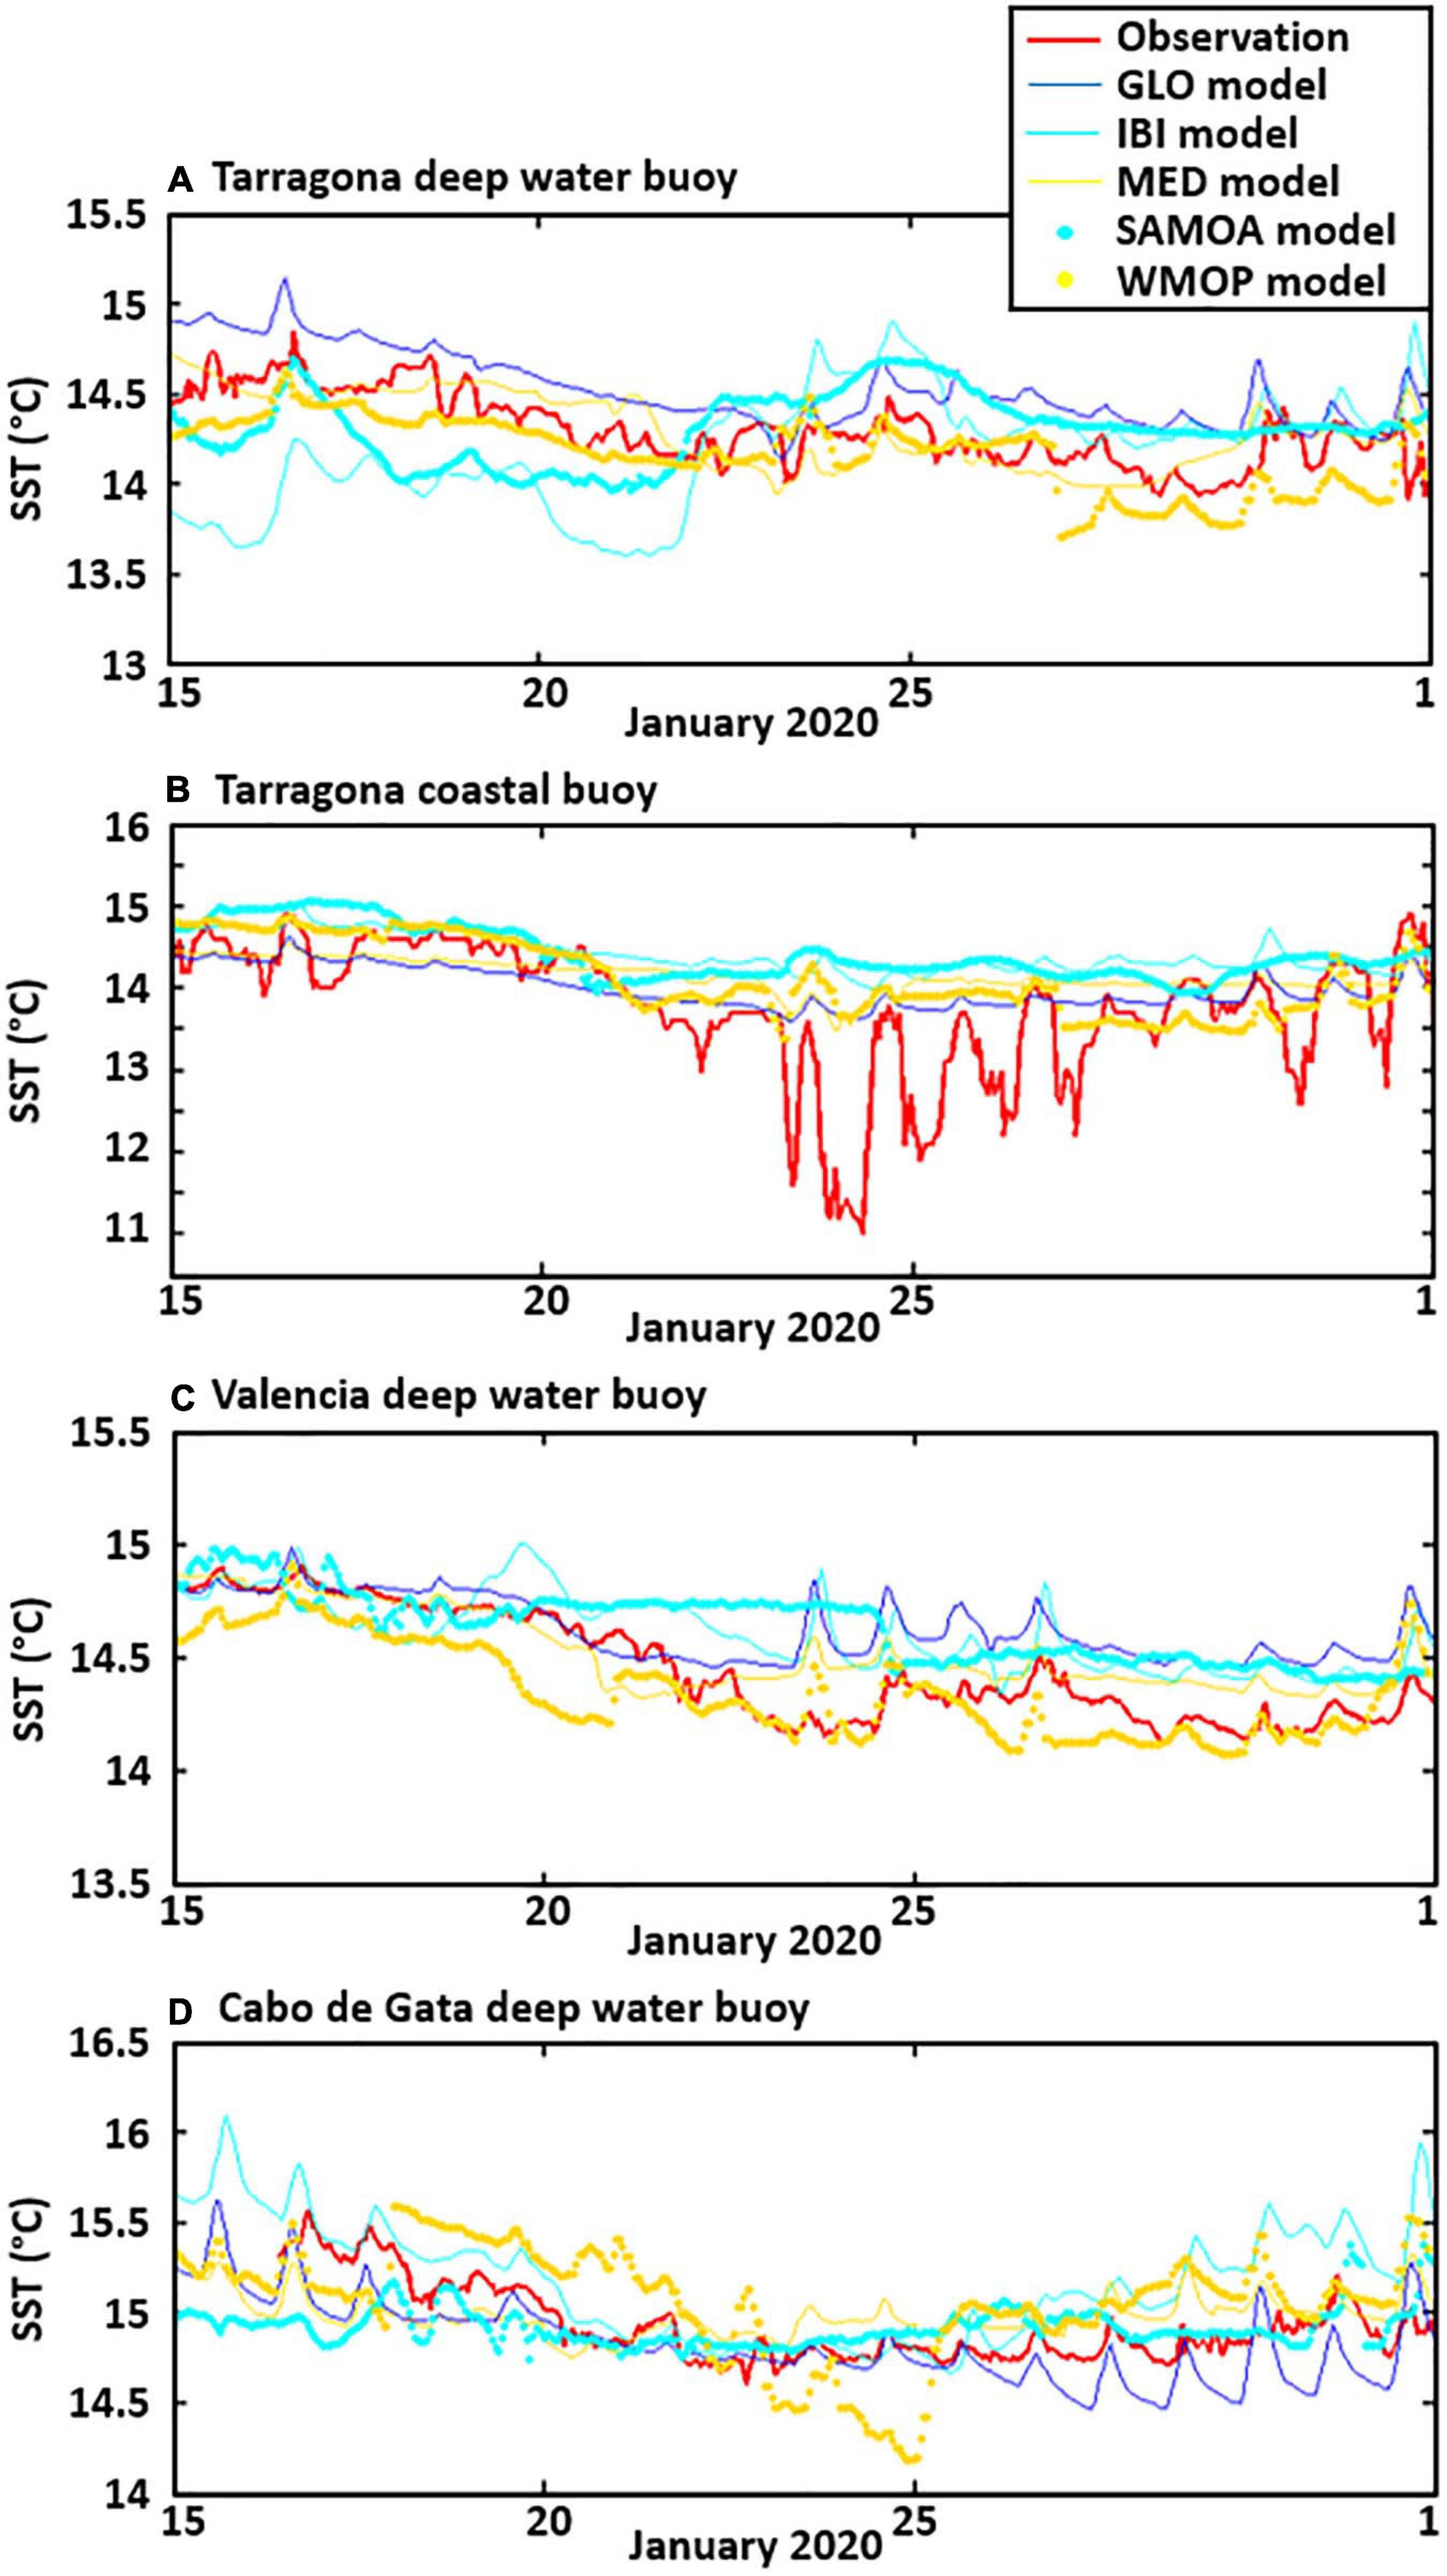
Figure 7. Validation of operational ocean models with in situ observations buoys: Timeseries of sea surface temperature (°C) at the Tarragona (A), Valencia (C), and Cabo de Gata (D) deep water buoys, and at the Tarragona coastal buoy (B). Observed and simulated (by the five model services: CMEMS GLO, IBI, MED, and the SOCIB WMOP and PdE SAMOA) timeseries depicted.
Focusing on the Gloria event, the different impact that such a storm has on the local evolution of SST in coastal waters when compared to nearby deeper ones is remarkable. This different SST behavior between neighboring areas is illustrated with the case of Tarragona, where in situ observations from both coastal and deep water buoys are available (see Figure 7). The Tarragona coastal buoy measured a sharp temperature drop (a fall of nearly 3.5°C), that is not seen in the nearby deep water buoy, and is not reproduce either by any of the models, which did provide a smaller SST decrease related to the passing of Gloria in this coastal location, around ∼1°C. This measured temperature drop seems related in part to the footprint of the freshwater plume arising from the nearby Francolí river mouth (further discussion in the next section dedicated to the coastal model performance).
In terms of salinity, all CMEMS models feature, before the Gloria storm, the expected pattern (not shown) marked by the inflow of fresher Atlantic Water entering the Mediterranean through the Strait of Gibraltar that turns progressively more saline as it moves eastward in the Alboran Sea. The models also reproduce the distinct front, located south of the Balearic Islands, that clearly delimits the generally saltier (above 37 psu) region of the northwestern Mediterranean, where fresher waters (lower than 35 psu) only emerge along the Gulf of Lions and Mediterranean Iberian coastlines. Nonetheless, at the height of the storm (19th–21st of January), the CMEMS models depict changes in these coastal areas, with rearrangement of fresher sea waters along the shoreline and its gradual replacement by more saline offshore waters. Although this salinity increase along the coastline is seen in the three CMEMS models, it is especially relevant in the IBI forecast and, more notably, around the Ebro river delta, where it counterbalances the river freshwater discharge.
Local comparison of the sea surface salinity predicted by CMEMS and that observed at three mooring buoy locations reveals a rather poor models’ performance during the Gloria event in terms of correlation, although an almost general decrease in RMSE is achieved when compared to the pre-Gloria period (Table 2). Thus, even though the correlation at the Tarragona buoy increases for MED (from −0.19 during the pre-Gloria period to 0.13) and IBI (−0.48 to 0.42), it significantly worsens for the three CMEMS models at the Valencia deep water buoy.
How Did CMEMS-Downstream High-Resolution Operational Coastal Models Perform?
This subsection presents the main results obtained from the model performance evaluation of two different downstream forecast services: the PdE SAMOAs and the SOCIB WMOP, respectively, nested into the CMEMS IBI and MED regional products.
PdE SAMOA Operational Performance on the Mediterranean Iberian Coast
The ability of some PdE SAMOA port forecast services to predict the storm-induced ocean circulation linked to the Gloria Storm has been evaluated. For this, the four different SAMOA systems available along the Spanish Mediterranean mainland coast (i.e., the SAMOA services for the Barcelona, Tarragona, Castellon, and Almeria Ports; geographical coverages depicted in Figure 3) have been validated with the in situ and remotely sensed observations available during the event. Note that this in situ network is used to make its near-real-time monitoring.
The effects of Gloria on the sea level along these coastal areas covered by the SAMOA systems were registered by tidal gauges located in the harbors of three of the four SAMOA domains: Barcelona (SAM-BCN), Tarragona (SAM-TAR) and Almería (SAM-ALM). For the fourth SAMOA domain (Castellón, SAM_CAS), the Sagunto tide gauge station had a malfunction related to Gloria from the 21st to the 28th January, and thus cannot be compared to the modeled data.
In the three analyzed cases, the SAMOA models captured the sea level increase due to the storm, albeit not with the same accuracy. In Barcelona, the northernmost domain and where the measured surge was smallest (approximately 15 cm), the model captured the storm arrival, but underestimated the sea level values throughout the whole episode and miscalculated its duration. In Tarragona and Almería, with higher surges (35 and 40 cm, respectively) the agreement for the three parameters (arrival, intensity, and duration) was significantly better, although they still tended to underestimate the sea level values. By studying the full January time series, it can be seen that the Barcelona model performed systematically worse than the other two, probably because of the particularity of the harbor itself, with two mouths, which adds some complexity to the hydrodynamic behavior of the port. The comparison of three commonly used skill parameters (Pearson correlation coefficient –r, RMSE and BIAS) obtained for the January monthly series, the pre-Gloria period (i.e., January 1st to 18th) and the Gloria event (January 19th to 25th) shows that the correlation between measured and modeled series improves during Gloria as compared to the pre-Gloria period for the three systems, but particularly for Barcelona and Almeria, increasing from 0.605 to 0.792, and from 0.750 to 0.888, respectively. In these domains, the correlation coefficient during Gloria is even larger than for the whole month of January, Gloria included. Regarding the RMSE, there is no significant variation except for the Tarragona domain, where the RMSE during Gloria is about 50% larger than for the full January and the pre-Gloria days.
The general performance of SAMOAs regarding sea-level shows a high similarity with the CMEMS IBI behavior, sharing the same features with this IBI parent solution, with the exception of the storm peak, in which SAMOA tends to slightly outperform, due to the effect of the AEMET HARMONIE pressure field and slightly overestimated winds. A more detailed analysis of the Gloria effects on the sea level and on the model simulations performed along the Spanish Mediterranean coast can be found in Pérez-Gómez et al. (2021, unpublished data).
On the other hand, two shallow water buoys (Barcelona and Tarragona) and three deep water buoys (Tarragona, Valencia, and Almería) included in the SAMOA domains were operative during January 2020 (see Figure 2). However, the Barcelona coastal buoy stopped recording on January 19th and cannot be considered in this analysis, and the Almería deep water buoy began recording on the 16th. The coastal buoys measured surface water temperature (SST), whereas the deep water buoys provided SST, surface salinity (SSS), and surface current speed and direction.
As previously mentioned, the surface water at the Tarragona coastal buoy shows a steady cooling of about 1.5°C during the first half of Gloria and suffers a drastic drop in temperature during the last third of the event. Overall, the temperature falls about 3.5°C, and by the end of the storm it shows an oscillatory behavior, slowly increasing toward values like those before Gloria (Figure 7). Although the model agrees well with the observations before the arrival of the storm, and captures the onset of the temperature decrease both in timing and magnitude, it is not able to reproduce its time evolution during Gloria, overestimating the SST by between 0.5 and 3.1°C. The measured temperature drop could be related in part to the freshwater plume arising from the Francolí river, whose discharge rate increased dramatically between January 23rd and 25th (with 24 h accumulated precipitation of 150 mm).
Unfortunately, this hypothesis cannot be contrasted by salinity analyses, since this coastal buoy does not acquire salinity data. However, just 3 months previous to Gloria (on the 23rd October 2019), the same buoy recorded a similar sudden fall of 3°C. In that case, daily accumulated precipitation (P24) at the basin reached 200 mm, and the river mouth discharge rose from 1 m3/s to 1238 m3/s. Although P24 under Gloria was lower (150 mm) than in the previous event; the Ebro and Tordera-Ter basins (the latter further north) also had exceptional P24 (around 200 mm), and that may have had a secondary role contributing to enhance the freshwater signal along the coast. The mouth of the Fancolí river is located inside the Tarragona harbor and none of the available operational ocean models include the Francolí contribution as part of their river freshwater forcing due to its small size and typically low flow rates. Regarding the offshore buoys, SST records show a decrease of about 0.5°C during Gloria that is reproduced satisfactorily by the models, particularly for the Almería buoy (Figure 7). This is in general agreement with the performance of the predictive system during the whole month of January. Conversely, the observed surface salinity (not shown) remains almost constant during January at the three offshore buoys, between 37 and 38 psu, with no evident alteration due to Gloria. This trend is well handled at the Tarragona and Almería models, although the latter tends to predict lower than observed SSS values, with maximum deviations of about 1 psu. The Castellón model, on the other hand, slightly underpredicts the salinity measured by the Valencia buoy in the week before Gloria but reproduces well the SSS values during the storm.
The measured and modeled surface currents at the three offshore buoys are shown in Figure 5. At Tarragona and Valencia, the SAMOA models captured the current intensification related to the arrival of Gloria. However, the Tarragona model reproduced the current speed throughout the storm but underestimated the intensity peaks; on the other hand, the Castellon model strongly underestimated the current speed in Valencia after January 21st. At the southernmost Almeria buoy (not shown), on the contrary, there is no effect of Gloria on the measured surface currents, which are slightly overestimated by the model. However, it is difficult to conclude if this overestimation is due to Gloria or a systematic feature because of the lack of buoy data for the first half of the month. As for the flow direction, the Tarragona model predicts predominant southward currents during January turning to the southwest during the storm, which is roughly in agreement with the observations and similar to that observed for the Castellón model; although in the latter, the main currents are always to the southwest. At the Almeria buoy, the data comparison with the Gloria period shows a similar pattern. In all the domains, the models fail to reproduce the observed directional dispersion.
The model performance as compared to the buoy data is shown in the Taylor diagrams in Figure 8, for both the SAMOA and IBI systems, for the three SAMOA domains, then comparing the full month with the pre-Gloria and Gloria periods. The comparison between parent and child models shows a similar performance of both systems, with slightly larger correlations for IBI predictions as compared to the buoy data but balanced by larger IBI RMSE and bias values. In general, IBI fared better in the pre-Gloria period, whilst SAMOA tended to predict better during the storm event. Although, the differences were not significant, and no clear trend was detected.
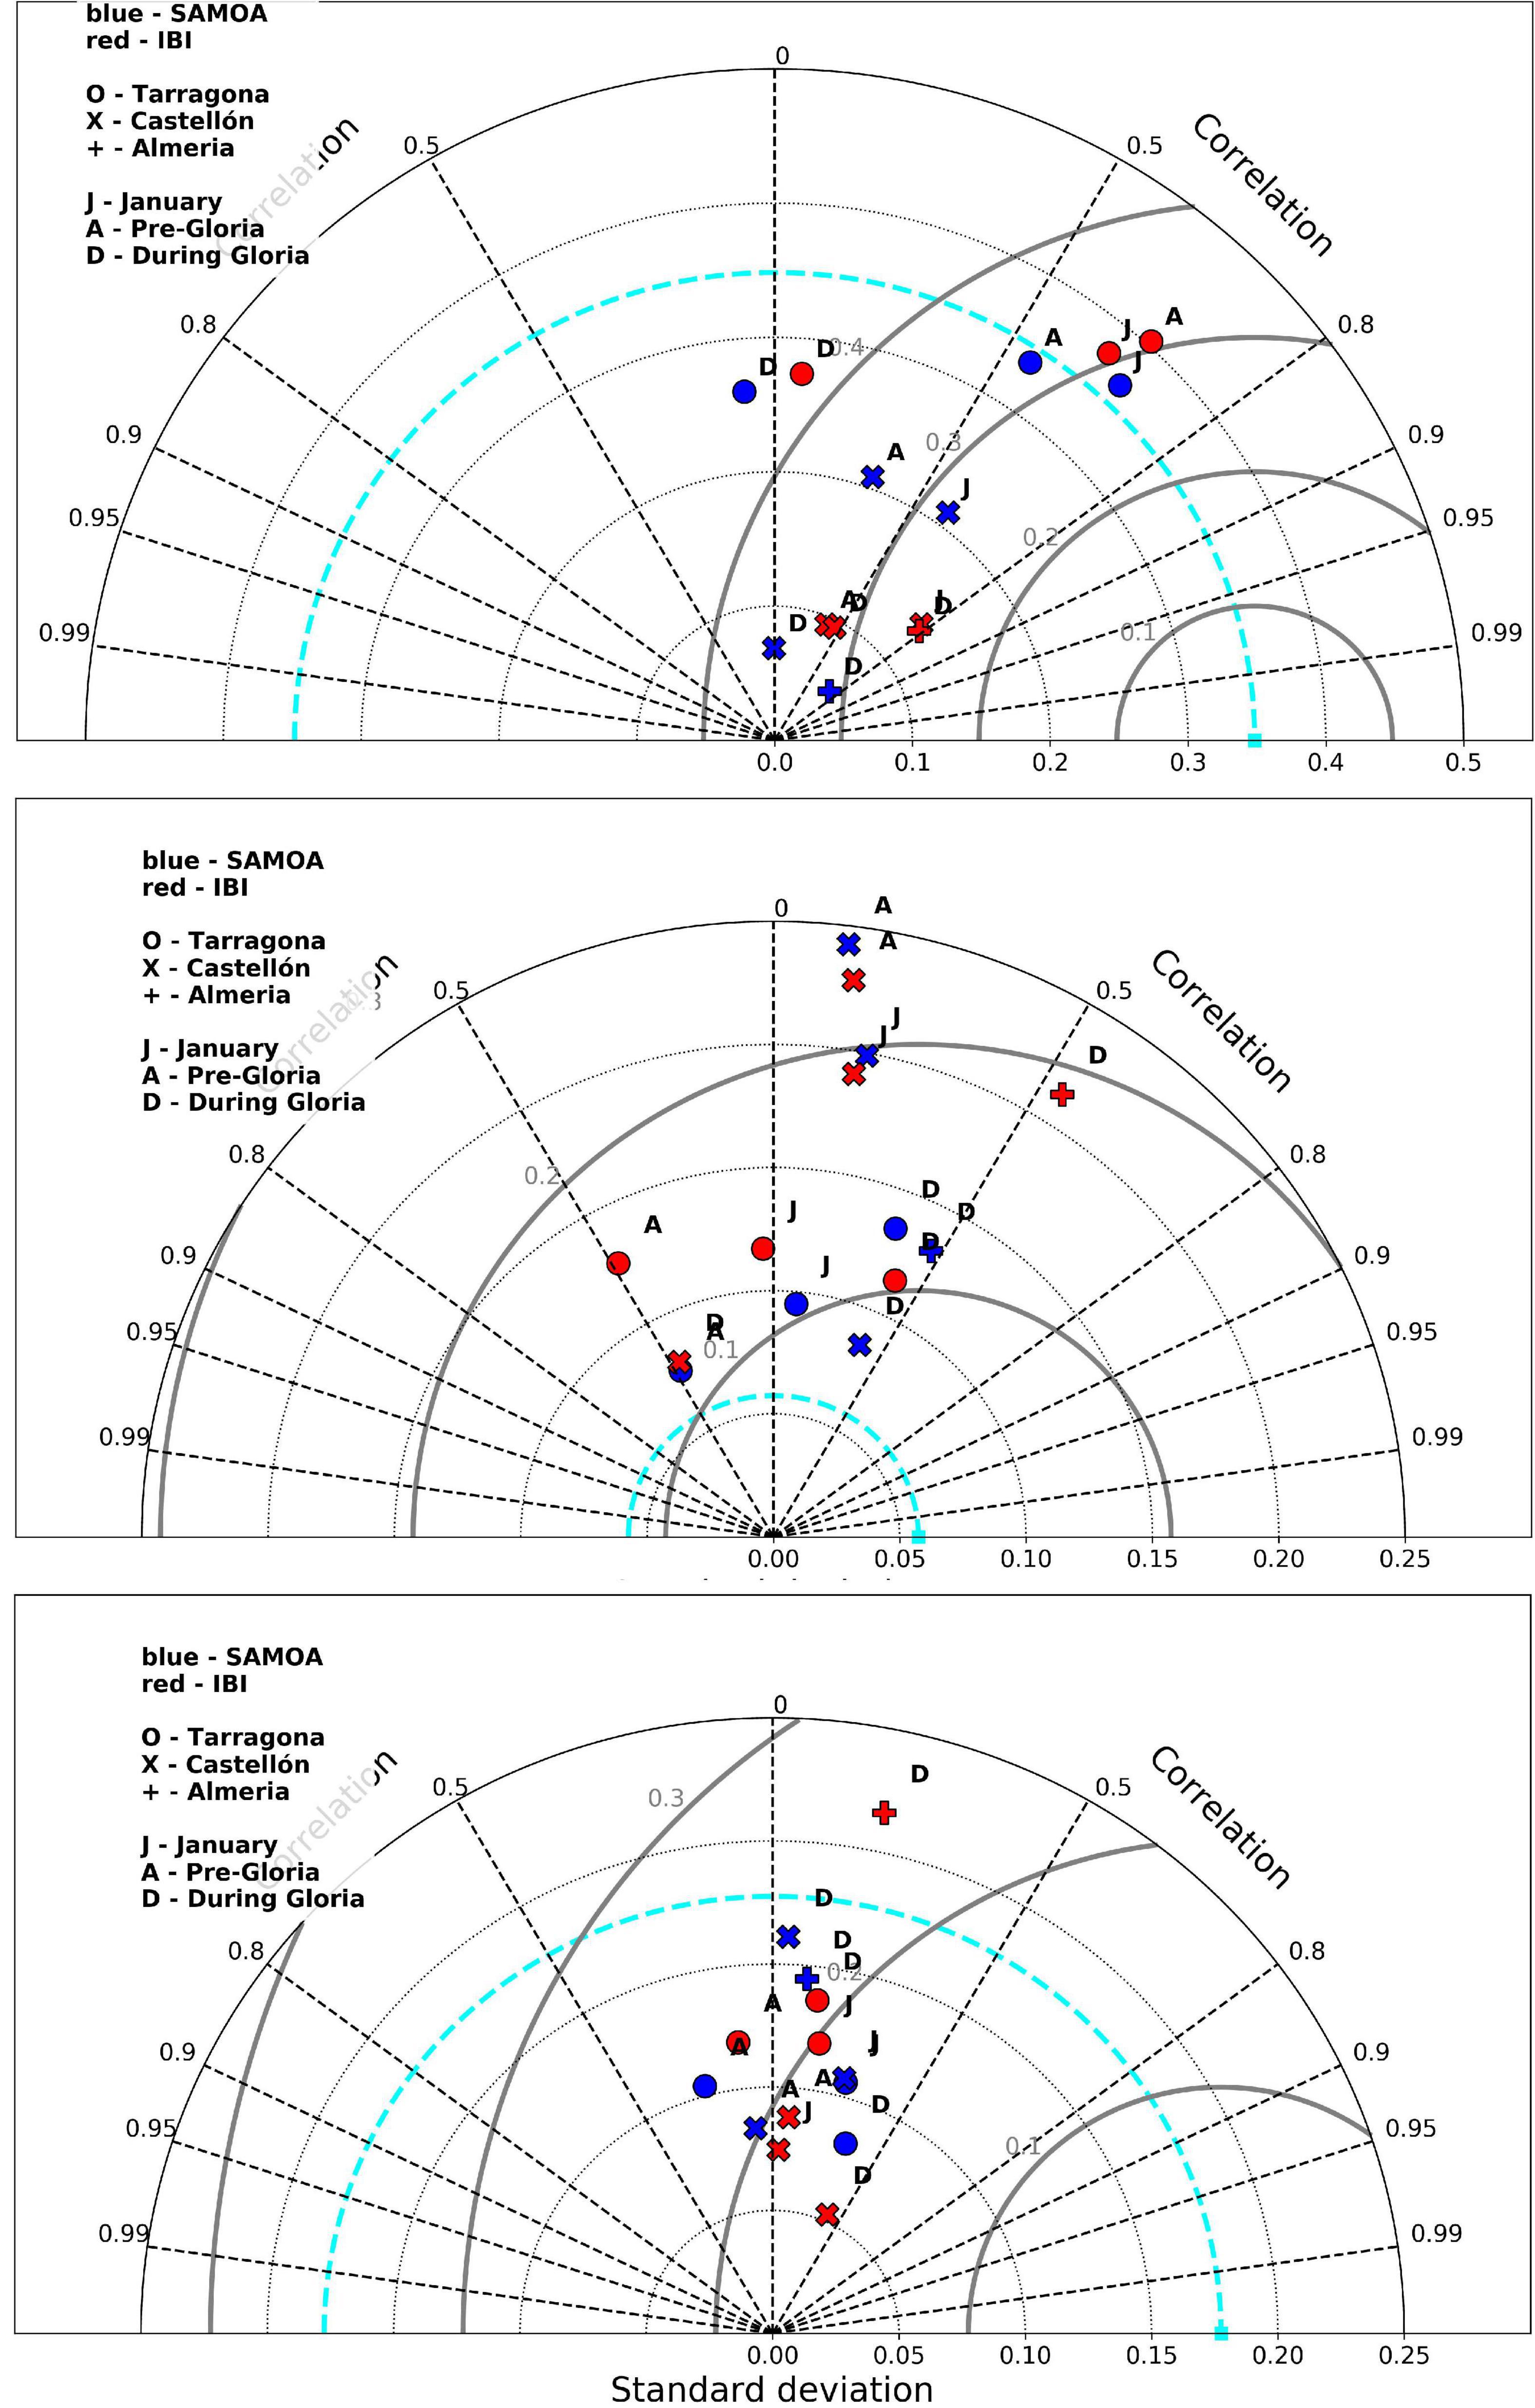
Figure 8. Taylor diagrams comparing IBI and SAMOA forecasts with buoy data in three SAMOA domains (SAM-TAR, SAM-CAS, and SAM-ALM), for January 2020, the pre-Gloria period (January 1st to 18th), and during the storm (January 19th to 25th). Panels from top to bottom for sea surface temperature, surface salinity, and current speed.
The comparison of the SAMOA forecasts with the 2D surface velocity fields obtained by the Tarragona HFR also provides an estimation of the model’s performance during Gloria (see Figure 6). For the full month, the correlation between modeled and HFR-measured surface currents at the HFR nodes with a time coverage above 75% shows stronger positive values around the Ebro Delta and weaker or negative correlations further offshore. During this period, the mean correlation coefficient r for the zonal and meridional flow components were 0.372 and 0.109, respectively. However, when the pre-Gloria and during Gloria intervals are considered separately, a remarkable difference in the agreement of the SAMOA forecasts with the HFR data becomes evident. Before Gloria, the time-averaged correlation coefficients tend to be weaker, with negative speed correlations over a larger area than for the whole of January. This is so for both velocity components, and the mean correlation values decrease to 0.006 and 0.084, respectively. On the contrary, during Gloria there is a significant improvement of the surface speed correlation, particularly for the zonal component, with mean values of 0.549 and 0.109. The maximum values of the time-averaged correlation coefficients are also illustrative of the improved quality of the SAMOA current forecasts in the Tarragona domain during Gloria: from 0.498 and 0.662 for the E–W and N–S components before the arrival of the storm, to 0.942 and 0.890 during the event. This behavior is similar to that of the IBI parent simulation, which performs better during Gloria than before the storm, with correlation values comparable to those of SAMOA: 0.56 and 0.62 for the zonal and meridional components before Gloria, and 0.85 for both during the storm.
Regarding the time-averaged RMSE distributions, the common overall pattern shows smaller errors around the tip of the Delta, and higher values in the north-eastern section of the domain, typically with lower RMSE related to the zonal component of the velocity. This distribution is roughly observed in the three-time periods considered, with no significant differences between the mean RMSE for the pre- and during Gloria intervals (0.15 m/s and 0.18 m/s for the zonal component, 0.18 m/s and 0.20 m/s for the meridional). Again, the IBI simulation shows an analogous behavior, although with slightly larger RMSE values for the meridional current speed component (0.20 m/s and 0.26 m/s before and during Gloria, respectively).
The similarity of the IBI solution in the Ebro Delta area with its nested SAMOA solution (see Figure 6) is unexpected due to the discrepancy identified between the atmospheric forcing used by both models. As seen in Figure 1, the ECMWF wind speed used to force the IBI model is systematically lower during Gloria than the HARMONIE2.5 winds used to force the SAMOA, with differences of up to 5 m/s. This should translate into stronger currents being predicted by the SAMOA models as compared to the IBI forecasts. However, this analysis shows that both models predict surface flows of comparable magnitude, suggesting that perhaps the wind momentum transfer to the ocean surface is not adequately parameterized in the SAMOA model and it may need tuning in future system updates.
SOCIB WMOP Operational Performance in the Balearics
Like the rest of the models, the overall circulation of WMOP was significantly affected by the storm in the Catalano-Balearic Sea (Figure 9). Before Gloria, on 18 January, the Northern Current had no marked surface signature south of Ebro Delta and northward inflows were flowing through the Ibiza Channel. Under the effect of the intense winds, the surface circulation showed a very different pattern on 20 January, with a strong southward flow all along the coast of the Iberian Peninsula. At the end of the storm on 23 January, the situation was characterized by an intensified Northern Current with a marked surface signature until south of the Ibiza Channel.
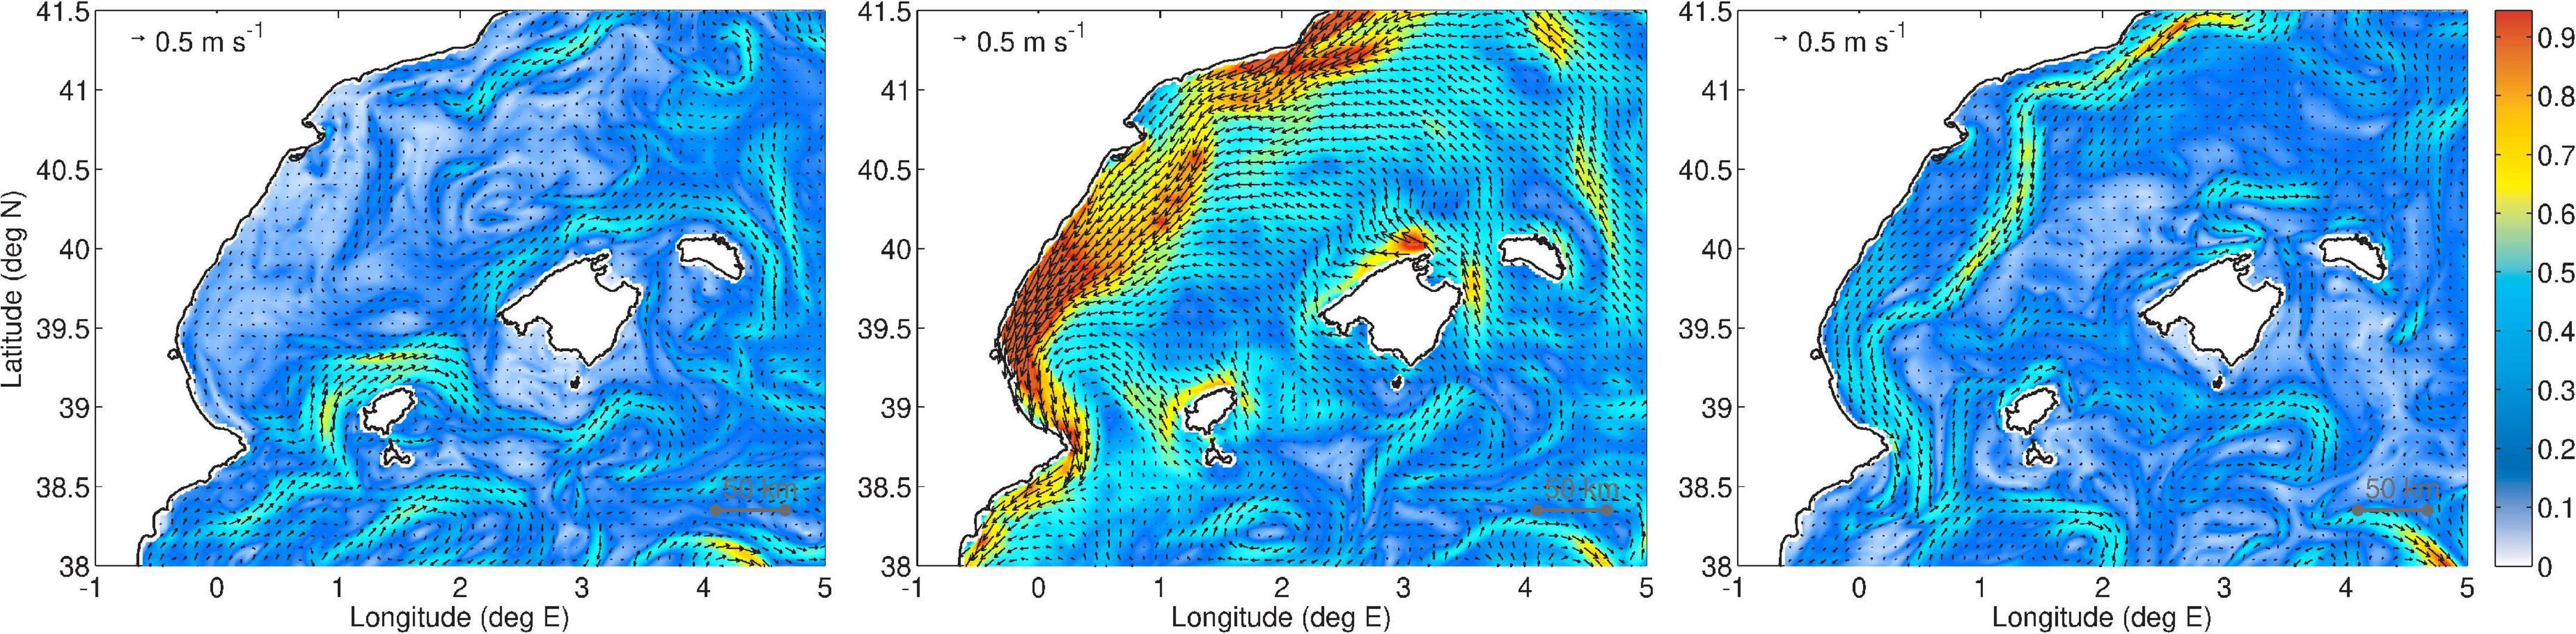
Figure 9. Daily mean WMOP operational forecasts of surface currents (in m.s– 1) in the Balearics Islands area for the 18th (left), 20th (center), and 23rd (right) of January 2020.
This behavior can be evaluated with the mooring time series presented in Figure 5. Due to its position, the Valencia buoy is the mooring that better captured the surface current intensification due to the winds on 20 January and the subsequent intensification of the Northern Current until 26 January approximately. WMOP represented a strong intensification of the surface current with an accurate duration on 20 January but significantly overestimated the current observed by the mooring (∼0.75 vs. ∼0.45 m/s). There are two factors probably mainly originating this overestimation. On the one hand, the overestimated winds of the Harmonie model forced an overestimated response of WMOP (this effect is also seen in SAMOA which uses the same atmospheric forcing source). On the other hand, this figure compares model surface velocities with current meter measurements at 3.5 m depth. The direct ocean response to strong winds implies a significant vertical shear in the Ekman layer with velocities decreasing with depth. In WMOP the velocities at Valencia buoy on 20 January are found to be reduced by 20% between the surface and 5 m depth, which can explain an overestimation of the current when considering depths with a few meters of difference. This vertical shear disappears when the winds stop blowing on 23 January, and the velocity measurements then represent the signature of the Northern Current. During this period which extends to approximately 26 January, the magnitude of WMOP surface currents is in very good agreement with the mooring observations, around 0.45 m/s. Indeed, this is the only model which can maintain in time this intensification of the Northern Current during the few days following Gloria in Valencia buoy. The magnitude of WMOP and mooring velocities then both drop later 26 January, returning to pre-storm values.
The evolution of WMOP surface model velocities was also in good qualitative agreement with Ebro Delta HF radar measurements (Figure 6). The signature of the Northern Current was present before the storm on 18 January, centered on the shelf break with maximum velocities around 0.3 m/s. Under the effect of Gloria winds, significant southwestward velocities up to 0.9 m/s were generated over the shelf on 20 January with an extension from the coast to the limit of the HF radar coverage area. After the storm, the model velocity pattern was again marked by the signature of the Northern Current over the continental shelf break with an increased magnitude (around 0.6 m/s) with respect to pre-storm conditions, in good agreement with the observations and the CMEMS models. Quantitatively, while the correlation with HF radar measurements is significantly improved during the storm, the RMSE is larger than pre-storm values due to an overestimation of the magnitude of the velocities (see Table 3).
An interesting and very local effect of the storm is the significant drop in SST registered at Tarragona coastal buoy, with minimum temperatures around 11°C on 24 January. Even if the model is far from properly reproducing this phenomenon, WMOP showed two temperature drops of around 1°C on 20 and 24 January. Looking into the details of the circulation, this temperature drop, also associated with salinity drops, came in the model from the very coastal advection of cold and relatively fresh water, which originated from the Gulf of Lions. Our interpretation is that the first SST drop on 20th January was due to the advection of water that was already present along the coast of Catalonia, with properties transformed with respect to the very cold and relatively fresh characteristics found in the Gulf of Lions until the latitude of Cape de Creus. On 24th January, after 3 days of southward advection, the water with properties closer to its original ones in the Gulf of Lions reached Tarragona coastal buoy. In addition, coastal inputs of very cold water from the Francolí river mouth located close to the Tarragona coastal buoy probably have also contributed to this significant SST drop in the observations. WMOP’s capability of simulating part of this effect observed in Tarragona would then be due to its capacity to represent the circulation in the Gulf of Lions (including the spreading of Rhône river plume, upwellings and surface cooling effects due to winds) as well as the advection by very coastal currents along the coast of Catalonia. At the same time, like the rest of the models, WMOP is significantly limited here by the lack of real-time river inflows and coastal run-off inputs along the coast.
The models can be further evaluated downstream in the Ibiza Channel where SOCIB operates another HF radar. While the HF radar, with a coverage area limited to the eastern side of the channel, does not allow to monitor the intensification of the Northern Current which occurs on the western side, it allows to precisely measure the Ekman surface current intensification under the effect of the strong storm winds. Figure 10 shows the time series of zonal and meridional velocity components for the HF radar and the models at a location close to the limit of the HF radar coverage area, approximately in the middle of the Ibiza channel at 38.8°N. WMOP shows a very good agreement in terms of the magnitude and temporal variations of the zonal velocity (peaks of around 0.4 m/s and 0.2 m/s westward on 19th and 21st January, respectively, around 0.25 m/s eastward on 21st January afternoon). The agreement is also reasonably good in terms of meridional velocities, yet with larger differences with respect to the zonal component, and in particular an underestimation of the southward current on 19th January, as in the case of the other models. As a result, while a significant increase of the correlation between WMOP and observed velocities is obtained during the storm for both zonal and meridional components, the RMSE is only reduced for the zonal velocities (Table 3).
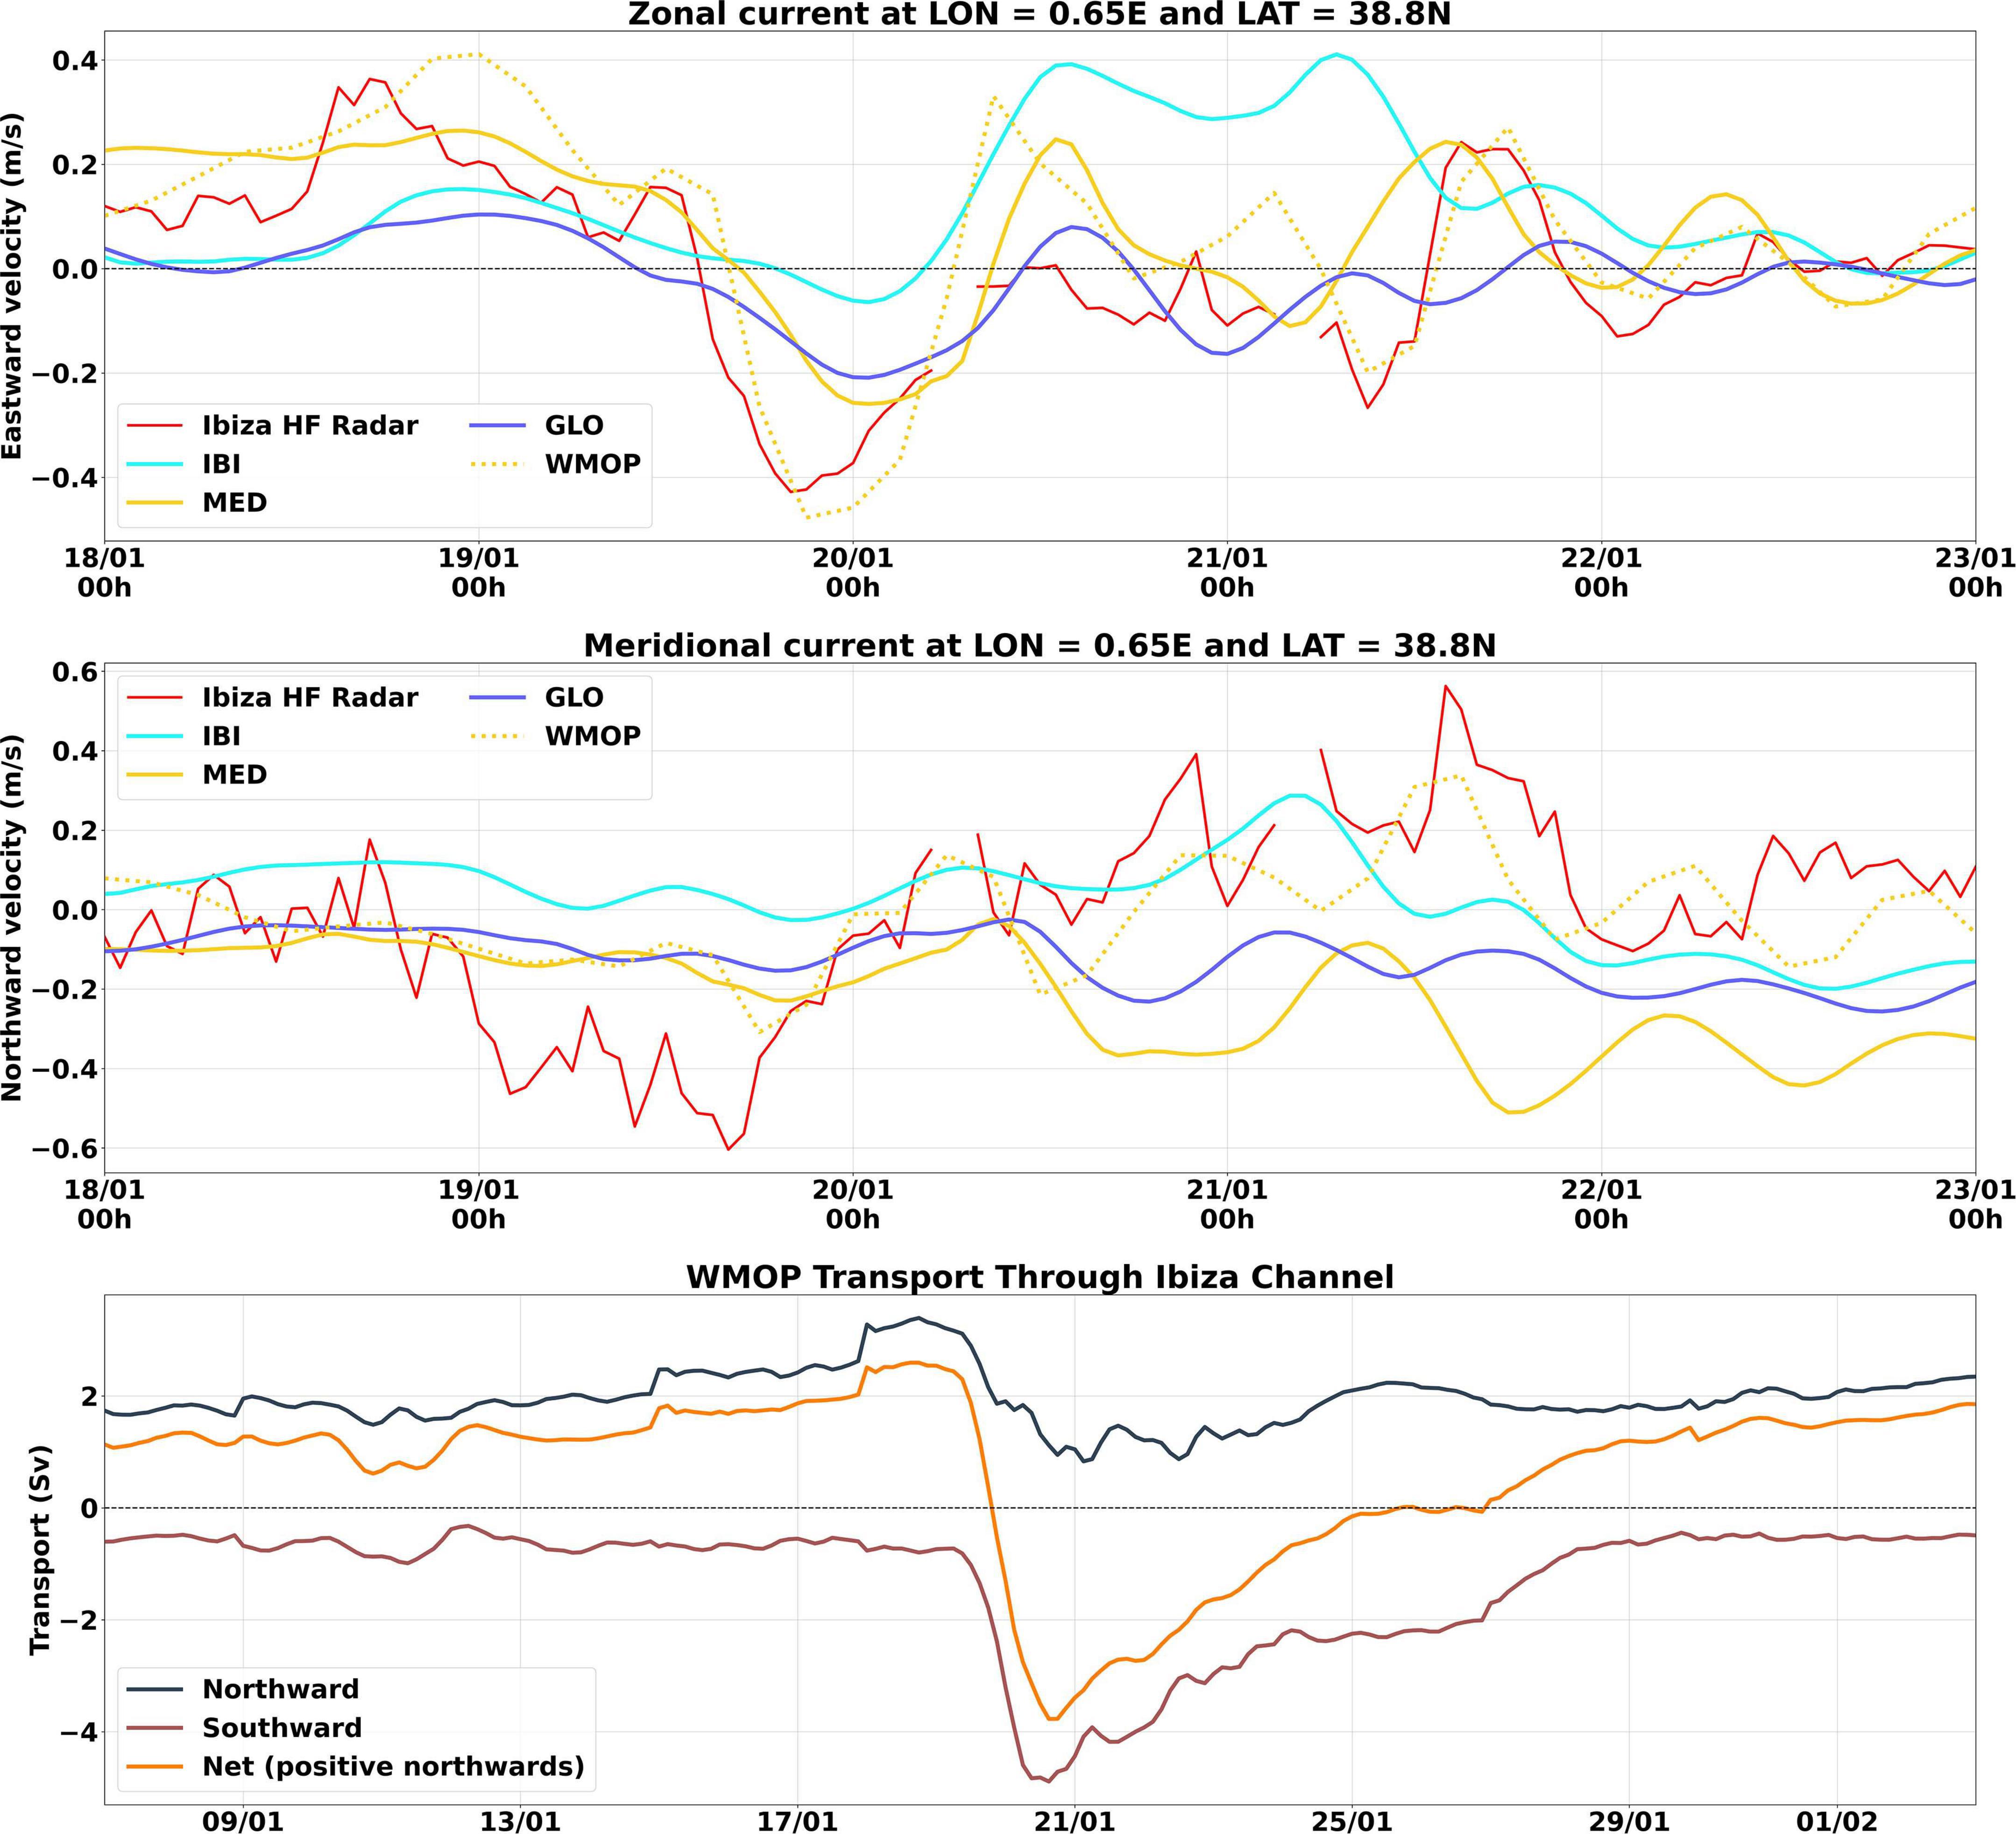
Figure 10. Comparison of zonal (top panel) and meridional (middle panel) surface velocities observed by Ibiza Channel HF radar and simulated by the models for the location 0.65E–38.8N. WMOP transports through the Ibiza Channel in January 2020 (bottom panel).
All these model-data comparisons show significant impacts of the storm on the surface circulation in the Catalano-Balearic Sea. An important indicator of these changes is the transport through the Ibiza Channel, which is an important choke point of the regional circulation. While SOCIB maintains a glider endurance line across the channel, no glider was operating in the Channel during the storm due to a previous instrumental failure. Given the overall satisfying performance of the WMOP model according to the comparisons with moorings and HF radar measurements, we believe that it can reliably be used to characterize the effect of Gloria storm on the meridional transports through the Ibiza Channel. Figure 10 (lower panel) illustrates the time series of WMOP transports through the Ibiza Channel in January 2020. It shows the sudden increase of the southward transport until almost 5 Sv on 20 January, together with a drop in the northward transport until 1 Sv (notice that both northward and southward velocities coexist in the Ibiza Channel section over the whole period). The southward transport then progressively decreases until returning to pre-storm values on 28 January. To sum-up, the net transport which is generally northward in the model, reversed, reaching values up to 4Sv in the southward direction during the peak of the intensification of the currents, and the effects of the storm on the transports were diluted after a time scale of around 1 week.
Discussion and Conclusion
The powerful Storm Gloria (19th–25th of January 2020), which affected the Spanish Mediterranean coast heavily, represents an excellent study case to analyze the capabilities of the different operational ocean forecast services available in the area.
During Gloria, the CMEMS regional ocean model systems (both the MED and the IBI solution) present, as expected, a more reactive response to the Storm Gloria than the one exhibited by the CMEMS global product, in which both systems are nested. This higher sensitivity of both regional configurations to extreme atmospheric events is mainly due to their higher resolution (1/12° in GLO, but 1/24° in MED and 1/36° in IBI), and results in a characterization of the regional circulation patterns marked by a more intricate mesoscale structure.
Regarding sea surface temperature, all the CMEMS models essentially reproduce the same pattern in the area, which is the usual one for a January month, marked by higher SST in the Alboran Sea, linked to the intrusion of warmer Atlantic Water entering the Mediterranean through the Strait of Gibraltar, and colder waters moving south along the Gulf of Lions coastline. The three CMEMS systems assimilate SST observations from both satellite and in situ data sources and therefore their agreement with the in situ coastal observations is in general good, showing each model its own variability but with no major biases and very low RMSE. This agreement between the CMEMS model solutions and in situ observations is more remarkable when comparing to offshore buoys (moored in deeper waters) than for coastal shallower moored buoys. A good example of the noticeable impact that a storm such as the Gloria event has on the local evolution of SST on coastal waters, with important differences with respect to nearby deeper waters, is shown in Figure 7. The sharp temperature drop recorded at the Tarragona coastal buoy (an SST fall of nearly 3.5°C) associated with the passing of the storm is not mimicked at the nearby deeper mooring buoy (SST decrease smaller than 1°C). Note that none of the models is able to reproduce such a strong temperature drop at this coastal location (reaching only ∼1°C of local temperature decrease), tending to simulate a behavior similar to the observed at other nearby offshore deeper grid points. It is likely that these sharp coastal SST decreases are the footprint of freshwater river plumes; in the particular case of the Tarragona coastal buoy, the SST evolution seems specifically related to the discharge of the nearby Francolí river, the freshwater flow of which increased significantly due to the high precipitation recorded during the Gloria event. Neither the CMEMS models nor the coastal downstream ones include the outflows from this minor river, marked usually by very small freshwater flow rates. Indeed, for this Tarragona region, the single freshwater forcing used by the models is the contribution from the major Ebro river, characterized by climatological data only and not by daily updated estimation derived from river flow observations or models. In the case of Storm Gloria, it seems that the use of climatological forcing to describe the freshwater discharge of only some major rivers, while ignoring smaller ones that might occasionally during extreme events present very intense outflows related to extreme events and the lack of coastal run-off inputs can be a strong limitation to accurately forecast strong changes in coastal water properties.
Finally, the surface salinity fields delivered by the three CMEMS products show similar general patterns in the study domain, but with specific different finer structures in each case. Indeed, and contrary to the decrease of salinity expected due to the enhancement of coastal freshwater contribution linked to the heavy precipitation rates, during the peak of Storm Gloria (19th–21st of January) the models show a rearrangement of the fresher sea water located along the Spanish mainland shoreline. This gradual increase of the coastal salinity seems related to the transports that occurred simultaneously to the storm surge, and mainly related to the advection of saltier waters from offshore open regions. Although it is seen in the three CMEMS models, this salinity increase along the coastline is especially relevant in the IBI solution and more notably around the delta of the Ebro river, one of the coastal areas most impacted by Gloria, where it counterbalances the effects of the river plume.
Before the onset of the Storm Gloria, the MED and GLO surface current fields seems to share more similarities than the IBI solution, which is marked by a more complex and intense mesoscale signal. When the low associated with Gloria moves onward through the western Mediterranean (on the 20th of January), the three CMEMS models show some water current intensification along the eastern Iberian coastline, quite weak in the GLO system but reaching up to 1 m.s–1 current speeds in both the MED and IBI predictions. In IBI, this current intensification is more localized, being the pre-existing Gloria current pattern maintained, but intensified. However, the MED model react more to the storm, and an intense westward current, not discernible in the GLO and IBI fields, settles on a vast area between the north-eastern coast of the Iberian Peninsula and the Balearic Islands. On the following day (the 21st of January), no significant evolution is perceived in GLO and IBI currents, which maintain their structural arrangements. By contrast, this vast strong current pattern simulated by MED increases in strength and veers to a more northward component, especially in open waters. However, as it approaches to the north-eastern Iberian coastline, the current simulated by MED shifts to a more westward surge impacting directly on these coastal areas (exceeding 1.2 m. s–1 in the vicinity of the Catalan coast).
The intensification of surface currents related to the Storm Gloria, simulated to a greater or lesser degree by the CMEMS models along the Spanish coast, is in agreement with the observations recorded at deep water moored buoys. Thus, at the Tarragona buoy, moored in one of the most affected coastal areas, the current speed spike is reproduced by MED and to a much lesser extent by GLO; IBI simulates the Gloria peak, but seems masked by the higher variability of this model related to the persistence of strong pre-Gloria current structures. On the contrary, the GLO shows a more reduced temporal variability, mainly related to its lower resolution. Further south, at the Valencia buoy, the maximum current peak is better captured in terms of intensity, but none of the models can effectively reproduce at this buoy location the duration (roughly 1 week) of the recorded strong current episode.
These differences in the water current intensification shown by IBI and MED, may be due to the following two factors: First, concomitant to the Storm Gloria peak in the Western Med, a positive anomaly of mean sea level pressure was observed over both the Eastern Med and the Adriatic Sea, driving an important negative surge that generated a westward barotropic flow (i.e., toward the NW Mediterranean), that was only considered in MED. This basin barotropic flow advected water mass fluxes toward the Iberian Peninsula, contributing to the already exceptional wind-driven surge. Note that the IBI model domain does not cover the whole Mediterranean basin, and therefore it did not simulate this important basin anomaly signal. The signal is neither introduced through the open boundary conditions since at its eastern IBI open boundary (5°E) the IBI is forced by the GLO sea levels (that did not include this basin barotropic contribution), plus only the local inverted-barometer effect. Second, and at a lower degree, the wave coupling effect. The wind stresses used in MED are computed with a drag coefficient modified by the wave fields provided by the CMEMS MED wave forecast; in a sensitive analysis not presented here it has been shown that, under Storm Gloria conditions, this drag formula considering wave state tends to provide higher drag coefficients than the CORE bulk formula used in IBI. However, these differences were smaller than usual due to the barotropic flow (i.e., just 2–4 cm in sea level residual differences at Gandia, under the storm peak, where the modeled residual was 52 cm). Further details on these two factors are addressed in Pérez-Gómez et al. (2021, unpublished data). Thus, and specifically for the IBI system (the only CMEMS model system of the study that does not cover the whole Mediterranean basin), the inclusion of barotropic flow contribution linked to pressure anomalies at its eastern open boundary can have a significant positive impact on the circulation. This is especially true in those cases in which there are strong baric gradients between the Western and Eastern Med, such as this Storm Gloria Event.
Focusing on the CMEMS core products, the results show how the CMEMS MED and IBI regional forecast systems improve the CMEMS GLO solution, in which both are nested, reflecting the effectiveness of the two dynamical downscaling performed within the CMEMS service for the western Mediterranean. This is so, especially when both CMEMS regional forecasting systems respond to an extreme atmospheric event such as Storm Gloria. However, and in spite of the more accurate simulation of surface ocean parameters during an extreme event provided by the regional models, the multi-model assessment has also highlighted some of the limitations of CMEMS regional products, particularly evident for some observed features in specific coastal locations (i.e., inability to accurately reproduce sharp coastal temperature drops linked to rapid local water advections or to correctly capture the intensity of surface current peaks and their temporal durations). These limitations, due mostly to the model’s inability to accurately predict coastal processes at local scales, imply that regional model solutions can often significantly differ from local observations.
On the downstream side, it is a common approach for services to apply higher resolution models with ad hoc forcing aiming at reproducing coastal scales in more limited geographical areas. These coastal model systems are usually nested in existing regional/global solutions to downscale such operational core products, filling the gap identified between regional solutions and local dynamics, as well as to better simulate the effects of extreme events. This is the case, for the PdE SAMOA and SOCIB WMOP systems, which downscale the CMEMS IBI and MED regional solutions, respectively, with the objective of achieving a better representation of local processes required for specific applications, mostly focused on coastal areas. The accuracy of each operational product in characterizing the related ocean dynamic was elucidated with this multi-model inter-comparison exercise comprising CMEMS and downstream coastal solutions. The quantitative comparisons against hourly in situ and remote observations highlight both the steady improvement in representation when moving from global to coastal scales through a multi-nesting model strategy, but also the relevance of a variety of factors at local scales.
By contrasting the results of the IBI and the SAMOA systems it is possible to determine the added value provided by the downscaling procedure from the regional resolution (2 km approximately) to coastal scales (350 m). For the particular case of the extreme Gloria event, both IBI and SAMOA behaved similarly, capturing the arrival of the storm in the different SAMOA domains with acceptable accuracy. In spite of this, and of the strong winds associated with the presence of the storm, both systems tended to underestimate the surface current speed at the locations of the buoys to some degree. Note that the AEMET Harmonie wind speeds used as forcing in SAMOA were strongly overestimated at the storm-peak (at least 5 m/s, Figure 1), but the SAMOA surface currents were underestimated. This could be indicative of an inadequate parameterization of the atmosphere-to-sea energy transfer processes and must be investigated in detail.
In general, no significant differences are found between the IBI and the SAMOA forecasts for January along the Spanish Mediterranean coast, although the downscaled SAMOA system appears to adjust somewhat better to the changes induced by the passage of Gloria, with slightly smaller RMSE and bias relative to the buoy measurements, particularly in Castellón and Almería. The small contrast between both systems could be due to the fact that the offshore buoys used for the validation are far from the coast (between 30 and 60 km) and relatively close to the SAMOA domain boundaries, where the SAMOA simulations are highly influenced by the lateral open conditions derived from the IBI parent. Moreover, the relatively small size of the SAMOA domains makes them highly dependent on the IBI solution, which they somewhat refine, but preventing them from developing their own dynamics according to the higher-resolution forcing data they use. Nevertheless, it is likely that closer to the coast the quality of the downscaled solution improves in comparison to the IBI solution, although the near lack of observational data in this area during Gloria prevents an adequate coastal validation of both systems.
WMOP was shown to properly represent the significant surface current intensification along the Spanish coast under the direct effects of Gloria winds. The post-storm situation was characterized by an intensified Northern Current, as depicted in the observations. The model was found to overestimate surface currents at the Valencia buoy at the peak of the storm, probably directly affected by the wind overestimation provided by the high-resolution AEMET atmospheric model, but was then able to maintain a realistically intensified Northern Current during the several days following the storm. It also depicted a very local interesting SST drop signal in Tarragona, consistent with the pattern observed by the coastal buoy, but with a much weaker magnitude. In an HF-radar monitored the location of the Ibiza Channel, WMOP was found to represent the eastward current intensification under the strong storm winds with a good accuracy, improving estimates provided by larger-scale models. Finally, time series of the Ibiza Channel transport time series indicated that a 7-day period was found necessary for the circulation to restore to pre-storm characteristics after the end of the storm.
This multi-model assessment focused on the Storm Gloria has allowed identifying the strengths and limitations of the present operational capability in the Spanish Mediterranean coast to forecast an extreme coastal event. Apart from the classical recipes needed for the evolution of operational ocean model systems (i.e., increasing resolution to simulate finer scales, atmospheric forcing improving, introducing more-advanced data assimilation methods with inclusion of coastal and on-shelf observations), which are usually taken into account in service evolution roadmaps [see Le Traon et al. (2019) and Capet et al. (2020) for the CMEMS evolution guidelines and the EuroGOOS perspectives for improvement of operational ocean modeling capacity in Europe], the present study has pointed out some shortcomings in the current existing services that should be considered to make of them operational tools adequate to forecast extreme coastal events such as the Storm Gloria.
In this sense, it is important to mention the positive impact that the combination of wave states and ocean circulation in a coupled manner can have on forecasting the ocean response to extreme weather events such as the one here evaluated There are valuable examples in the literature demonstrating the benefits of the wave–current interaction coupling, not only in open-waters but also in shallower coastal areas (Onorato et al., 2011; Rautenbach et al., 2020). Specifically related to the effects that wave–current interactions had during Storm Gloria, Lorente et al. (2021) analyzed with HF radar-derived surface current observations a high particle dispersion in the northern part of the Ebro Delta, which might be closely related to strong interactions between high easterly waves and the accelerated upper flow. It should be noted that, out of the five model systems tested, only the CMEMS MED (one of the models identified with a better performance in the Ebro Delta region) partially included some ocean-wave coupling (Clementi et al., 2020). It is possible that this relatively good performance of MED locally can be explained by this wave–current contribution. However, further specific research should be done to analyze the improvement of the models predictive skills due to this model wave–current interaction.
On the other hand, this study clearly highlights the need for better characterization of the land boundary, specially of the coastal freshwater exchanges, in operational ocean services to improve their coastal hydrodynamics forecasts, particularly under severe weather conditions. Indeed, the lack of real-time updated river inputs was probably a major limitation for the performance of all the models during the storm event, especially at very coastal locations. This is not only a matter of including the freshwater contribution from major rivers, as it is done by now for most of the systems, which include climatological forcing for main rivers (in the case of the study area, only the Ebro river is considered). The study has demonstrated that ephemeral streams and minor rivers (such as the Francolí) may have determinant local effects, as seen during the Storm Gloria. Moreover, the inclusion of smaller rivers in the downscaled model domains can also increase the accuracy of the local predictions, although the characterization of their discharge rate might be tricky due to the torrential flow regime of many of these rivers along the Spanish Mediterranean coast. Downstream services, that aim to address these local phenomena, need to devote special effort to these issues.
Other factors that could be potentially improved are the air–sea interactions and the uses of meteorological forcing. Moreover, in this Storm Gloria case, uncertainties in the detailed representation of wind extremes in the high-resolution atmospheric forcing model led to uncertainties in the model predictions. While this uncertainty might be associated with this specific event, it will be worth evaluating this aspect again during forthcoming extreme events. Indeed, the two downstream local services here examined, the SAMOA and the WMOP, use the highest resolution operational atmospheric forecast available in the area (the AEMET Harmonie at 2.5 km resolution), which should improve the coarser resolution regional ECMWF forcing. However, and as shown in this Gloria study case, a systematic positive bias in wind speed is identified, and it is mandatory to carefully verify such wind forecasts over the sea, especially in extreme events. Furthermore, the need to improve the wind stress parameterization was also identified as a specific drawback for the SAMOA systems.
All these results, on-going developments and expected evolutions can certainly foster future model service upgrades both in CMEMS core and in downstream services aimed at better forecasting extreme coastal events.
Data Availability Statement
All the model and observational data sources used in this work are delivered by operational ocean monitoring and forecasting services. The data products can be found in the following public data repositories or catalogs:
CMEMS Core model products:
Downstream Forecast services:
SOCIB WMOP Forecast Service: https://thredds.socib.es/thredds/catalog/operational_models/oceanographical/hydrodynamics/wmop/catalog.html
PdE SAMOA Forecast services: http://opendap.puertos.es/thredds/catalog.html
(SAMOA Barcelona): http://opendap.puertos.es/thredds/catalog/circulation_coastal_bcn/catalog.html
(SAMOA Castellon): http://opendap.puertos.es/thredds/catalog/circulation_coastal_cas/catalog.html
(SAMOA Tarragona): http://opendap.puertos.es/thredds/catalog/circulation_coastal_tar/catalog.html
(SAMOA Almeria): http://opendap.puertos.es/thredds/catalog/circulation_coastal_alm/catalog.html
In situ observational data:
PdE mooring and tide gauges observational data source, the reader can go to: https://portus.puertos.es/#/&http://opendap.puertos.es/thredds/catalog.html
SOCIB in situ observation, please go to: https://www.socib.es/index.php?seccion=observingFacilities&facility=mooring
HF Radar products:
PdE Tarragona HF Radar Products are available at: http:// opendap.puertos.es/thredds/catalog/radar_local_deltaebro/catal og.html
SOCIB Ibiza HF Radar Products are available at: https:// thredds.socib.es/thredds/catalog/hf_radar/hf_radar_ibiza-scb_codarssproc001/catalog.html.
Author Contributions
MS contributed to the conceptualization, methodology, validation, formal analysis, investigation, writing—original draft preparation, writing—review and editing, and supervision. BM, MM, PL, RA, and MG-L contributed to the validation, formal analysis, investigation, and writing—original draft preparation. ML contributed to the writing—review and editing. AS contributed to the visualization and writing—review and editing. ME contributed to the supervision and writing—review and editing. EÁ contributed to the supervision and writing—review and editing. All authors contributed to the article and approved the submitted version.
Conflict of Interest
PL and RA were employed by the company Nologin Consulting S.L.
The remaining authors declare that the research was conducted in the absence of any commercial or financial relationships that could be construed as a potential conflict of interest.
Acknowledgments
This study has been conducted using E.U. Copernicus Marine Service Information. Specifically, from its NRT forecast products for the global, Mediterranean basin and the IBI area. Likewise, HF radar and ocean in situ observations from the Puertos del Estado and the SOCIB observing networks and systems have been used. The authors acknowledge the MEDCLIC project (LCF/PR/PR14/11090002), funded by “La Caixa” Foundation, contributing to the development of the WMOP hydrodynamic model.
Footnotes
References
Adger, N., Hughes, T. P., Folke, C., Carpenter, S. R., and Rockstrom, J. (2005). Social-Ecological resilience to coastal disasters. Science 309:1036. doi: 10.1126/science.1112122
Aguiar, E., Mourre, B., Juza, M., Reyes, E., Hernández-Lasheras, J., Cutolo, E., et al. (2020). Multi-platform model assessment in the Western Mediterranean Sea: impact of downscaling on the surface circulation and mesoscale activity. Ocean Dynam. 70, 273–288. doi: 10.007/s10236-019-01317-8
Amo, A., Reffray, G., Sotillo, M. G., Aznar, R. R., and Guihou, K. (2019). Product User Manual for the Atlantic -Iberian Biscay Irish- Ocean Physics Analysis and Forecast Product: Ibi_Analysis_Forecast_Phys_005_001. Toulouse: Copernicus Marine Environment Monitoring Service
Aznar, R., Sotillo, M. G., Cailleau, S., Lorente, P., Levier, B., Amo-Baladrón, A., et al. (2016). Strengths and weaknesses of the CMEMS forecasted and reanalyzed solutions for the Iberia–biscay–Ireland (IBI) waters. J. Mar. Sys. 159, 1–14. doi: 10.1016/j.jmarsys.2016.02.007
Bell, M. J., Le Traon, P. Y., Smith, N., Lefebvre, M., and Wilmer-Becker, K. (2009). The Global Ocean Data Assimilation Experiment (GODAE), Oceanography 22, 14–12. doi: 10.5670/oceanog.2009.62
Bernier, N., and Thompson, K. (2015). Deterministic and ensemble storm surge prediction for Atlantic Canada with lead times of hours to ten days. Ocean Modell. 86, 114–127. doi: 10.1016/j.ocemod.2014.12.002
Béthoux, J. P., Gentili, B., Morin, P., Nicolas, E., Pierre, C., and Ruiz-Pino, D. (1999). The Mediterranean Sea: a miniature ocean for climatic and environmental studies and a key for the climatic functioning of the North Atlantic. Prog. Oceanography 44, 131–146. doi: 10.1016/S0079-6611(99)00023-3
Bolaños, R., Jordà, G., Cateura, J., López, J., Puigdefábregas, J., Gómez, J., et al. (2009). The XIOM: 20 years of a regional coastal observatory in the Spanish Catalan coast. J. Mar. Systems 77, 237–260 doi: 10.1016/jmarsys.2007.12.018
Bouin, M. N., and Brossier, C. L. (2020). Surface processes in the 7 November 2014 medicane from air–sea coupled high-resolution numerical modelling. Atmospheric Chem. Phys. 20, 6861–6881. doi: 10.5194/acp-20-6861-2020
Cabanellas-Reboredo, M., Vázquez-Luis, M., Mourre, B., Álvarez, E., Deudero, S., Amores, A., et al. (2019). Tracking the dispersion of a pathogen causing mass mortality in the pen shell Pinna nobilis: a collaborative effort of scientists and citizens. Sci. Rep. 9:13355.
Calò, A., Lett, C., Mourre, B., Pérez-Ruzafa, A., and García-Charton, J. A. (2018). Use of lagrangian simulations to hindcast the geographical position of propagule release zones in a Mediterranean coastal fish. Mar. Environ. Res. 134, 16–27. doi: 10.1016/j.marenvres.2017.12.011
Capet, A., Fernández, V., She, J., Dabrowski, T., Umgiesser, G., Staneva, J., et al. (2020). Operational modeling capacity in European Seas—an EuroGOOS perspective and recommendations for improvement. Front. Mar. Sci. 7:129. doi: 10.3389/fmars.2020.00129
Capó, E., Orfila, A., Sayol, J. M., Juza, M., Sotillo, M. G., Conti, D., et al. (2016). Assessment of operational models in the Balearic Sea during a MEDESS-4MS experiment. Deep Sea Res. Part II: Top. Stud. Oceanography 133, 118–131. doi: 10.1016/j.dsr2.2016.03.009
Chapman, R. D., and Graber, H. C. (1997). Validation of HF radar measurements. Oceanography 10, 76–79. doi: 10.5670/oceanog.1997.28
Clark, J. R. (1992). Integrated Management of Coastal Zones. FAO Fisheries Technical Paper. No. 327. FAO: Rome.
Clementi, E., Grandi, A., Lyubartsev, V., and Escudier, R. (2020). Quality Information Document for the Mediterranean Ocean Physics Analysis and Forecast Product: Medsea_Analysis_Forecast_Phy_006_013. Toulouse: Copernicus Marine Environment Monitoring Service.
Clementi, E., Pistoia, J., Escudier, R., Delrosso, D., Drudi, M., Grandi, A., et al. (2019). Mediterranean Sea Analysis and Forecast (CMEMS MEDCurrents EAS5 system, 2017-2020). Toulouse: Copernicus Marine Environment Monitoring Service.
CMEMS (2020). The European Copernicus Marine Environment Monitoring Service (CMEMS). Toulouse: Copernicus Marine Environment Monitoring Service.
Compa, M., Alomar, C., Mourre, B., March, D., Tintoré, J., and Deudero, S. (2020). Nearshore spatio-temporal sea surface trawls of plastic debris in the Balearic Islands. Mar. Environ. Res. 158:104945. doi: 10.1016/j.marenvres.2020.104945
De Alfonso, M., Lin-Ye, J., García-Valdecasas, J. M., Pérez-Rubio, S., Luna, M. Y., Santos-Muñoz, D., et al. (2021). Storm Gloria: sea state evolution based on insitu measurements and modeled data and its impact on extreme values. Front. Mar. Sci. doi: 10.3389/fmars.2021.646873
De Mey-Frémaux, P., Ayoub, N., Barth, A., Brewin, R., Charria, G., Campuzano, F., et al. (2019). Model-Observations synergy in the Coastal Ocean. Front. Mar. Sci. 6:436. doi: 10.3389/fmars.2019.00436
Dombrowsky, E., Bertino, L., Brassington, G. B., Chassignet, E. P., Davidson, F., Hurlburt, H. E., et al. (2009). GODAE systems in operation. Oceanography 22, 80–95. doi: 10.5670/oceanog.2009.68
Fablet, R., Verron, J., Mourre, B., Chapron, B., and Pascual, A. (2018). Improving mesoscale altimetric data from a multi-tracer convolutional processing of standard satellite-derived products. IEEE Trans. Geosci. Remote Sens. 56, 2518–2525. doi: 10.1109/TGRS.2017.2750491
Fairall, C. F., Bradley, E. F., Hare, J. E., Grachev, A. A., and Edson J. B. (2003). Bulk parameterization of air-sea fluxes: Updates and verification for the COARE algorithm. J. Clim. 16, 571–591. doi: 10.1175/1520-0442(2003)016<0571:BPOASF>2.0.CO;2
GODAE-OceanView Program (2020). www.godae-oceanview.org (accessed March 17, 2021).
Gómez-Navarro, L., Fablet, R., Mason, E., Pascual, A., Mourre B., Cosme E., et al. (2018). SWOT spatial scales in the Western Mediterranean Sea derived from pseudo-observations and an ad-hoc filtering. Remote Sens. 10:599. doi: 10.3390/rs10040599
Gràcia, V., García-León, M., Grifoll, M., and Sánchez-Arcilla, A. (2013), Breaching of a barrier under extreme events. The role of morphodynamic simulations. J. Coastal Res. 65, 951–956. doi: 10.2112/SI65-161.1
Hernandez, F., Blockley, E., Brassington, G. B., Davidson, F., Divakaran, P., Drévillon, M., et al. (2015). Recent progress in performance evaluations and near real-time assessment of operational ocean products. J. Operat. Oceanography 8(Sup 2), S221–S238, doi: 10.1080/1755876X.2015.1050282
Hernandez-Lasheras, J., and Mourre, B. (2018). Dense CTD survey versus glider fleet sampling : comparing data assimilation performance in a regional ocean model West of Sardinia. Ocean Sci. 14, 1069–1084. doi: 10.5194/os-14-1069-2018
Heslop, E., Tintoré, J., Rotllan, P., Alvarez-Berastegui, D., Frontera, B., Mourre, B., et al. (2019). SOCIB integrated multi-platform ocean observing and forecasting: from ocean data to sector-focused delivery of products and services. J. Oper. Oceanogr. 12, S67–S79. doi: 10.1080/1755876X.2019.1582129
Juza, M., Mourre, B., Renault, L., Gómara, S., Sebastián, K., Lora, S., et al. (2016). SOCIB operational ocean forecasting system and multi-platform validation in the Western Mediterranean Sea. J. Operat. Oceanography 9, S155–S166. doi: 10.1080/1755876X.2015.1117764
Kersting, D. K., Vázquez-Luis, M., Mourre, B., Belkhamssa, F. Z., Álvarez, E., Bakran-Petricioli, T., et al. (2020). Recruitment disruption and the role of unaffected populations for potential recovery after the pinna nobilis mass mortality event. Front. Mar. Sci. 7:594378. doi: 10.3389/fmars.2020.594378
Law Chune, S., Nouel, L., Fernández, E., and Derval, C. (2019). Product User Manual for the Global Ocean Sea Physical Analysis and Forecasting Products Global_Analysis_Forecast_Phy_001_024. Toulouse: Copernicus Marine Environment Monitoring Service.
Le Traon, P. Y., Reppucci, A., Alvarez Fanjul, E., Aouf, L., Behrens, A., Belmonte, M., et al. (2019). From observation to information and users: the copernicus marine service perspective. Front. Mar. Sci. 6:234. doi: 10.3389/fmars.2019.00234
Lellouche, J. M., Le Galloudec, O., Drévillon, M., Régnier, C., Greiner, E., Garric, G., et al. (2013). Evaluation of global monitoring and forecasting systems at Mercator Océan. Ocean Sci. 9, 57–81
Lellouche, J-M, Greiner, E, Le Galloudec, O, Garric, G, Regnier, C, Drevillon, M. et al. (2018). Recent updates on the Copernicus Marine Service global ocean monitoring and forecasting real-time 1/12° high resolution system. Ocean Sci. 14, 1093–1126. doi: 10.5194/os-2018-15
Ličer, M., Smerkol, P., Fettich, A., Ravdas, M., Papapostolou, A., Mantziafou, A., et al. (2016). Modeling the ocean and atmosphere during an extreme bora event in northern Adriatic using one-way and two-way atmosphere–ocean coupling. Ocean Sci. 12, 71–86. doi: 10.5194/os-12-71-2016
Lin, X., Yan, X. H., Jiang, Y., and Zhang, Z. (2016). Performance assessment for an operational ocean model of the Taiwan Strait. Ocean Modell. 102, 27–44. doi: 10.1016/j.ocemod.2016.04.006?
Linnenluecke, M. K., and Griffiths, A. (2011). Assessing organizational resilience to climate and weather extremes: complexities and methodological pathways. Climatic Change 113, 933–947. doi: 10.1007/s10584-011-0380-6
Lorente, P., Lin-Ye, J., García-León, M., Reyes, E., Fernandes, M., Sotillo, M. G., et al. (2021). On the performance of High Frequency radar in the Western Mediterranean during the record-breaking Storm Gloria. Special Issue: coastal-extension-of-cmems-products-models-data-and-applications. Front. Mar. Sci. 8:645762. doi: 10.3389/fmars.2021.645762
Lorente, P., Sotillo, M. G., Amo-Baladrón, A., Aznar, R., Levier, B., Aouf, L., Dabrowski, T., et al. (2019a) “The NARVAL software toolbox in support of ocean models skill assessment at regional and coastal scales,” in Computational Science – ICCS 2019. ICCS 2019. Lecture Notes in Computer Science: Rodrigues J (ed). (Cham: Springer). doi: 10.1007/978-3-030-22747-0_25
Lorente, P., Sotillo, M. G., Amo-Baladrón, A., Aznar, R., Levier, B., Sánchez-Garrido, J. C., et al. (2019b). Skill assessment of global, regional, and coastal circulation forecast models: evaluating the benefits of dynamical downscaling in IBI (Iberia–Biscay–Ireland) surface waters. Ocean Sci. 15, 967–996. doi: 10.5194/os-15-967-2019
Mahadevan, A., D’Asaro, E. A., Allen, J. T., Almaraz García, P., Alou-Font, E., and Aravind, H. M. et al. (2020). CALYPSO 2019 Cruise Report: Field Campaign in the Mediterranean. WHOI Technical Report 2020-02. Geneva: WHO. doi: 10.1575/1912/25266
Mason, E., Ruiz, S., Bourdalle-Badie, R., Reffray, G., García-Sotillo, M., and Pascual, A. (2019). New insight into 3-D mesoscale eddy properties from CMEMS operational models in the western Mediterranean. Ocean Sci. 15, 1111–1131. doi: 10.5194/os-15-1111-2019
McCarthy, J. J., Canziani O. F., Leary N. A., Dokken D. J., and White K. S. (2001). Climate Change 2001: Impacts, Adaptation, and Vulnerability. Cambridge: Cambridge University Press.
Met Office Factsheet (2016). Weather extremes. National Meteorological Library and Archive Factsheet 9 - Weather extremes. Available at https://www.metoffice.gov.uk/research/library-and-archive/publications/factsheets (accessed March 17, 2021).
Mourre B., Aguiar E., Juza M., Hernandez-Lasheras J., Reyes E., Heslop E., et al. (2018). “Assessment of high-resolution regional ocean prediction systems using muli-platform observations: illustrations in the Western Mediterranean Sea,” in New Frontiers in Operational Oceanography, Eds E. Chassignet, A. Pascual, J. Tintoré, and J. Verron, GODAE Ocean View, 663–694. doi: 10.17125/gov2018.ch24.
Nicholls, RJ. (2004). Coastal flooding and wetland loss in the 21st century: changes under the SRES climate and socio-economic scenarios. Glob. Environ. Change 14:69 doi: 10.1016/j.gloenvcha.2003.10.007
Onorato, M., Proment, D., and Toffoli, A. (2011). Triggering rogue waves in opposing currents. Phys. Rev. Lett. 107:184502. doi: 10.1103/PhysRevLett.107.184502
Oke, P. R., Brassington, G. B., Cummings, J. A., Martin, M. J., and Hernandez, F. (2012). GODAE inter-comparisons in the Tasman and Coral Seas. J Oper Oceanogr. 5:11–24. doi: 10.1080/1755876X.2012.11020135
Pinardi, N., and Masetti, E. (2000). Variability of the large scale general circulation of the Mediterranean Sea from observations and modelling: a review. Palaeogeography Palaeoclimatol. Palaeoecol. 158, 153–173. doi: 10.1016/S0031-0182(00)00048-41
Rautenbach, C., Daniels, T., de Vos, M., and Barnes, M. A. (2020). A coupled wave, tide and storm surge operational forecasting system for South Africa: validation and physical description. Nat. Hazards 103, 1407–1439. doi: 10.1007/s11069-020-04042-4
Ruiz-Orejón, L. F., Mourre, B., Sarda, R., Tintoré, J., and Ramis-Pujol, J. (2019). Quarterly variability of floating plastic debris in the marine protected area of the menorca channel (Spain). Environ. Pollut. 252, 1742–1754. doi: 10.1016/j.envpol.2019.06.063
Ruiz-Parrado, I., Genua-Olmedo, A., Reyes, E., Mourre, B., Rotllán, P., Lorente, P., and García-Sotillo, M. et al. (2020). Coastal ocean variability related to the most extreme Ebro river discharge over the last 15 years. in: copernicus marine service ocean state report. J. Operat. Oceanography 13(Sup 1), S160–S165. doi: 10.1080/1755876X.2020.1785097
Sakamoto, K., Tsujino, H., Nakano, H., Urakawa, S., Toyoda, T., Hirose, N., et al. (2019). Development of a 2-km resolution ocean model covering the coastal seas around Japan for operational application. Ocean Dynam. 69, 1181–1202. doi: 10.1007/s10236-019-01291-1
Sánchez-Arcilla, A., García-León, M., and Gràcia, V. (2014), Hydro-morphodynamic modelling in Mediterranean storms – errors and uncertainties under sharp gradients. Nat. Hazards Earth Systems 14, 2993–3004. doi: 10.5194/nhess-14-2993-2014
Sánchez-Arcilla, A., González-Marco, D., and Bolaños R. (2008). A review of wave climate and prediction along the SpanishMediterranean coast. Nat. Hazards Earth Syst. Sci. 8, 1217–1228. doi: 10.5194/nhess-8-1217-2008
Schiller, A., Bell, M., Brassington, G., Brasseur, P., Barciela, R., and De Mey, P. et al. (2015). Synthesis of new scientific challenges for GODAE OceanView. J. Operat. Oceanography 8(Sup 2), S259–S271, doi: 10.1080/1755876X.2015.1049901
Shchepetkin, A. F., and McWilliams, J. C. (2005). The regional oceanic modeling system (ROMS): a split explicit, free-surface, topography-following-coordinate oceanic model. Ocean Modell. 9, 347–404. doi: 10.1016/j.ocemod.2004.08.002
Smith, W. H. F., and Sandwell, D. T. (1997), Global sea floor topography from satellite altimetry and ship depth soundings. Science 277, 1956–1962. doi: 10.1126/science.277.5334.1956
Sotillo, M. G., Cailleau, S., Lorente, P., Levier, B., Aznar, R., Reffray, G., et al. (2015). The MyOcean IBI ocean forecast and reanalysis systems: operational products and roadmap to the future Copernicus service. J. Oper. Oceanogr. 8, 63–79. doi: 10.1080/1755876X.2015.1014663
Sotillo, M. G., Cerralbo, P., Lorente, P., Grifoll, M., Espino, M., and Sanchez-Arcilla, A. et al. (2019). Coastal ocean forecasting in Spanish ports: the SAMOA operational service. J. Operat. Oceanography 13, 37–54. doi: 10.1080/1755876X.2019.1606765
Sotillo, M. G., Amo-Baladrón, A., Padorno, E., Garcia-Ladona, E., Orfila, A., and Rodríguez-Rubio, P. et al. (2016). How is the Surface Atlantic water inflow through the Gibraltar Strait forecasted? a lagrangian validation of operational oceanographic services in the Alboran Sea and the Western Mediterranean. Deep-Sea Res. PartII. 133, 100–117. doi: 10.1016/j.dsr2.2016.05.020
Umlauf, L., and Burchard, H. (2003). A generic length-scale equation for geophysical turbulence models. J. MArine Res. 61, 235–265. doi: 10.1357/002224003322005087
Keywords: operational ocean models, extreme event simulations, in situ ocean model validation, dynamical downscaling, CMEMS core model products, coastal SAMOA systems, WMOP model, Western Mediterranean Storm Gloria
Citation: Sotillo MG, Mourre B, Mestres M, Lorente P, Aznar R, García-León M, Liste M, Santana A, Espino M and Álvarez E (2021) Evaluation of the Operational CMEMS and Coastal Downstream Ocean Forecasting Services During the Storm Gloria (January 2020). Front. Mar. Sci. 8:644525. doi: 10.3389/fmars.2021.644525
Received: 21 December 2020; Accepted: 08 March 2021;
Published: 01 April 2021.
Edited by:
Isabel Iglesias, University of Porto, PortugalReviewed by:
Ivica Vilibic, Institute of Oceanography and Fisheries (IZOR), CroatiaGianmaria Sannino, Italian National Agency for New Technologies, Energy and Sustainable Economic Development (ENEA), Italy
Copyright © 2021 Sotillo, Mourre, Mestres, Lorente, Aznar, García-León, Liste, Santana, Espino and Álvarez. This is an open-access article distributed under the terms of the Creative Commons Attribution License (CC BY). The use, distribution or reproduction in other forums is permitted, provided the original author(s) and the copyright owner(s) are credited and that the original publication in this journal is cited, in accordance with accepted academic practice. No use, distribution or reproduction is permitted which does not comply with these terms.
*Correspondence: Marcos G. Sotillo, bWFyY29zQHB1ZXJ0b3MuZXM=