 Angélique Melet1*
 Carlo Buontempo2
 Matteo Mattiuzzi3Peter Salamon4
 Pierre Bahurel1George Breyiannis4
 Samantha Burgess2Laurence Crosnier1
 Pierre-Yves Le Traon1Lorenzo Mentaschi4Julien Nicolas2
 Lorenzo Solari3,5Freja Vamborg2
 Evangelos Voukouvalas6
- 1Mercator Ocean International, Ramonville-Saint-Agne, France
- 2European Centre for Medium Range Weather Forecasts, Reading, United Kingdom
- 3European Environment Agency, Copenhagen, Denmark
- 4European Commission, Joint Research Center, Ispra, Italy
- 5Centre Tecnològic de Telecomunicacions de Catalunya (CTTC/CERCA), Castelldefels, Spain
- 6Unisystems Luxembourg Sàrl, Luxembourg, Luxembourg
Sea-level rise is a direct consequence of climate change. Primarily due to ocean thermal expansion and transfer from land ice (glaciers, ice sheets) to the ocean, sea-level rise is therefore an integrated indicator of climate change. Coastal zones and communities are expected to be increasingly threatened by sea level changes, with various adverse and widespread impacts. The European Union’s Earth Observation Programmed, Copernicus, monitors our planet and its environment, for the ultimate benefit of society. This includes the monitoring of sea level changes and the provision of ancillary fields needed to assess sea-level rise coastal risks, to guide adaptation and to support related policies and directives. Copernicus is organized with a space component, including dedicated Earth Observation satellites (Sentinel missions), and services, which transform the wealth of satellite, in situ and integrated numerical model information into added-value datasets and information usable by scientists, managers and decision-makers, and the wider public. Here, an overview of the Copernicus products and services to inform on sea level rise adaptation is provided. Perspectives from Copernicus services on future evolutions to better inform on coastal sea level rise, associated risks, and support adaptation are also discussed.
Introduction
Sea-level (SL) changes are a major threat for coastal zones (Cazenave and Le Cozannet, 2014; Hinkel et al., 2015; Oppenheimer et al., 2019), causing flooding, salinization of soils, aquifers and surface water, degrading coastal ecosystems. At the same time, population and economic assets are increasingly exposed to sea-level rise (SLR) adverse effects due to current and projected growth in coastal population and urbanization (e.g., Neumann et al., 2015; Wolff et al., 2020). In Europe alone, more than 50 million people live in the low-elevation coastal zone and 30 million in the 100-year event flood coastal plain (Neumann et al., 2015). Risks (including these associated with sea-level rise) are due to a combination of sea-level hazards, exposure, and vulnerability (Cardona et al., 2012). Mitigation and adaptation measures can reduce SLR related risks (e.g., Hinkel et al., 2014; Oppenheimer et al., 2019), and should be supported by useful and authoritative information.
In terms of hazards, sea level has risen by ∼20 cm since 1900 (Dangendorf et al., 2017; Oppenheimer et al., 2019). In 2100, compared to the 1986-2005 baseline, sea level is projected to rise by 43 ± 15 cm (likely range, probability higher than 66% that SLR falls within this range) in a low-emission/high-mitigation scenario (RCP2.6), or 84 ± 30 cm in a high-emission/low-mitigation scenario (RCP8.5) (Oppenheimer et al., 2019). Historical extreme water levels, such as these experienced during storms, will be reached more often during the 21st century due to the gradual mean sea level rise, transforming historical centennial events into yearly events in many parts of the world before 2100 (Vousdoukas et al., 2018a; Oppenheimer et al., 2019). Locally, this trend can be exacerbated or reduced by the projected changes in magnitude and frequency of meteorological extremes such as storm surges (Vousdoukas et al., 2018a; Mori et al., 2019), waves (Mentaschi et al., 2017; Morim et al., 2019; Meucci et al., 2020), and their interaction with precipitations (Wahl et al., 2015; Bevacqua et al., 2019, 2020) and other extremes. As a consequence, the 100-year extreme water levels (with a chance of occurence of 1% every year) will increase, on a global average, from 34 to 76 cm under a moderate-emission/moderate-policy scenario (RCP4.5) to 58-172 cm in a high-emission/low-mitigation scenario (RCP8.5) in 2100, compared to 2000 (Vousdoukas et al., 2018a). An increase of sea levels also poses a threat as a driver of coastal erosion (Mentaschi et al., 2018), and could lead to an obliteration of significant portions of coasts and beaches, especially in low-lying areas (Vousdoukas et al., 2020a).
Coastal zones are increasingly more densely populated and host megacities, critical assets, and are fostering economic growth, a trend accompanied by land conversion and urbanization (e.g., Neumann et al., 2015). The exposure of people and assets to SLR hazards is therefore widespread and increasing. Changes in the coastal environment can also enhance the vulnerability of coastal zones. For instance, coastal ecosystems such as dunes, reefs, mangroves are playing a regulating role and protect the shoreline (Temmerman et al., 2013; Ferrario et al., 2014; Fernandez-Montblanc et al., 2020). The degradation of such ecosystems can increase the exposure of coastal zones, population and assets to extreme sea levels.
In Europe, several regions are particularly exposed to SLR and its adverse effects, which include flooding and submergence of coastal areas, erosion, saltwater intrusion in surface and ground waters, degradation of coastal ecosystems and habitats, and impeded drainage. Deltas, such as the Rhine-Meuse-Escault (NL), Rhone (FR), Pô (IT), and Ebro (SP), are regions particularly vulnerable to SLR. Rotterdam and Amsterdam especially are amongst the world’s most exposed cities in terms of population living in the 100-year event flood plain (Hallegatte et al., 2013). In addition to human fatalities, economic losses due to coastal flood risks are huge. The Mediterranean coast concentrates cities where the annual average losses due to coastal flooding will increase the most by 2050, if adaptation only maintains present defense standards or flood probability (Hallegatte et al., 2013). This is due to the fact that many of these cities were built close to the shore, in a region where historical sea level variability has been low (e.g., small tidal range, interannual variability). Presently, the expected annual damage of coastal flood in Europe is of €1.25 billion euros, but could increase by 2-3 orders of magnitudes if coastal adaptation is only maintained to its current level (Vousdoukas et al., 2018b). The increased hazards posed by sea-level rise in response to climate change has been identified as the main driver of future rise in coastal flood losses, with the relative importance of exposure (coastward migration, urbanization and rising asset values) diminishing over time (Vousdoukas et al., 2018b).
To decrease SLR induced risks and increase the resilience of our coastal zones and societies, different adaptation measures can be implemented. Main SLR adaptation responses include hard protection (e.g., dykes), accommodation (e.g., flood-resistant buildings, lifted housing), ecosystem-based protection (e.g., dunes, mangroves, reefs), and inland retreat (planned relocation) (Oppenheimer et al., 2019). A cost-benefit analysis of adaptation to SLR through additional protection with dykes showed that at least 83% of flood damages in Europe could be avoided by elevating dykes along a quarter to a third of Europe’s coastline (Vousdoukas et al., 2020b). Although the focus is here on adaptation, mitigation of climate change through reduction of emissions of greenhouse gasses and / or carbon dioxide removal (Rogelj et al., 2018) should be pursued as well to reduce hazards themselves as SLR and extreme sea levels are projected to be approximately halved in a low-emission/high-mitigation scenario (RCP2.6) compared to a high-emission/low-mitigation climate change scenario (RCP8.5) (Oppenheimer et al., 2019).
Faced with sea-level rise potential adverse effects, countries and state organizations have issued various policies to monitor, mitigate and adapt to SLR risks. Among the different existing policies, the Integrated Coastal Zone Management, EU Flood Risk Directive, EU Water Framework Directive, the EU Green Deal and the new EU Strategy on Adaptation to Climate Change1 are of particular importance (e.g., Nixon, 2015; Bisaro et al., 2020). To guide adaptation, information is a prerequisite. Different kinds of SLR information are needed for different kinds of contexts to support coastal adaptation decision making (Hinkel et al., 2019).
Europe’s Earth Observation (EO) Program, Copernicus, monitors our planet and its environment, for the ultimate benefit of society. The Program is funded, coordinated and managed by the European Commission and is driven by policies, to support them, and by requirements from users, including coastal managers. The space component of Copernicus, with the Sentinel satellite family, is currently the largest world producer of freely and openly available EO data (Benveniste et al., 2020). Sentinel-1, 2, 3, and 6 deliver information on sea level and on other required fields to monitor drivers of sea level hazards (e.g., surface wind and waves) and on risk itself (Melet et al., 2020a). Copernicus Services then transform the wealth of satellite data and combine them with in-situ and integrated numerical models to produce added-value, relevant, quality-assessed datasets and information (sections “Sea-Level Change Hazard” to “Vulnerability”). On top of this integrated-system, added-value products layer, additional layers have been developed in Copernicus Services to analyze and process the data into information usable by the scientific community, managers and policy makers, other downstream sectors and to provide services associated to information delivery (sections “Managing and Monitoring of Coastal Floods and Risks” to “A Service Layer”).
Copernicus value-adding activities and products are streamlined through six services. Of particular importance for SLR adaptation are:
The Copernicus Marine Environment Monitoring Service (CMEMS2), also known as the Copernicus Marine Service, implemented by Mercator Ocean International. CMEMS provides regular and systematic reference information on the physical and biogeochemical state, variability and dynamics of the ocean, including sea level, for the European regional seas and the global ocean, over the past decades, for the current state and for the coming days (forecasts).
The Copernicus Land Monitoring Service (CLMS3), implemented by the European Environment Agency (EEA) and the European Commission Directorate General Joint Research Centre (JRC). CLMS provides geospatial information on land cover and its changes, land use, vegetation state, water cycle, cryosphere and earth surface energy to a broad range of users in Europe and across the world in the field of environmental applications.
The Copernicus Climate Change Service (C3S4), implemented by the European Centre for Medium-Range Weather Forecasts (ECMWF). C3S supports the adaptation and mitigation policies of the European Union by providing consistent and authoritative information about the past, present and future climate change in Europe and the rest of the world.
The Copernicus Emergency Management Service (CEMS5), implemented by the JRC. CEMS supports all actors involved in the management of natural or manmade disasters by providing geospatial data and images for informed decision making. CEMS constantly monitors Europe and the globe for signals of an impending disaster, such as flooding, or evidence of one happening in real time and provides maps, time-series or other relevant information to better manage disaster risk.
The Copernicus Program is long-term oriented, and Copernicus Services will start a new phase for the 2021-2027 period.
This paper provides a review of the current status of Copernicus Services with respect to sea level rise adaptation, describing products, information and services provided to users (section “Current Status of Copernicus Services Information for Sea-Level Rise Adaptation”). Perspectives from Copernicus services on future evolutions during the 2021-2027 period to better inform on coastal sea-level changes and associated risks are discussed in section “Perspectives on Copernicus Services for SLR Adaptation”.
Current Status of Copernicus Services Information for Sea-Level Rise Adaptation
An overview of the current information provided by Copernicus Services for SLR adaptation is provided in this section. Generally speaking, risk is the combination of hazard, exposure, and vulnerability (Cardona et al., 2012). This section starts by addressing these three components (Figure 1).
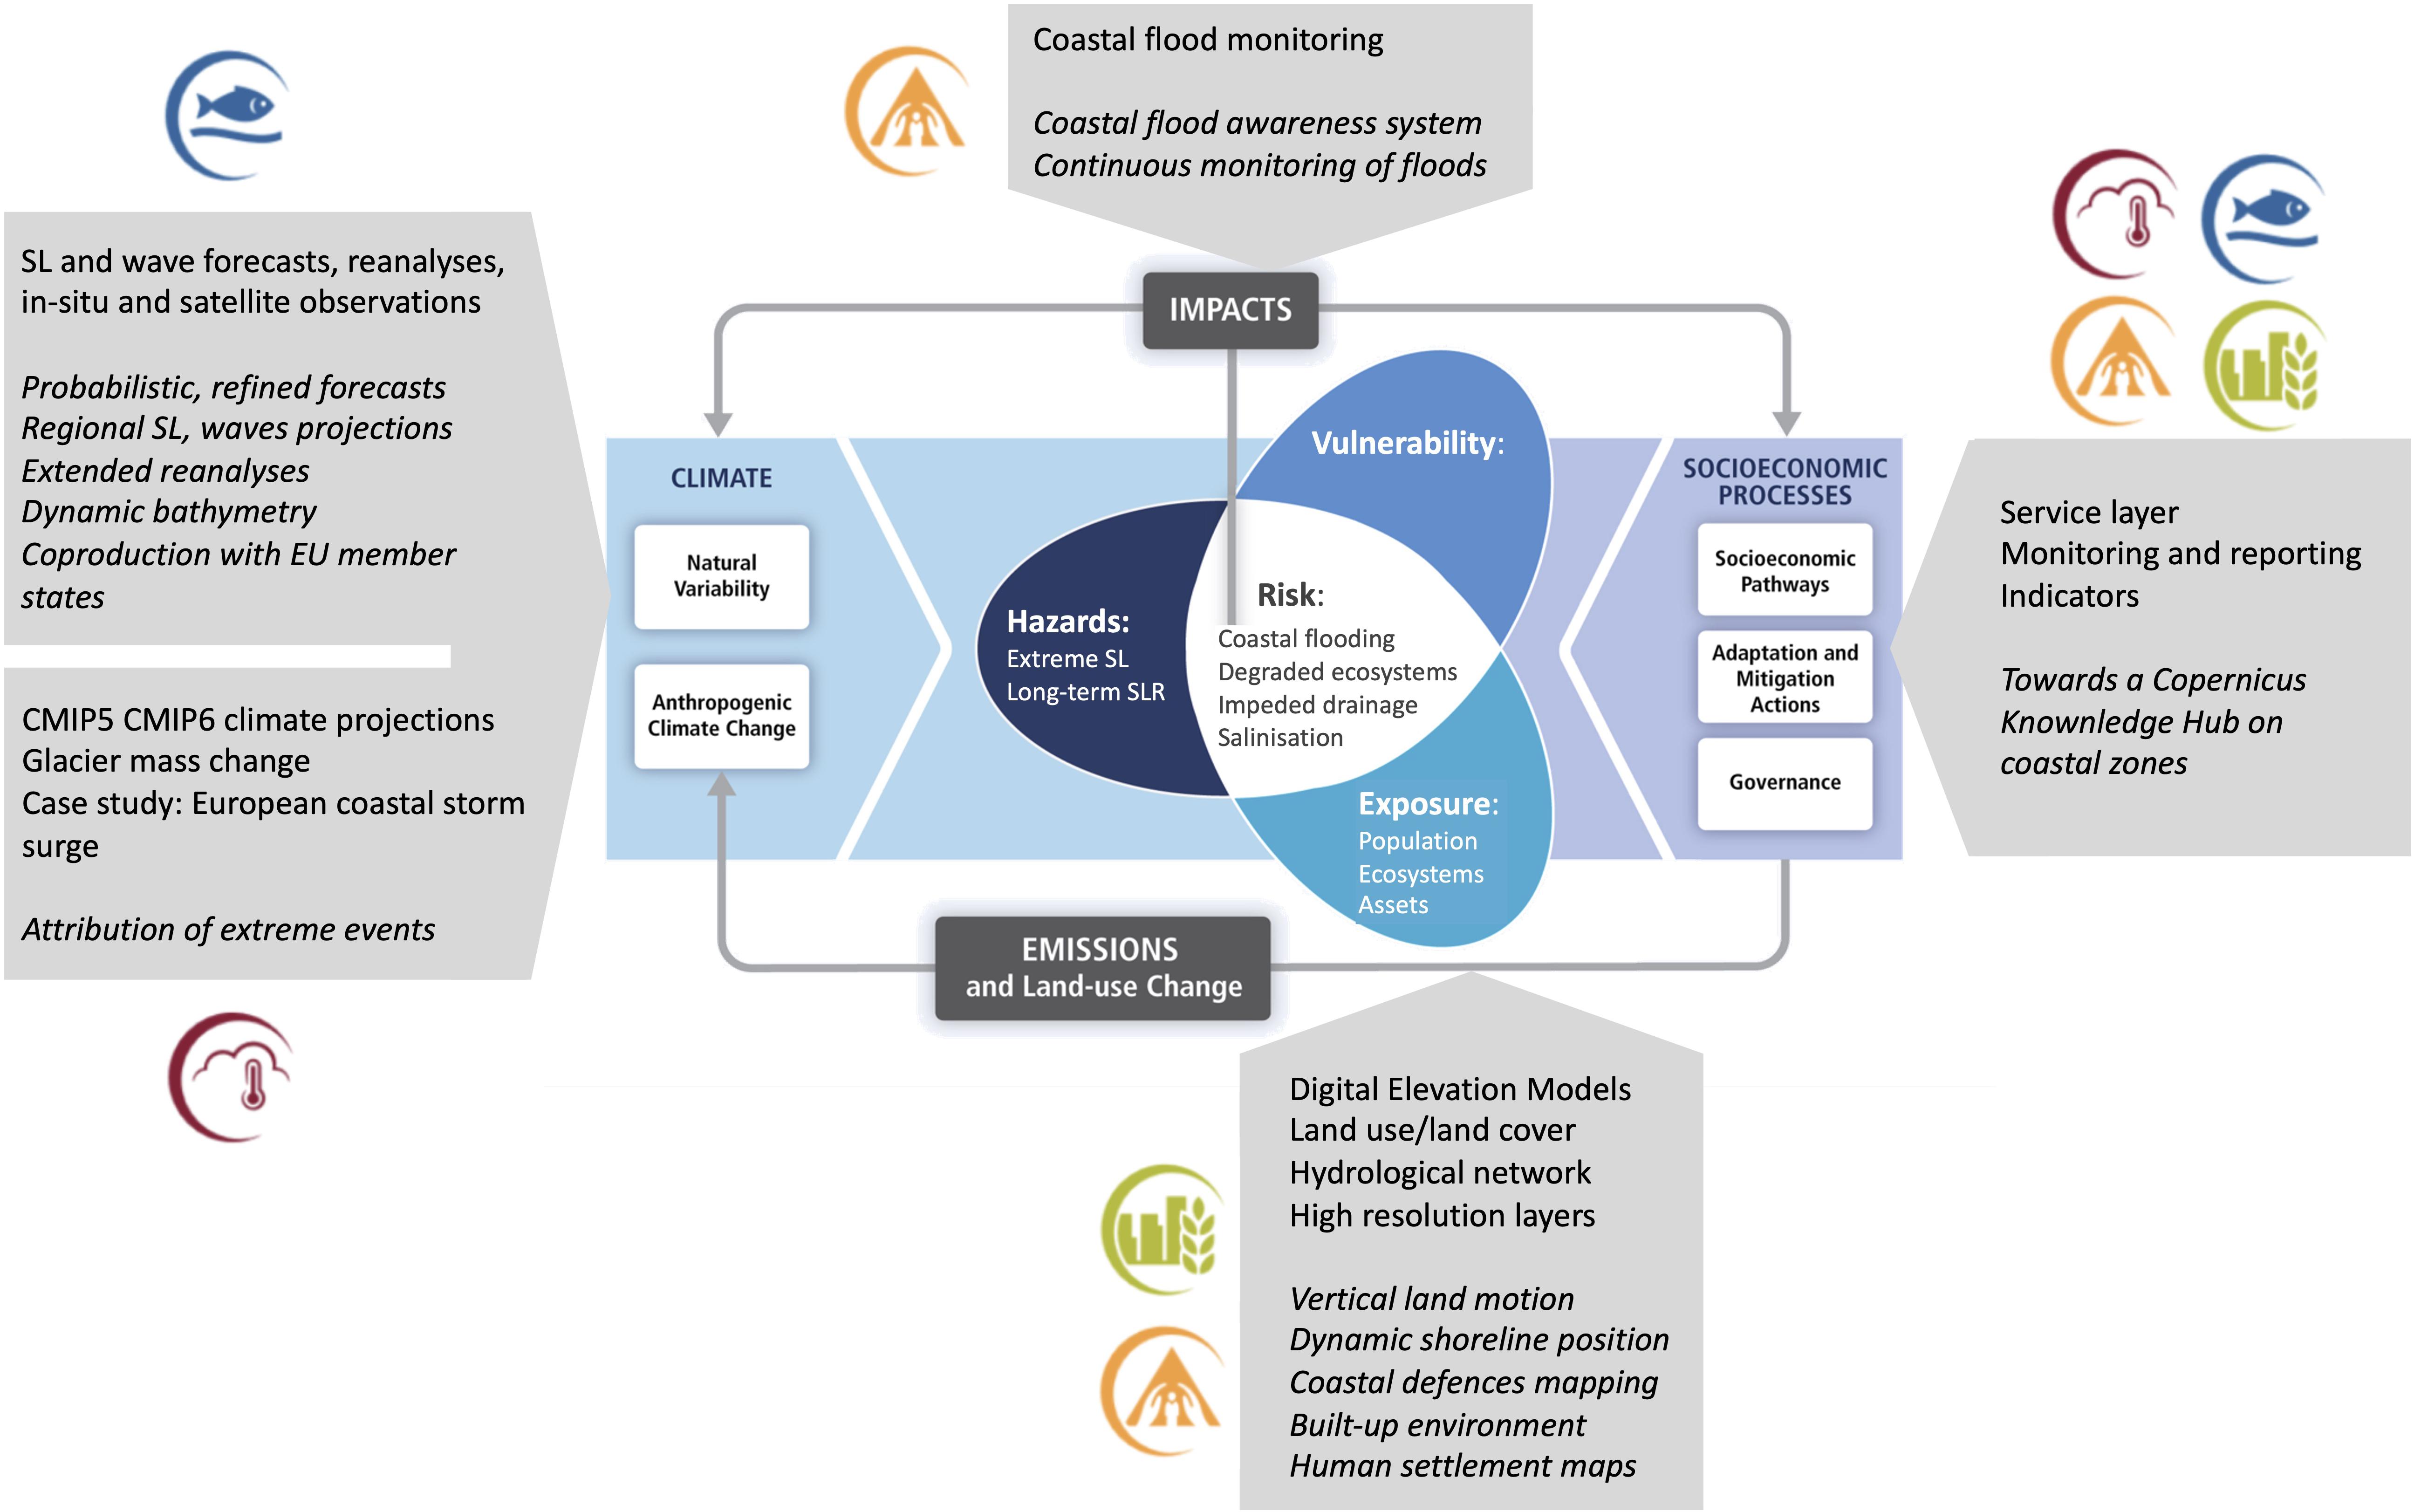
Figure 1. Illustrative Copernicus services products and activities relevant to sea-level rise adaptation (in gray boxes). Activities listed in italics correspond to potential new services in Copernicus 2 (2021-2027). Symbols indicate the different corresponding Copernicus Services: CMEMS in blue, C3S in red, CEMS in orange, CLMS in green. In the figure center, the components of SLR related risks, e.g., hazard, exposure and vulnerability, are listed. Adaptation aims at reducing SLR risks. Based on figure 1.1. from the IPCC SREX report (Lavell et al., 2012). SL stands for sea level.
Sea-Level Change Hazard
Sea-level changes and their different components are being monitored in Copernicus across a wide range of time-scales based on observations (in situ and satellite) and numerical models (climate models, reanalyses, forecasts). Monitoring over the last decades can provide a historical baseline of sea level changes, which is instrumental in characterizing e.g., sea level extremes, return periods, contributions of different drivers. Forecasts with a few days lead time can feed early warning systems. Projections over the 21st century can inform mid to long-term adaptation strategies.
A multitude of processes are driving relative (i.e., relative to land elevation) sea level changes at global, regional and coastal scales (e.g., Woodworth et al., 2019). Global mean sea level (GMSL) rise is due both to thermal expansion of the warming ocean and to the transfer of land ice and water mass to the ocean (from ice sheets, glaciers and land water storage changes) (e.g., WCRP Global Sea Level Budget Group, 2018). The glacial isostatic adjustment (GIA) also induces GMSL changes due to modifications in ocean basin geometry (e.g., Spada and Melini, 2019). At regional scales, sea level changes are mostly driven by the redistribution of heat, salt and mass within the ocean forced by ocean circulations (e.g., Meyssignac and Cazenave, 2012; Forget and Ponte, 2015). Transfers of mass from land to the ocean (GIA, contemporary land ice mass loss) induce changes in Earth’s gravity, rotation as well as solid Earth viscoelastic deformations, which in turn induce regional relative sea level changes (Farrell and Clark, 1976; Riva et al., 2010). In terms of SLR related hazards, the sea level that matters is the relative coastal sea level change. At the coast, sea level changes are due to the superimposition of the offshore regional mean sea level and of changes driven by additional processes which express themselves or are amplified in the coastal zone such as tides, wave set up and swash, storm surges, river discharges (e.g., Woodworth et al., 2019) and their interactions (Idier et al., 2019). Tides, storm surges and waves are especially important for extreme events, which pose the greatest hazards. Monitoring the different processes causing relative coastal sea level changes is important in assessing the local coastal zone risk as they can impact the coast differently.
Sea Level Observations
In situ and satellite observations of sea level deliver time-series of past and near-real-time sea-level changes. The accuracy of high-frequency tide gauge sea level measurements is of 1-cm (Intergovermental Oceanographic Commission (IOC), 2006) while uncertainties for sea level rise observed by spatial altimetry are of 0.4 mm year–1 for global mean sea level rise (Ablain et al., 2019) and are lower than 1.5 mm year–1 for trends at regional scale at the 90% confidence level (Prandi et al., 2021). They provide the ground truth for assessment of numerical models used to produce forecasts (and are constraining them through data assimilation), climate hindcasts and projections. They also form the historical baseline to monitor the evolution of sea level, including extremes, or the reference level used for national height systems (Wöppelmann et al., 2014). Observations are also key for understanding the factors causing sea level changes.
Tide gauges provide local observations of relative sea level changes at a high frequency, which is needed to capture sea level extremes (Woodworth et al., 2016, see also an example in Figures 2C,D for Venice in November 2019). Some tide gauge records date back to the 18th century and the network has extended over time (Marcos et al., 2019). Tide gauge records are provided in CMEMS with a focus on Europe and on near-real time and high-frequency data. Real time quality control procedures are applied following GLOSS standards and a collaboration with the EuroGOOS Tide Gauge Task Team has been set up to improve the quality control of tide gauge records in CMEMS. Wave buoys data are also distributed. In addition to their own value, these datasets are used for the quality assessment of modeled sea level forecasts and reanalyses in CMEMS.
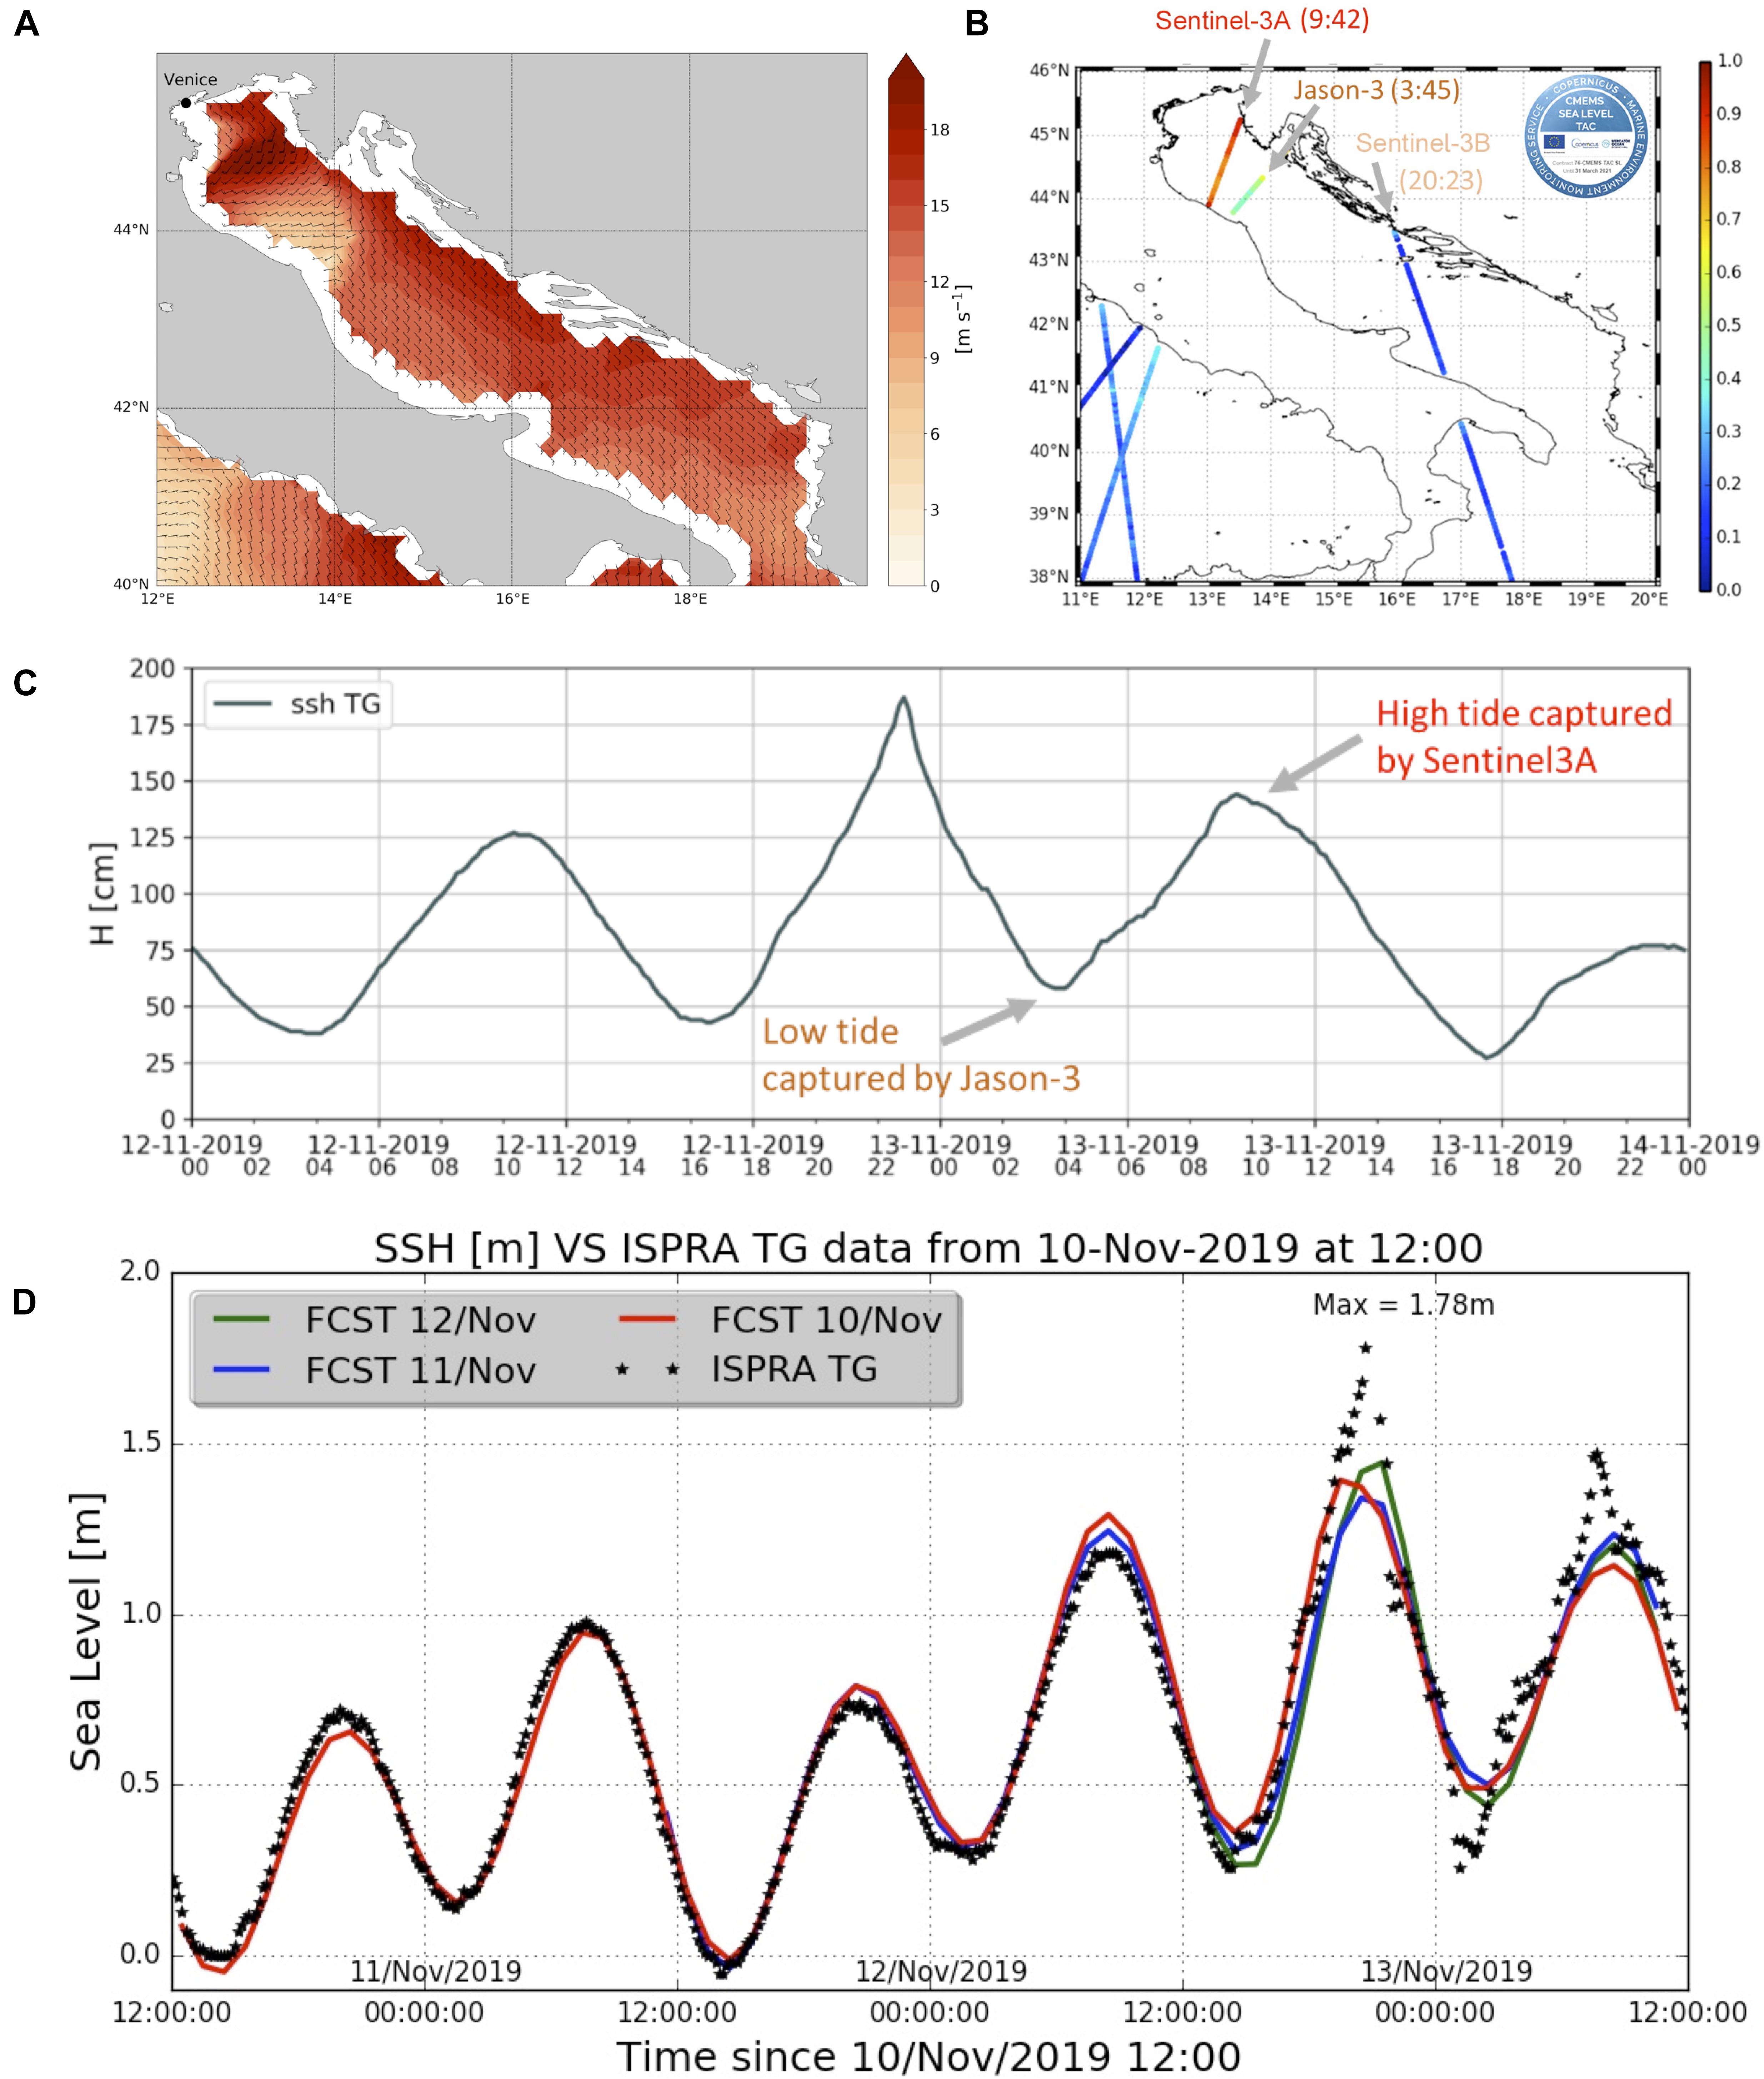
Figure 2. Copernicus Marine Service satellite and forecasting information for Storm Detlef, causing flooding in Venice in November 2019. (A) Sea surface winds in the Adriatic Sea about 2 h before the record flood event of 12/11/2019, as measured by ASCAT satellite scatterometers and highlighting southeastern, Sirocco winds. Source: CMEMS Wind TAC (Thematic Assembly Center). (B) Sea level anomalies measured by the altimetry constellation over the Adriatic seas on 13/11/2019. The Sea Level represented is the total elevation (not suppressing tides or atmospheric effect). Unit: Elevation in m, Time in GMT. S3A (Sentinel-3A). Source: CMEMS Sea level TAC. (C) Sea level variations measured by the Punta Della Salute tide gauge (in cm, Time in GMT). The times of the Sentinel-3A and Jason overpasses (panel B) are added to the graph. Source: CMEMS In Situ TAC. (D) Forecasted sea levels in Venice region during the mid-November, 2019 acqua alta events. CMEMS MedFS forecasts with a lead time of 3 days are shown: forecast produced on 10/11/2019 (red line), recomputed on 11/11/2019 (blue line) and on 12/11/2019 (green line). Forecasts are compared to observations (black dots) at the ISPRA Tide Gauge. Source: CMEMS Mediterranean Sea Monitoring and Forecasting Center.
Satellite radar altimetry, including data from the reference Jason-3 mission optimized for climate monitoring (to be replaced in 2021/2022 by Sentinel 6 M. Freilich) and from the complementary Sentinel-3A&B missions, provides information on the mean, offshore regional absolute sea level. Altimetric products have been a reference source of information for global mean and regional sea level rise since 1993 (Figure 3). A review of altimetric products for sea-level monitoring in Copernicus can be found in Legeais et al. (under review in this issue). Copernicus Marine Service provides along-track (level 3) and gridded (level 4) regional (all European seas) and global altimetric products based on level 2P and level 3 datasets provided by space agencies (especially EUMETSAT for Jason-3 and Sentinel 3A&B). C3S provides specific global and regional gridded (level 4) products optimized for climate change monitoring.
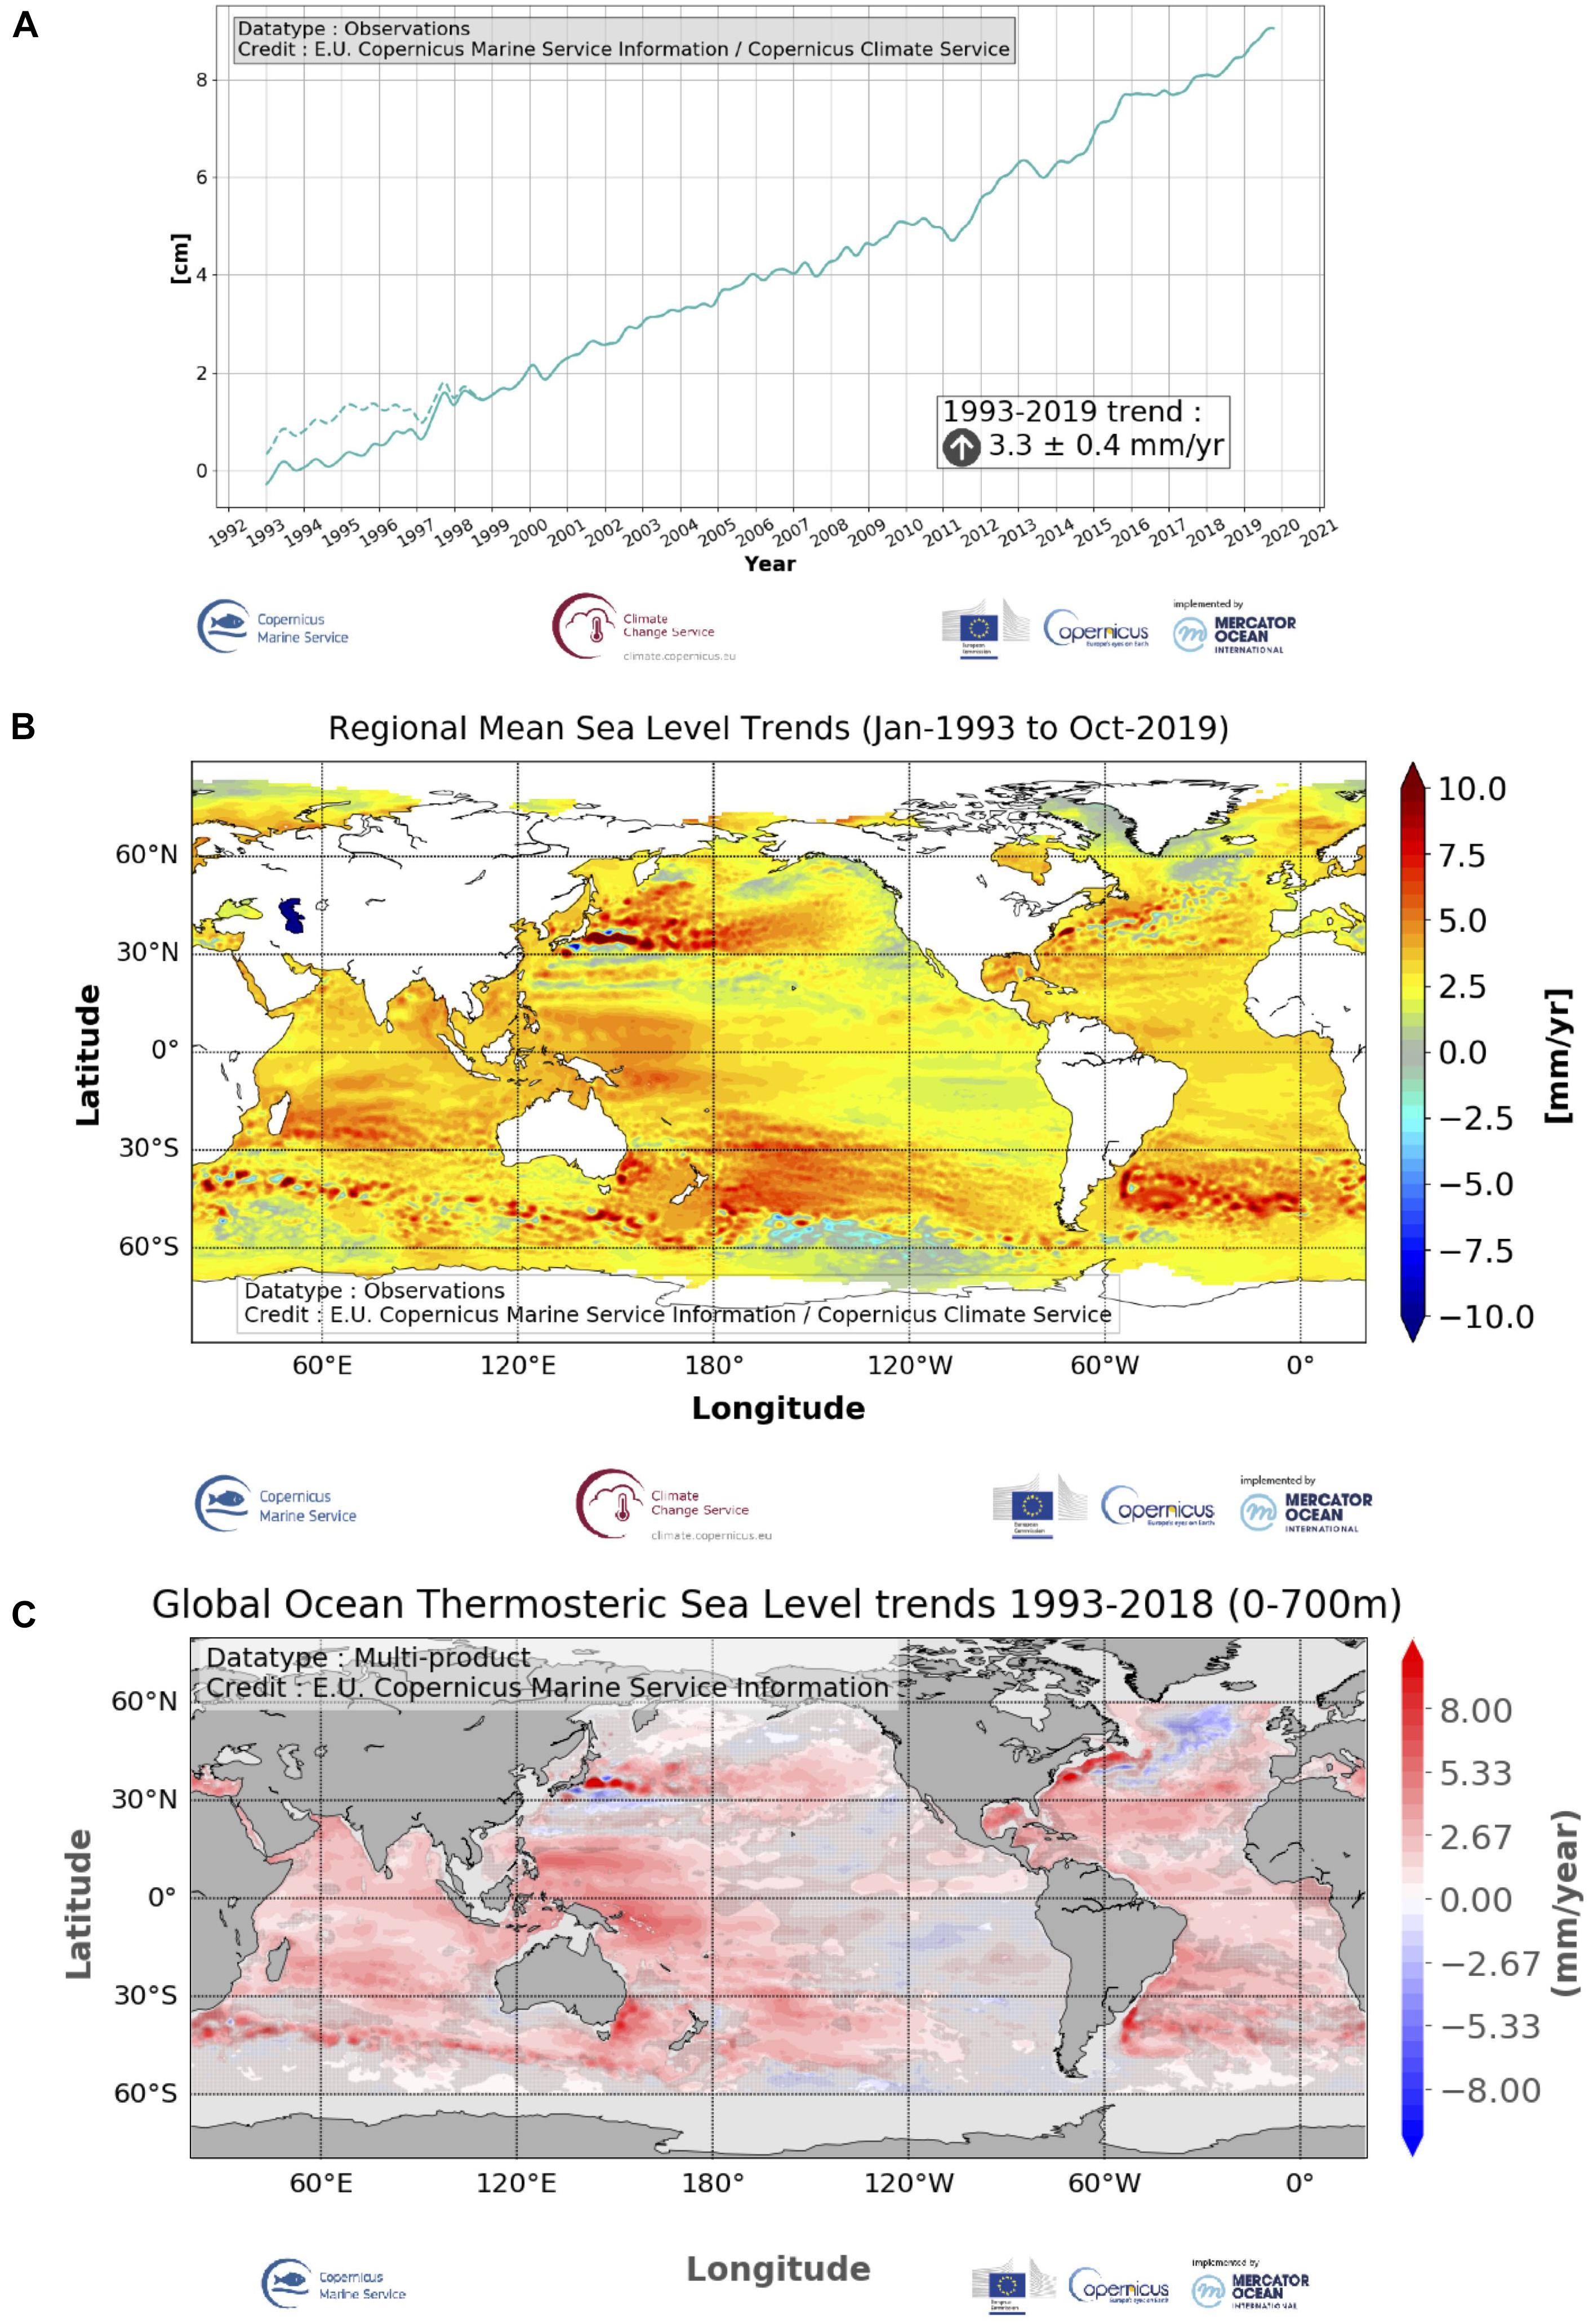
Figure 3. Ocean Monitoring Indicators for sea level rise since 1993. (A) Global mean sea level evolution over January 1993-October 2019 (in cm) from the satellite altimetry using the DUACS delayed-time (reprocessed version DT-2018) altimeter sea level gridded products distributed by the C3S and CMEMS. The timeseries is low-pass filtered, the annual and semi-annual periodic signals are adjusted, and the curve is corrected for the GIA using the ICE5G-VM2 GIA model (Peltier, 2004). During 1993-1998, the dashed line shows an estimate of the global mean sea level corrected for the TOPEX-A instrumental drift, based on comparisons between altimeter and tide gauges measurements (Ablain et al., 2020). (B) Spatial distribution of the trends of the satellite altimeter sea level observations (in mm/yr) over January 1993-October 2019 using the DT-2018 altimeter sea level gridded products distributed by C3S and by CMEMS. No Glacial Isostatic Adjustment correction is applied on the altimeter data. (C) Regional trends over the period 1993-2018 of ocean heat content (0-700 m) anomalies relative to the 1993-2014 reference period based on the ensemble mean of the multi-product approach (2 global reanalyses: GLORYS, ORAS5; 2 in situ based reprocessed products: CORA, ARMOR).
Both CMEMS and C3S provide a global, reprocessed, delayed-time gridded (1/4°) daily altimetric product covering the altimetric era (starting in 1993, Figure 3). The underpinning system is the Data Unification and Altimeter Combination System reprocessed delayed-time altimeter sea level product release, DUACS DT2018 (Taburet et al., 2019). This version does not correct for the known drift of the TOPEX-A instrument during 1993-1998 (Legeais et al., 2020) nor for glacial isostatic adjustment at regional scales. The C3S sea level Climate Data Record (CDR) is optimized for long-term homogeneity and stability and follows the recommendations of the ESA Sea Level CCI project (Legeais et al., 2018). The C3S CDR covers the period from January 1993 onward and relies on 1 Hz altimeter measurements from a two-satellite constellation throughout the period. In this configuration, one satellite is used as reference and ensures the long-term stability of the data record while the other (complementary) satellite is used to improve accuracy, sample mesoscale processes and enhance coverage poleward of 66° latitude. The reference missions include TOPEX/Poséidon, Jason-1 and Jason-2 and Jason-3. The complementary missions consist of ERS-1, ERS-2, Envisat, SARAL/AltiKa and Sentinel-3A. The CMEMS gridded reprocessed altimetric product uses the same reference missions but includes all available complementary altimeter missions. It is more focused on providing the best estimate of sea level at a given time (in particular to best capture ocean mesoscale activity) than on long-term homogeneity of the time-series. As a result, this product is based on multi-satellite missions with a varying coverage over the period (from 1 to 6 missions depending on the satellite constellation, including TOPEX/Poséidon, ERS, Envisat, GFO, Jason-1, Jason-2, Jason-3, Cryosat, Altika, HY2BA, Sentinel 3-A and B). Different reference mean sea surface fields are also used in CMEMS and C3S (Legeais et al., under review in this issue).
The two-satellite constraint in the C3S CDR leads to lower spatial sampling of the ocean surface than in the CMEMS sea level product and thus greater uncertainty over coastal areas, but to a stronger stability of the time-series for climate applications. Fully reprocessed CDR, produced in collaboration between C3S and CMEMS, are scheduled for release in 2021 and will benefit from reprocessed L2P input data for some missions, new L2 geophysical corrections (including atmospheric corrections forced by ERA5) and optimized L3/L4 mapping procedures.
Future evolution of the C3S and CMEMS gridded reprocessed products will include the replacement of the current reference mission (Jason-3) with the Sentinel-6 Michael Freilich after the completion of a cross-calibration phase (section “New Satellite Missions”).
In addition to the global gridded products, regional reprocessed gridded products are also distributed by CMEMS and C3S for the Mediterranean and Black Seas, at a higher resolution (1/8°) for refined regional sea level rise estimates.
Near-real time along-track sea level products tailored for data assimilation in ocean models (used to produce sea level reanalyses and forecasts, see section “Sea Level Observations”) are also available at global and regional scales (see an example in Figure 2B). The reference products are at 1 Hz resolution (7 km resolution along the satellite tracks). Such products have limitations in coastal zones, due to land contamination of the radar signal, less accurate geophysical corrections, editing of the data etc. (e.g., Birol et al., 2017; Cipollini et al., 2017; Benveniste et al., 2019; Melet et al., 2020a).
Recently, a higher-resolution along-track satellite product has been added to the CMEMS portfolio. This high-resolution altimetric product is at 5 Hz (1.3 km along the track), covers the North Atlantic and European Seas, and is provided together with the so-called geophysical corrections applied to the altimetric signal (e.g., tides, dynamic atmospheric correction which includes storm surge signals, long-wave errors, etc.) so that the physical content of the sea level from the data can be adapted to user needs. This higher-resolution product better captures the sea level signal in tide gauge records compared to the conventional along-track product. This product is currently only available over May 2016 to Dec 2018, but will be operationally produced in the coming years.
In addition to the mean, offshore sea level provided by altimetry, ancillary fields are needed to get the total water level at the coast (e.g., Melet et al., 2018; Marcos et al., 2019). These include tides, waves, surface atmospheric pressure and winds. Near real time information on significant wave height from spatial missions (Jason-3, Sentinel-3A, Sentinel-3B, Cryosat-2, SARAL/AltiKa, CFOSAT and HY-2B) are provided in CMEMS over the global ocean both as a gridded and along-track products. Swell systems integral parameters including partition significant wave height, partition peak period and partition peak or principal direction, inferred from Sentinel-1 missions, are given along swell propagation paths for individual storms in near-real time. Finally, satellite-based wind products are delivered, using in particular scatterometer observations (Figure 2A). Satellite observed wind fields can be used to correct atmospheric forcing, which are of prime importance to forecasting extreme events and their timing.
Forecasts and Hindcasts of Sea Level
Numerical modeling systems are the backbone of ocean and wave hindcasts (modeling past evolutions over the last decades), reanalyses (hindcasts constrained by observations through routine assimilation of in situ and space observations) and forecasts (over a few days to weeks). Such models are solving the equations governing ocean and wave dynamics and are often constrained by observations through assimilation of in situ and satellite observations. They provide a synoptic spatial and temporal monitoring of the ocean. This is especially important given the existing limitations of satellite altimetry in coastal zones and the sampling issue related to along-track satellite data and in situ measurements such as tide gauges (Figure 2). The coastal zone is indeed a dynamic area with strong spatial and temporal variability making it unlikely for satellite missions with revisit times of several days to capture localized events (Benveniste et al., 2019).
Relative SLR is the main driver of past and projected rise in extreme sea levels (e.g., Menendez and Woodworth, 2010; Vousdoukas et al., 2017). As extreme events pose the greatest hazards in terms of coastal flooding, sea level forecasts are also relevant to SLR adaptation. In particular, regional forecasts of sea level and waves can be instrumental in forcing more local forecasting systems (section “Downscaling Copernicus Forecasts”) and coastal flood early warning systems (EWS). EWS improve coastal flood risk preparedness by delivering timely, authoritative and targeted information for decision making and for guiding actions aiming at reducing subsequent potential damages and impacts on the society (e.g., Alfieri et al., 2012; Harley et al., 2016; Idier et al., 2020).
The Copernicus Marine Environment Monitoring Service is providing sea level analyses, forecasts and reanalyses over the global ocean and European regional seas. Characteristics of the regional forecasting systems are provided in Figure 4. They provide hourly sea levels with a forecast lead time of at least 5 days, refreshed daily or twice-daily, at a spatial resolution ranging between 1.5 and 4.5 km, depending on the region. Most systems are currently using the GEBCO2008 or GEBCO2014 bathymetry (more information on the models can be found in the online Product User Manual associated to CMEMS each product). Atmospheric surface pressure forcing is included, as well as tides (for most of these ocean forecasting systems). Most systems assimilate satellite altimetry data and in situ profiles of temperature and salinity. The major contribution of assimilation of satellite altimetry in constraining such forecasting systems to increase their skills has been shown in Le Traon et al. (2019); Hamon et al. (2019). An illustration of the regionally averaged quality of sea level forecasts in CMEMS is provided in Figure 5.
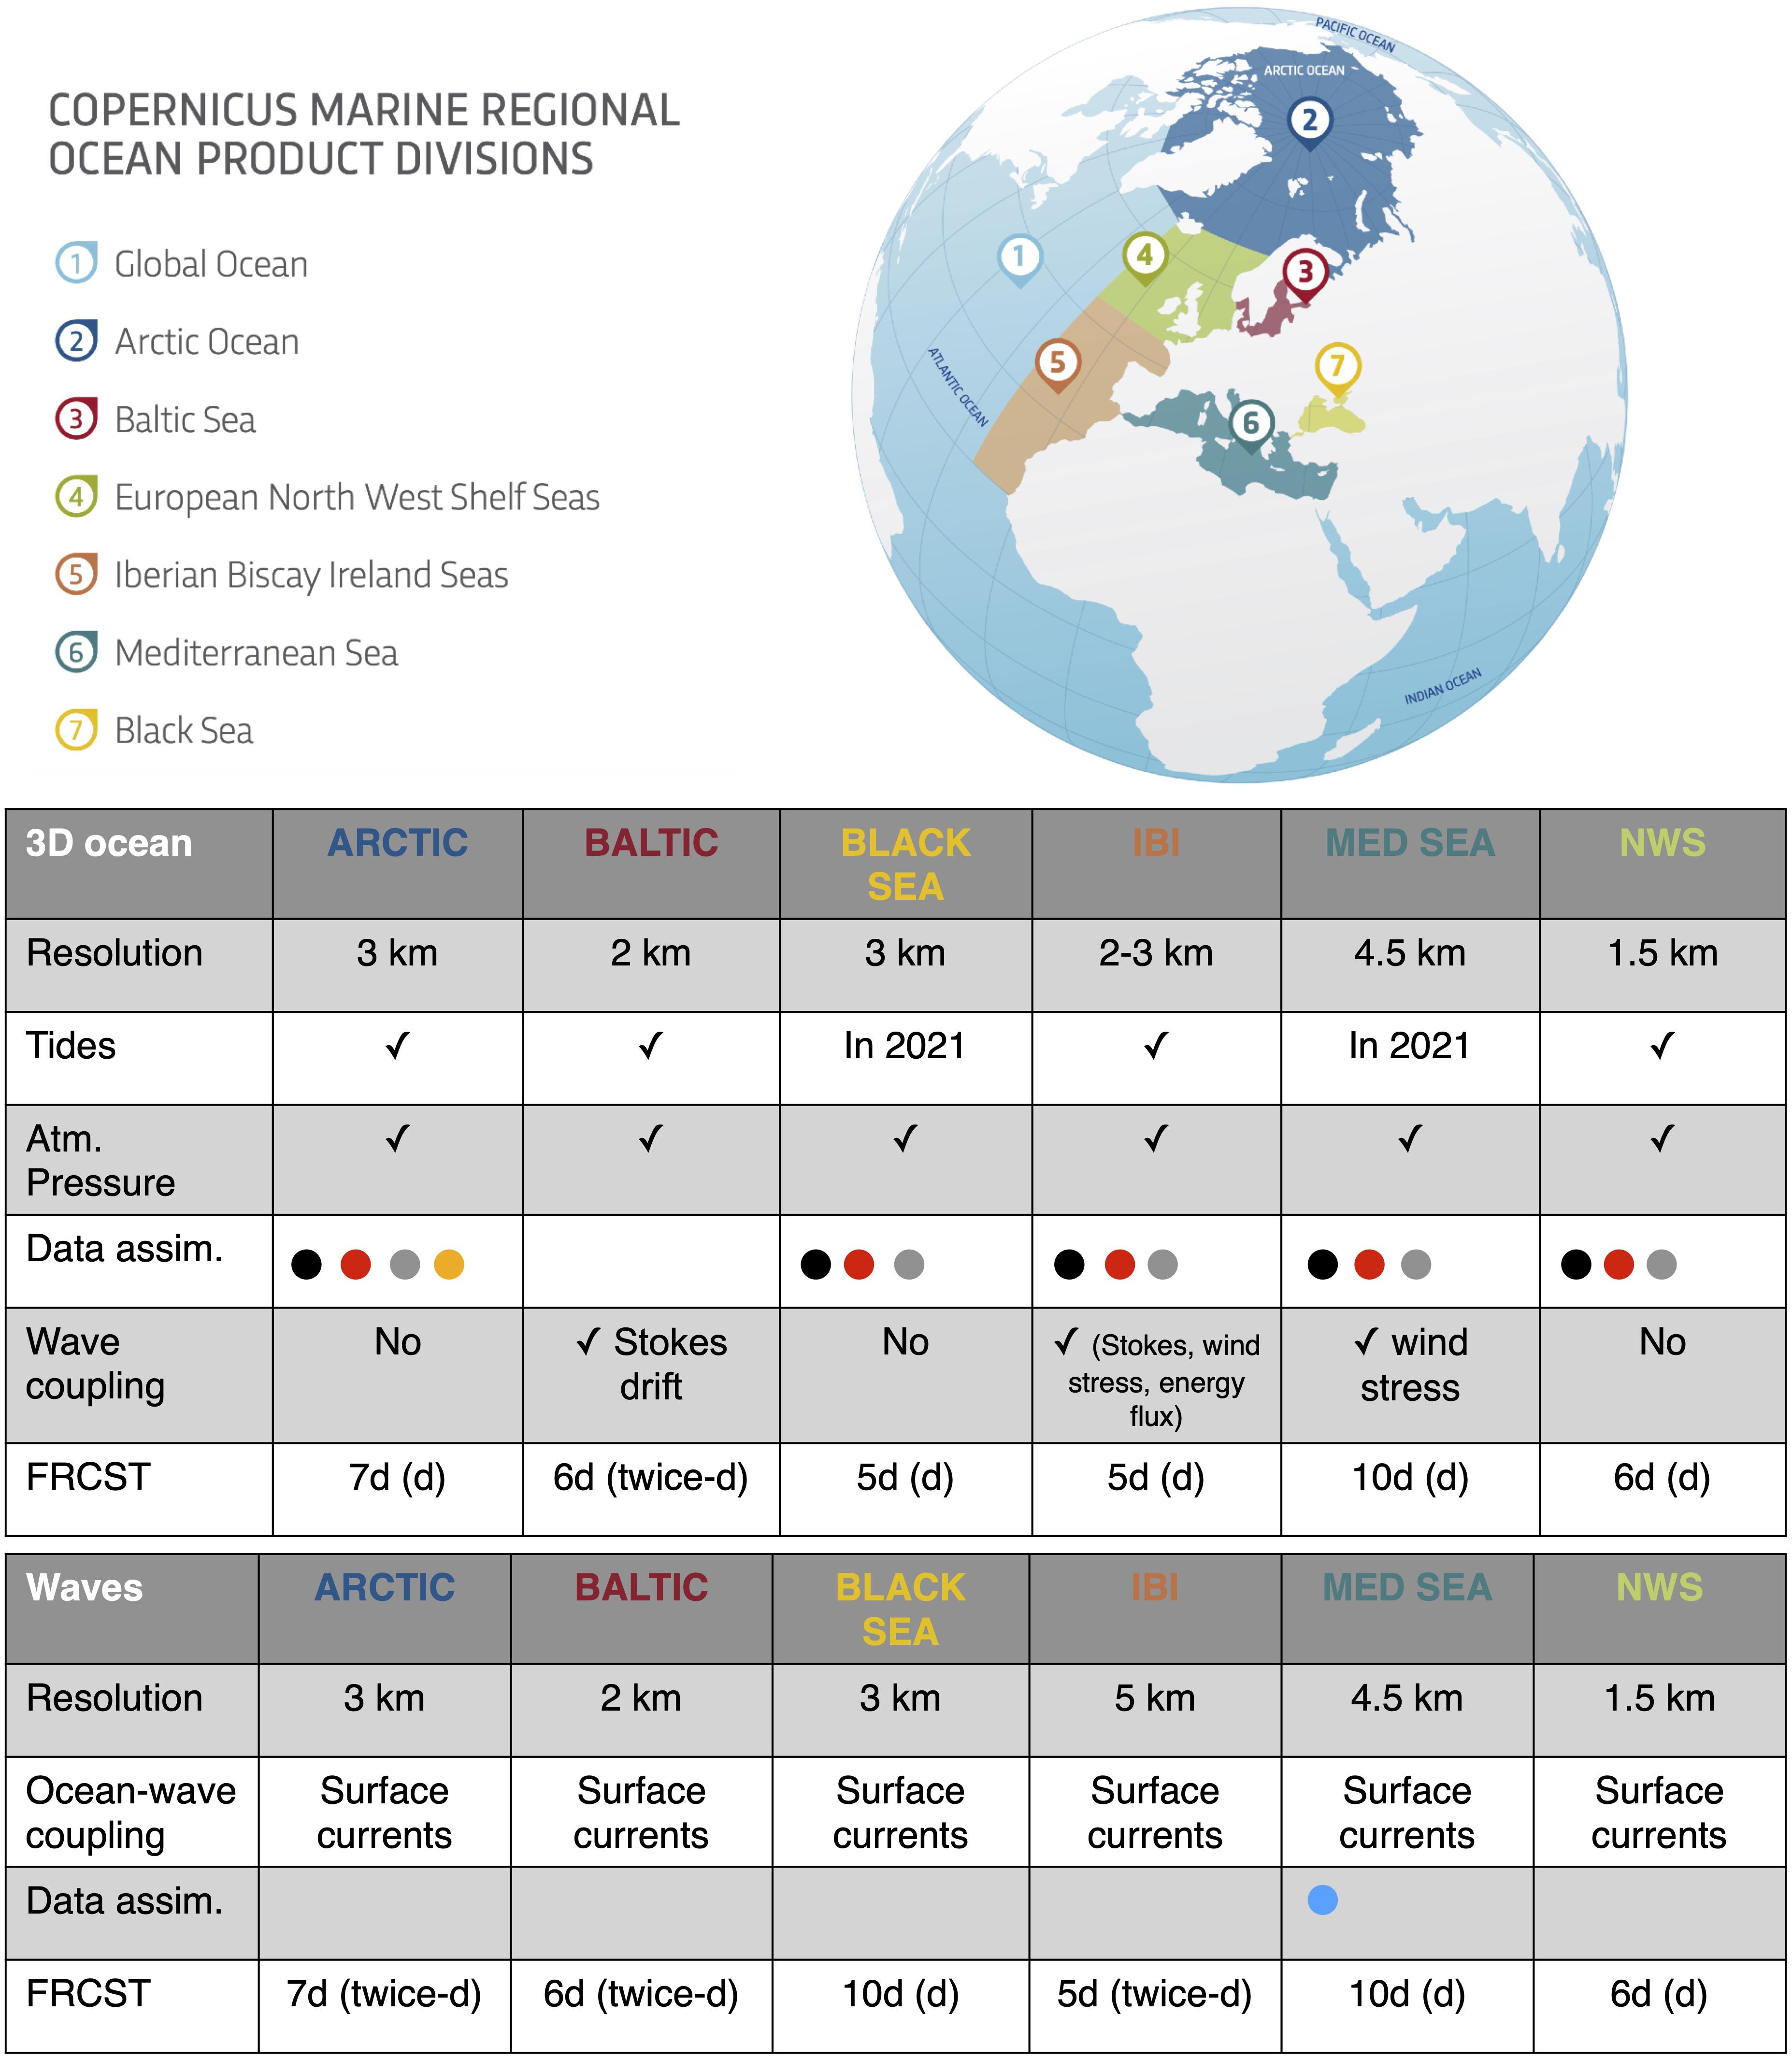
Figure 4. Characteristics of CMEMS ocean and wave monitoring and forecasting center (MFC) systems as of December 2020. Colored circles in the data assimilation (data assim.) row indicate the assimilation of satellite sea surface temperature (black), altimetry sea level anomaly (red), temperature and salinity vertical profiles (gray), sea ice concentration (orange) and significant wave height from altimetry (blue). FRCST stands for forecast lead time. In the FRCST row, the first number indicates the forecast lead time (in days) of the system with high-frequency outputs and the frequency of the update of the forecasts (daily, d, or twice daily, twice-d). The row labeled with “Tides” and “Atm. Pressure,” respectively, indicate the explicit representation of tides in the baroclinic models and of surface atmospheric pressure forcing.
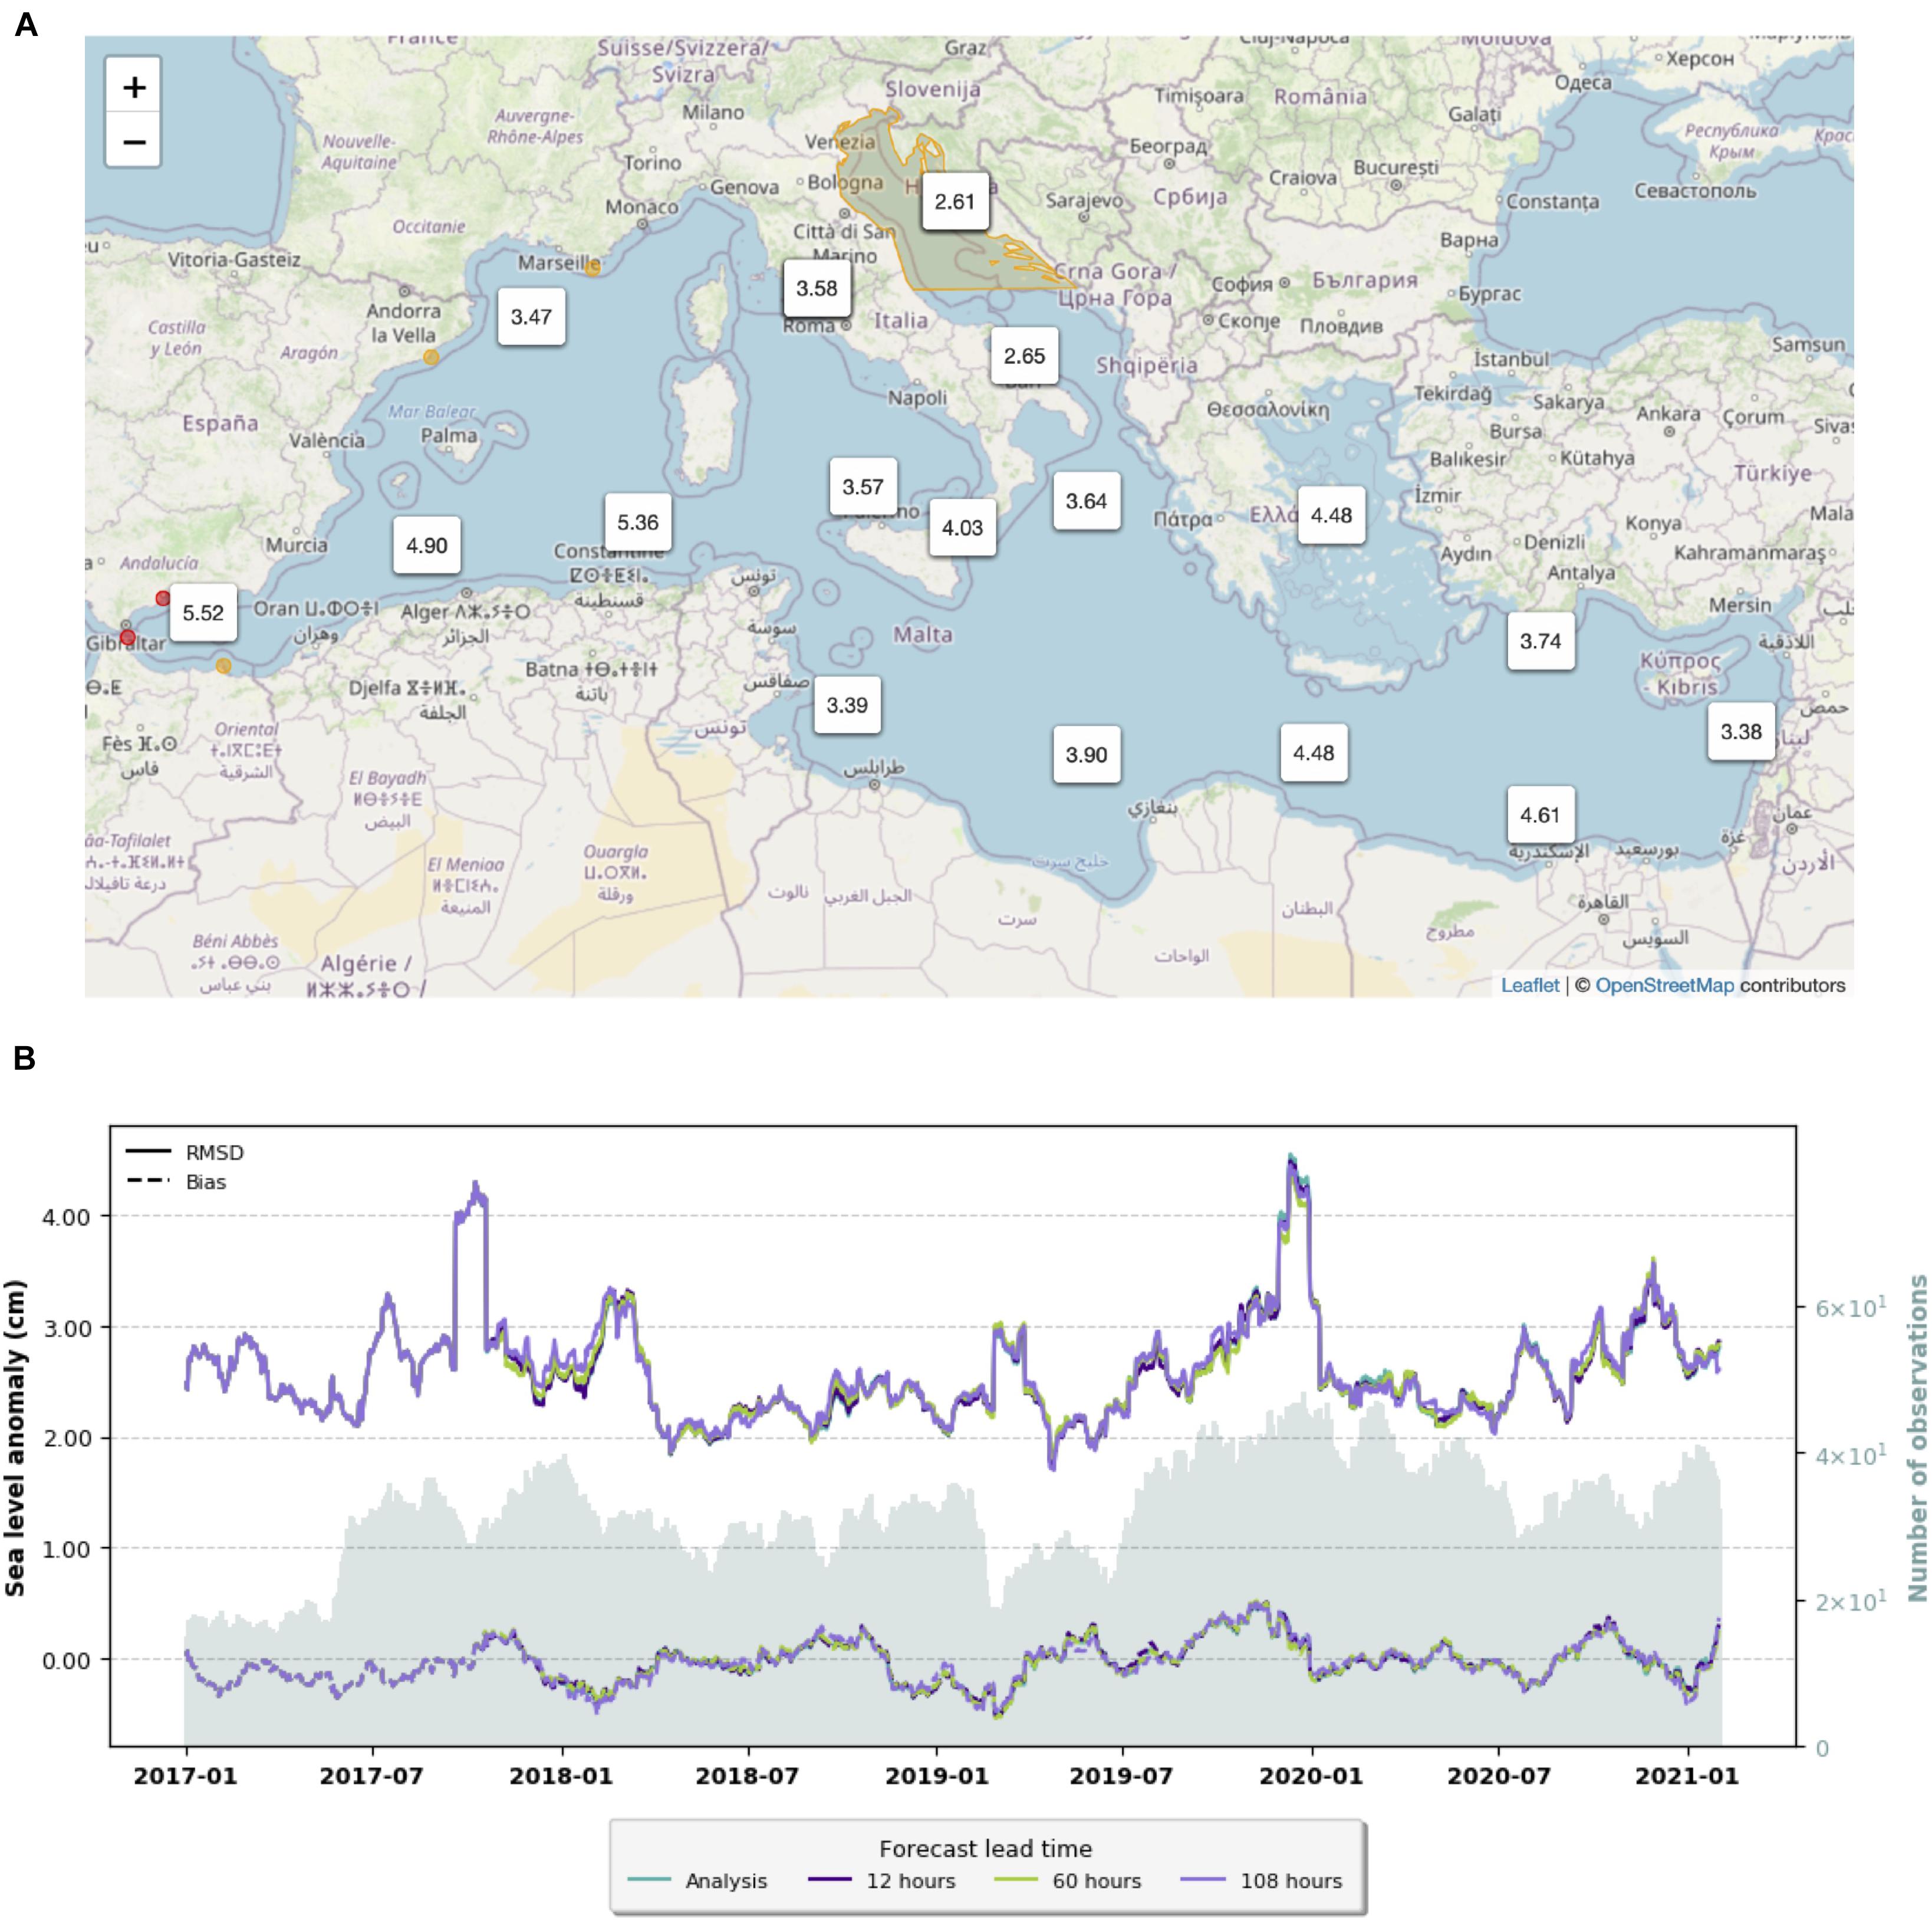
Figure 5. Assessment of sea level forecast quality in the Mediterranean Sea CMEMS forecasting system. (A) Estimated accuracy numbers (corresponding to typical RMS differences in cm between the CMEMS forecasts and along-track altimetry SLA) over different Mediterranean Sea regions. (B) Zoom over the northern Adriatic Sea (see yellow contour in panel A) with RMS errors (plain lines) and biases (dashed lines) between the CMEMS Mediterranean Sea forecast and CMEMS along-track altimetry SLA for different forecast lead times (ranging from 12 h to 204 h) and analysis. Extracted from CMEMS’ product quality dashboard.
An example of CMEMS sea level forecasts (Mediterranean regional system, Figure 5) and satellite information is provided in Figure 2 for an Acqua Alta event in Venice in November 2019. The tidal peak on November 12th 2019 reached 189 cm in Venice (Figure 2D; Cavaleri et al., 2020), which corresponds to the second highest sea level ever recorded in Venice, second only to the devastating event of 1966, and flooded the city. The timely combination of wind setup from strong south easterly Sirocco winds (Figure 2A), an inverted barometer effect due to the storm’s low atmospheric pressure, high tides, and anomalously high mean sea levels in the Adriatic Sea (Figure 2B) resulted in this exceptional high-water level in Venice (Figure 2C). Several Adriatic Sea or more local forecasting systems are operated for the Venice region (e.g., Umgiesser et al., 2020), some of them using CMEMS forcing conditions. The CMEMS MedFS system forecasted high water levels, although with an underestimate of the peak of the event on November 12th (Figure 2D) (a feature common to all operational forecasting systems for Venice for this event, due to errors in atmospheric conditions forecasts). Copernicus Marine Service satellite and in situ observation (sea level, wind) and model-based (ocean forecasts) data provide key information for downstream storm surge forecast models, supporting emergency and safety response missions with great accuracy. This data is also essential to better understand the main mechanisms involved in such extreme events and improve the operational storm surge forecast models.
Forecasting sea level at the coast at spatio-temporal scales relevant for decision-making remains, however, challenging due to the short scales of coastal zone dynamics and due to the multitude of processes driving coastal sea level changes (Ponte et al., 2019) (see also sections “Downscaling Copernicus Forecasts” and “At Global Scale”).
Monitoring of sea level change over past decades provides the historical baseline for quantifying SLR, extremes, their return periods and synoptic sea level variability in a broader sense. Ocean (wave) reanalyses combine ocean (wave) model dynamics with in situ and satellite observations through data assimilation. As such, reanalyses provide a consistent view of the ocean in space, time, and across variables, accounting for observation information and dynamics. The reliability of ocean reanalyses has increased over the last decade, as shown for the steric sea level inter-annual variability in CMEMS reanalyses in Storto et al. (2019a). In terms of past regional sea level variability, the skill of ocean reanalyses is currently similar to that of objective analyses of observations or to sea level reconstructions (e.g., Storto et al., 2017).
The comprehensive and consistent view of the ocean provided by reanalyses allows for process-oriented studies, for instance to better partition sea level variability due to different mechanisms and over different time-scales (e.g., Forget and Ponte, 2015), or to separate the steric and mass components of regional sea level trends. The increasing reliability of ocean reanalyses make them useful for the monitoring of the ocean state (e.g., von Schuckmann et al., 2018; Figure 3) and for climate applications (Stammer et al., 2016).
CMEMS provides ocean reanalyses at global and regional scales (see Figure 4 for regional domains) covering at least the altimetric era (starting in 1993) and using the ERA5 atmospheric reanalysis (Hersbach et al., 2020) produced and distributed by C3S. Along-track reprocessed altimetric sea level data are assimilated together with other observations. The new generation of CMEMS global reanalysis is at a 1/12°, ocean eddy permitting resolution (Storto et al., 2019b; Lellouche et al., 2021). At global scale, a multi-system approach is also taken in CMEMS to improve uncertainty estimates through the ensemble spread of global ocean reanalyses. The spread information was found to significantly contribute to the crucial requirement of uncertainty estimates for climatic datasets, assessed for ocean heat content and steric sea level in Storto et al. (2019a).
Regional ocean reanalyses covering the EU seas have higher resolutions, ranging from 3 km to 12 km, benefit from ocean models adapted to the regional dynamics and from the representation of additional processes. Global and regional reanalyses capture the spatial variability of altimetry derived sea level trends (e.g., Storto et al., 2019c). They were used to compute trends in ocean heat content (e.g., Figure 3C; von Schuckmann et al., 2018), which is related to ocean warming and thermal expansion, a prime contributor to SLR.
Using wave and ocean reanalyses with tides and surface atmospheric pressure forcing to represent storm surges, extreme (annual mean 99th percentile) wave and sea level conditions were compared with in situ observations (wave buoys and tide gauges) in Alvarez Fanjul et al. (2019), highlighting the reanalyses’ skill in reproducing such extremes in most places and allowing to characterize them in coastal areas lacking in situ observations (Figure 6).
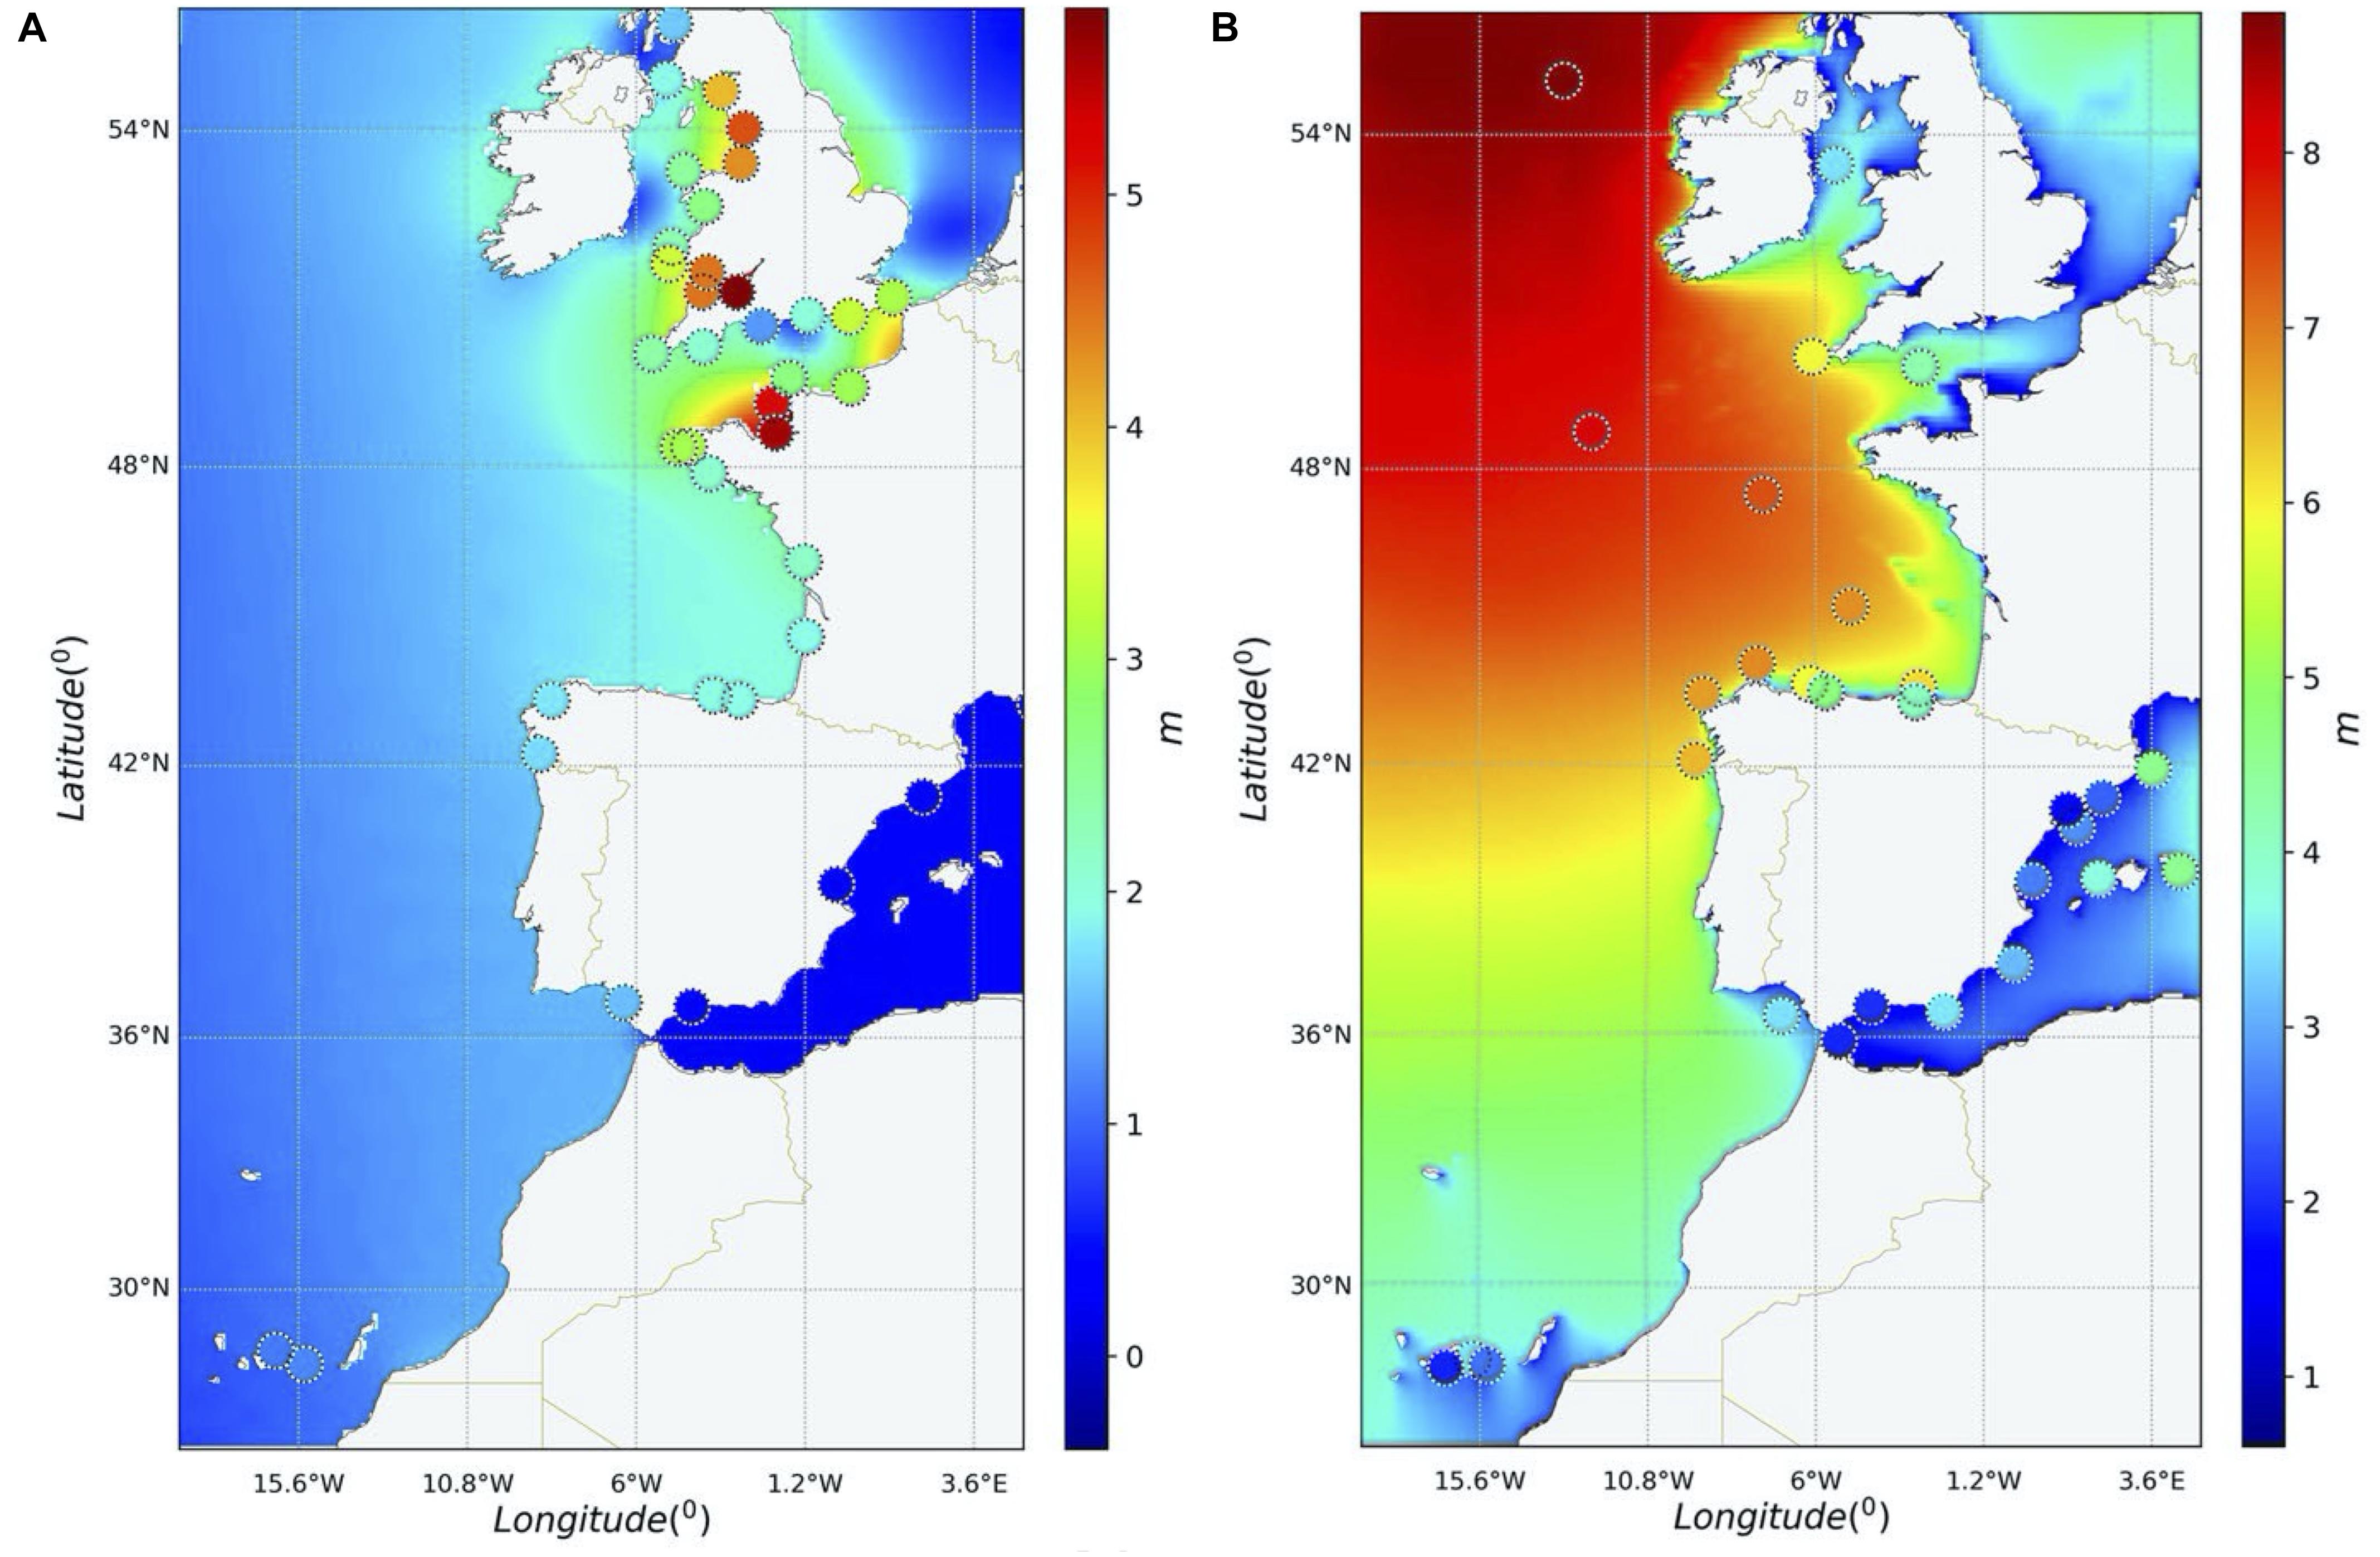
Figure 6. (A) The annual mean 99th percentile of sea level. (B) The annual mean 99th percentile of significant wave height (in m, considering the 2000-2016 period) over in the IBI CMEMS regional ocean and wave reanalysis (shading) and from tide gauges and wave mooring CMEMS reprocessed data sets (inset circles). After Alvarez Fanjul et al. (2019).
Climate Projections
On longer past and future time scales, i.e., from the pre-industrial mid 19th century to 2100 and beyond, climate models are the primary tools for constructing regional sea level change time-series (e.g., Oppenheimer et al., 2019). Climate models directly simulate the ocean-related sea level rise, i.e., the dynamic regional sea level changes induced by ocean circulations, and changes in ocean temperature and salinity, from which the global mean thermal expansion can be calculated. Outputs from climate models are used to estimate glaciers and ice sheets’ mass loss contributing to SLR with offline, dedicated models (e.g., Slangen et al., 2014a). The ability of climate models-based estimates of SLR to reproduce observed SLR at regional and global scales over the 20th century has been assessed in Meyssignac et al. (2017); Slangen et al. (2017).
As part of the C3S commitment to climate projections, the program redistributes a selection of variables, including monthly mean values of dynamic sea level (i.e., the zos variable) and sea level pressure (for the inverted barometer component of storm surges) from CMIP5 and CMIP6 models. The selection of variables was established when the dataset interface of the Climate Data Store catalog was first set up. Alongside the ocean components of the models, C3S also provides access to several other (mostly atmospheric) variables which could be used to estimate the surface mass balance of both ice sheets and mountain glaciers. More information on the variables available can be found in the Climate Data Store6.
Exposure to Sea-Level Rise
Translating a given sea level (corresponding to the long-term mean SLR or to the sea level reached during extreme events, section “Sea-Level Change Hazard”) into exposure of land area, population and assets to coastal flood is essential to inform adaptation decisions. Coastal flood exposure can be estimated based on different methodologies and underlying datasets, to which Copernicus contributes.
Global and broadscale exposure assessments largely relied on the passive “bathtub” mapping approach, whereby land areas with an elevation lower than the reported sea level and which are hydrologically connected to the sea are considered flooded (e.g., Hinkel et al., 2014). In that regard, digital elevation models (DEM) are critical to coastal flood exposure assessment. Census data (population, assets) and more recently, spatio-temporal dynamic population distribution models, are then analyzed jointly with the DEM to determine coastal flood exposure. Kulp and Strauss (2019) highlighted the importance of DEM accuracy for estimates of population exposure to extreme sea levels, as the vertical error in DEM is sizable compared to the estimated SLR by the end of the century. A review of assessments of population exposure to sea level rise is provided in McMichael et al. (2020).
Since 2019, the Copernicus Land Monitoring Service has delivered the Copernicus DEM (Copernicus Dem Product Handbook, 20207). Copernicus DEM is derived from an edited digital surface model named WorldDEMTM, based on TanDEM-X missions. Editions of data in the Copernicus DEM include the flattening of water bodies and consistent flow of rivers, shore-line and coastlines, as well as special features such as airports and implausible terrain structures.
The Copernicus DEM is provided in three different instances (Figure 7):
1. EEA-10: With a 10 m × 10 m ground sampling size, it is the spatially most detailed instance. The EEA-10 covers the land area of the EEA member states and the 6 cooperating countries (EEA39, also known as EIONET-39). The license conditions8 are restricted to a limited number of user categories.
2. GLO-30: A global 30 m × 30 m ground sampling size DEM, with partial licensing restrictions.
3. GLO-90: A global 90 m × 90 m ground sampling size DEM, freely available to registered users.
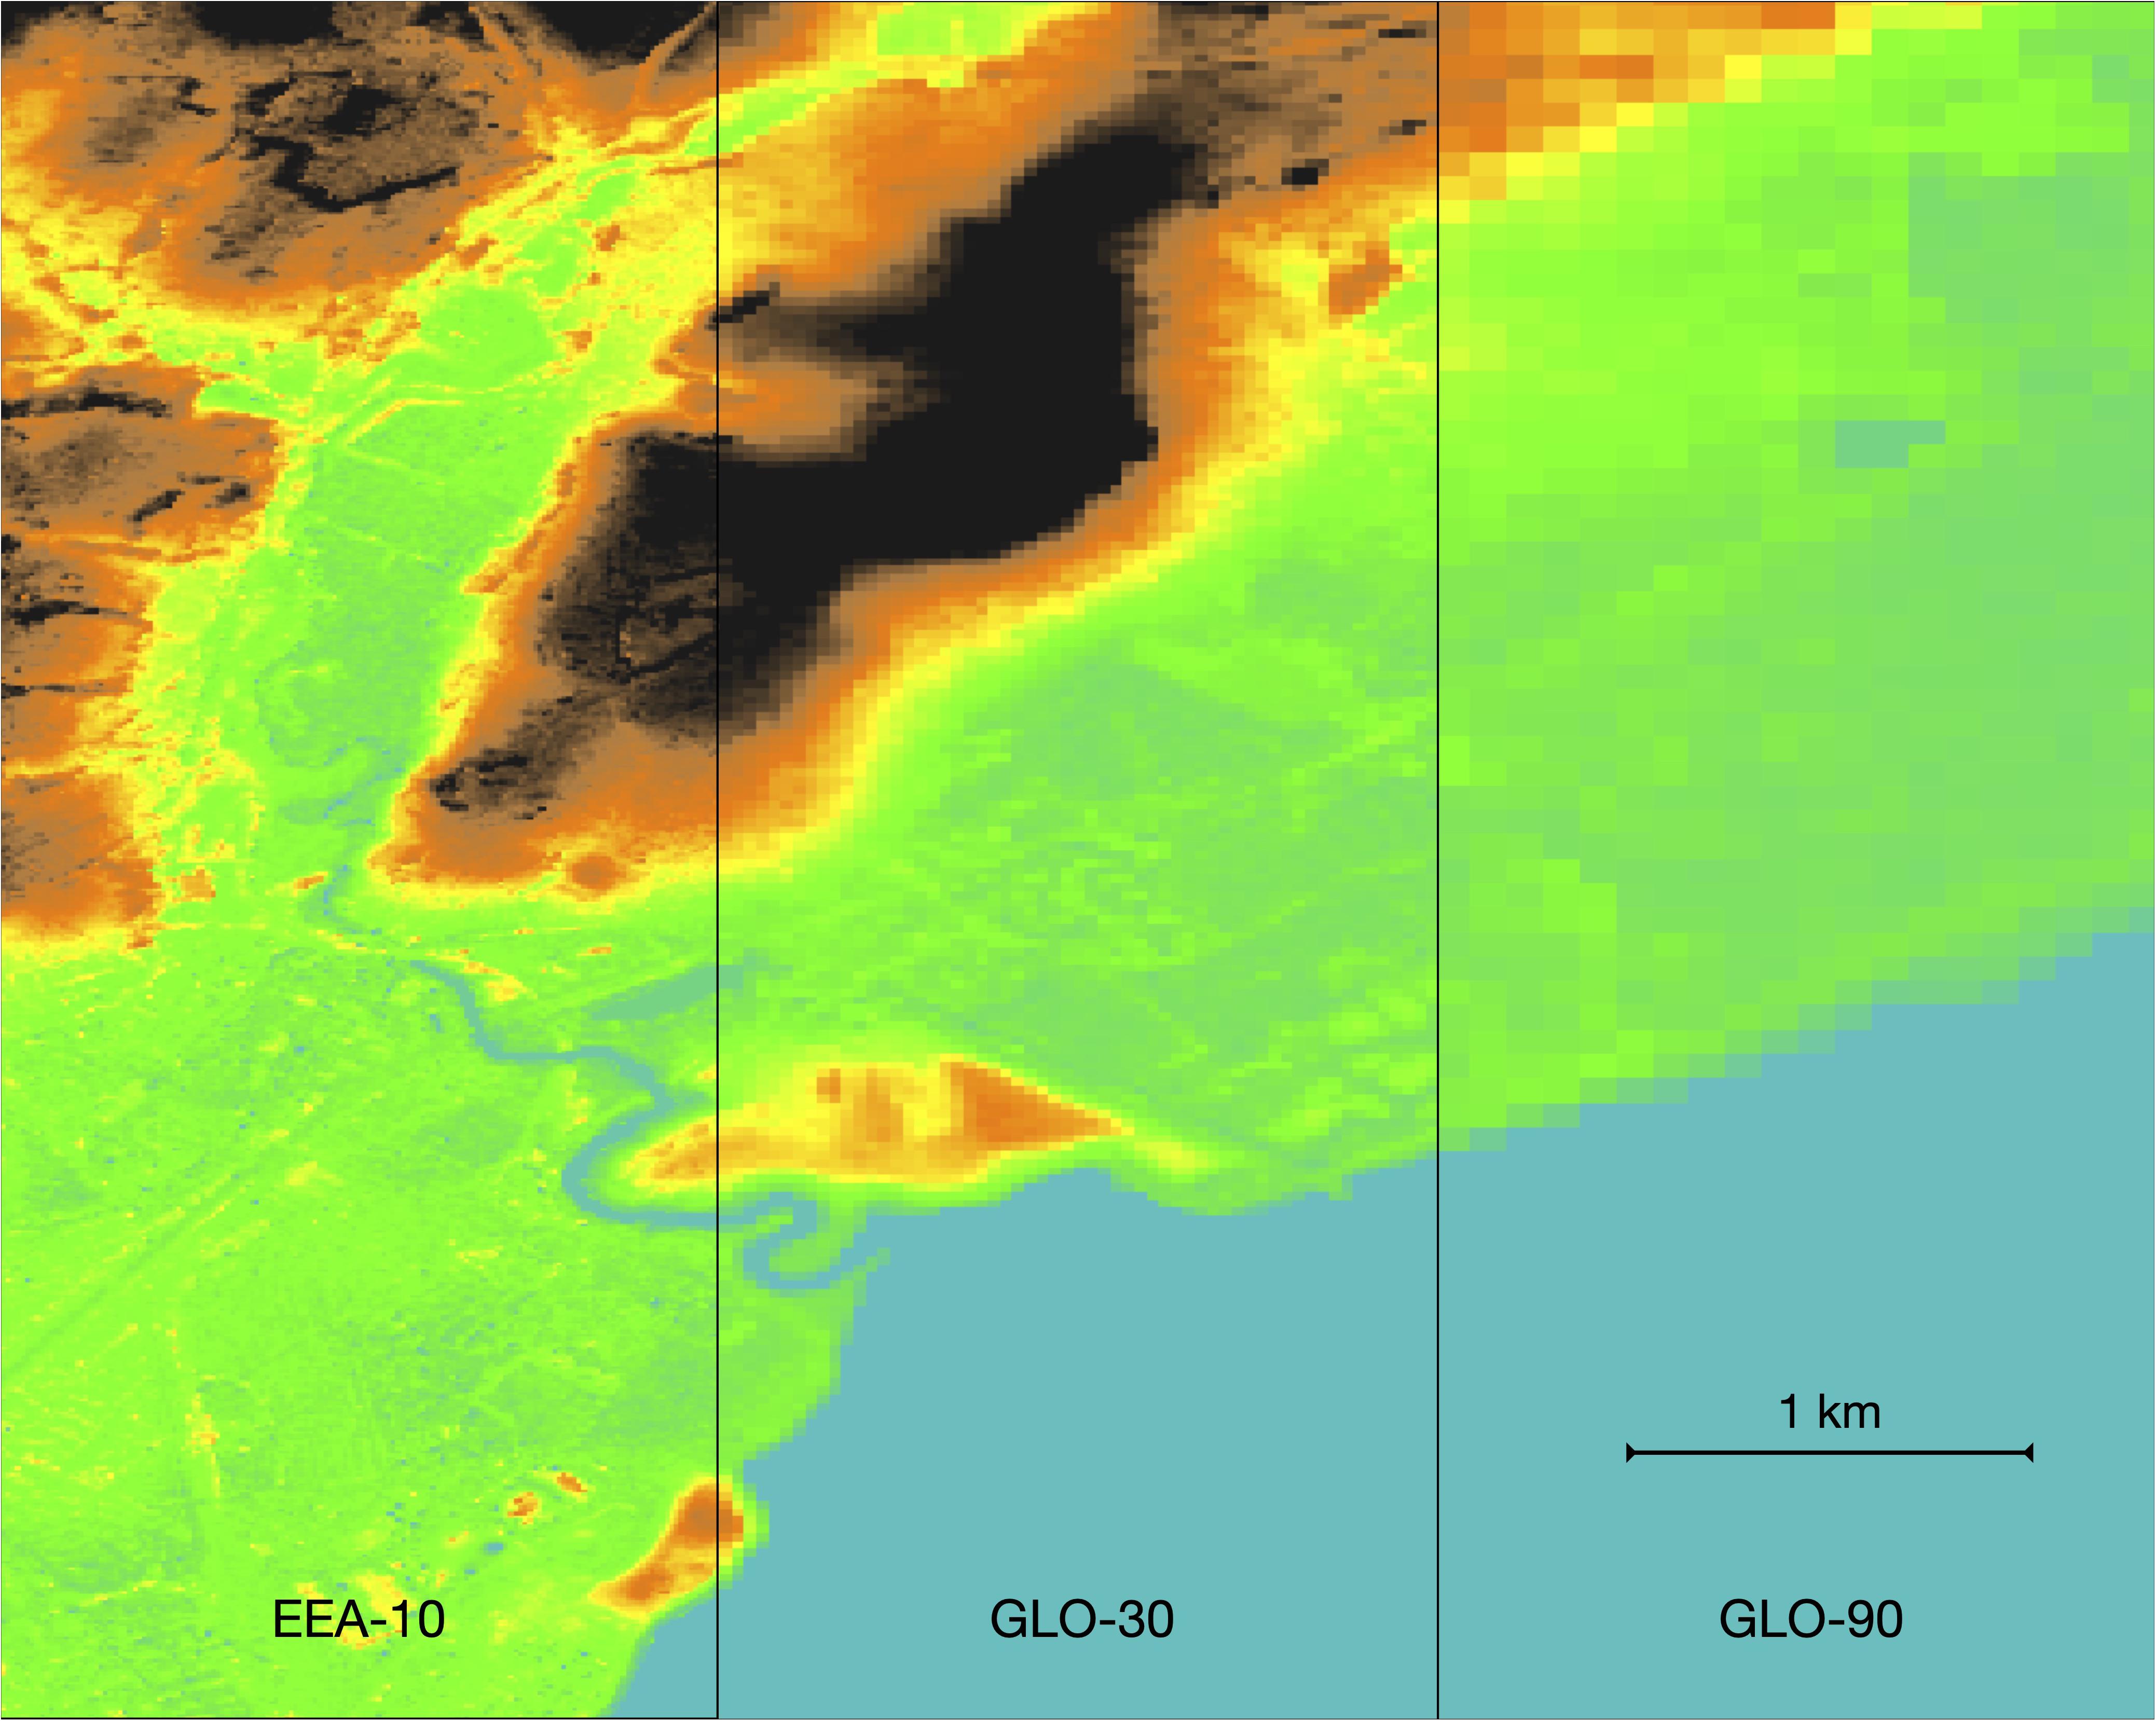
Figure 7. Illustration of the EEA-10 (left), GLO-30 (middle) and GLO-90 (right) Copernicus DEMs showing the Rhymney River and an area north-east of Cardiff, UK.
The absolute vertical accuracy of WorldDEMTM, underlying the Copernicus DEM, has been assessed using a linear error at a 90% confidence level at ICESat GLAS reference points. The absolute vertical accuracy is estimated to 1.92 m for the global mean (excluding Greenland and Antarctica) and to 1.66 m for the EEA39 European region covered by the EEA-10 DEM (Copernicus Dem Product Handbook, 2020). The vertical accuracy therefore remains a limitation to estimate with high confidence exposure to SLR during the coming decades and, as such, for sub-secular planning horizons (e.g., Gesch, 2018).
Exposure can be reduced in places protected by coastal defenses. Features such as dikes, groynes, seawalls are not resolved in the Copernicus DEM. Their mapping could be performed in the future in Copernicus (section “Coastal Defense Structures”).
At more regional to local scales, hydrodynamic models can be used to refine assessments of coastal flood exposure (e.g., Vousdoukas et al., 2016) by accounting for hydrodynamic processes that can modify the ability of the flood to progress landward. Such hydrodynamic processes include e.g., land surface roughness for flood water-level attenuation and routing of flood waters. Accounting for water-level attenuation by land surface roughness during a flood indeed decreases estimated coastal flood exposure and expected damages by decreasing the inundation extent and depth (Orton et al., 2015; Vafeidis et al., 2019).
The Copernicus Land Monitoring Service provides land-cover/land-use products to monitor over time biophysical characteristics of the Earth’s surface (updated every 6 years). In contrast to pure Land Cover data derived from classification, all vector LC/LU products provided by CLMS are mostly based on photo interpretation. This labor-intensive approach allows to map contextual information, such as mapping ecosystem types or the mapping of Land Use aspects. CLMS LC/LU products provide relevant information on different LC/LU classes that can then be used to specify water-level attenuation coefficients used in coastal flood models. CLMS offers two LC/LU datasets which cover coastal areas in Europe. The first one is the CORINE Land Cover (CLC) inventory9, a vector dataset with a minimum mapping unit of 25 ha for status and 5 ha for change covering Europe (not only coastal zones). The CLC nomenclature includes 44 land cover classes which are grouped within a three-level hierarchy10. The five main (level-one) categories are artificial surfaces, agricultural areas, forests and semi-natural areas, wetlands, water bodies. CLC reaches back to 1990, and has been updated every 6 years since 2000. Besides offering a homogeneous wall-to-wall coverage across Europe, the long time series is probably the most valuable aspect of CLC. A major shortcoming, though, is its coarse spatial resolution. The minimum mapping units were defined in the 1980s and represent a trade-off between cost and detail of land cover information at the time. To overcome the limitations of the low spatial resolution of CLC, CLMS has delivered since February 2021 a Coastal Zones LC/LU (CZ LC/LU). The CZ LC/LU nomenclature includes 71 classes11, providing more details on coastal aspects, such as port areas, or shoretypes (Figure 8). Shoretype information can be used to assess whether wave setup or runup can be estimated from empirical formulations, mostly dedicated to sandy or shingle beaches (e.g., Stockdon et al., 2006; Dodet et al., 2019) and incorporated in total water level estimates (e.g., Melet et al., 2018, 2020b).
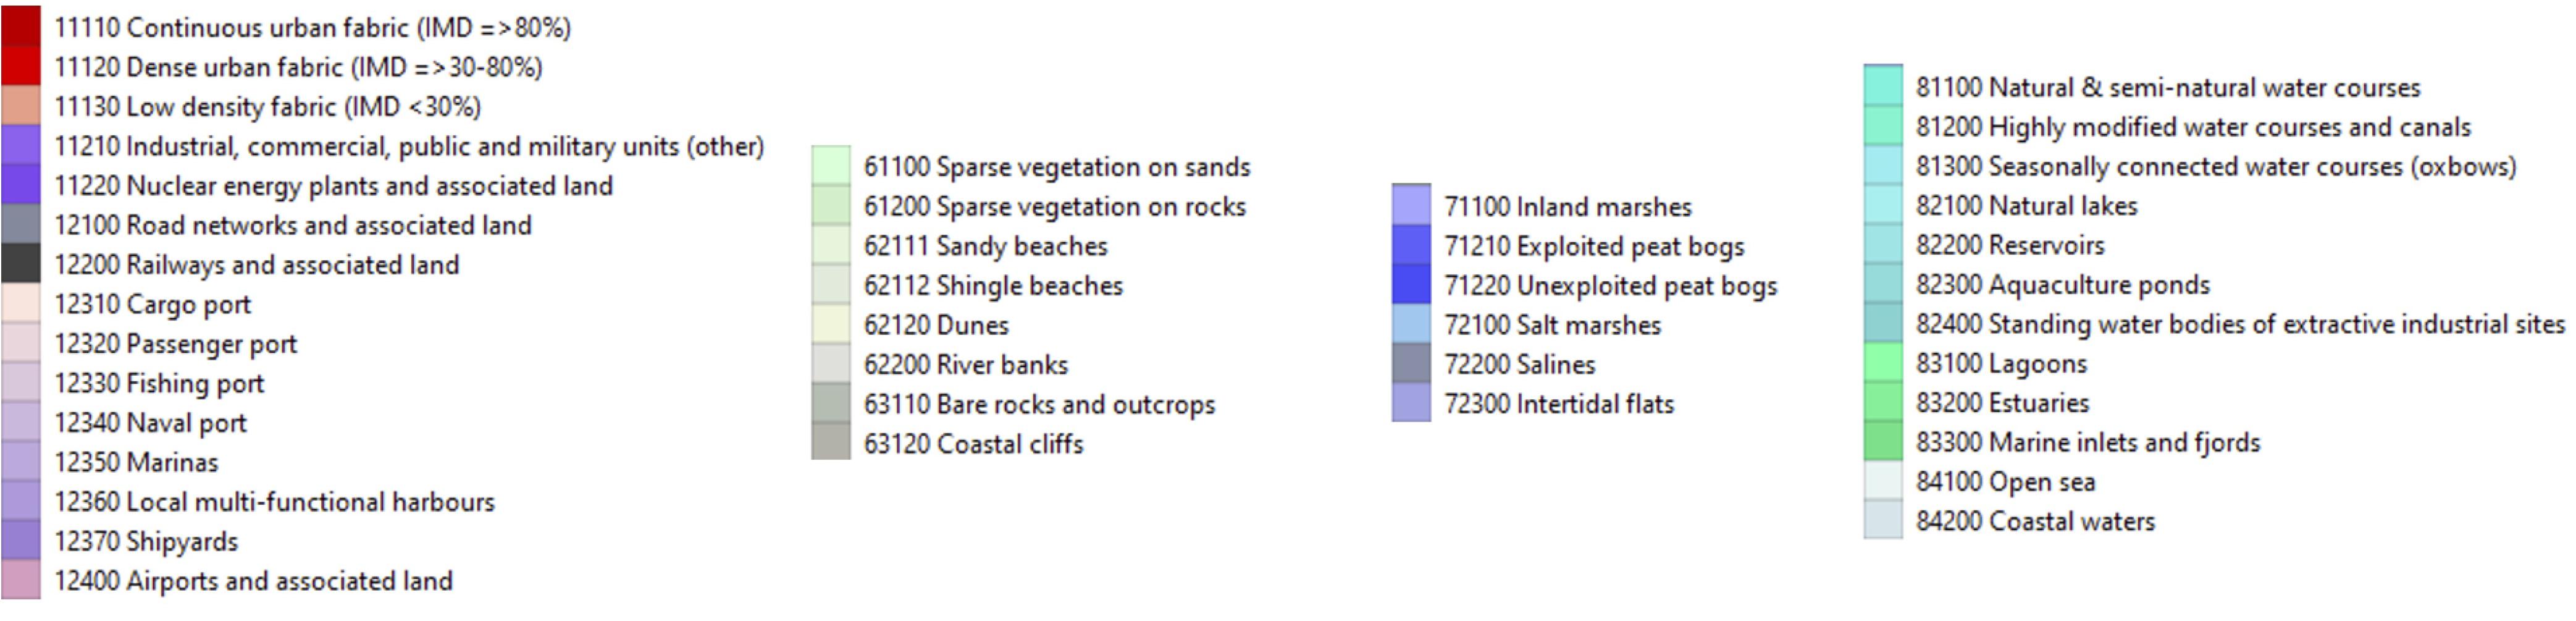
Figure 8. Extract of the Copernicus Land Monitoring Service coastal zone land cover/land use (CZ LC/LU) product classes with particular relevance for coastal flooding.
The CZ LC/LU product covers an area of 10 km landwards from the shoreline, with a minimum mapping unit of 0.5 ha and a minimum mapping width of 10 m. The CZ LC/LU product is shown for two contrasted coastal areas in Figure 9. Land cover products usually do not provide accurate information on the type and location of economic assets, as the latter are often connected to land use aspects. The CZ LC/LU product from CLMS distinguishes between infrastructure types, such as nuclear power plants, different densities of urban fabrics, commercial or military areas, road networks, etc. (Figures 8, 9).
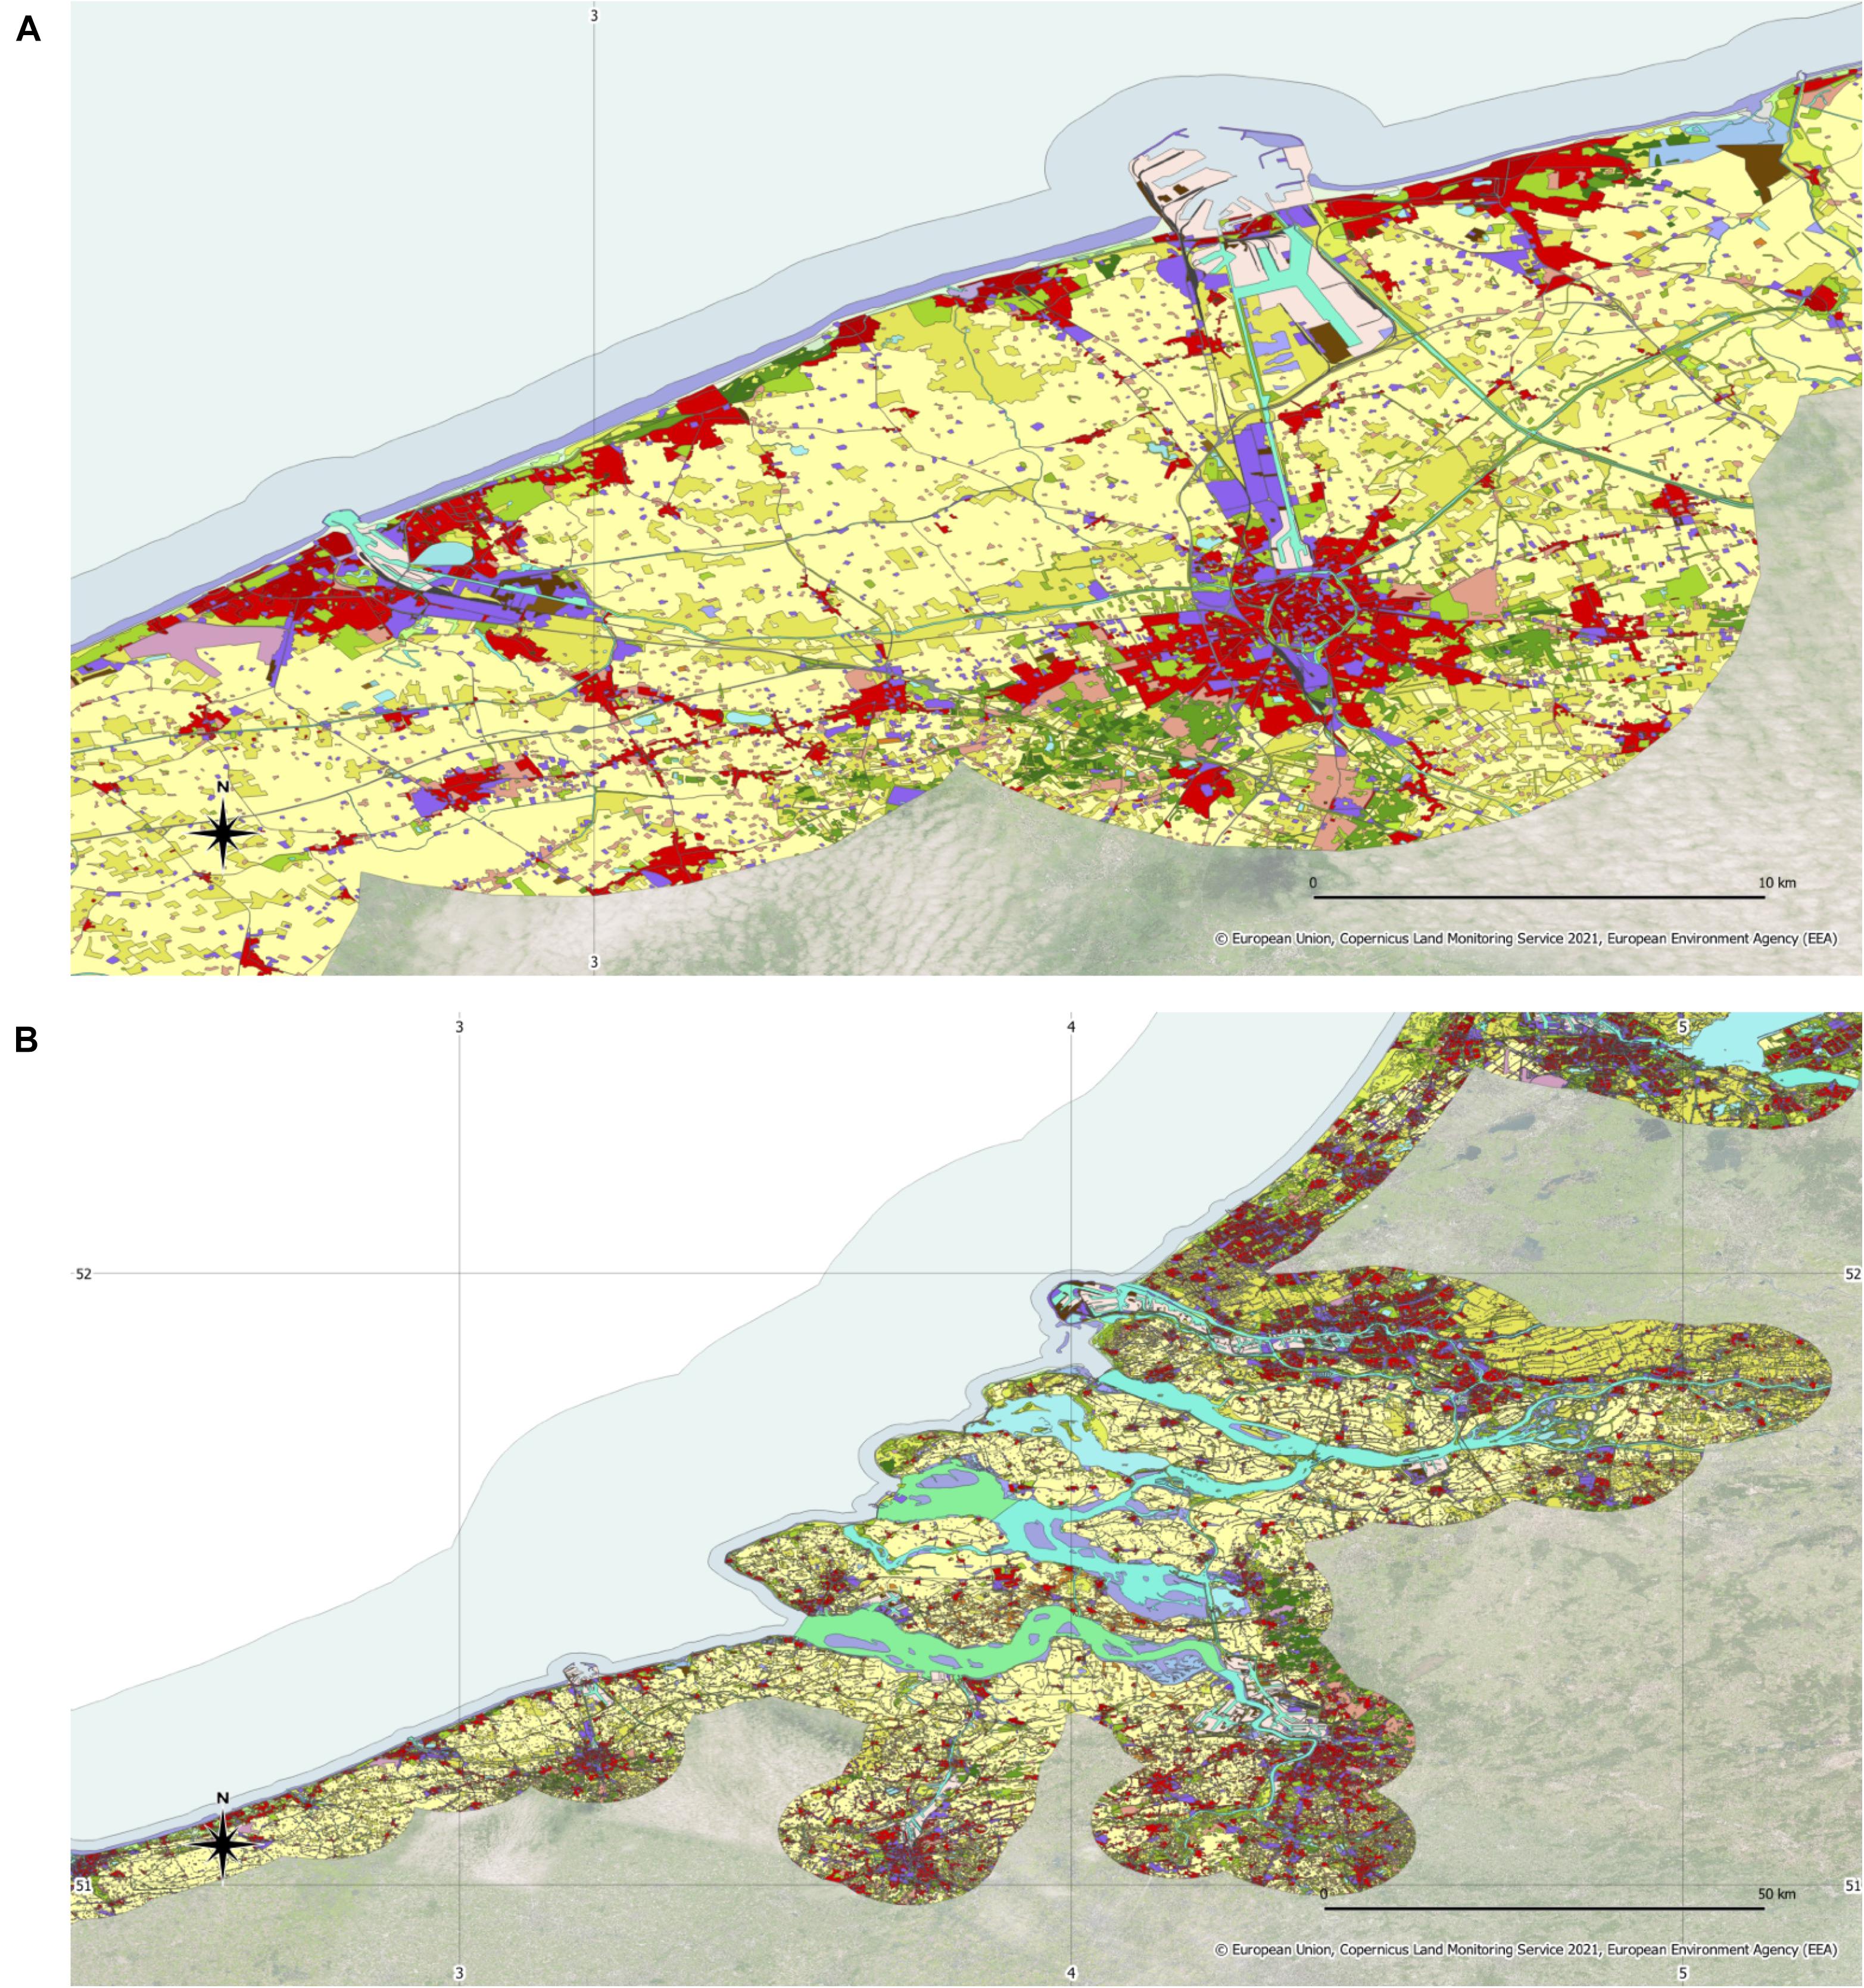
Figure 9. Visualization of the coastal zone land cover/land use (CZ LC/LU) product of CLMS (A) for a coastal area nearby Bruges (BE) and (B) for the Rhein-Maas-Schelde-Delta (BE, NL). Colors refer to different LC/LU classes. Some of them, particularly relevant for SLR impact assessment, are described in Figure 8. The description of all LC/LU classes can be found on the CLMS website 11, https://land.copernicus.eu/local/coastal-zones/coastal-zones-2018.
In addition to surface roughness, the hydrological network and its topological relationship which are mapped in the CLMS EU-Hydro12 dataset (channel density and connectivity) can exert a control on the duration and routing of floodwaters. The Thematic Hotspot Mapping on riparian zones delivered by CLMS provides three complementary product groups with detailed information on the state and characteristics of riparian zones across the EEA member and cooperating countries13. Other local hotspot monitoring components include Natura2000 zones and the Urban Atlas.
The Copernicus Land Monitoring Service offers Pan European wall-to-wall High-Resolution Layers (HRL) of interest to derive land surface parameters for coastal flood modeling and coastal flood exposure assessment, complementing the CZ LC/LU product. HRL are split into 5 different layers which are regularly updated every 3 years, each of them addressing a specific land cover at a 10 m × 10 m ground sampling size. These HRL provide information on (i) land imperviousness, capturing the spatial distribution of artificially sealed areas, the degree of imperviousness and the part of sealed areas corresponding to built-up areas (above-ground building constructions); (ii) forests, with the forest type, tree cover density, and dominant leaf type; (iii) grassland areas (surface roughness is much lower over grassland than over urban areas); and (iv) water and wetness, distinguishing permanent water, temporary water, permanent wetness and temporary wetness.
Regarding population exposure, the European Settlement Map (ESM) distributed by CLMS represents the percentage of built-up area coverage per spatial unit, at a resolution up to 2.5 m, using SPOT 5 and 6 missions and machine learning techniques in order to understand systematic relations between morphological and textural features.
For several of the above products, change layers are also provided (e.g., 2012-2018 changes). The combination of the different datasets described in this section can refine population and asset exposure to coastal flood.
Since coastal zones are typically subjected to multiple, strong, and often diametrically opposing societal interests in a very limited space, coastal landscape and ecosystems are experiencing high levels of pressure. Coastal habitats and ecosystems (e.g., dunes, aquatic vegetation, etc.), besides the intrinsic value they represent for biodiversity, for wellbeing and tourism, do fulfill the fundamental role of natural protection against SLR and coastal erosion. A degradation of these habitats results in an increased vulnerability and exposure of coastal areas (e.g., Hanley et al., 2020).
Specific instruments such as the Integrated Coastal Zone Management (ICZM), Marine Strategy Framework Directive (MSFD) but also the recently published EU Strategy on Adaptation to Climate Change14, were put in place as a result of recognizing the need to coordinate a situation of high pressure on coastal areas on one side and the importance of preserving the functioning of natural habitats on the other side. Together with socio-economic data, geographically explicit and quantitative information are key for knowledge-based decision making, such as ICZM and MSFD. To provide such validated geographic data is a key role of the Copernicus Programme.
Vulnerability
In the risk conceptual framework, vulnerability can be defined as a function of sensitivity and the nature of the hazard to which a system/population is exposed (Brooks, 2003; Abram et al., 2019). It includes social vulnerability, which depends on economic well-being, health and education status, preparedness and coping ability to sea-level rise induced hazards. It also includes biophysical vulnerability, which relates to ultimate impacts of a hazard event, and is often viewed in terms of the amount of damage experienced by a system as a result of an encounter with a hazard.
Data needed to assess vulnerability of population or assets (for instance, technical characteristics of building and the built environment) are not provided in Copernicus Services. Economic damages directly induced by floods are usually estimated through depth-damage curves which relate flood damage for a specific flood water-depth per asset (e.g., residential buildings, industry, transport, agriculture, etc.) or land-use class (Huizinga et al., 2017). In that regard, a better assessment of flood water-depth and of land-cover/land-use classes as provided by CLMS (section “Exposure to sea level rise”) can contribute to refine vulnerability assessments.
Managing and Monitoring of Coastal Floods and Risks
The on-demand mapping component of CEMS, which can be triggered by authorized users (mostly national civil protection authorities), can be used to monitor coastal floods or to provide coastal flood risk maps for areas in Europe or globally. In the rapid mode, once a user has activated it, the service provides flood delineation or damage grading maps of a coastal flood event within hours or a few days based on the acquisition, processing, and analysis of satellite imagery and other geospatial raster and vector data sources. An example of such rapid mapping that supported the emergency response to the coastal flooding caused by tropical cyclone Idai is illustrated in Figure 10. Tropical Cyclone Idai made landfall during the night of March 14, 2019 at 23.30 UTC close to Beira City in central Mozambique. On 15 March 2019 at 0.00 UTC, its center was located approximately 25 km north-west of the center of Beira, with maximum sustained winds up to 167 km/h. Heavy rainfall, strong winds and storm surge affected the coastal area of the Sofala region, in particular Beira.
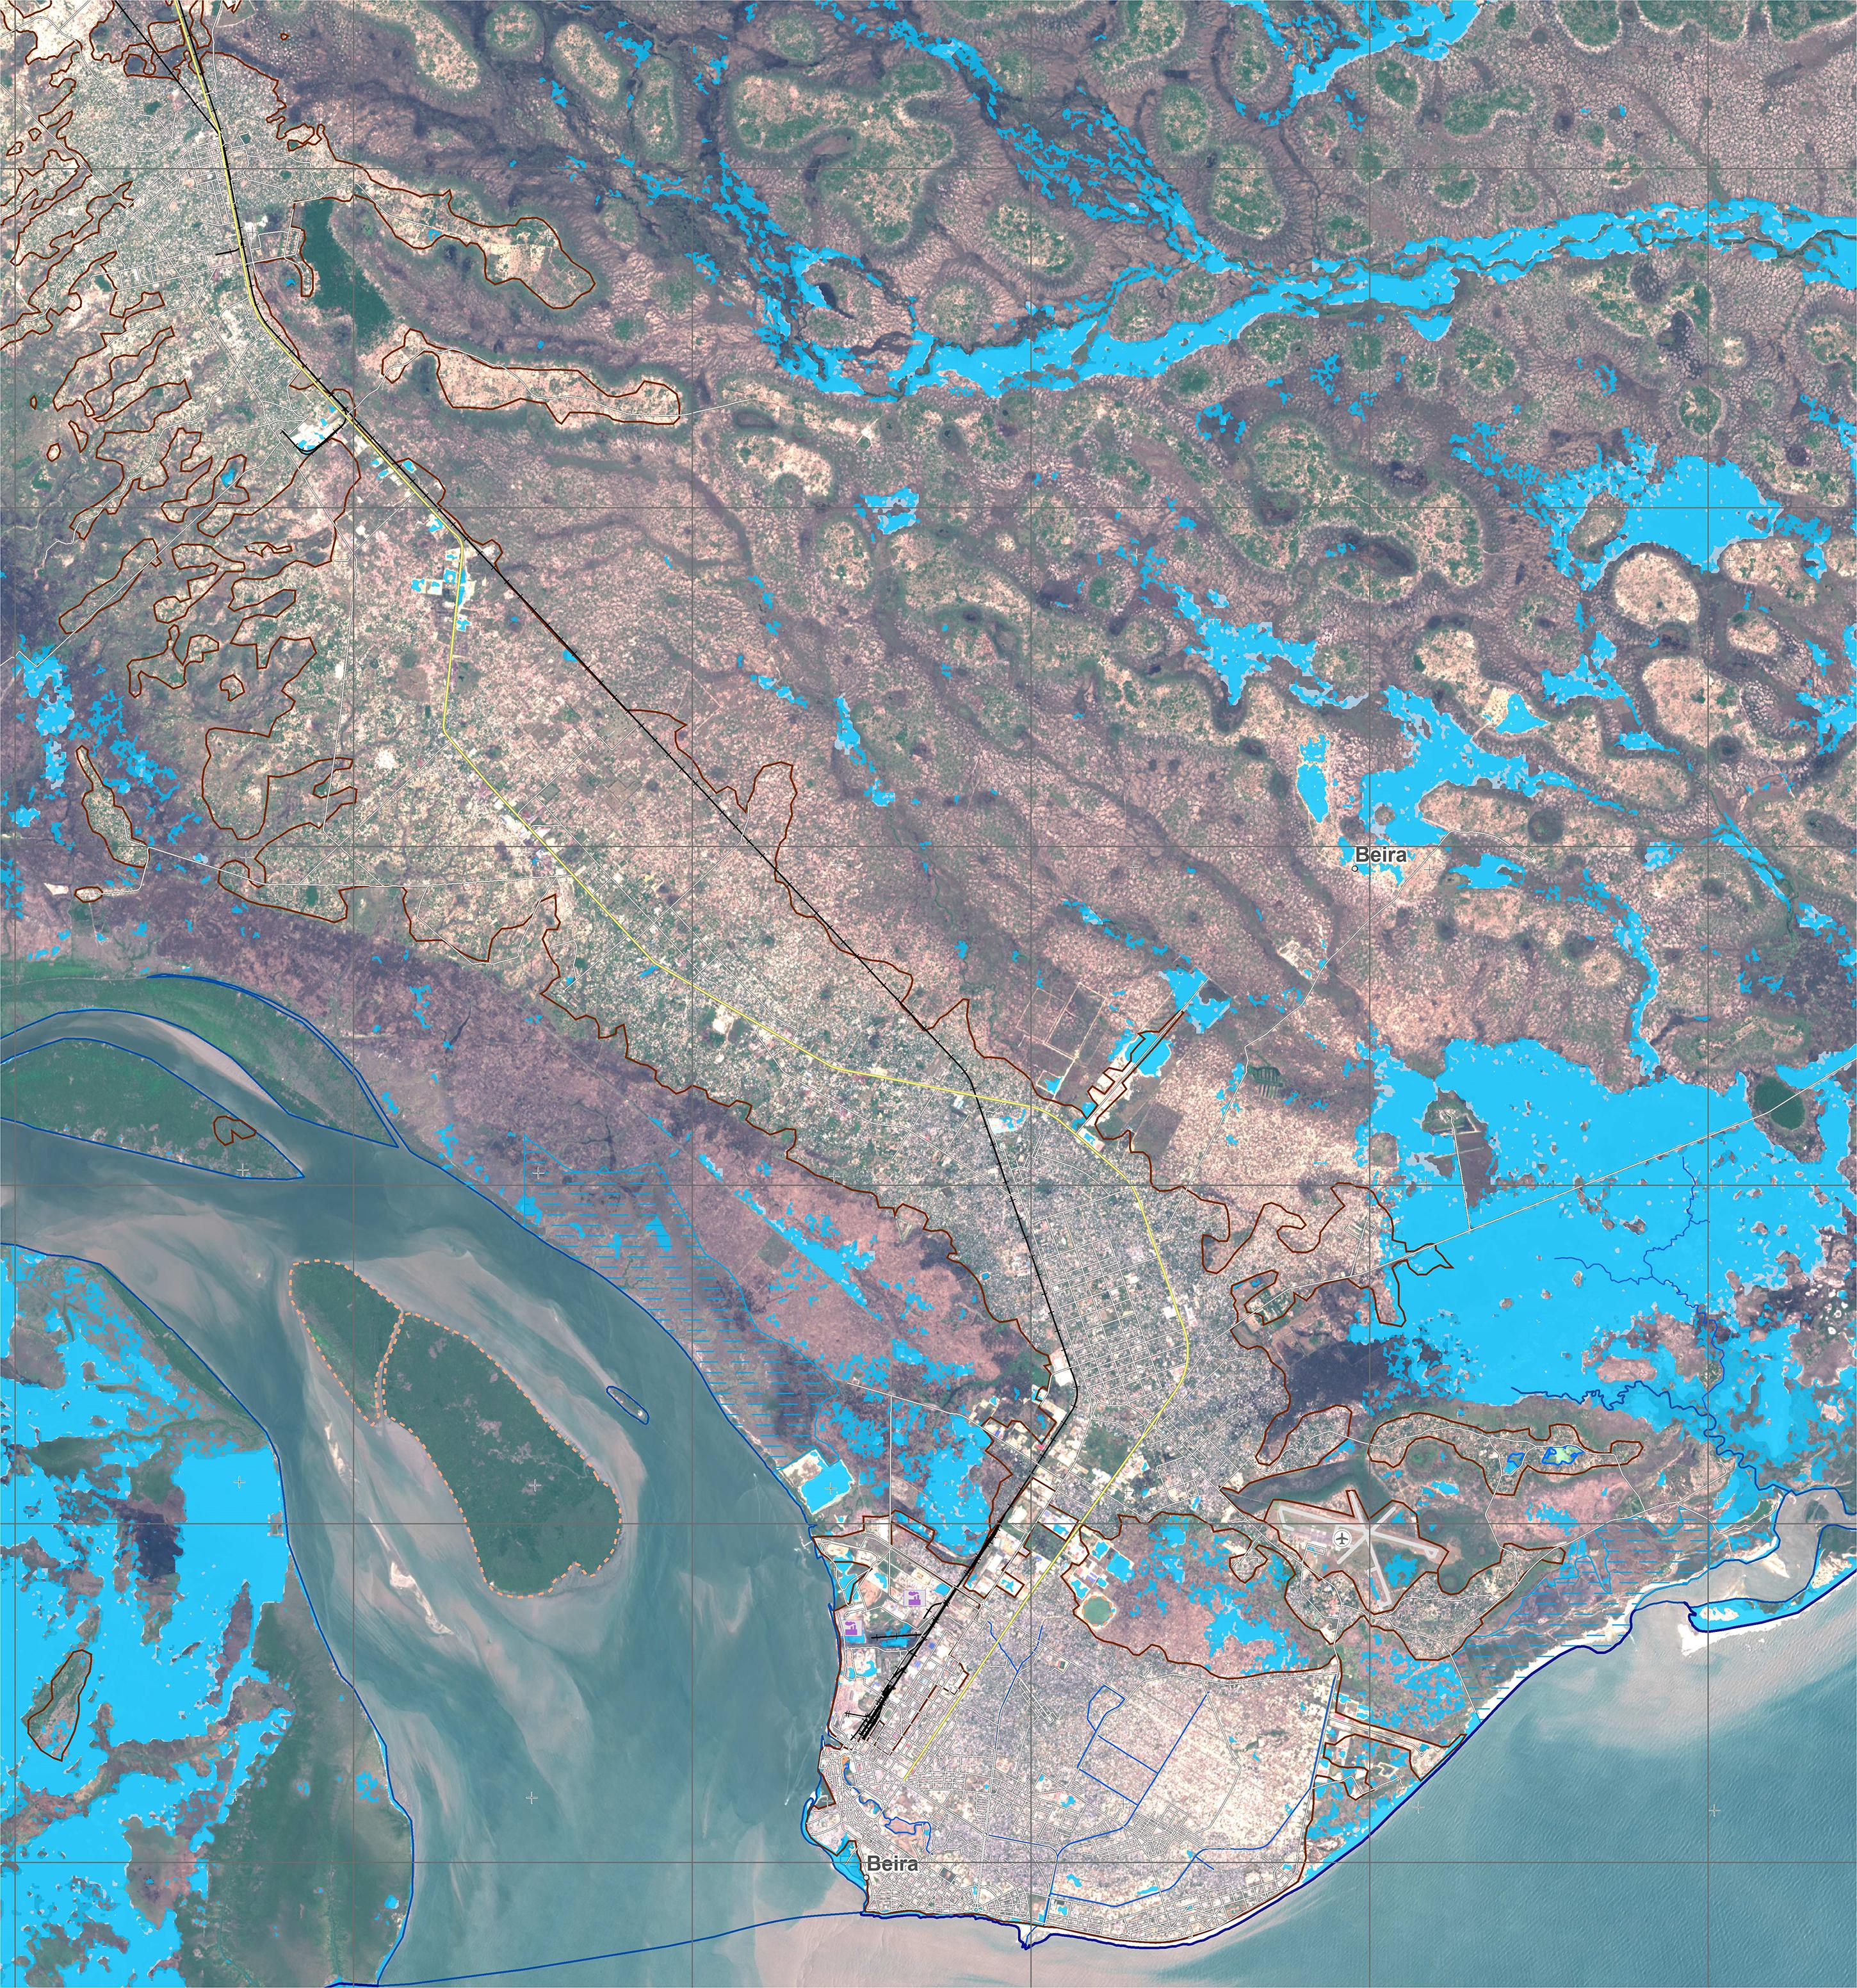
Figure 10. Flood delineation map based on a Sentinel-1 image acquired on 20 March 2019 03:08UTC for the city of Beira and surroundings, Mozambique. Flooded areas are indicated in bright blue. Source: Copernicus Emergency Management Service, map available online https://emergency.copernicus.eu/mapping/ems-product-component/EMSN034_01COSTADACAPARICA_M1-COASTALFLOODHAZARD_OVERVIEWA1/1.
To support risk prevention and planning for coastal floods the on-demand mapping component of CEMS can also provide detailed coastal flood risk maps. The flood risk maps are derived by using a wide variety of reference data such as hydrography, bathymetry, physiography, land cover/land use, building footprints, transportation network, populated places and administrative boundaries in combination with flood probability scenarios from flood hazard models. An example of a detailed coastal flood risk map from CEMS is illustrated in Figure 11 where the hazard was calculated using total water level during a storm and extrapolating the water level on the digital terrain model following a bathtub approach.
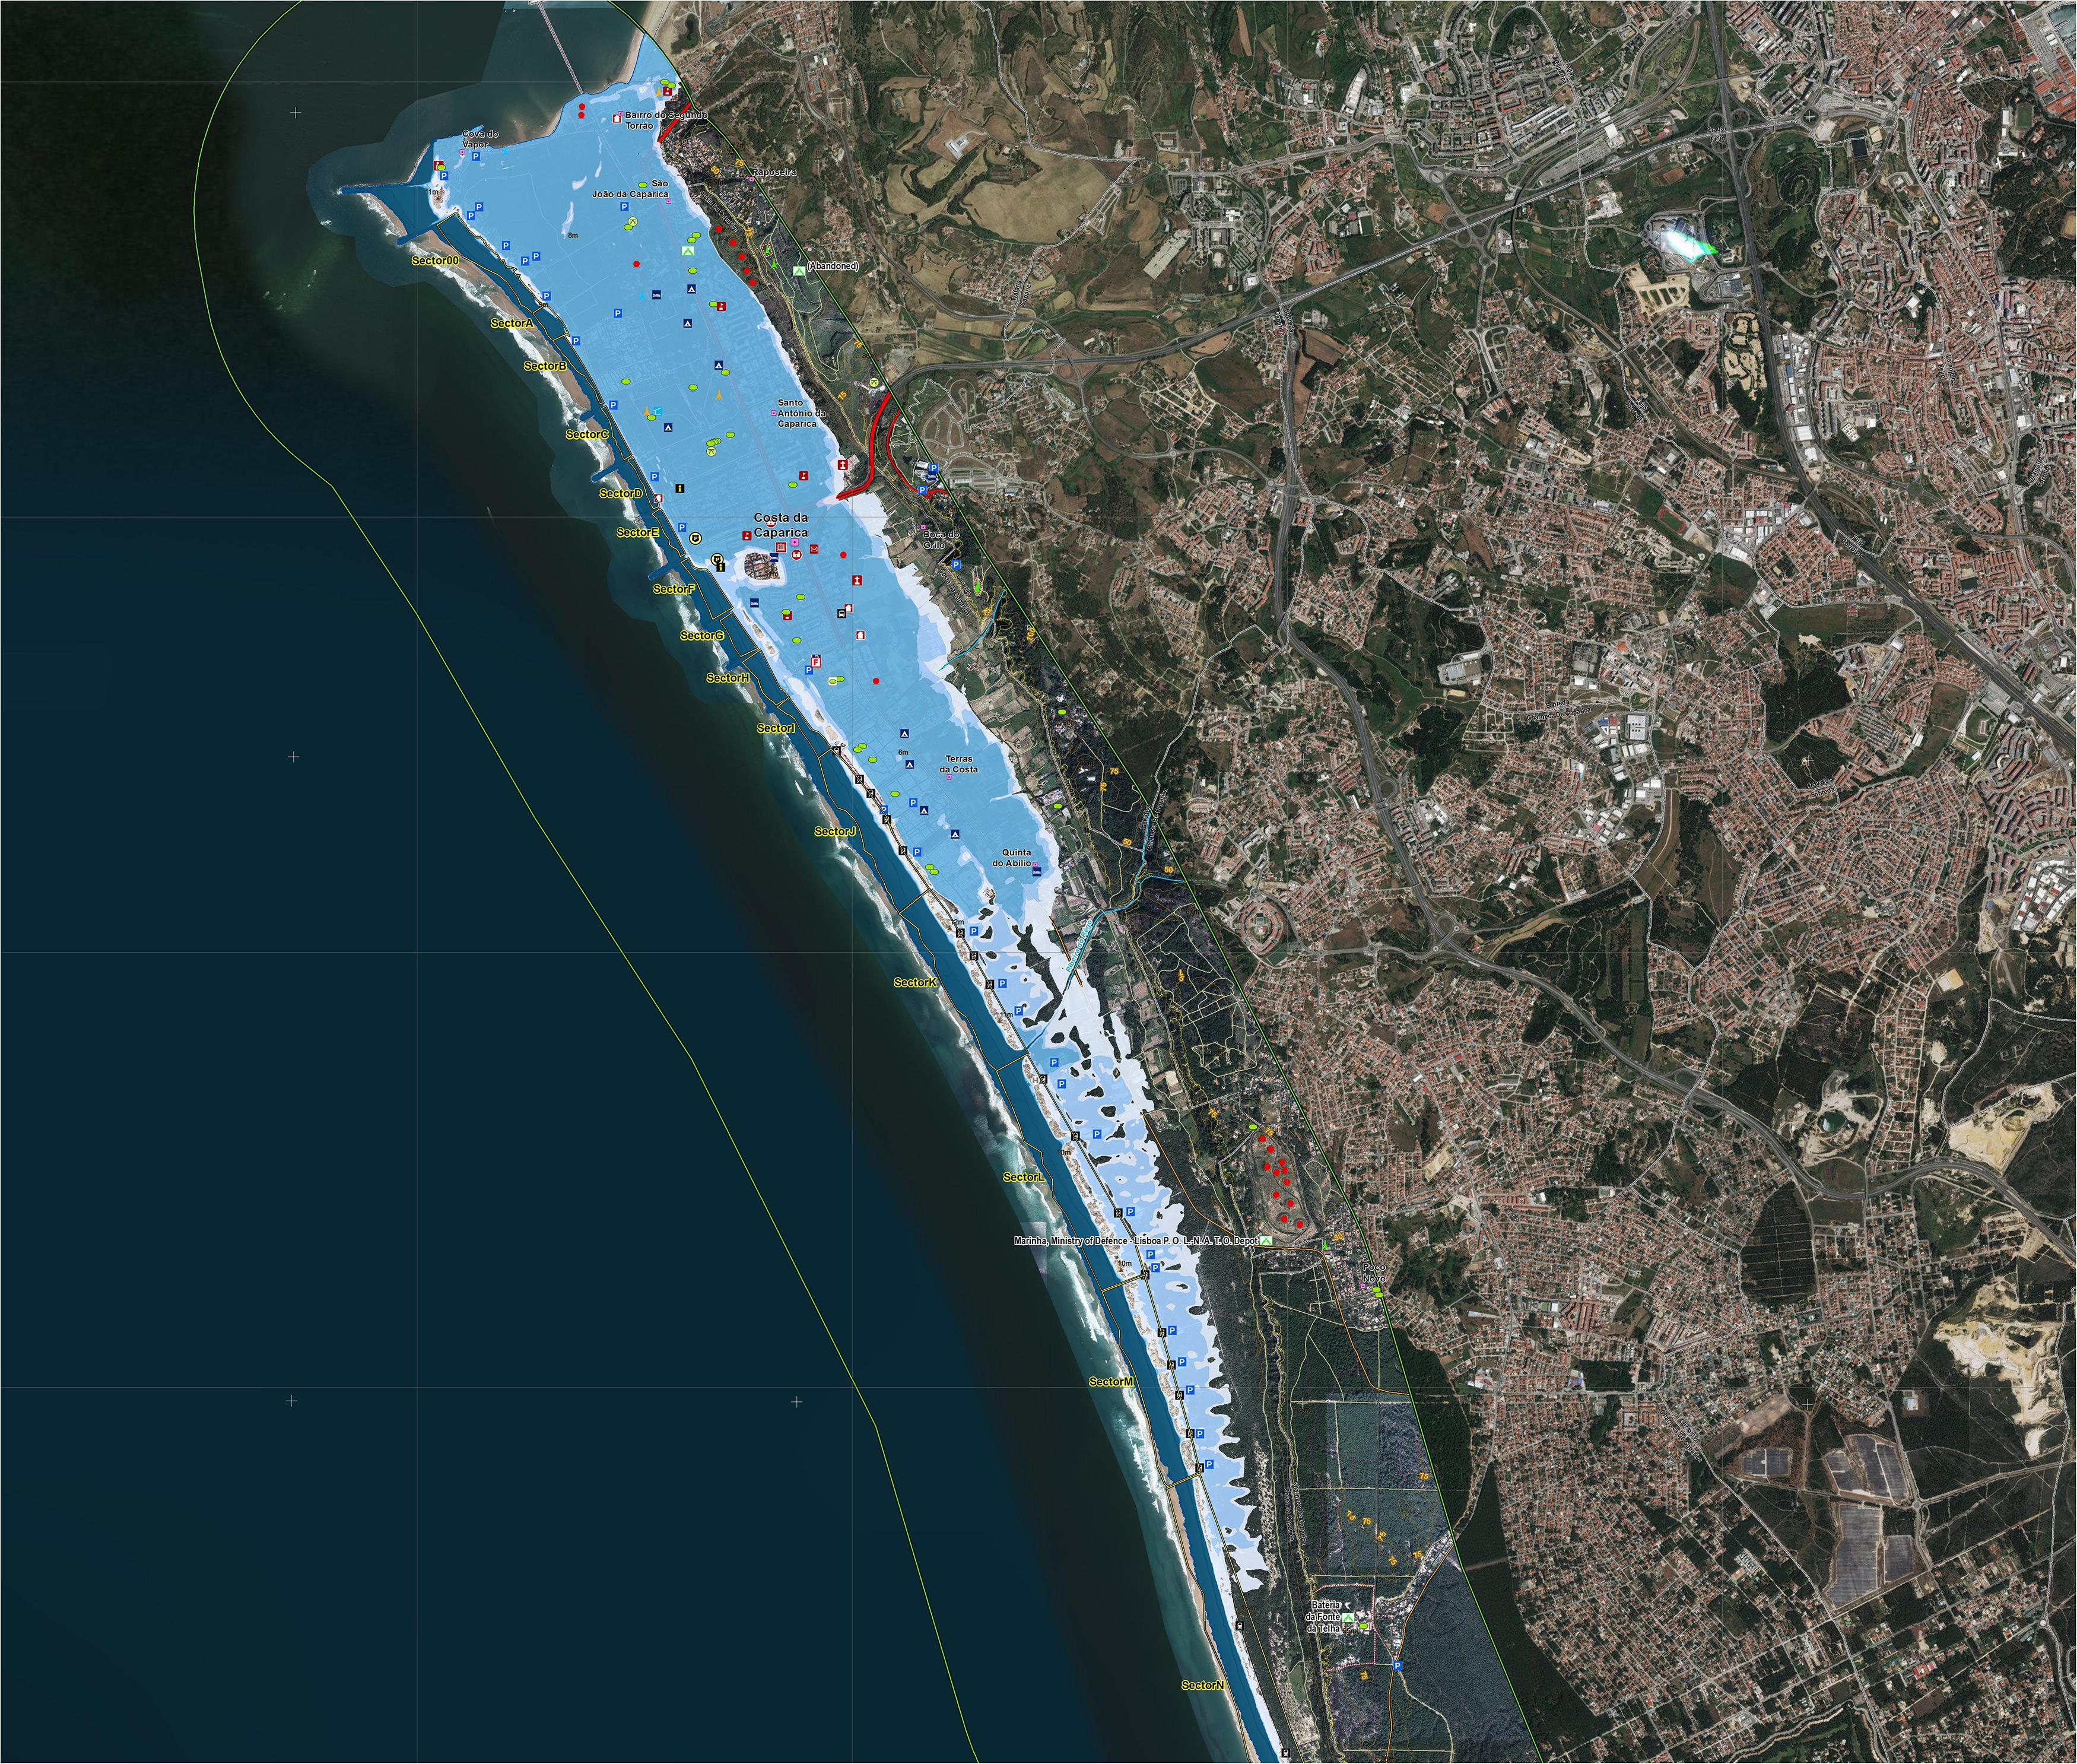
Figure 11. Coastal flood risk map for the coast of Caparica in Setubal, Portugal. Colors from dark blue (return period 5 years) to light blue (100 years return period) indicate the flood hazard for different return periods. Source: Copernicus Emergency Management Service.
Sea Level Monitoring and Reporting Activities
An Ocean State Report (OSR) is published on an annual basis (von Schuckmann et al., 2016, 2018, 2019, 2020) by CMEMS for the scientific community, with a summary which is more tailored for policy and decision-makers. Ocean State Reports provide information on the state, variability and change of the European regional seas and the global ocean. They rely on the unique capability and expertise that CMEMS gathers in Europe to monitor, assess and report on past and present marine environmental conditions and to analyze and interpret changes and trends in the marine environment.
In particular, in the summary of the last OSR issue, regional sea level trends were provided (Figure 12) and contributed to the Word Meteorological Organization (WMO) (2020, 2021). OSR also includes case studies. With regard to sea level rise, a study was dedicated to the TOPEX-A altimeter instrumental anomaly and acceleration of the global mean sea level over the altimetric era (Legeais et al., 2020; Figure 3A). OSR also reports on specific events (see section “Downscaling Copernicus Forecasts” for an illustration).
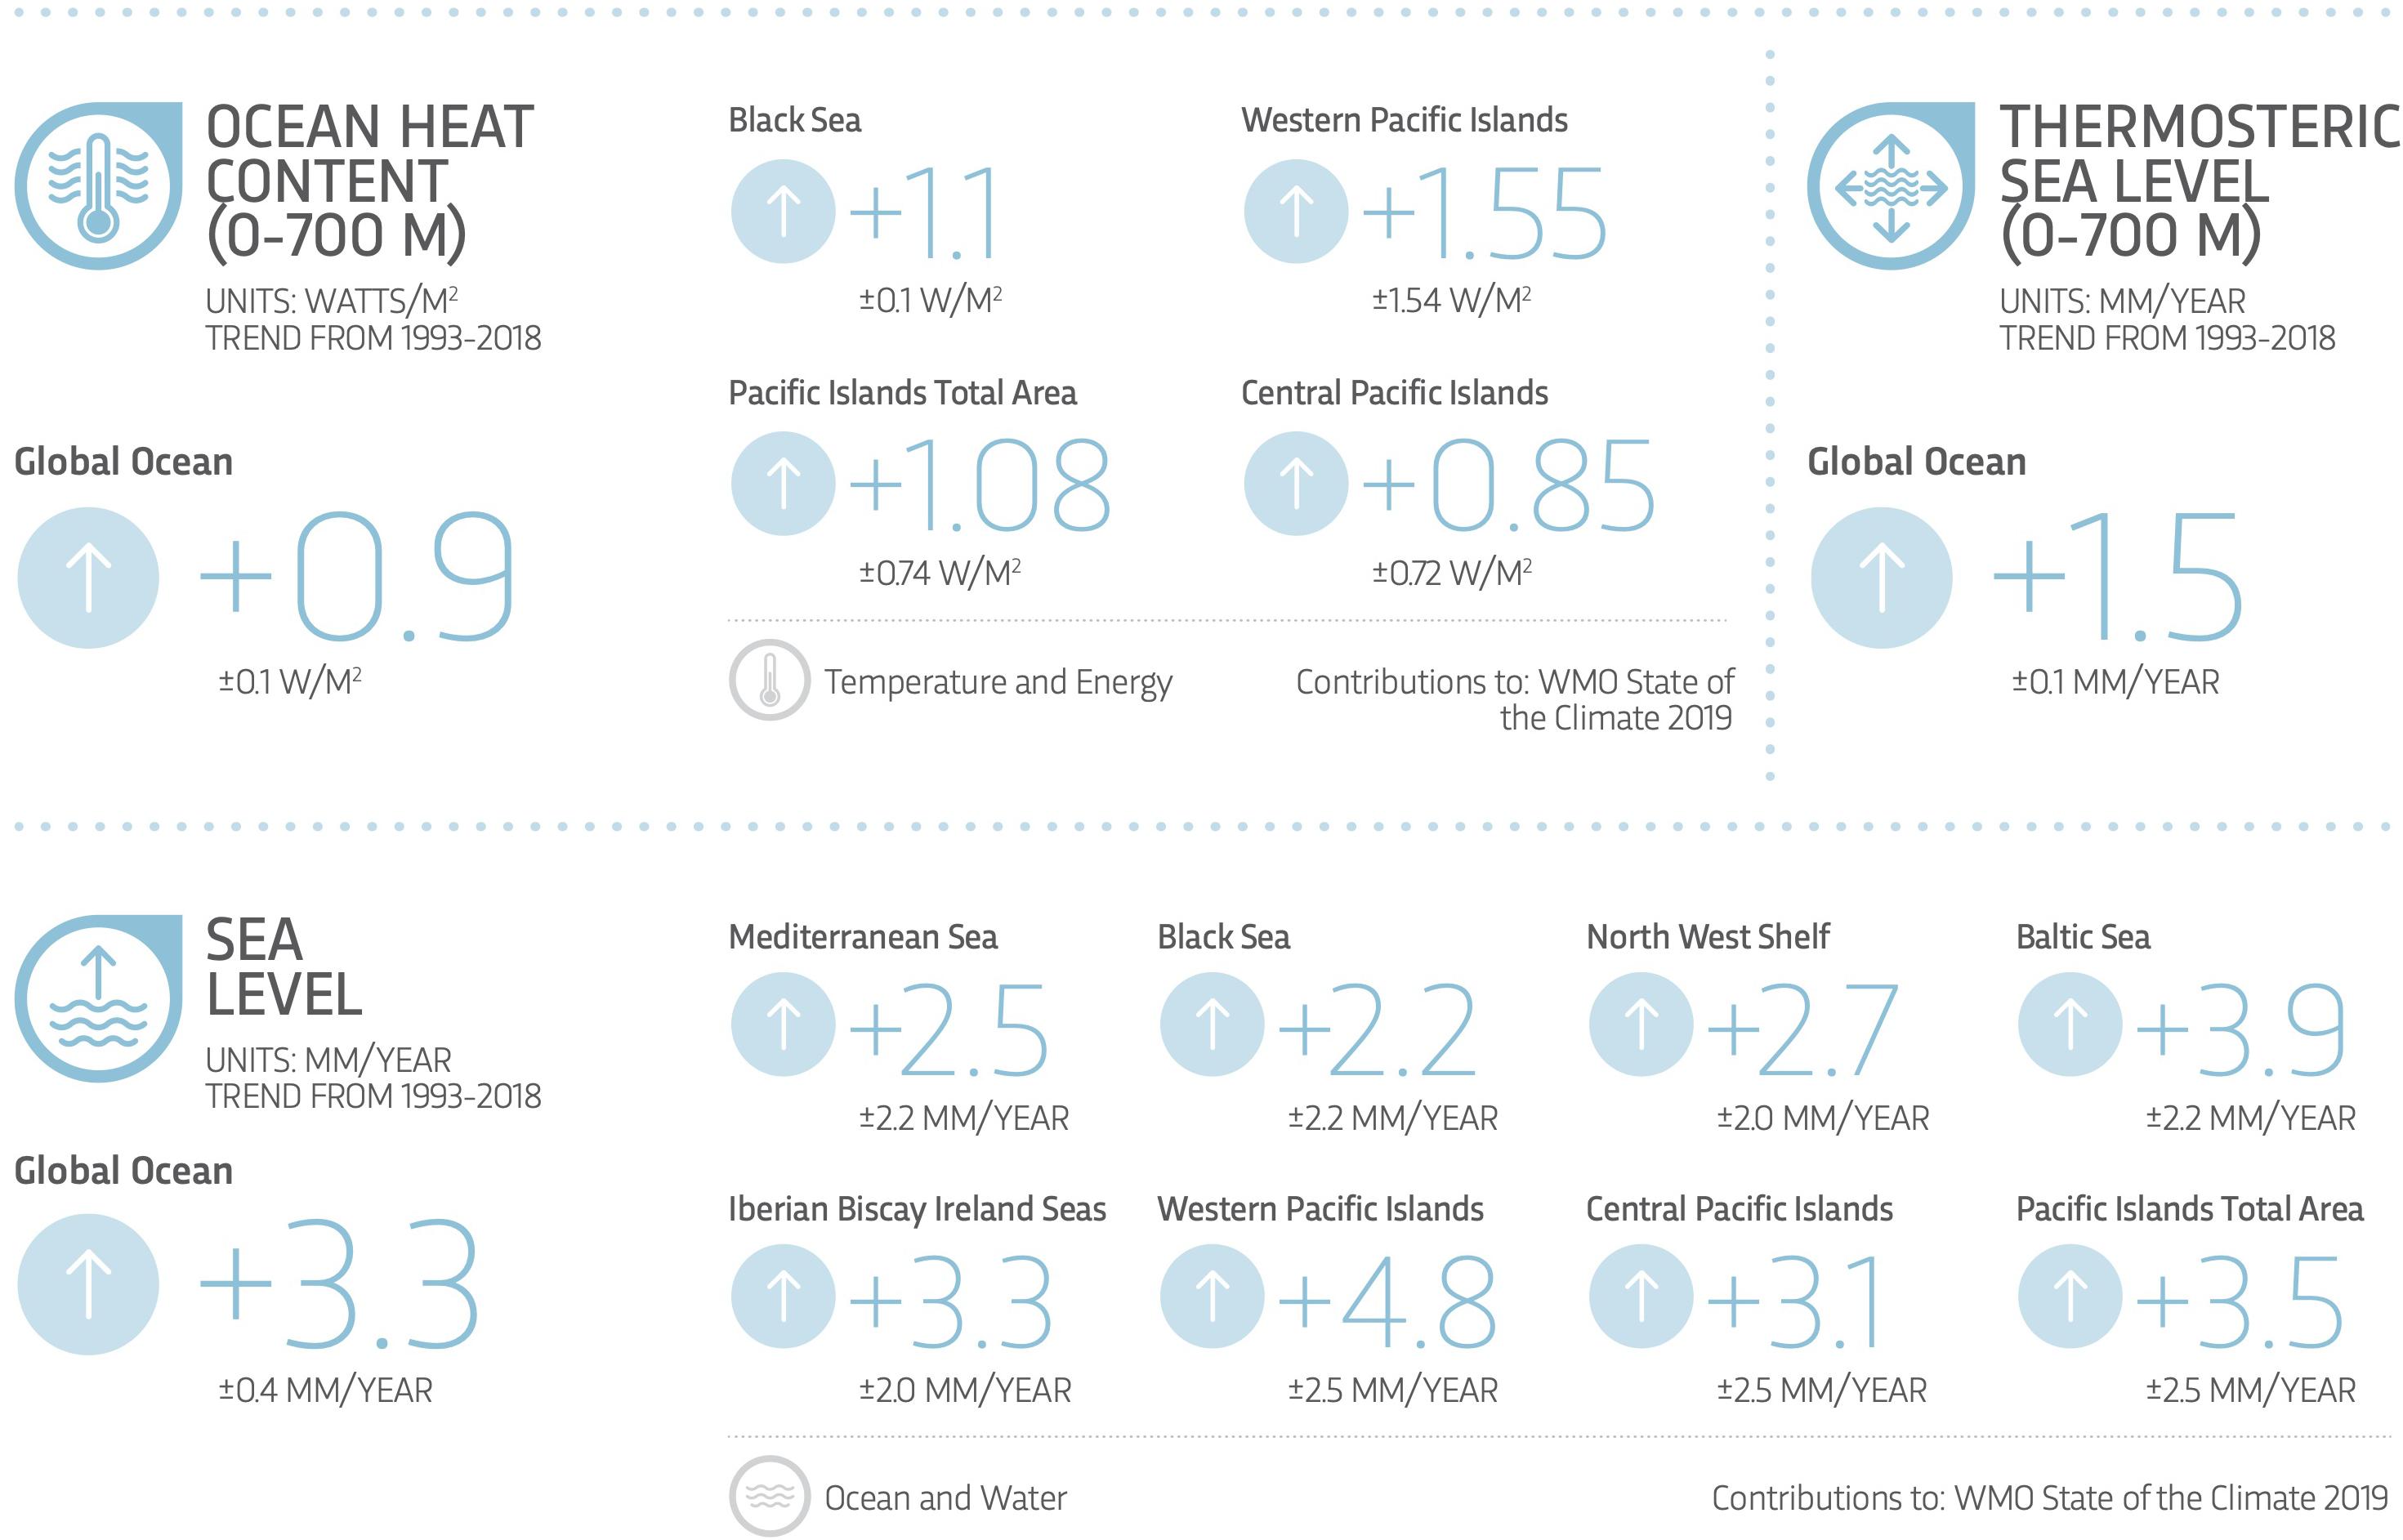
Figure 12. Information on sea level rise averaged over the global ocean, EU regional seas and Pacific Islands regions. Source: Ocean State Report issue 4 Summary, von Schuckmann et al. (2020).
Based on OSR results, CMEMS produces Ocean Monitoring Indicators (OMIs) that are used to monitor the main changes and trends in the marine environment over the past 25 years. OMIs on sea level rise are provided at global and EU seas regional scales based on data provided by C3S/CMEMS and are regularly updated (Figures 3, 12).
As change in mean sea level is an essential indicator of our evolving climate, GMSLR is one climate indicator covered in the C3S Service’s European State of the Climate (ESOTC) report, which is published annually. GMSLR is due to two main factors: land ice mass loss and thermal expansion of the ocean (section “Sea-Level Change Hazard”). Therefore, it is not possible to determine the attribution of changes to sea level without also understanding the climate system and its associated impacts. Land ice includes the polar ice sheets in Greenland and Antarctica, and all glaciers worldwide. To estimate the contribution from each source to GMSLR requires consistent data records that cover corresponding time periods. During the 2006-2015 period, ocean thermal expansion explains more than 40% of the GMSLR (Oppenheimer et al., 2019). The remaining contribution comes mostly from land ice mass loss, but also from land water storage, such as ground reservoirs and the Glacial Isostatic Adjustment (GIA, Peltier, 2004).
Ice sheets and glaciers gain mass through snowfall and lose mass through ablation, melting or calving. For ice sheets, ice flows from its center towards the ocean through glaciers and ice streams, ultimately forming floating ice shelves and calving icebergs from the edge of glaciers. The mass change of ice sheets and glaciers is converted to an equivalent sea level contribution by assuming that around 360 Gt of ice mass loss is equivalent to 1 mm of GMSLR. Within European territories, glaciers that have the largest contributions to GMSLR are located in Greenland, Svalbard and Iceland (Figure 13). During the 2019 summer, the Greenland ice sheet experienced record melting, with close to 96% of the surface experiencing melting at least once (Sasgen et al., 2020). Below average snowfall and an early start to the melting season resulted in early exposure of bare ice, which further enhanced melting, as bare ice reflects less solar energy than fresh snow, in what is termed melt-albedo feedback (e.g., Ryan et al., 2019).
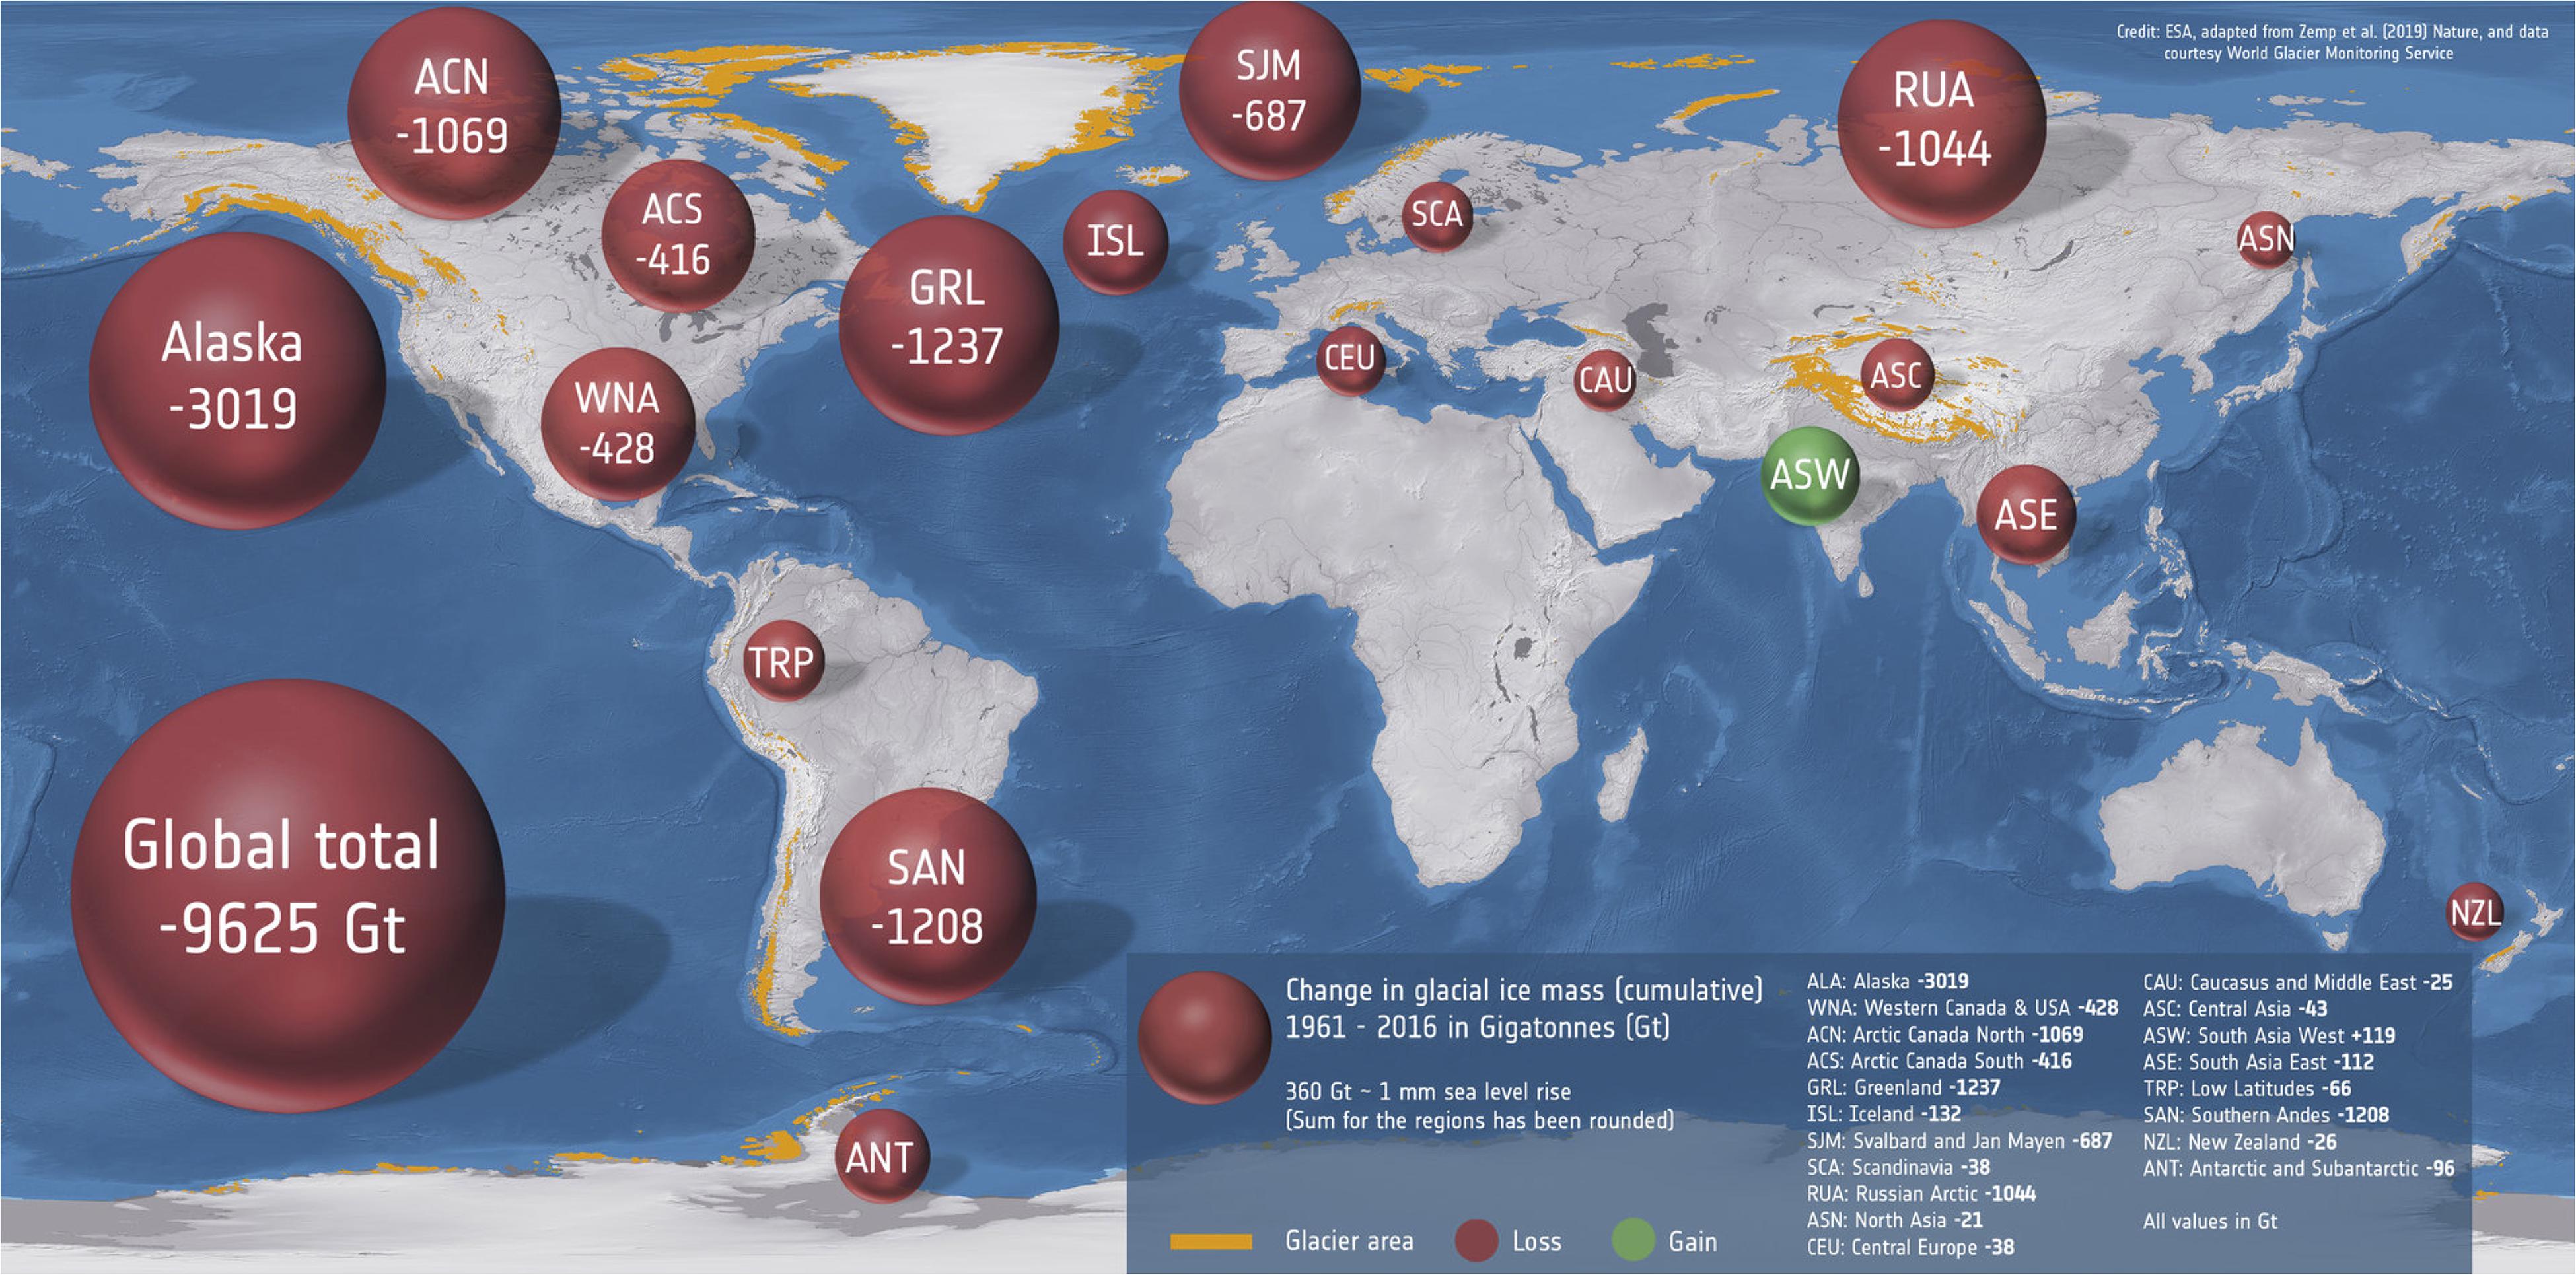
Figure 13. Glacier mass change from 1961 to 2016 estimated for different regions, from the European State of the Climate (ESOTC) (2019). The cumulative global and regional mass changes (in Gt, represented by the size of the bubble) are illustrated. 360 Gt of land ice mass loss rises the global mean sea level by 1 mm. Data from Zemp et al. (2019).
A Service Layer
In addition to producing scientific information, Copernicus Services deliver open and free services including manned service desks, tailored user access to data and user notifications, training, tutorials, outreach actions and expert support. Each service has a unique and standardized entry point to its catalog of products and information. Visualization interfaces, processing tools and digital services have been developed for users to explore the data, to extract parts of the data and to process them.
Cloud infrastructures have also been developed and used for Copernicus Services. For C3S, it is now represented mostly by the Climate Data Store but expected to be expanded and enriched by the DIAS platforms, adding a way for the users to interrogate the data and convert it into something directly usable. As key organizations in the Copernicus Programme, EUMETSAT, ECMWF Mercator Ocean and recently EEA, have combined their experience to jointly develop the WEkEO Copernicus DIAS service. WEkEO is the EU’s Copernicus DIAS reference service for environmental data, virtual environments for data processing and skilled user support.
Case Studies for Sea-Level Rise Adaptation
This section provides some illustrations of the use of Copernicus data for SLR adaptation.
European Coastal Storm Surge
The Copernicus Climate Change Water level change indicators for the European coast dataset presents extreme-value, return period, and percentile indicators for coastal sea levels in a European-wide domain. These indicators are computed from tidal dynamics, storm surge and SLR data based upon past observational data and future climate projections, covering 1977-2100.
The C3S water level indicators are underpinned by the Deltares Global Tide and Surge Model (GTSM) version 3.0 (Muis et al., 2020) together with regional climate forcing and SLR initial conditions. In addition to the climate change scenarios, a reanalysis dataset is computed by forcing GTSM with the ERA5 reanalysis. This provides recent historical water-levels that can be used to look at specific (extreme) events in the past.
To demonstrate the value of the C3S water level indicators, the contractor undertook case studies, including improving local hydrological and coastal flooding models for Clontarf (Dublin) and Salthill (Galway)15, on the Irish East and West coast, respectively. These two locations were chosen in conjunction with participating stakeholders who are facing an increased risk of coastal flooding due to climate change. This dataset allowed end users to gain a full understanding of the expected impact of climate change along the Irish coast at customized time scale for current, near and far future scenarios.
Downscaling Copernicus Forecasts
Copernicus Services provide generic ‘core’ information supporting expert value-adding services, thereby complying with the Copernicus Programme delineation process of core versus public and commercial downstream activities.
Downscaling of Copernicus products might be needed to provide more accurate local information, especially on the hazard side. CMEMS operational ocean systems are routinely used as forcing for more local, downscaled ocean operational systems. An overview of the current European capacity in terms of operational modeling of marine and coastal systems was recently presented in Capet et al. (2020) and indicated that about half of the reported regional / local ocean modeling systems rely on CMEMS models for open boundary conditions. A review of storm surge modeling for Europe is provided in Umgiesser et al. (2020), with several systems also part of CMEMS or using CMEMS as boundary conditions. Recently, the OPENCoastS service has been developed to generate on-demand coastal ocean forecasts (Oliveira et al., 2020). CMEMS data are available in OPENCoastS as ocean forcing at the local model boundaries for daily coastal predictions.
An example of downscaling CMEMS’s forecasts is provided below for harbor operations in Spain. CMEMS forecasts are routinely downscaled into higher resolution models able to forecast the ocean state inside around ten harbors. The ability of the CMEMS and downstream systems to forecast extreme events was showcased during Storm Emma in the Gulf of Cadiz, which experiences a heavy maritime traffic. The systems were found to have properly forecasted Storm Emma extreme sea levels and significant wave heights (>7 m) in March 2018, as reported in the CMEMS Ocean State Report #4 (De Alfonso et al., 2020). The combination of CMEMS wave buoy observations and reanalysis information indicated that Emma was the most severe wave storm for that region in the past 20 years. Thanks to CMEMS downstream services for those harbors (Sotillo et al., 2020), alert systems were activated before the storm arrived and users were warned early. Safety could be ensured in port facilities and no personal damages were reported.
Perspectives on Copernicus Services for SLR Adaptation
The Copernicus Programme has been renewed and funded over the 2021-2027 period, leading to the so-called Copernicus 2. This section discusses evolutions that could be implemented in the core Copernicus Services of relevance for SLR adaptation.
New Satellite Missions
During 2021-2027, the Sentinel missions family will continue to expand. New units (C and D) will be launched for Sentinels 1, 2, and 3 and will guarantee sustained observations of sea level, surface wind waves, nearshore bathymetry and shoreline position, land cover and land use etc. The first unit of Sentinel 6, called Sentinel 6-Michael Freilich, was launched in November 2020 and a second unit will be launched during Copernicus 2. Sentinel 6 will improve the monitoring of sea level, with enhanced accuracy and long-term stability. It will become the new reference mission for altimetry in CMEMS and C3S (Legeais et al., under review in this issue) and will be used to calibrate other missions. An important advance from Sentinel 6 will be its capacity to monitor sea level at higher resolution, and closer to the coasts where altimetry data are less reliable (Birol et al., 2017; Cipollini et al., 2017). In addition to the Sentinels, other satellite missions will contribute to the monitoring of relevant environmental fields for sea level. This includes for instance the SWOT mission (Morrow et al., 2019) for a high-resolution monitoring of sea level along 2D swaths. The corresponding data will be processed and add value to products delivered by Copernicus Services.
Altimetric data processing and mapping procedure updates are also to be expected in the coming years, contributing to further improvements in altimetric products in coastal zones.
On a longer term, six High Priority Candidate Missions (HPCM) could expand the capabilities of the current Sentinel family to fill gaps in Copernicus user needs and to better support policies. Of particular importance for SLR induced risks are the CRISTAL mission (Sentinel 9), for monitoring ice sheets and glaciers height changes; ROSE-L (Sentinel 12) for monitoring ice-sheets and land subsidence; CHIME (Sentinel 10) for monitoring land cover. The HPCM missions will feed into Copernicus Services as well.
Upgraded and New Products and Service Lines
In addition to ensuring the continuity of the existing Copernicus Programme achievements and to incremental improvements in their existing products and services in Copernicus 1, Copernicus services will keep evolving in Copernicus 2 (2021-2027) to better answer user needs and support policies. A series of major product improvements, new products and service lines could be implemented in Copernicus 2 depending on funding, on precursor projects (e.g., H2020, Horizon Europe projects for Copernicus Evolution), and on evolving user and policy needs. This section lists a series of potential evolutions envisioned by the Copernicus services that are relevant to SLR adaptation, with no guarantee, so far, that these evolutions will actually be implemented by 2027.
Monitoring of the Coastal Zone
Dynamic Nearshore Bathymetry
A new core, pan-European satellite-derived nearshore bathymetry dynamic product could be produced in the framework of CMEMS, based on Sentinel and other contributing missions. As the bathymetry is dynamic in coastal zones (e.g., Bergsma et al., 2019), the product would be regularly updated to capture the evolution of bathymetry, and developed in synergy with EMODnet who provides a static pan-EU bathymetry product. An improved coastal zone bathymetry characterization would be beneficial notably for estimates of total water level at the coast.
Dynamic Shoreline Position and Tidal Ranges
The evolution of the shoreline position represents the dynamic response of the coastal system to the changing geophysical climatic and anthropogenic forces on the coastal zone. Products implemented by the CLMS are typically addressing land phenomena with lower dynamicity as compared to the shoreline. Thanks to recent algorithm developments, instantaneous (at time of observation) shoreline positions can be extracted from satellite imagery (Pardo-Pascual et al., 2018; Vos et al., 2019). Repeating the mapping of the shoreline using a high number of available Sentinel 1 and 2 data, by intersecting this spatial information with validated in situ data, moon calendar, and an accurate DEM, the dynamicity of the shoreline can be derived in a spatially explicit manner. Analyses of time-series of satellite-derived shoreline positions inform on the stability, erosion or accretion of the shoreline (e.g., Luijendijk et al., 2018; Mentaschi et al., 2018; Castelle et al., 2021) as well as on tides, and flood events. In consequence it also means to monitor the extent of intertidal flats and its evolution over time.
Vertical Land Motion
Land subsidence causes relative sea level rise that should be accounted for in SLR related risk assessments (Wöppelmann and Marcos, 2016). Subsidence is classically measured with topographic surveys or continuous GNSS networks but, in the last decade, the interferometric analysis of Synthetic Aperture Radar (SAR) images became one of the most exploited tools for subsidence estimation along coastal areas (Melet et al., 2020a). Thanks to the technological advancements of SAR satellites, to the readiness of algorithms, to the available computational capabilities and to the launch of the Sentinel-1 constellation, it is nowadays possible to measure subsidence, and other ground motions, over the entire Europe. The European Ground Motion Service (EGMS) of the CLMS will be the first worldwide service offering to a wide range of users certified ground motion information derived from the analysis of Sentinel-1 images. The first end-to-end implementation and operation of the Service will cover the Copernicus Participating States and will provide consistent, standardized, interoperable, and harmonized across national borders products in three different formats:
1. Level 2a (Basic): displacement data in ascending and descending orbits measured along the line-of-sight of the sensor and referred to a local reference point.
2. Level 2b (Calibrated): as Level 2a but calibrated with a GNSS reference network. The measurements are referred to an absolute geodetic reference frame.
3. Level 3 (Ortho): horizontal and vertical components of motion calculated from multi-orbit level 2b. As for level 2b, level 3 is anchored to the geodetic reference frame.
The baseline portfolio (levels 2a, 2b and 3), using Sentinel-1 data from February 2015 to December 2020, will be delivered at the beginning of 2022 and will be followed by three annual updates. External validation will be performed at the end of every production cycle. EGMS data will be distributed through a dedicated dissemination platform. Additional information can be found in Crosetto et al. (2020) and in the dedicated page of the CLMS website16.
The EGMS will certainly provide accurate and reliable information for the estimation of the relative sea level rise in many low-lying areas along the coasts of the Copernicus Participating States. Moreover, it will give access to an unprecedented density of measurement points, especially in urban areas, with an accuracy level similar to the one obtainable with topographic measurements. Quantifying subsidence will allow for the refinement of relative sea level rise and flood impact models. The availability of time series of deformation will permit the reconstruction of subsidence in the recent past and the detection of accelerations in the subsidence rates.
Monitoring and Forecasting of Coastal Floods
In addition to the gradual rise in sea level, relevant for submersion, SLR is also leading to ever more frequent extreme events (Oppenheimer et al., 2019). This makes the monitoring and forecasting of coastal flood events and the subsequent assessment of their impact of primary importance for CEMS.
Evolutions of Total Water Forecasts
Accurate total water level forecasts are crucial for early warning systems and for operating mobile coastal defenses that can close to protect coastal cities from forecasted extreme events (e.g., MOSE barrier for Venice, Umgiesser et al., 2020).
To improve total water level forecasts, several evolutions could be foreseen within CMEMS. First, regional forecasting systems could be run at higher resolution, reaching a kilometric resolution. This would allow a better characterization of the regional to coastal circulation patterns and features. More integrated systems in terms of coupling between the ocean, wave and atmospheric model components of the forecasting system would also be beneficial to extreme sea level forecasts. Indeed, extreme water levels are often due to the combination of atmospheric conditions (strong winds, low atmospheric pressure), of high waves, and of high tides. It should be noted, however, that lower frequency sea level variability, such as that due to oceanic general circulations (including mesoscale activity, seasonal to interannual and decadal variability) can also contribute to extreme water levels (e.g., Melet et al., 2016; Fernandez-Montblanc et al., 2020; Lowe et al., 2021). Non-linear effects and retroactions between wave, ocean and atmosphere can alter the simulation of extreme events. For instance, higher sea levels can alter wave dissipation through depth-limited breaking, mean sea level rise can alter barotropic tides and surges through changes in bottom friction, surface currents can lead to wave refraction, sea surface roughness due to the presence of waves can alter the wind stress and momentum flux to the ocean, etc. (Idier et al., 2019). Another coupling effect comes from the land, with river discharges and runoff. A better characterization of the land boundary and of the land to sea forcing, in particular for river discharges, is needed. The co-occurrence of high sea levels and of large runoff and river discharges induced by precipitation during storms can result in compound flooding events (e.g., Bevacqua et al., 2019).
In Copernicus 1, ocean and wave forecasts produced by CMEMS (section “Sea Level Observations”) were deterministic. New probabilistic forecasts based on model ensembles could be proposed to provide a better characterization of forecast uncertainties. As extreme sea levels are also often due to the timing of different drivers (e.g., tides and storm surge), ensemble forecasting would better sample different possible phasing of the contributions to total water levels. Probabilistic forecasts could better characterize the confidence level associated with the provided forecasts and the probability of exceeding sea level thresholds for coastal defenses operations for instance. As such, probabilistic forecasts will be instrumental for early warning systems and to support decision-making based on operational products. Indeed, forecasts leading to a false alarm and closure of mobile surge barriers can disrupt economic activities and cause unnecessary evacuation of inhabitants.
Finally, as coastal downscaling can be needed to resolve fine coastal features, a European Union leverage could be proposed by implementing a co-production of model-derived information between Member States services and Copernicus Services for core users (i.e., those that must implement European Union policies at national and regional level). A series of coastal models operated by EU Member States could be coupled with Copernicus Marine Service models and could be integrated in the Copernicus Marine Service portfolio. This will allow an improved monitoring and forecasting of coastal zones, and will support and advance knowledge of the coastal environment and associated economies (including coastal management and storm surge forecasts). A co-designed cloud environment and tools could be setup with Member States for the co-production of these coastal models.
EU Coastal Flood Awareness System
Preparedness towards natural hazards through the development and implementation of early warning systems is a key factor in the reduction of their societal impact. Specifically, continental scale forecasting systems, such as the European Flood Awareness System of CEMS (Smith et al., 2016) for rivers, can complement national systems through the provision of harmonized, trans-boundary, probabilistic and medium-range forecast information.
Efforts are currently ongoing to develop a European coastal flood awareness system capitalizing on the product portfolio of CEMS, CMEMS and CLMS and making use of recent developments in hydrodynamic models. For instance, the recently launched H2020 Copernicus Evolution project ECFAS (European Coastal Flood Awareness System) aims at providing a “Proof of Concept” to demonstrate the practical feasibility of implementing such a pan-European system. ECFAS will also develop innovative solutions for providing rapid mapping of forecasted flooding and will benefit from the integration of space research with other non-space domains, like oceanographic modeling and coastal risk assessment. In addition, efforts are on-going to prove the feasibility for providing high-resolution forecasting of the near-shore storm surge based on CEMS, CMEMS and CLMS products and large-scale hydrodynamic simulations using different models and configurations. The final product should deliver an open source, portable, reproducible and expandable framework that can be utilized from local to global scale in a consistent way. Furthermore, it can be expanded to include inundation analysis, thus providing a complete impact analysis in support of adaptation policies. It is envisioned that coupling this system to hydrological models (Ye et al., 2020) could lead to a holistic overview of the flood risk in a dynamic and compound mode, complimenting and supporting systems based on monitoring.
Continuous Monitoring of Coastal Floods
The monitoring of coastal flooding based on a user activation and for a specific area is already possible as part of the service portfolio of CEMS (section “Managing and Monitoring of Coastal Floods and Risks”). However, state-of-the-art, scientific methods for automatically detecting and identifying flood events, based on a global, continuous supply of all-weather, day-and-night satellite images, such as those provided by the Sentinel-1 satellites are now mature and ready for operational implementation (Matgen et al., 2020). This would allow a continuous, fully automatic monitoring of coastal flooding without the activation by a user or limited to a specific area of interest, hence improving timeliness and coverage of the product.
Within CEMS the set-up of such a systematic global flood monitoring product that will immediately process and analyze all incoming Sentinel-1 Interferometric Wide Swath data, is currently ongoing (Salamon et al., 2021). While in traditional flood mapping efforts focused on deriving information from a limited number of available images and potentially an image where no flooding is visible for comparison or thresholding purposes, the flood mapping algorithms used for the new global flood monitoring product will make use of the data cube approach which offers a number of key benefits. A data cube provides fast access to S-1 time series, which supports the implementation of algorithms that require data-driven model training. Furthermore, by providing access to the historic data record, which for S-1 reaches back to 2014, it allows for placing the flood situation in its historical and geographical context. Based on the features of S-1 and the algorithm set up, it is foreseen that the global flood monitoring product will have a timeliness of < 8 h between image acquisition and product availability and a revisit frequency of approx. 1-3 days for Europe and 3-14 days for the rest of the world.
Long-Term Sea-Level Changes: Reanalyses and Climate Projections
At Global Scale
C3S has distributed CMIP5 and CMIP6 outputs, including dynamic sea level and atmospheric variables. Other sea level variables, for example the sterodynamic sea level which adds the global mean thermal expansion to the dynamic sea level change (i.e., zos + zostoga, Gregory et al., 2019, directly simulated by climate models), could be included in the future if there are clear and strong user community requests. Prioritizing these additional sea level variables will be defined during future climate projection workshops organized by C3S.
During the first phase of the program (2015-2021) C3S developed a demonstration project on coastal inundation in the North Sea as part of its Sectoral Information System (SIS). For the next phase of Copernicus (2021-2027) C3S is investigating the possibility of defining a traceable Toolbox application able to calculate projections of total regional sea-level by combining the fields available on from all relevant Copernicus services.
At Regional Scale
Ocean reanalyses (global ocean and European regional seas, see also section “Sea Level Observations”) could be extended further back in time in the 20th century to better assess and monitor the long-term evolution of the ocean state, including sea-level changes, notably in response to climate change. Historical in situ observations would be assimilated (e.g., sea surface temperature and tide gauges mainly for the first half of the century and temperature and salinity profiles from 1950 onwards).
Future climate change information is increasingly needed for mitigation and adaptation to climate change, including SLR adverse effects. Current climate change oceanic projections, as provided by C3S, are global and rely on the information derived from global climate models. However, relevant core information is needed at regional to local scales to support decision-making for SLR adaptation.
CMEMS envisions to develop a new line of regionally downscaled, refined projections of the ocean state from global projections (C3S) (e.g., Adloff et al., 2018; Hermans et al., 2020; Meier et al., 2021) to translate and refine global projections at scales fitting more decision making. Regional downscaling will be developed by leveraging on regional ocean and wave modeling systems operated in the Copernicus Marine Service to overcome limitations of global climate models (e.g., coarse resolution, missing representation of important physical processes, e.g., tides, waves etc.).
Attribution of Extreme Events
Changes in SL at any scale are driven by a range of natural and anthropogenic forcings. While GMSLR and its major components (global mean thermal expansion and glaciers mass loss) over the last decades have been attributed to climate change (e.g., Marzeion et al., 2014; Slangen et al., 2014b, Slangen et al., 2016; Nerem and Fasullo, 2019), the climate signal in regional SLR and associated extremes is often not distinguishable from the climate variability noise (e.g., Richter et al., 2020). Depending on the location, the anthropogenic forced signal is expected to be discernible from natural variability induced signals at different times throughout the 21st century (Lyu et al., 2014; Richter et al., 2017).
Changes in extreme SL (increase in their amplitude or decrease of their return period) are mostly driven by changes in mean SL rather than by changes in storminess (e.g., Menendez and Woodworth, 2010; Vousdoukas et al., 2017, 2018b). Projected changes in SL extremes and their amplification have been the focus of several studies, highlighting that due to mean SLR, extreme sea level events that have historically been rare, such as historical 100-year extreme sea levels, will become common at the end of the century posing more and more threats to coastal communities (e.g., Vousdoukas et al., 2018a; Oppenheimer et al., 2019).
The attribution of specific events to anthropogenic climate change is still in its infancy and in 2016, the National Academy of Sciences published a review on the capabilities of event-attribution, listing extreme cold and extreme heat events as those being more mature. There is an ever-growing body of literature (e.g., see the annual BAMS special issue since 2011 on ‘Explaining Extreme Events from a Climate Perspective’17, e.g., Herring et al., 2021), focusing mainly on weather-related events. Sweet et al. (2013) discussed the implications of SLR on the extreme water levels reached during hurricane Sandy in 2012. During the first phase of the Copernicus Programme (2015-2021) C3S funded a climate attribution activity. This focused primarily on the development of a protocol to initiate an attribution study after an extreme weather event and then put the event in the context of climate change to characterize how much of a role climate change could have played in altering the probability of occurrence of the event.
C3S intends to continue and if possible, extend the current activities on climate attribution. The focus will be at first on maintaining up-to-date a catalog focusing on a variety of meteo-climatic extreme events for which the science of attribution is the most mature. The future ambition would be to have an on-demand activation of a full attribution study for some of the most impactful of these events, with the types of events covered increasing as the science matures.
Exposure Mapping
Coastal Defense Structures
Coastal defense structures can be absolutely essential for protecting human infrastructure and activities. For instance, without such structures large parts of the Netherlands would be permanently submerged or threatened by flood events as about a third of the Netherlands is located below sea level. Recently, Lowe et al. (2021) found that considering a sea level rise ranging from 0.3 to 2.0 m by 2100, it is economically efficient to protect 13% of the global coastline (which encompasses 90% of the global flood plain population). In Europe, elevating dykes in an economically efficient way along the 24-32% of the coastline would allow to avoid at least 83% of flood damages, with a benefit to cost ratio of such an investment ranging from 7 to 15 depending on climate change and socio-economic scenarios (Vousdoukas et al., 2020b).
The exact knowledge about the type and location of coastal defenses structures is an essential input for flood modeling. Due to their mostly narrow (less than 10 m) shape coastal defense structures are not sufficiently addressed by the CZ LC/LU product due to its minimum mapping unit of 10 m. For this reason, CLMS plans among the upcoming activities to add a dedicated product for mapping of coastal defense structures across Europe’s coasts.
Human Population Maps
Mapping the distribution of the human population is fundamental to measure the degree of urbanization at the coast, the population that is exposed to future SLR or to better manage the risk of coastal storm surges (see also section “long-term sea level changes”). The availability of Sentinel-1 and 2 data with high frequency of revisit and systematic global coverage provides the opportunity to produce human settlement maps at an unprecedented level (e.g., Corbane et al., 2017).
As part of the evolution of CEMS and in coordination especially with CLMS but also with other relevant Copernicus services, the provision of highly accurate geospatial information about the status of human settlements and their dynamics is foreseen, both in terms of built-up areas and population at the global level. The methodology to derive these products is based on the Global Human Settlement Layer (Pesaresi et al., 2016) and will maximize the use of Copernicus missions (Sentinel-1 and Sentinel-2) in conjunction with in-situ population data (census data).
Discussion
The European Union’s Earth Observation Programme, Copernicus, monitors various aspects of SLR-induced risk. Four of the six Copernicus Services, distributed across the land, marine environment, climate change and emergency management, provide core information on various components of SLR risk that could guide adaptation. A review of the current status of the Copernicus services regarding SLR adaptation has been presented. The comprehensive, operational, timely, quality-assessed, authoritative, reliable, free and open information delivered by Copernicus Services can also be used by other, more downstream climate services to better inform decision-making and adaptation measures.
In the coming years, as the Copernicus Programme unfolds its second phase (2021-2027), several evolutions could be implemented by the services, pending on funding. Such evolutions would provide relevant information for risk assessment. This could include an improved characterization of coastal zone’s environmental states, including of dynamic phenomena, and exposure to SLR, upgraded sea level forecasts and better characterized uncertainties, implementation of an EU early warning system for coastal flooding. Precursor activities, such as on-going and planned European projects, could also contribute to the long-term evolution of Copernicus services with regard to SLR adaptation. Examples of such projects are the H2020 ECFAS (European Coastal Flood Awareness System) and CoCliCo (Core Climate Coastal Services, a project to start in 09/2021 and addressing coastal zones and infrastructures at risk from SLR during the 21st century) projects.
Users and policy needs are also driving Copernicus Services evolutions. While this review mostly focused on products, information and services provided to users with regard to SLR adaptation, activities to strengthen interactions between the services and their users are foreseen in the coming years. For instance, interactions between CMEMS and EU Member States will be deepened. A National Marine Stakeholders Group is to be setup to allow specific and direct discussions between Member States and the Entrusted Entity for the Marine Service. This will contribute to a better integration of the CMEMS with Member States expectations and assets, which is of particular importance in the context of the co-design of products and services and for implementing actions with Member States in the coastal marine areas.
A strong cooperation between Copernicus Services is essential to address the broad and diverse range of requirements to inform and support SLR and related adaptation in coastal zones. During Copernicus 1 (2014-2021), workshops and consultation meetings were organized to analyze priorities for the evolution of the Copernicus Services (CMEMS and CLMS) to better address coastal user needs. A corresponding roadmap for the evolution of CMEMS and CLMS was delivered to the EC (Copernicus Coastal Roadmap, 2018). Furthermore, discussions were engaged with C3S and CEMS for coordinated developments addressing the coastal zone.
In the coming years, a strengthening of interfaces, cooperation and co-production between the services is foreseen and will allow to maximize the added-value of the Copernicus Programme. This could be exemplified by the development (pending on the EC authorization) of a Copernicus Thematic Hub (CTH) on coastal zone during Copernicus 2 (2021-2027). Such a coastal CTH would provide an integrated catalog of products for coastal zones, an easier user journey with a simplified access to key information on coastal zones under a single-entry point, and with a central service desk to provide guidance and support to users. The coastal CTH would gather and maintain the products and information generated on coastal zones by several Copernicus Services, also including access to Sentinel data with different levels of processing (L2 to L4) and to other relevant information providers (e.g., EMODnet). New products will also be discussed, proposed and produced either within a given Copernicus service, or through collaborations between services. By essence, coastal zones represent a thematic area where the synergy from multiple Copernicus core services has the potential to contribute to the converging interests of various stakeholders and of a diversity of users and policy makers. If implemented, a coastal CTH will allow Copernicus to address a range of policy aspects, which can hardly be addressed by a single Copernicus service.
Author Contributions
AM initiated and coordinated the review and wrote the first draft of the manuscript. CB, MM, PS, GB, SB, JN, LS, and FV contributed to the writing of sections of the manuscript. All authors contributed to manuscript revision, read, and approved the submitted version.
Funding
The ECFAS project has received funding from the European Union’s Horizon 2020 program under Grant Agreement No 101004211. The CoCliCo project will receive funding from the European Union’s Horizon 2020 program under Grant Agreement No 101003598.
Conflict of Interest
The authors declare that the research was conducted in the absence of any commercial or financial relationships that could be construed as a potential conflict of interest.
Publisher’s Note
All claims expressed in this article are solely those of the authors and do not necessarily represent those of their affiliated organizations, or those of the publisher, the editors and the reviewers. Any product that may be evaluated in this article, or claim that may be made by its manufacturer, is not guaranteed or endorsed by the publisher.
Acknowledgments
The authors thank the organizers of the WCRP workshop on Regional sea level rise and coastal risks (Orléans, November 2019) which led to this Special Issue and to this contribution. The authors also thank all Copernicus Services producers, contractors, and management teams. A special thank goes to Karina von Schuckmann for comments on the manuscript.
Footnotes
- ^ https://eur-lex.europa.eu/legal-content/EN/TXT/?uri=COM:2021:82:FIN
- ^ https://marine.copernicus.eu/
- ^ https://land.copernicus.eu/
- ^ https://climate.copernicus.eu/
- ^ https://emergency.copernicus.eu/
- ^ https://cds.climate.copernicus.eu/cdsapp#!/dataset/projections-cmip5-monthly-single-levels?tab=overview
- ^ https://spacedata.copernicus.eu/documents/20126/0/GEO1988-CopernicusDEM-SPE-002_ProductHandbook_I1.00.pdf
- ^ https://spacedata.copernicus.eu/documents/20126/0/DAP+Release+phase2+V2_8.pdf/cb6b98a9-5d3b-dbc5-956d-e7f633cd6489?t=1615826769517
- ^ https://land.copernicus.eu/pan-european/corine-land-cover
- ^ https://land.copernicus.eu/user-corner/technical-library/clc2018technicalguidelines_final.pdf
- ^ https://land.copernicus.eu/local/coastal-zones/resolveuid/58beba1d87d24b2aa9e2b5a9f6b5541b
- ^ https://land.copernicus.eu/imagery-in-situ/eu-hydro
- ^ https://land.copernicus.eu/local/riparian-zones
- ^ https://eur-lex.europa.eu/legal-content/EN/TXT/?uri=COM:2021:82:FIN
- ^ https://cds.climate.copernicus.eu/cdsapp#!/dataset/sis-water-level-change-indicators?tab=overview
- ^ https://land.copernicus.eu/pan-european/european-ground-motion-service
- ^ https://www.ametsoc.org/index.cfm/ams/publications/bulletin-of-the-american-meteorological-society-bams/explaining-extreme-events-from-a-climate-perspective/
References
Ablain, M., Jugier, R., Zawadki, L., and Taburet, N. (2020). The TOPEX-A Drift and Impacts on GMSL Time Series (poster), Ocean Surface Topography Science Team Meeting, 2017. Available online at: https://meetings.aviso. altimetry.fr/fileadmin/user_upload/tx_ausyclsseminar/files/Poster_OSTST17 _GMSL_Drift_TOPEX-A.pdf (accessed January 16, 2020)
Ablain, M., Meyssignac, B., Zawadzki, L., Jugier, R., Ribes, A., Spada, G., et al. (2019). Uncertainty in satellite estimates of global mean sea-level changes, trend and acceleration. Earth Syst. Sci. Data 11, 1189–1202. doi: 10.5194/essd-11-1189-2019
Abram, N., Gattuso, J. P., Prakash, A., Cheng, L., Chidichimo, M. P., Crate, S., et al. (2019). “Framing and context of the report,” in IPCC Special Report on the Ocean and Cryosphere in a Changing Climate, ed. H.-O. Pörtner (Cambridge: Cambridge University Press).
Adloff, F., Jorda, G., Somot, S., Sevault, F., Arsouze, T., Meyssignac, B., et al. (2018). Improving sea level simulation in Mediterranean regional climate models. Clim. Dyn. 51, 1167–1178. doi: 10.1007/s00382-017-3842-3
Alfieri, L., Salamon, P., Pappenberger, F., Wetterhall, F., and Thielen, J. (2012). Operational early warning systems for water-related hazards in Europe. Environ. Mental Sci. Policy 21, 35–49. doi: 10.1016/j.envsci.2012.01008
Benveniste, J., Cazenave, A., Vignudelli, S., Fenoglio-Marc, L., Shah, R., Almar, R., et al. (2019). Requirements for a coastal hazards observing system. Front. Mar. Sci. 6:348. doi: 10.3389/fmars.2019.00348
Benveniste, J., Mandea, M., Melet, A., and Ferrier, P. (2020). Earth observations for coastal hazards monitoring and international services: a european perspective. Surv. Geophys. 41, 1185–1208. doi: 10.1007/s10712-020-09612-6
Bergsma, E., Conley, D., Davidson, M., O’Hare, T., and Almar, R. (2019). Storm event to seasonal evolution of nearshore bathymetry derived from shore- based video imagery. Remote Sens. 11:519. doi: 10.3390/rs11050519
Bevacqua, E., Maraun, D., Vousdoukas, M. I., Voukouvalas, E., Vrac, M., Mentaschi, L., et al. (2019). Higher probability of compound flooding from precipitation and storm surge in Europe under anthropogenic climate change. Sci. Adv. 5, eaaw5531. doi: 10.1126/sciadv.aaw5531
Bevacqua, E., Vousdoukas, M. I, Zappa, G., Hodges, K., Shepherd, T. G., Ma-raun, D., et al. (2020). More meteorological events that drive compound coastal flooding are projected under climate change. Commun. Earth Environ. 1:47. doi: 10.1038/s43247-020-00044-z
Birol, F., Fuller, N., Lyard, F., Cancet, M., Niño, F., Delebecque, C., et al. (2017). Coastal applications from nadir altimetry: example of the X-TRACK regional products. Adv. Space Res. 59, 936–953. doi: 10.1016/j.asr.2016.11.005
Bisaro, A., de Bel, M., Hinkel, J., Kok, S., Stojanovic, T., and Ware, D. (2020). Multilevel governance of coastal flood risk reduction: a public finance per- spective. Environ. Sci. Policy 112, 203–212. doi: 10.1016/j.envsci.2020.05.018
Brooks, N. (2003). Vulnerability, Risk and Adaptation: A Conceptual Frame- work. Tyndall Centre for Climate Change Research. Norwich: University of East Anglia.
Capet, A., Fernandez, V., She, J., Dabrowski, T., Umgiesser, G., Staneva, J., et al. (2020). Operational modeling capacity in european seas—an eurogoos perspective and recommendations for improvement. Front. Mar. Sci. 7:129. doi: 10.3389/fmars.2020.00129
Cardona, O. D., van Aalst, M. K., Birkmann, J., Fordham, M., McGregor, G., Perez, R., et al. (2012). Managing the Risks of Extreme Events and Disasters to Advance Climate Change Adaptation. A Special Report of Working Groups I and II of the Intergovernmental Panel on Climate Change (IPCC). Cambridge: Cambridge University Press, 65–108.
Castelle, B., Masselink, G., Scott, T., Stokes, C., Konstantinou, A., Marieu, V., et al. (2021). Satellite-derived shoreline detection at a high- energy meso-macrotidal beach. Geomorphology 383:107707. doi: 10.1016/j.geomorph.2021.107707
Cavaleri, M., Bajo, F., Barbariol, M., Bastianini, Benetazzo, A., Bertotti, L., et al. (2020). The 2019 flooding of venice and its implications for future predictions. Oceanography 33, 42–49. doi: 10.5670/oceanog.2020.105
Cazenave, A., and Le Cozannet, G. (2014). Sea level rise and its coastal impacts. Earths Future 2, 15–34.
Cipollini, P., Calafat, F. M., Jevrejeva, S., Melet, A., and Prandi, P. (2017). Monitoring sea level in the coastal zone with satellite altimetry and tide gauges. Surv. Geophys. 38, 33–57. doi: 10.1007/s10712-016-9392-0
Copernicus Coastal Roadmap (2018). Mercator Ocean International and European Environmental Agency, 2018, Roadmap for the Evolution of Copernicus Marine and Land Services to Better Serve Coastal Users.
Copernicus Dem Product Handbook (2020). Copernicus Digital Elevation Model Product Handbook, v2.1; Airbus Defence and Space GmbH, 2020. Available online at: https://spacedata.copernicus.eu/documents/20126/0/GEO1988-CopernicusDEM-SPE-002_ProductHandbook_I1.00.pdf/082dd479-f908-bf42-51bf-4c0053129f7c?t=1586526993604
Corbane, C., Pesaresi, M., Politis, P., Syrris, V., Florczyk, A. J., Soille, P., et al. (2017). Big earth data analytics on Sentinel-1 and Landsat imagery in support to global human settlements mapping. Big Earth Data 1, 118–144. doi: 10.1080/20964471.2017.1397899
Crosetto, M., Solari, L., Mroz, M., Balasis-Levinsen, J., Casagli, N., Frei, M., et al. (2020). The evolution of wide-area DInSAR: from regional and national services to the european ground motion service. Remote Sens. 12:2043. doi: 10.3390/rs12122043
Dangendorf, S., Marcos, M., Wöppelmann, G., Conrad, C. P., Frederikse, T., and Riva, R. (2017). Reassessment of 20th century global mean sea level rise. Proc. Natl. Acad. Sci.U.S.A. 114, 5946–5951. doi: 10.1073/pnas.1616007114
De Alfonso, M., Garcia-Valdecasas, J. M., Aznar, R., Perez-Gomez, B., Rodriguez, P., de los Santos, F. J., et al. (2020). Record wave storm in the Gulf of Cadiz over the past 20 years and its impact on harbours. In: copernicus marine service ocean state report, issue 4. J. Operat. Oceanogr. 13, S137–S144.
Dodet, G., Melet, A., Ardhuin, F., Bertin, X., Idier, D., and Almar, R. (2019). The contribution of wind-generated waves to coastal sea-level changes. Surv. Geophys. 40, 1563–1601. doi: 10.1007/s10712-019-09557-5
Alvarez Fanjul, E., Pascual Collar, A., P ìerez G ìomez, B., De Alfonso, M., Garcia Sotillo, M., Staneva, J., et al. (2019). Copernicus Marine Service Ocean State Report, Issue 3. Journal Of Operational Oceanography, Vol. 12. Washington, D.C: NOAA, S1–S123.
European State of the Climate (ESOTC) (2019). Copernicus Climate Change Service, Full Report. Available online at: https://climate.copernicus.eu/ESOTC/2019/about-european-state-climate-2019
Farrell, W. E., and Clark, J. A. (1976). On Postglacial Sea Level. Geo phys. J. R. Astron. Soc. 46, 647–667. doi: 10.1111/j.1365-246X.1976.tb01252.x
Fernandez-Montblanc, T., Gomez-Enri, J., and Ciavola, P. (2020). The role of mean sea level annual cycle on extreme water levels along european coastline. Remote Sens. 12:3419. doi: 10.3390/rs12203419
Ferrario, F., Beck, M. W., Storlazzi, C. D., Micheli, F., Shepard, C. C., and Airoldi, L. (2014). The effectiveness of coral reefs for coastal hazard risk reduction and adaptation. Nat. Commun. 5:3794. doi: 10.1038/ncomms4794
Forget, G., and Ponte, R. M. (2015). The partition of regional sea level variability. Progr. Oceanogr. 137, 173–195. doi: 10.1016/j.pocean.2015.06.002
Gesch, D. B. (2018). Best practices for elevation-based assessments of sea- level rise and coastal flooding exposure. Front. Earth Sci. 6:230. doi: 10.3389/feart.2018.00230
Gregory, J. M., Griffies, S. M., Hughes, C. W., Lowe, J. A., Church, J. A., Fukimori, I., et al. (2019). Concepts and terminology for sea level: mean, variability and change, both local and global. Surv. Geophys. 40, 1251–1289. doi: 10.1007/s10712-019-09525-z
Hallegatte, S., Green, C., Nicholls, R. J., and Corfee-Morlot, J. (2013). Future flood losses in major coastal cities. Nat. Clim. Chang. 3, 802–806.
Hamon, M., Greiner, E., Le Traon, P. Y., and Remy, E. (2019). Impact of multiple altimeter data and mean dynamic topography in a global analysis and forecasting system. J. Atmosp. Oceanic Technol. 36, 1255–1266. doi: 10.1175/JTECH-D-18-0236.1
Hanley, M. E., Bouma, T. J., and Mossman, H. L. (2020). The gathering storm: optimizing management of coastal ecosystems in the face of a climate-driven threat. Ann. Bot. 125, 197–212. doi: 10.1093/aob/mcz204
Harley, M. D., Valentini, A., Armaroli, C., Perini, L., Calabrese, L., and Ciavola, P. (2016). Can an early-warning system help minimize the impacts of coastal storms? A case study of the 2012 Halloween storm, northern Italy. Nat. Hazards Earth Syst. Sci. 16, 209–222.
Hermans, T. H. J., Tinker, J., Palmer, M. D., Katsman, C. A., Vermeersen, B. L. A., and Slangen, A. B. A. (2020). Improving sea-level projections on the North- western European shelf using dynamical downscaling. Clim. Dyn. 54, 1987–2011. doi: 10.1007/s00382-019-05104-5
Herring, S. C., Christidis, N., Hoell, A., Hoerling, M. P., and Stott, P. A. (2021). Explaining extreme events of 2019 from a climate perspective. Bull. Am. Meteorol. Soc. 102, S1–S116. doi: 10.1175/BAMS-ExplainingExtremeEvents2019.1
Hersbach, H., Bell, B., Berrisford, P., Hirahara, S., Horìanyi, A., Munþoz-Sabater, J., et al. (2020). The ERA5 global reanalysis. Q. J. R. Meteorol. Soc. 146, 1999–2049. doi: 10.1002/qj.3803
Hinkel, J., Church, J. A., Gregory, J. M., Lambert, E., Le Cozannet, G., Lowe, J., et al. (2019). Meeting user needs for sea level rise information: a decision analysis perspective. Earth’s Future 7, 320–337. doi: 10.1029/2018EF001071
Hinkel, J., Jaeger, C., Nicholls, R. J., Lowe, J., Renn, O., and Peijun, S. (2015). Sea- level rise scenarios and coastal risk management. Nat. Clim. Chang. 5, 188–190. doi: 10.1038/nclimate2505
Hinkel, J., Lincke, D., Vafeidis, A. T., Perrette, M., Nicholls, R. J., Tol, R. S. J., et al. (2014). Coastal flood damage and adaptation costs under 21st century sea-level rise. Proc. Natl. Acad. Sci.U.S.A. 111, 3292–3297. doi: 10.1073/pnas.1222469111
Huizinga, H. J., Moel, H., and Szewczyk, W. (2017). Global Flood Depth-Damage Functions: Methodology and the Database with Guidelines. EUR 28552 Tech- nical Report of the European Commission, Joint Research Centre. Ispra: Joint Research Centre.
Idier, D., Aurouet, A., Bachoc, F., Baills, A., Betancourt, J., Durand, J., et al. (2020). Toward a user-based, robust and fast running method for coastal flooding forecast, early warning, and risk prevention. J. Coastal Res. 95:1111. doi: 10.2112/SI95-216.1
Idier, D., Bertin, X., Thompson, P., and Pickering, M. D. (2019). Interactions between mean sea level, tide, surge, waves and flooding: mechanisms and contributions to sea level variations at the coast. Surv. Geophys. 40, 1603–1630. doi: 10.1007/s10712-019-09549-5
Intergovermental Oceanographic Commission (IOC). (2006). Manual on sea level measurement and interpretation - Volume IV-an update to 2006. Manual and Guides 14. Lausanne: IOC, 88.
Kulp, S. A., and Strauss, B. H. (2019). New elevation data triple estimates of global vulnerability to sea-level rise and coastal flooding. Nat. Commun. 10:4844. doi: 10.1038/s41467-019-12808-z
Lavell, A., Oppenheimer, M., Diop, C., Hess, J., Lempert, R., Li, J., et al. (2012). “Climate change: newdimensions in disaster risk, exposure, vulnerability, and resilience,” in Managing the Risks of Extreme Events and Disasters to Advance Climate Change Adaptation. A Special Report of Working Groups I and II of the Intergovernmental Panel on Climate Change (IPCC), eds C. B. Field, V. Barros, T. F. Stocker, D. Qin, D. J. Dokken, K. L. Ebi, et al. (New York, NY: Cambridge University Press), 25–64.
Le Traon, P. Y., Reppucci, A., Alvarez Fanjul, E., Aouf, L., Behrens, A., Belmonte, M., et al. (2019). From observation to information and users: the copernicus marine service perspective. Front. Mar. Sci. 6:234. doi: 10.3389/fmars.2019.00234
Legeais, J. F., Ablain, M., Zawadzki, L., Zuo, H., Johannessen, J. A., Scharffenberg, M. G., et al. (2018). An improved and homogeneous altimeter sea level record from the ESA climate change initiative. Earth Syst. Sci. Data 10, 281–301. doi: 10.5194/essd-10-281-2018
Legeais, J. F., Llovel, W., Melet, A., and Meyssignac, B. (2020). Evidence of the TOPEX-A altimeter instrumental anomaly and acceleration of the global mean sea level. in: copernicus marine service ocean state report, issue 4. J. Operat. Oceanogr. 13, S77–S82.
Legeais, J.-F., Meyssignac, B., Faugíre, Y., Guerou, A., Ablain, M., Pujol, M.-I., et al. (under review). Copernicus sea level space observations: a basis for developing adaptation strategies to sea level rise. Front. Mar. Sci. (section Coastal Ocean Processes).
Lellouche, J. M., Greiner, E., Bourdallé-Badie, R., Garric, G., Melet, A., Drevillon, M., et al. (2021). The Copernicus global 1/12° oceanic and sea ice GLORYS12 reanalysis. Front. Earth Sci. 9:698876. doi: 10.3389/feart.2021.698876
Lincke, D., and Hinkel, J. (2018). Economically robust protection against 21st century sea-level rise. Glob. Environ. Chang. 51, 67–73.
Lowe, R. J., Cuttler, M. V. W., and Hansen, J. E. (2021). Climatic drivers of extreme sea level events along the coastline of Western Australia. Earth’s Future 9:e2020EF001620.
Luijendijk, A., Hagenaars, G., Ranasinghe, R., Baart, F., Donchyts, G., and Aarninkhof, S. (2018). The state of the World’s beaches. Sci. Rep. 8:6641. doi: 10.1038/s41598-018-24630-6
Lyu, K., Zhang, X., Church, J. A., Slangen, A. B. A., and Hu, J. (2014). Time of emergence for regional sea-level change. Nat. Clim. Chang. 4, 1006–1010.
Marcos, M., Wöppelmann, G., Matthews, A., Ponte, R. M., Birol, F., Ardhuin, F., et al. (2019). Coastal sea level and related fields from existing observing systems. Surv. Geophys. 40, 1293–1317. doi: 10.1007/s10712-019-09513-3
Marzeion, B., Cogley, J. G., Richter, K., and Parkes, D. (2014). Attribution of global glacier mass loss to anthropogenic and natural causes. Science 345, 919–921.
Matgen, P., Martinis, S., Wagner, W., Freeman, V., Zeil, P., and McCormick, N. (2020). Feasibility Assessment Of An Automated, Global, Satellite-Based Flood Monitoring Product for the Copernicus Emergency Management Service. European commission. Joint Research centre. Brussels: European commission.
McMichael, C., Dasgupta, S., Ayeb-Karlsson, S., and Kelman, I. (2020). A review of estimating population exposure to sea-level rise and the relevance for migration. Environ. Res. Lett. 15:123005. doi: 10.1088/1748-9326/abb398
Meier, M. H. E., Dieterich, C., and Gröger, M. (2021). Natural variability is a large source of uncertainty in future projections of hypoxia in the Baltic Sea. Commun. Earth Environ. 2:50. doi: 10.1038/s43247-021-00115-9
Melet, A., Almar, R., Hemer, M., Le Cozannet, G., Meyssignac, B., and Ruggiero, P. (2020b). Contribution of wave setup to projected coastal sea level changes. J. Geophys. Res. Oceans 125:e2020JC016078. doi: 10.1029/2020JC016078
Melet, A., Almar, R., and Meyssignac, B. (2016). What dominates sea level at the coast: a case study for the Gulf of Guinea. Ocean Dyn. 66, 623–636. doi: 10.1007/s10236-016-0942-2
Melet, A., Meyssignac, B., Almar, R., and Le Cozannet, G. (2018). Under- estimated wave contribution to coastal sea-level rise. Nat. Clim. Chang. 8, 234–239. doi: 10.1038/s41558-018-0088-y
Melet, A., Teatini, P., Le Cozannet, G., Jamet, C., Conversi, A., Benveniste, J., et al. (2020a). Earth observations for monitoring marine coastal hazards and their drivers. Surv. Geophys. 41, 1489–1534. doi: 10.1007/s10712-020-09594-5
Menendez, M., and Woodworth, P. L. (2010). Changes in extreme high-water levels based on a quasi-global tide-gauge data set. J. Geophys. Res. 115:C10011.
Mentaschi, L., Vousdoukas, M. I., Pekel, J. F., Voukouvalas, E., and Feyen, L. (2018). Global long-term observations of coastal erosion and accretion. Sci. Rep. 8:12876. doi: 10.1038/s41598-018-30904-w
Mentaschi, L., Vousdoukas, M. I., Voukouvalas, E., Dosio, A., and Feyen, L. (2017). Global changes of extreme coastal wave energy fluxes triggered by intensified teleconnection patterns. Geophys. Res. Lett. 44, 2416–2426. doi: 10.1002/2016GL072488
Meucci, A., Young, I. R., Hemer, M., Kirezci, E., and Ranasinghe, R. (2020). Projected 21st century changes in extreme wind-wave events. Sci. Adv. 6:eaaz7295. doi: 10.1126/sciadv.aaz7295
Meyssignac, B., and Cazenave, A. (2012). Sea level: a review of present-day and recent-past changes and variability. J. Geodyn. 58, 96–109.
Meyssignac, B., Slangen, A. B. A., Melet, A., Church, J. A., Fettweis, X., Marzeion, B., et al. (2017). Evaluating model simulations of twentieth-century sea-level rise Part II: Regional sea-level changes. J. Clim. 30, 8565–8593. doi: 10.1175/JCLI-D-17-0112.1
Mori, N., Shimura, T., Yoshida, K., Mizuta, R., Okada, Y., Fujita, M., et al. (2019). Future changes in extreme storm surges based on mega-ensemble projection using 60-km resolution atmospheric global circulation model. Coastal Eng. J. 61, 295–307. doi: 10.1080/21664250.2019.1586290
Morim, J., Hemer, M., Wang, X. L., Cartwright, N., Trenham, C., Semedo, A., et al. (2019). Robustness and uncertainties in global multivariate wind-wave climate projections. Nat. Clim. Chang. 9, 711–718. doi: 10.1038/s41558-019-0542-5
Morrow, R., Fu, L. L., Ardhuin, F., Benkiran, M., Chapron, B., Cosme, E., et al. (2019). Global observations of fine-scale ocean surface topography with the Surface Water and Ocean Topography (SWOT) mission. Front. Mar. Sci. 6:232. doi: 10.3389/fmars.2019.00232
Muis, S., Apecechea, M. I., Dullaart, J., de Lima Rego, J., Madsen, K. S., Su, J., et al. (2020). A high-resolution global dataset of extreme sea levels, tides, and storm surges, including future projections. Front. Mar. Sci. 7:263. doi: 10.3389/fmars.2020.00263
Nerem, R. S., and Fasullo, J. (2019). “Observations of the rate and acceleration of global mean sea level change,” in Explaining extreme events of 2017 from a climate perspective of Special Supplement to the Bulletin of the American Meteorological Society, Vol. 100, eds S. C. Herring, N. Christidis, A. Hoell, M. P. Hoerling, and P. A. Stott (Washington, D.C: NOAA).
Neumann, B., Vafeidis, A. T., Zimmermann, J., and Nicholls, R. J. (2015). Future coastal population growth and exposure to sea-level rise and coastal flooding – a global assessment. PLoS One 10:e0118571. doi: 10.1371/journal.pone.0118571
Nixon, S. (2015). EU overview of methodologies used in preparation of Flood Hazard and Flood Risk Maps. Brussels: European Commission.
Oliveira, A., Fortunato, A., Rogeiro, J., Teixeira, J., Azevedo, A., Lavaud, L., et al. (2020). OPENCoastS: an open-access service for the automatic generation of coastal forecast systems. Environ. Model. Softw. 124:104585. doi: 10.1016/j.envsoft.2019.104585
Oppenheimer, M., Glavovic, B., Hinkel, J., van de Wal, R. S. W., Magnan, A., Abd-Elgawad, A., et al. (2019). “Sea level rise and implications for low lying islands, coasts and communities,” in IPCC Special Report on the Ocean and Cryosphere in a Changing Climate, eds H.-O. Pörtner et al. (Cambridge: Cambridge University Press).
Word Meteorological Organization (WMO) (2020). State of the Global Climate 2019 (WMO- No. 1248). Geneva: WMO.
Word Meteorological Organization (WMO) (2021). State of the Global Climate 2020 (WMO- No. 1624). Geneva: WMO.
Orton, P., Vinogradov, S. V., Georgas, S., Blumberg, N., Lin, N., Gornitz, V., et al. (2015). “Dynamic coastal flood modeling,” in Building the Knowledge Base for Climate Resiliency: New York City Panel on Climate Change 2015 Report, eds C. Rosenzweig and W. Solecki (New York: Annals of the New York academy of sciences), 56–66.
Pardo-Pascual, J., Sanchez-Garcia, E., Almonacid-Caballer, J., Palomar-Vazquez, J., Priego de los Santos, E., Fernandez-Sarria, A., et al. (2018). Assessing the accuracy of automatically extracted shorelines on microtidal beaches from landsat 7, landsat 8 and sentinel-2 imagery. Remote Sens. 10:326. doi: 10.3390/rs10020326
Peltier, W. (2004). Global glacial isostasy and the sur- face of the ice-age earth: the Ice-5G (VM2) model and grace. Ann. Rev. Earth Planet. Sci. 32, 111–149. doi: 10.1146/annurev.earth.32.082503.144359
Pesaresi, M., Ehrlich, D., Ferri, S., Florczyk, A. J., Carneiro Freire, S., Halkia, S., et al. (2016). Operating Procedure For The Production Of The Global Human Settlement Layer From Landsat data of the epochs 1975, 1990, 2000, and 2014. European Commission. Joint Research Centre. Brussels: European Commission.
Ponte, R. M., Carson, M., Cirano, M., Domingues, C. M., Jevrejeva, S., Mar-cos, M., et al. (2019). Towards comprehensive observing and modeling systems for monitoring and predicting regional to coastal sea level. Front. Mar. Sci. 6:437. doi: 10.3389/fmars.2019.00437
Prandi, P., Meyssignac, B., Ablain, M., Spada, G., Ribes, A., and Benveniste, J. (2021). Local sea level trends, accelerations and uncertainties over 1993–2019. Sci. Data 8:1. doi: 10.1038/s41597-020-00786-7
Richter, K., Marzeion, B., and Riva, R. (2017). The effect of spatial averaging and glacier melt on detecting a forced signal in regional sea level. Environ. Res. Lett. 12:034004.
Richter, K., Meyssignac, B., Slangen, A. B., Melet, A., Church, J. A., Fettweis, X., et al. (2020). Detecting a forced signal in satellite- era sea-level change. Environ. Res. Lett. 15:094079. doi: 10.1088/1748-9326/ab986e
Riva, R. E. M., Bamber, J. L., Lavallée, D. A., and Wouters, B. (2010). Sea-level fin- gerprint of continental water and ice mass change from GRACE: grace SEA-LEVEL FINGERPRINT. Environ. Res. Lett. 37:L044770. doi: 10.1029/2010GL044770
Rogelj, J., Shindell, D., Jiang, K., Fifita, S., Forster, P., Ginzburg, V., et al. (2018). “Mitigation pathways compatible with 1.5°c in the context of sustainable development,” in Global Warming of 1.5°C. An IPCC Special Report On The Impacts Of Global Warming Of 1.5°C Above Pre-Industrial Levels And Related Global Greenhouse Gas Emission Pathways, In The Context Of Strengthening The Global Response To The Threat Of Climate Change, Sustainable Development, And Efforts To Eradicate Poverty, eds V. Masson-Delmotte, P. Zhai, H. O. Pörtner, D. Roberts, J. Skea, R. Pidcock, et al. (Cambridge: Cambridge University Press).
Ryan, J. C., Smith, L. C., van As, D., Cooley, S. W., Cooper, M. G., Pitcher, L. H., et al. (2019). Greenland Ice Sheet surface melt amplified by snowline migration and bare ice exposure. Sci. Adv. 5:eaav3738. doi: 10.1126/sciadv.aav3738
Salamon, P., McCormick, N., Reimer, C., Clarke, T., Bauer-Marschallinger, B., Wagner, W. et al. (2021). “The new, systematic global flood monitoring product of the copernicus emergency management service,” in International Geoscience and Remote Sensing Symposium.
Sasgen, I., Wouters, B., Gardner, A. S., King, M. D., Tedesco, M., Landerer, F. W., et al. (2020). Return to rapid ice loss in greenland and record loss in 2019 detected by the GRACE-FO satellites. Commun. Earth Environ 1:8. doi: 10.1038/s43247-020-0010-1
von Schuckmann, K., Le Traon, P. Y., Alvarez-Fanjul, E., Axell, L., Balmaseda, M., Breivik, L. A., et al. (2016). The copernicus marine environment monitoring service ocean state report. J. Operat. Oceanogr. 9, S235–S320. doi: 10.1080/1755876X.2016.1273446
von Schuckmann, K., Le Traon, P. Y., Smith, N., Pascual, A., Brasseur, P., Fennel, K., et al. (2018). Copernicus marine service ocean state report, issue 2. J. Operat. Oceanogr. 11, S1–S142. doi: 10.1080/1755876X.2018.1489208
von Schuckmann, K., Le Traon, P. Y., Smith, N., Pascual, A., Djavidnia, S., Gattuso, J. P., et al. (2019). Copernicus marine service ocean state report, issue 3. J. Operat. Oceanogr. 12, S1–S123. doi: 10.1080/1755876X.2019.1633075
von Schuckmann, K., Le Traon, P. Y., Smith, N., Pascual, A., Djavidnia, S., Gattuso, J. P., et al. (2020). Copernicus marine service ocean state report, issue 4. J. Operat. Oceanogr. 13, S1–S172. doi: 10.1080/1755876X.2020.1785097
Slangen, A. B. A., Carson, M., Katsman, C. A., van de Wal, R. S. W., Kohl, A., Vermeersen, L. L. A., et al. (2014a). Projecting twenty-first century regional sea-level changes. Clim. Chang. 124, 317–332.
Slangen, A. B. A., Church, J. A., Zhang, X., and Monselesan, D. (2014b). Detection and attribution of global mean thermosteric sea level change. Geo phys. Res. Lett. 41, 5951–5959. doi: 10.1002/2014GL061356
Slangen, A. B. A., Church, J. A., Agosta, C., Fettweis, X., Marzeion, B., and Richter, K. (2016). Anthropogenic forcing dominates global mean sea-level rise since 1970. Nat. Clim. Chang. 6, 701–705. doi: 10.1038/nclimate2991
Slangen, A. B. A., Meyssignac, B., Agosta, C., Champollion, N., Church, J. A., Fettweis, X., et al. (2017). Evaluating model simulations of twentieth-century sea level rise Part I: Global mean sea level change. J. Clim. 30, 8539–8563. doi: 10.1175/JCLI-D-17-0110.1
Smith, P., Pappenberger, F., Wetterhall, F., Thielen, del Pozo, J., Krzeminski, B., et al. (2016). “Chapter 11 – on the operational implementation of the European Flood Awareness System (EFAS),” in Flood Forecasting, eds T. E. Adams and T. C. Pagano (Boston: Academic Press), 313–348. doi: 10.1016/B978-0-12-801884-2.00011-6
Sotillo, M. G., Cerralbo, P., Lorente, P., Grifoll, M., Espino, M., Sanchez-Arcilla, A., et al. (2020). Coastal ocean forecasting in Spanish ports: the SAMOA operational service. J. Operat. Oceanogr. 13, 37–54. doi: 10.1080/1755876X.2019.1606765
Spada, G., and Melini, D. (2019). On some properties of the glacial isostatic adjustment fingerprints. Water 11:1844. doi: 10.3390/w11091844
Stammer, D., Balmaseda, M., Heimbach, P., Kohl, A., and Weaver, A. (2016). Ocean data assimilation in support of climate applications: status and perspectives. Ann. Rev. Mar. Sci. 8, 491–518. doi: 10.1146/annurev-marine-122414-034113
Stockdon, H. F., Holman, R. A., Howd, P. A., and Sallenger, A. H. (2006). Empirical parameterization of setup, swash, and runup. Coastal Eng. 53, 573–588.
Storto, A., Alvera-Azcarate, A., Balmaseda, M. A., Barth, A., Chevallier, M., Counillon, F., et al. (2019a). Ocean reanalyses: recent advances and unsolved challenges. Front. Mar. Sci. 6:418. doi: 10.3389/fmars.2019.00418
Storto, A., Bonaduce, A., Feng, X., and Yang, C. (2019b). Steric sea level changes from ocean reanalyses at global and regional scales. Water 11:1987. doi: 10.3390/w11101987
Storto, A., Masina, S., Simoncelli, S., Iovino, D., Cipollone, A., Drevillon, M., et al. (2019c). The added value of the multi-system spread information for ocean heat content and steric sea level investigations in the CMEMS GREP ensemble reanalysis product. Clim. Dyn. 53, 287–312. doi: 10.1007/s00382-018-4585-5
Storto, A., Masina, S., Balmaseda, M., Guinehut, S., Xue, Y., Szekely, T., et al. (2017). Steric sea level variability (1993–2010) in an ensemble of ocean reanalyses and objective analyses. Clim. Dyn. 49, 709–729. doi: 10.1007/s00382-015-2554-9
Sweet, W., Zervas, C., Gill, S., and Park, J. (2013). “Hurricane Sandy inundation probabilities today and tomorrow. Bull. Am. Meteorol. Soc. 94, S17–S2.
Taburet, G., Sanchez-Roman, A., Ballarotta, M., Pujol, M. I., Legeais, J. F., Fournier, F., et al. (2019). DUACS DT2018: 25 years of reprocessed sea level altimetry products. Ocean Sci. 15, 1207–1224. doi: 10.5194/os-15-1207-2019
Temmerman, S., Meire, P., Bouma, T. J., Herman, P. M. J., Ysebaert, T., and De Vriend, H. J. (2013). Ecosystem-based coastal defence in the face of global change. Nature 504, 79–83. doi: 10.1038/nature12859
Umgiesser, G., Bajo, M., Ferrarin, C., Cucco, A., Lionello, P., Zanchettin, D., et al. (2020). The prediction of floods in Venice: methods, models and uncer- tainty. Natural Hazards Earth Syst. Sci. Discuss. 2020, 1–47. doi: 10.5194/nhess-2020-361
Vafeidis, A. T., Schuerch, M., Wolff, C., Spencer, T., Merkens, J. L., Hinkel, J., et al. (2019). Water-level attenuation in global-scale assessments of exposure to coastal flooding: a sensitivity analysis. Natural Hazards Earth Syst. Sci. Discuss. 19, 973–984. doi: 10.5194/nhess-19-973-2019
Vos, K., Splinter, K. D., Harley, M. D., Simmons, J. A., and Turner, I. L. (2019). Coast-sat: a google earth engine-enabled python toolkit to extract shorelines from publicly available satellite imagery. Environ. Model. Softw. 122:104528. doi: 10.1016/j.envsoft.2019.104528
Vousdoukas, M. I., Mentaschi, L., Voukouvalas, E., Verlaan, M., Jevrejeva, S., Jackson, L. P., et al. (2018a). Global probabilistic projections of extreme sea levels show intensification of coastal flood hazard. Nat. Commun. 9:2360. doi: 10.1038/s41467-018-04692-w
Vousdoukas, M. I., Ranasinghe, R., Mentaschi, L., Plomaritis, T. A., Athanasiou, P., Luijendijk, A., et al. (2020a). Sandy coastlines under threat of erosion. Nat. Clim. Chang. 10, 260–263. doi: 10.1038/s41558-020-0697-0
Vousdoukas, M. I., Mentaschi, L., Hinkel, J., Ward, P. J., Mongelli, I., Ciscar, J. C., et al. (2020b). Economic motivation for raising coastal flood defenses in Europe. Nat. Commun. 11:2119. doi: 10.1038/s41467-020-15665-3
Vousdoukas, M. I., Mentaschi, L., Voukouvalas, E., Bianchi, A., Dottori, F., and Feyen, L. (2018b). Climatic and socioeconomic controls of future coastal flood risk in Europe. Nat. Clim. Chang. 8, 776–780. doi: 10.1038/s41558-018-0260-4
Vousdoukas, M. I., Mentaschi, L., Voukouvalas, E., Verlaan, M., and Feyen, L. (2017). Extreme sea levels on the rise along Europe’s coasts. Earth’s Future 5, 304–323. doi: 10.1002/2016EF000505
Vousdoukas, M. I., Voukouvalas, E., Mentaschi, L., Dottori, F., Giardino, A., Bouziotas, D., et al. (2016). Developments in large-scale coastal flood hazard mapping. Natural Hazards Earth Syst. Sci. Discuss. 16, 1841–1853. doi: 10.5194/nhess-16-1841-2016
Wahl, T., Jain, S., Bender, J., Meyers, S. D., and Luther, M. E. (2015). Increas- ing risk of compound flooding from storm surge and rainfall for major US cities. Nat. Clim. Chang. 5, 1093–1097. doi: 10.1038/nclimate2736
WCRP Global Sea Level Budget Group. (2018). Global sea-level bud- get 1993–present. Earth Syst. Sci. Data 10, 1551–1590. doi: 10.5194/essd-10-1551-2018
Wolff, C., Nikoletopoulos, T., Hinkel, J., and Vafeidis, A. T. (2020). Future urban development exacerbates coastal exposure in the Mediterranean. Sci. Rep. 10:14420. doi: 10.1038/s41598-020-70928-9
Woodworth, P. L., Hunter, J. R., Marcos, M., Caldwell, P., Menéndez, M., and Haigh, I. (2016). Towards a global higher-frequency sea level dataset. Geoscience Data Journal 3, 50–59. doi: 10.1002/gdj3.42
Woodworth, P. L., Melet, A., Marcos, M., Ray, R. D., Wöppelmann, G., Sasaki, Y. N., et al. (2019). Forcing factors affecting sea level changes at the coast. Surv. Geophys. 40, 1351–1397. doi: 10.1007/s10712-019-09531-1
Wöppelmann, G., and Marcos, M. (2016). Vertical land motion as a key to understanding sea level change and variability: vertical land motion and sea level change. Rev. Geophys. 54, 64–92. doi: 10.1002/2015RG000502
Wöppelmann, G., Marcos, M., Coulomb, A., Martín Míguez, B., Bonnetain, P., Boucher, C., et al. (2014). Rescue of the historical sea level record of Marseille (France) from 1885 to 1988 and its extension back to 1849 1851. J. Geod. 88, 869–885. doi: 10.1007/s00190-014-0728-6
Ye, F., Zhang, Y. J., Yu, H., Sun, W., Moghimi, S., Myers, E., et al. (2020). Simulating storm surge and compound flooding events with a creek-to-ocean model: importance of baroclinic effects. Ocean Model. 145, 101526. doi: 10.1016/j.ocemod.2019.101526
Keywords: sea level rise, Copernicus, climate services, coastal zone, flooding, satellite observations, numerical models
Citation: Melet A, Buontempo C, Mattiuzzi M, Salamon P, Bahurel P, Breyiannis G, Burgess S, Crosnier L, Le Traon P-Y, Mentaschi L, Nicolas J, Solari L, Vamborg F and Voukouvalas E (2021) European Copernicus Services to Inform on Sea-Level Rise Adaptation: Current Status and Perspectives. Front. Mar. Sci. 8:703425. doi: 10.3389/fmars.2021.703425
Received: 30 April 2021; Accepted: 26 July 2021;
Published: 03 September 2021.
Edited by:
Robert James Nicholls, University of East Anglia, United KingdomReviewed by:
Maria Gabriella Gaeta, University of Bologna, ItalyMilena Menna, Istituto Nazionale di Oceanografia e di Geofisica Sperimentale, Italy
Copyright © 2021 Melet, Buontempo, Mattiuzzi, Salamon, Bahurel, Breyiannis, Burgess, Crosnier, Le Traon, Mentaschi, Nicolas, Solari, Vamborg and Voukouvalas. This is an open-access article distributed under the terms of the Creative Commons Attribution License (CC BY). The use, distribution or reproduction in other forums is permitted, provided the original author(s) and the copyright owner(s) are credited and that the original publication in this journal is cited, in accordance with accepted academic practice. No use, distribution or reproduction is permitted which does not comply with these terms.
*Correspondence: Angélique Melet, YW1lbGV0QG1lcmNhdG9yLW9jZWFuLmZy