 Kristina Ø. Kvile1*
 Guri Sogn Andersen1Susanne P. Baden2
 Trine Bekkby1
 Annette Bruhn3,4
 Ole Geertz-Hansen5
 Kasper Hancke1Jørgen L. S. Hansen6
 Dorte Krause-Jensen3,7
 Eli Rinde1Henning Steen8
 Susse Wegeberg6,7
 Hege Gundersen1
- 1Section for Marine Biology, Norwegian Institute for Water Research (NIVA), Oslo, Norway
- 2Department of Biological and Environmental Sciences, University of Gothenburg - Kristineberg, Fiskebäckskil, Sweden
- 3Department of Ecoscience, Aarhus University, Silkeborg, Denmark
- 4Center for Circular Bioeconomy, Aarhus University, Foulum, Denmark
- 5Department of Environment and Minerals, Greenland Institute of Natural Resources, Nuuk, Greenland
- 6Department of Ecoscience, Aarhus University, Roskilde, Denmark
- 7Arctic Research Centre, Aarhus University, Aarhus, Denmark
- 8Institute of Marine Research, His, Norway
Kelp forests are productive coastal ecosystems that provide a range of ecosystem services. Mapping the distribution and area occupied by kelp forests is a critical step to identify their ecosystem functions and services, including their role in the carbon cycle, and to detect changes in their distribution. We compiled quantitative data of the dominant genera Laminaria and Saccharina across the Nordic region, allowing us to separate kelp forests (areas with dense or moderately dense kelp coverage) from occurrences of single or few individuals. By fitting boosted regression trees to the compiled data, we modelled and predicted the distribution of kelp forests across the Nordic region. Despite the large scale of the analyses, the models captured well the kelps’ environmental affinities and predicted the presence of kelp forests with high accuracy. Dense kelp forests are found along the rocky shores of all the Nordic countries, except in the brackish Baltic Sea, with largest areas in Norway, Greenland and Iceland. The results of this study set the scene for future studies on the importance of kelp forests in the Nordic region, including their contribution to the marine carbon budget.
Introduction
Kelps, which are large brown canopy-forming algae in the order Laminariales, dominate subtidal shallow rocky coasts in temperate, sub-polar and polar regions across the globe, except in Antarctica where other orders of large brown algae dominate (Krumhansl et al., 2016; Wernberg et al., 2019). Kelp forests provide three-dimensional habitats that support diverse and productive ecosystems (Wernberg et al., 2019). Moreover, kelp forests provide a range of other ecosystem services, including as nursery and feeding grounds for commercially important fish and invertebrates, coastal protection through wave damping and attenuation, potential source of food and raw materials (e.g., biofuels), as well as facilitating for recreation and tourism (Smale et al., 2013). Since most kelps grow on rocky substrate, carbon burial in local sediments is limited, and kelp forests were not initially considered to contribute as blue carbon sinks (Nellemann et al., 2009; Himes-Cornell et al., 2018). However, kelp forests may contribute significantly to carbon sequestration through the burial of biomass in adjacent sediments, and export of particulate and dissolved carbon into deep water (>1000 m, Krause-Jensen and Duarte, 2016; Krause-Jensen et al., 2018). Although we still have relatively limited understanding of the extent to which macroalgae sequester carbon (Hurd et al., 2022), conservation and restoration of kelp forests may represent nature-based solutions for climate mitigation with a range of additional ecosystem service benefits.
In order to convey the value of kelp forests to policy makers and conduct targeted management, knowledge of their areal distribution is needed. Areal estimates are for example a crucial first step to quantify kelp forests’ contribution to primary production and carbon sequestration. While several studies have mapped the distribution of kelp on local or regional scales (Bekkby et al., 2009; Gorman et al., 2013; Espriella et al., 2019), few attempts have been made to estimate the cover of kelp for larger regions (Raybaud et al., 2013; Jayathilake and Costello, 2020). One important barrier has been the lack of in situ kelp data – and in cases where they exist, this has mostly been in the form of species occurrence data (Araújo et al., 2016). While presence/absence data are useful for making probability models of species distribution, they cannot be used to quantify the amount of kelp and thereby model the distribution of true kelp forests. For this we need quantitative data on density, coverage or similar.
Globally, kelp forests face a multitude of stressors, including climate change (e.g., increased frequency and intensity of heat waves and storms), pollution and eutrophication, harvesting, disturbance from trawling, trophic cascades, and removal of habitat due to coastal development (Rinde et al., 2014; Araújo et al., 2016; Wernberg et al., 2019). Long-term records indicate that kelp forests are on retreat globally, but there is also a great degree of local and regional variation (e.g., Christie et al., 2019b), with some regions experiencing a recovery or increase in the distribution of kelp forests (Krumhansl et al., 2016; Wernberg et al., 2019). For example, increasing trends are suggested in the high Arctic with decreased sea ice cover, based however on relatively few available data series (Filbee-Dexter et al., 2019; Krause-Jensen et al., 2020). As biodiversity and ecosystem services are rapidly declining globally (Díaz et al., 2019), we urgently need baseline data to monitor changes and to understand and mitigate negative impacts on kelp forest distribution.
The Nordic region encompasses Denmark, Sweden, Finland, Norway including Svalbard, Iceland, the Faroe Islands and Greenland, and includes Atlantic, Arctic and brackish Baltic biogeographical regions. The Nordic region has a long history of marine ecological research and strong societal connections to coastal ecosystems (Belgrano et al., 2018), with a coastline estimated to be ~240 000 km long (Sayre et al., 2019). Here, kelp forests are found on shallow (typically <30 m) rocky coast from Greenland and Iceland in the west, along the Norwegian coast, to the Swedish West coast in the east (Dunton and Dayton, 1995). Kelp forests also occur in offshore boulder reefs in e.g., the Kattegat between Denmark and Sweden (Dahl and Dahl, 2002). The kelp species Laminaria hyperborea and Saccharina latissima dominate among the macroalgae in the region in terms of both extent and biomass (Krause-Jensen et al., 2012; Araújo et al., 2016). Although kelp species distribution models have been developed for Norway (Bekkby et al., 2009; Bekkby and Moy, 2011; Gundersen et al., 2021), rough areal estimates are available for Denmark (Öberg, 2006, based on available hard bottom areas for macroalgae), and estimates of suitable habitat exist from Greenland (Krause-Jensen et al., 2020), the areal distribution of kelp forests has until now not been modelled and mapped for the full Nordic region.
Here, we present the first comprehensive distribution modeling study of kelp forests across the Nordic region using compiled data published in the ‘grey literature’ (Frigstad et al., 2021) on densities or coverage, allowing to separate forests from occurrences of single or few individuals. To analyze and predict the distribution of kelp forests based on a large number of potentially interacting environmental variables, we use boosted regression trees (BRT), a method that combines the advantages of machine learning and statistical regression techniques (Elith et al., 2008).
The distribution maps and areal estimates presented in this study provide a baseline to assess large-scale changes in kelp forest distribution in the Nordic region. Moreover, areal estimates are essential to understand the global extent and significance of kelp forests and their associated ecosystem services, including potential for carbon storage and sequestration (Gundersen et al., 2016; Duarte, 2017. Macreadie et al., 2019).
Materials and Methods
Kelp Data
To model the spatial distribution of kelp forests in the Nordic region, we compiled data on species belonging to the genera Laminaria and Saccharina from the Nordic countries (Figure 1). We focused on these two genera exclusively since they are present in all Nordic countries and include the two most common kelp species in the region, Laminaria hyperborea and Saccharina latissima. However, other species are important in parts of the Nordic region (in particular Alaria esculenta and Agarum clathratum in Greenland, e.g., Wegeberg, 2011; Wegeberg, 2013), which may lead to an underestimation of kelp forest cover using this approach.
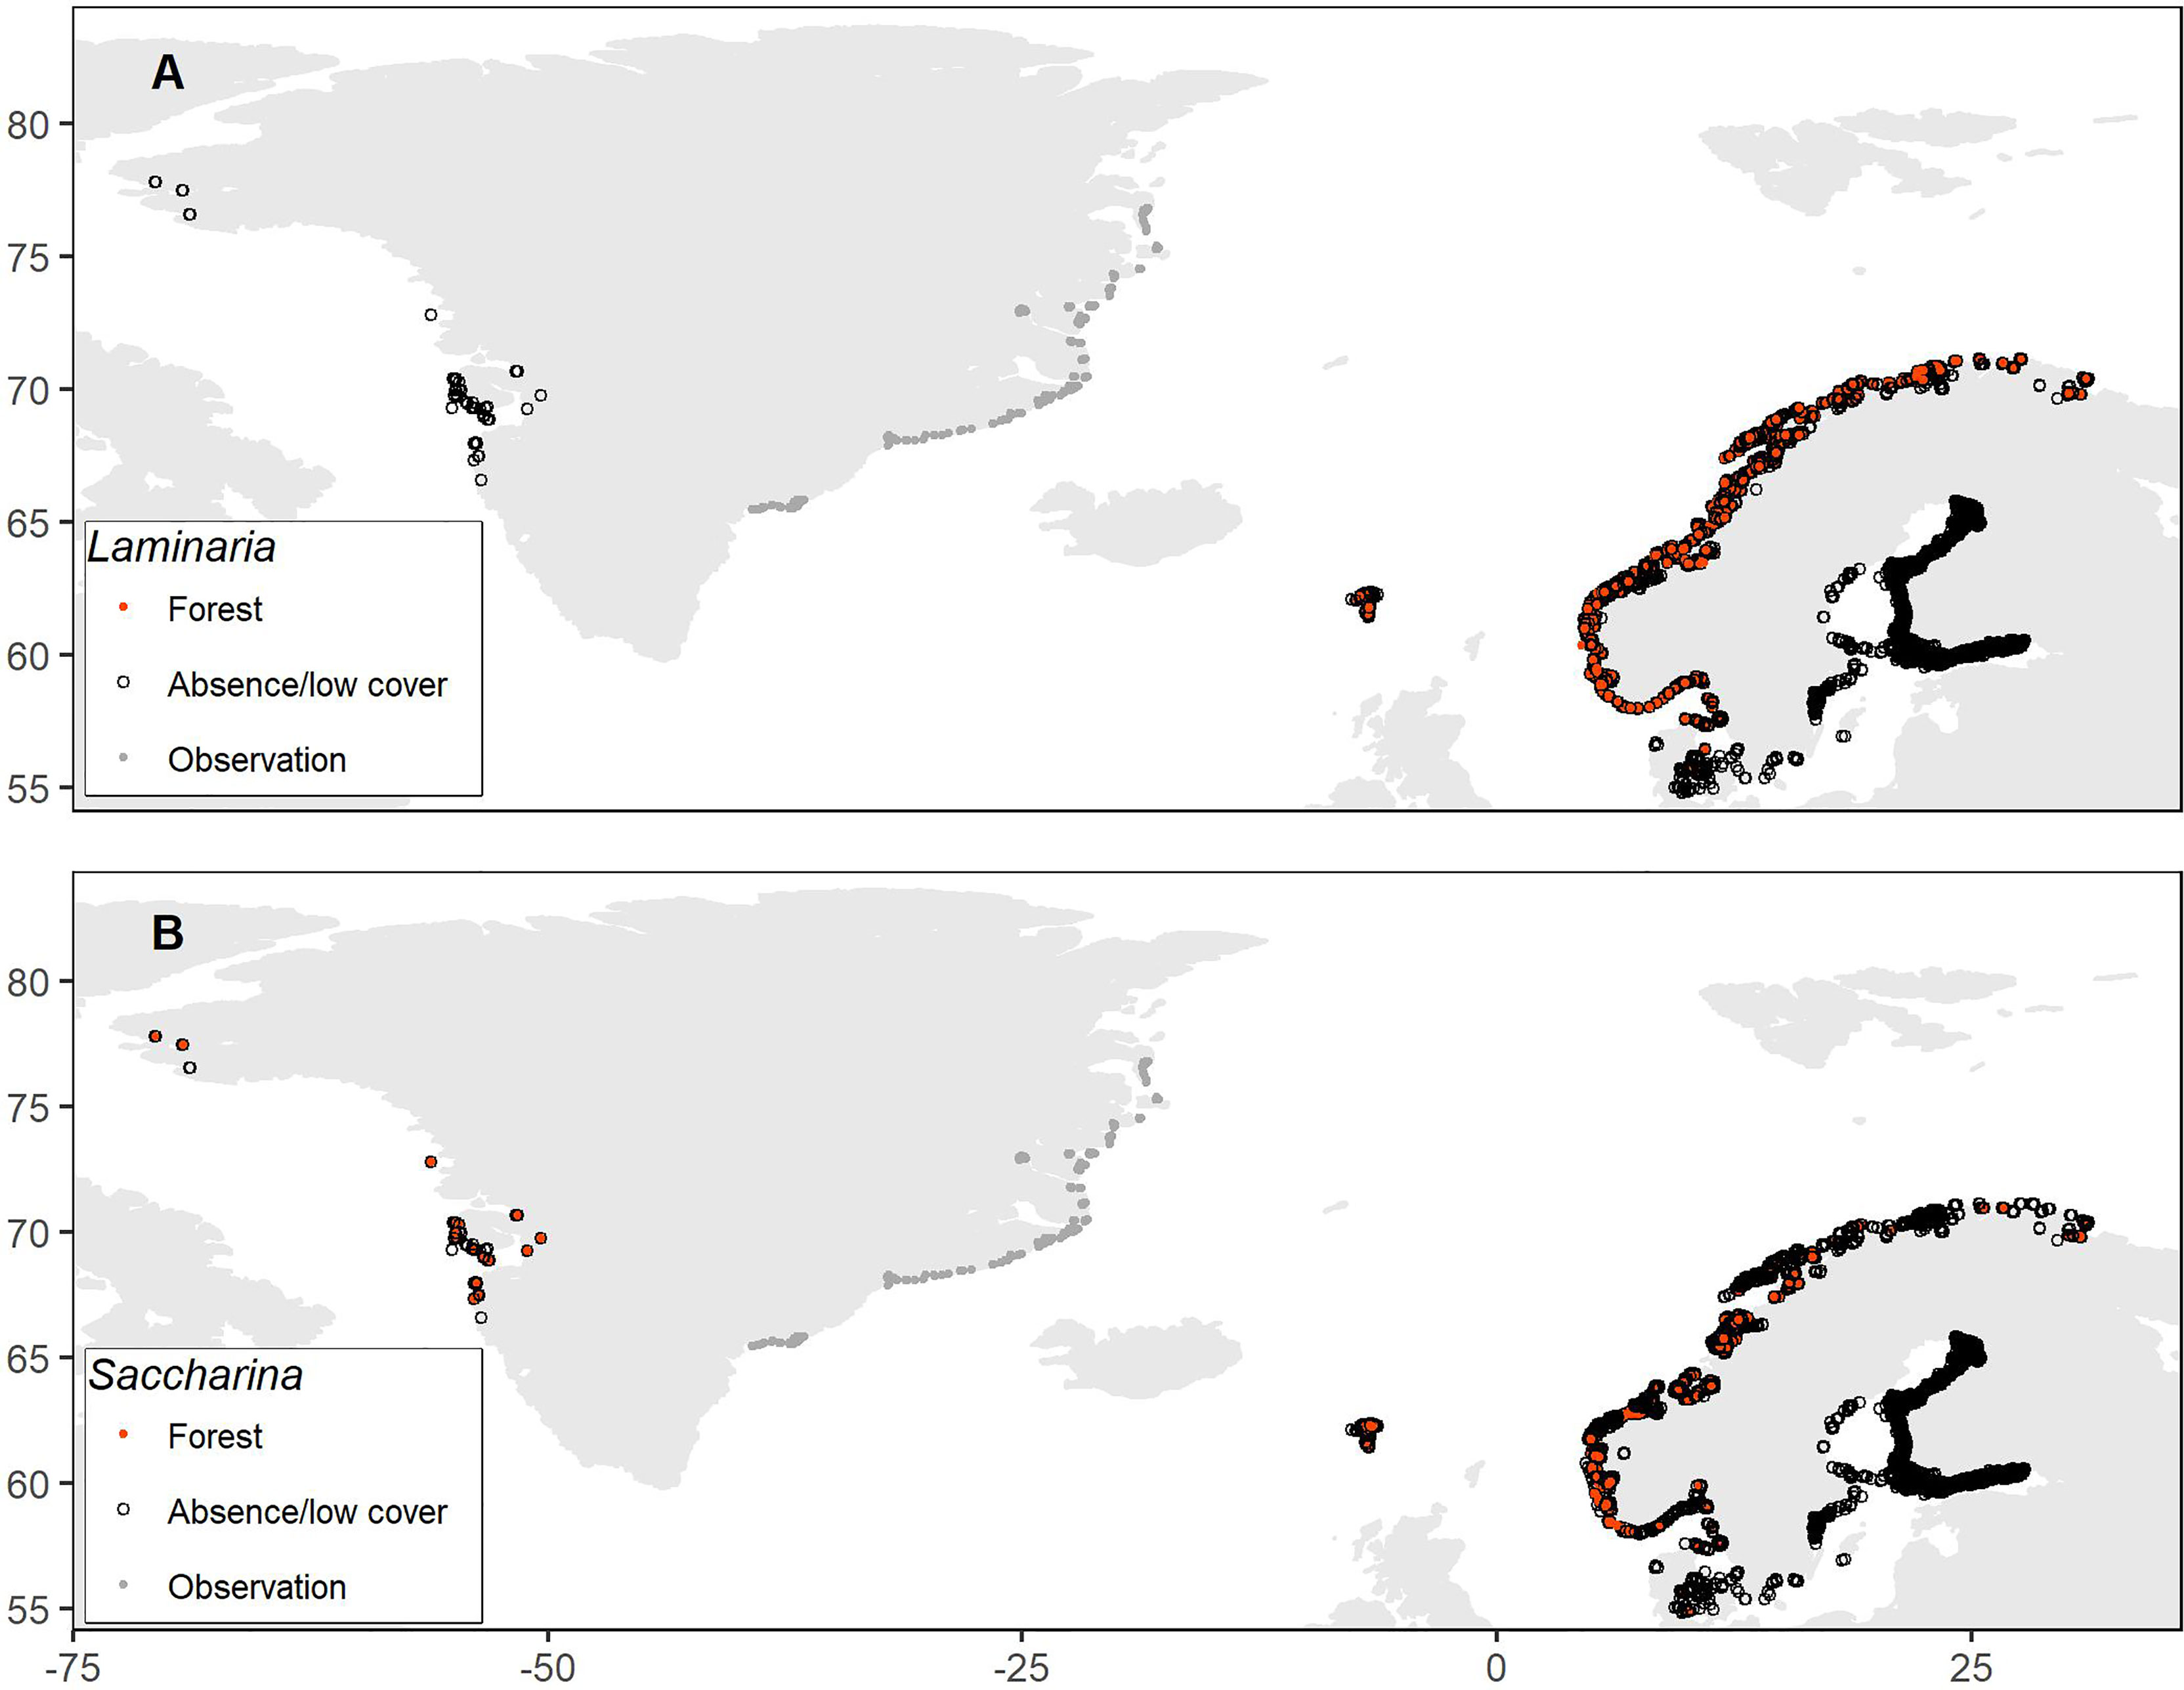
Figure 1 Observed presence or absence of kelp forests (dense or moderately dense forest) of the genera Laminaria (A) and Saccharina (B) across the Nordic region, obtained from quantitative or semi-quantitative data on coverages or densities. For the east coast of Greenland, only the locations of observations are depicted (the original data are unpublished).
We only included quantitative or semi-quantitative data on densities or percent coverage, as non-quantitative occurrence data would not allow us to separate kelp forest with dense or moderately dense coverage from single or few plants. Specifically, we obtained data on Laminaria hyperborea (Norway, Sweden, Denmark, Faroe Islands), L. digitata (Sweden, Denmark, Faroe Islands), L. solidungula (Greenland), Saccharina latissima (Norway, Sweden, Denmark, Faroe Islands, Greenland), S. longicruris (Greenland) and S. nigripes (Greenland), which were combined into two separate datasets for Laminaria spp. (hereafter Laminaria) and Saccharina spp. (hereafter Saccharina), respectively (Figure 1). Since the data originated from different monitoring and research programs, they were sampled using somewhat different methods and quantitative measures. To create unified Nordic datasets, we converted all measures to presence/absence of kelp forest, using threshold values based on expert judgement. Specifically, observations of coverage ≥50% or high densities (dense or moderately dense forest) were considered as presences of kelp forests of these genera. These thresholds are used in the Norwegian national mapping program to identify large contiguous kelp forests (Bekkby et al., 2013). Densities or coverages below the thresholds, including stations with only observations of other species than the ones in focus, were considered as absences. Hence, this will exclude areas with less abundant cover of Laminaria or Saccharina, or with potentially high cover of other macroalgae. We were not able to obtain quantitative observational data from Iceland or Svalbard. Further details about the individual datasets can be found in the Supplementary Material.
Environmental Data
As explanatory variables in the distribution models, we used field-measured depth and relevant environmental variables extracted from large-scale spatial data layers (Figure 2). We coupled kelp observations (Figure 1) to environmental data by extracting values from environmental raster layers cells in which the kelp observations were located. If a kelp observation was outside the cover of a raster layer, or data was missing in that specific cell, the environmental variable was set to missing (NA). We included data on distance to shore (km), bathymetric slope (0°=flat surface, 90°=vertical slope), bathymetric plan and profile curvature, east-west (EW) and north-south (NS) aspect (compass direction, ranging from -1=due west/south to +1=due east/north), sea surface salinity (SSS, psu) and sea surface temperature (SST, °C) from the global MARSPEC ocean layers (with 30 arcseconds spatial resolution, which equals 0.2-1 km in the Nordic region, marspec.org). The geophysical MARSPEC layers were derived from the SRTM30_PLUS high resolution (1 km) bathymetry, and the climatic layers from NOAA’s World Ocean Atlas and NASA’s Ocean Color Web (Sbrocco and Barber, 2013). We further included light at the surface (Photosynthetically Active Radiation, PAR, mol photons m-2 day-1), current velocity (CurVel, m s-1 at the minimum bottom depth of the pixel) and sea ice concentration (fraction ranging from 0 to 1) from the global Bio-ORACLE dataset (with 5 arcminutes spatial resolution, bio-oracle.org). The PAR data were derived from SeaWiFS satellite data, and sea ice concentration and current velocity from the Global Ocean Physics Reanalysis ECMWF (Tyberghein et al., 2012; Assis et al., 2018). Finally, we incorporated wave fetch data from a 100 m resolution GIS layer that covered the study area north to the northern coast of mainland Norway and west to the Faroe Islands (Burrows, 2020). Wave fetch is a proxy for wave exposure (but does not incorporate wind speed or direction) and is calculated as the distance to the nearest land in angular sectors. It thus provides more detailed information than distance from shore, which does not consider the combined distances to land in different directions but only the closest land point.
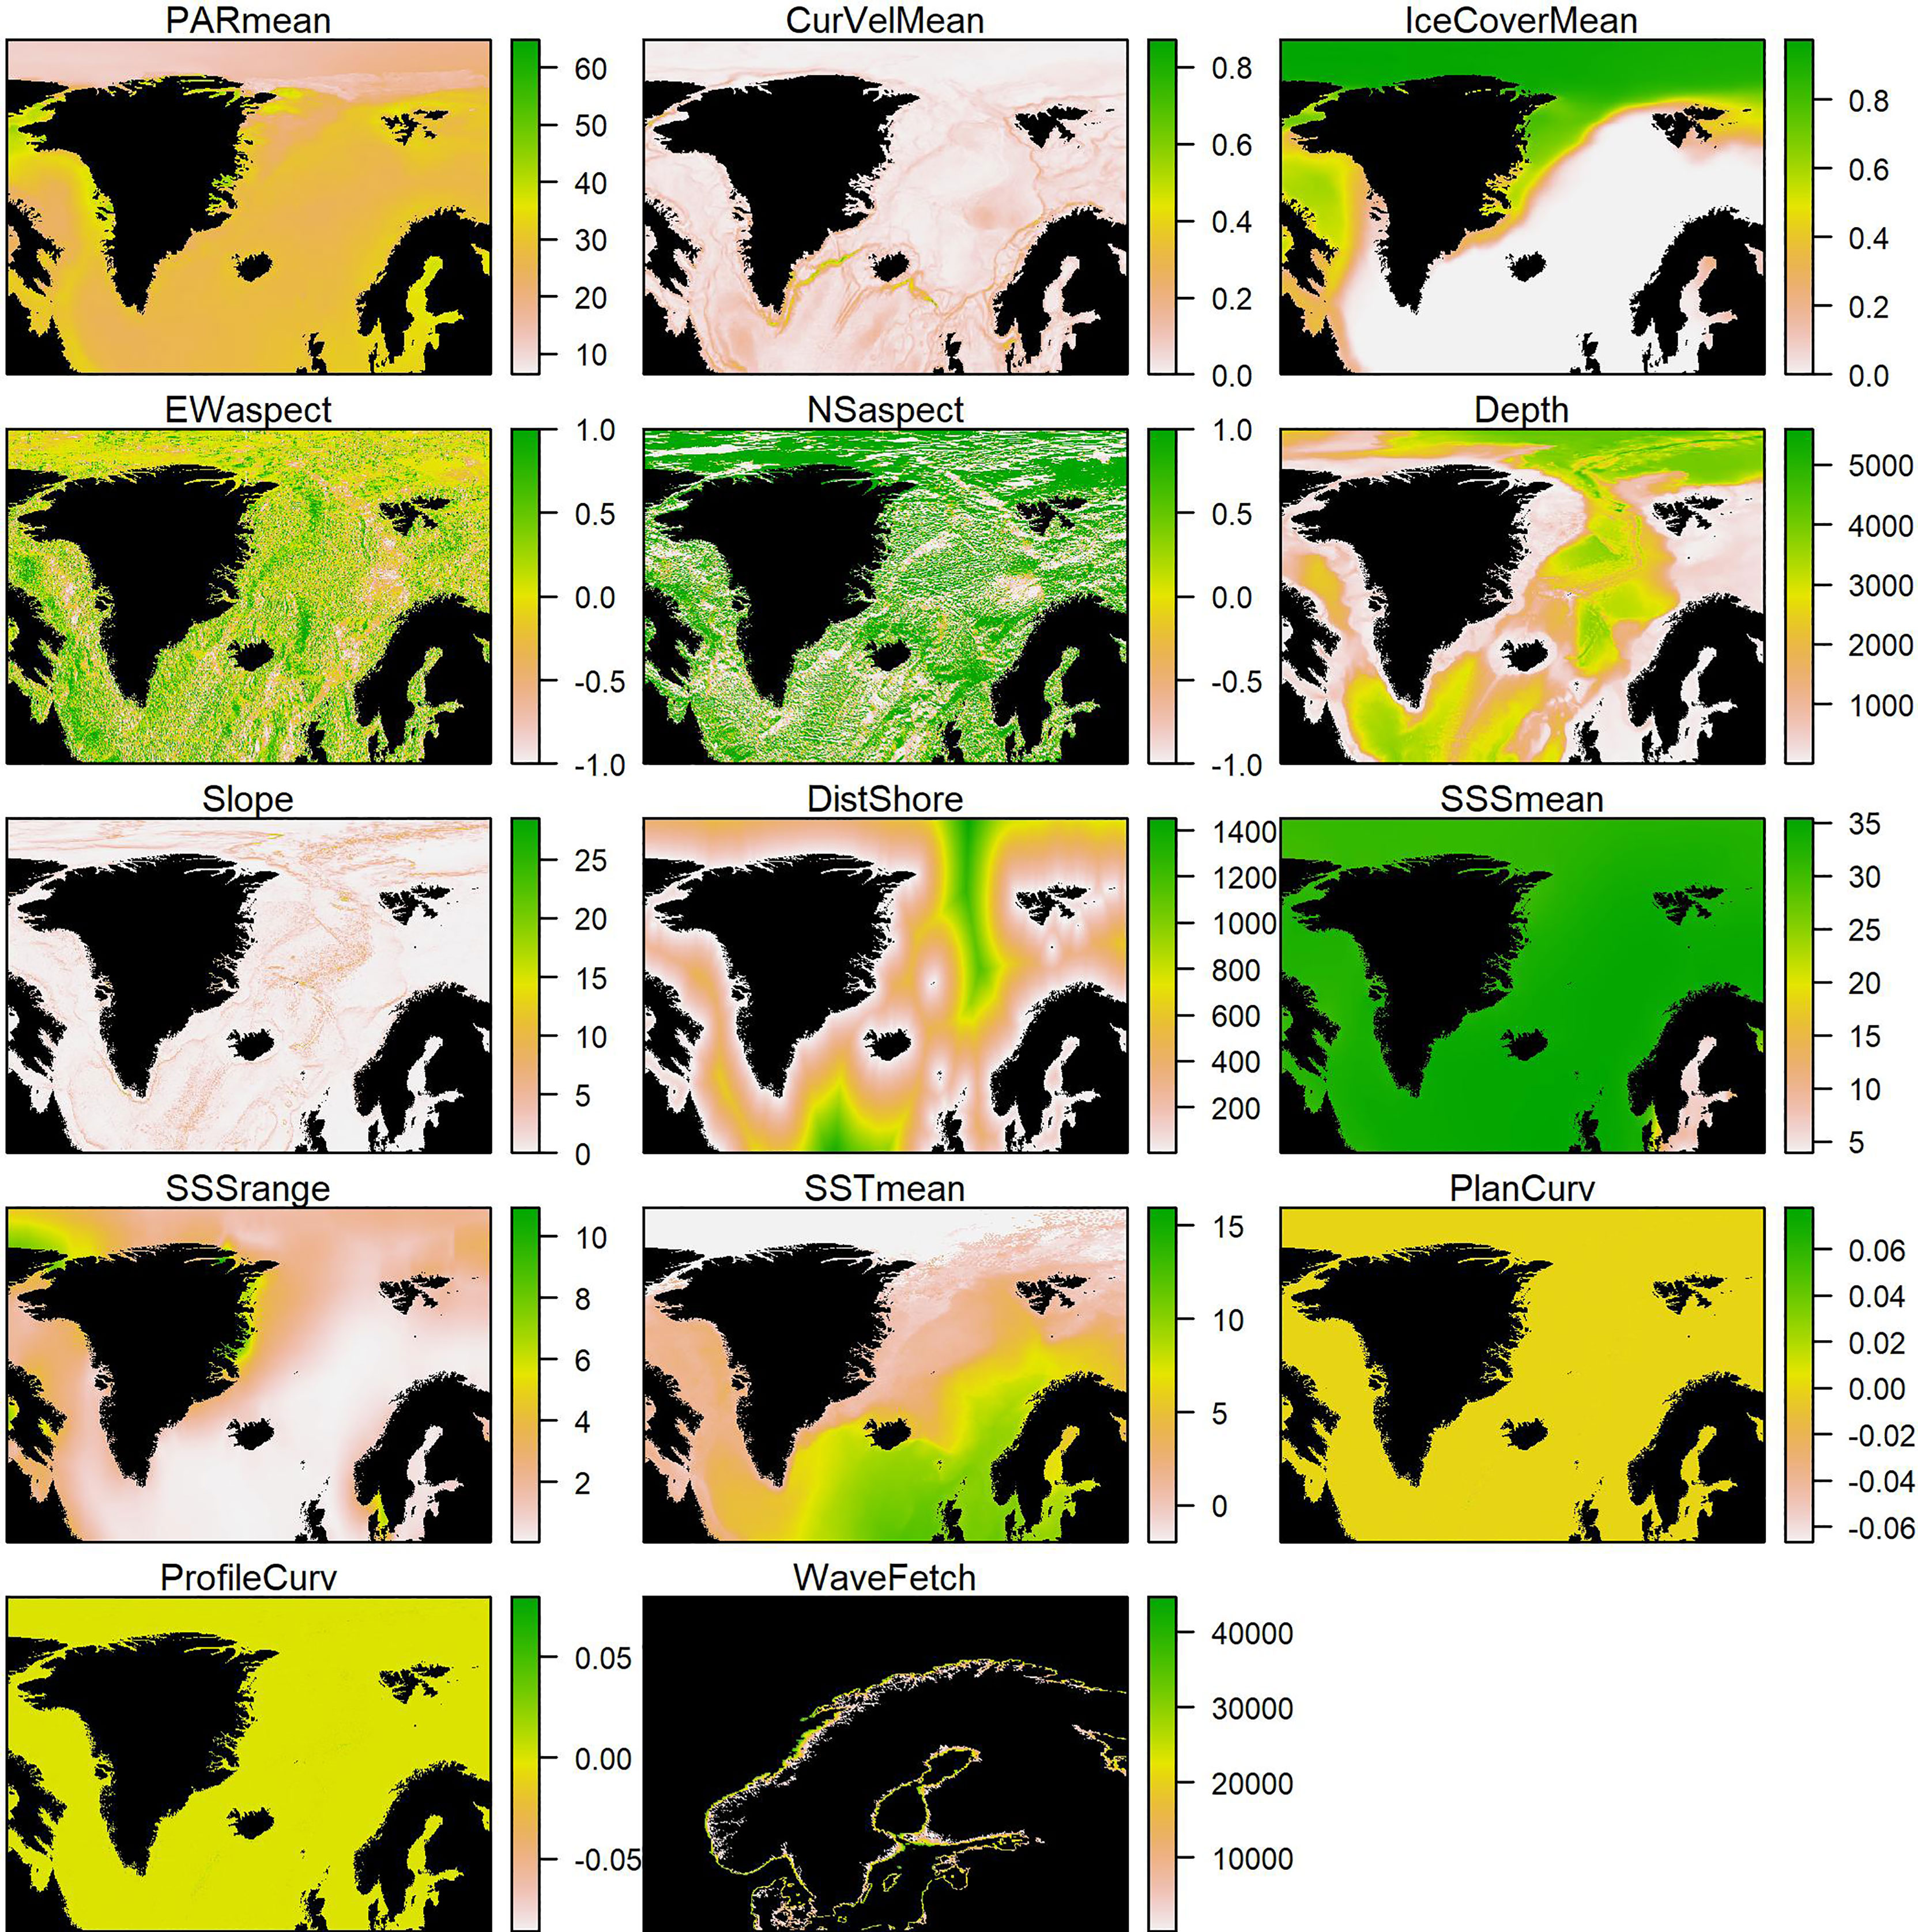
Figure 2 All environmental GIS-layers used in model fitting and predictions. Areas with missing values (including land) are shown in black. For wave fetch, the map is zoomed in to the extent of the GIS layer.
We used the mean values for all temporally varying variables except for SSS, where both mean and range were included. For other variables, the range was typically highly correlated with the mean and unimportant in preliminary model runs. The correlation between variables included in the models was generally low (Pearson correlation coefficient ρ < 0.7), except for mean SST and ice cover (ρ = -0.79, Supplementary Figure 7).
Model Fitting
To model the spatial distribution of kelp forests, boosted regression tree (BRT) models were built using the gbm (Greenwell et al., 2020) and dismo (Hijmans et al., 2020) libraries in R (R Core Team, 2020). When using this approach, many simple models (“trees”) are built and combined (“boosted”) for prediction (Elith et al., 2008). The BRT models have several advantages, for example, a large number of predictor variables of different types can be implemented without prior data transformation; potential complex interactions between variables are automatically handled; models are insensitive to outliers; and missing values are accommodated (Elith et al., 2008). Moreover, BRTs can handle sharp discontinuities, which is critical in cases such as ours, where the species’ distribution is small compared to the full area.
Boosted Regression Tree models were built for Laminaria and Saccharina separately, with presence/absence of kelp forest as response variable, assuming a binomial error distribution. We kept most model parameters to their defaults (Hijmans et al., 2020) but used an optimization routine based on cross-validated deviance to determine the optimal combination of three important parameters: learning rate (testing 0.0001, 0.001 and 0.01), tree complexity (testing 2, 4 and 6), and bag fraction (testing 0.5, 0.6 and 0.7) (Smith, 2021). Learning rate sets the weight given to each tree, and smaller learning rate is preferable but computationally costly as a higher number of trees is required. Tree complexity defines the complexity of interactions that can be fitted, if required by the data. Bag fraction is the fraction of the data used in selecting variables at each iteration (each tree), which makes the model stochastic and has been shown to improve predictive power (Elith et al., 2008). The optimal parameter combinations were learning rate 0.01, tree complexity 6 and bag fraction 0.7 (9650 trees) for Laminaria, and learning rate 0.01, tree complexity 6 and bag fraction 0.6 (7650 trees) for Saccharina. After identifying the optimal model with all explanatory variables included, we ran a simplification procedure to remove variables that contributed little to model predictive power using k-fold cross validation (Elith et al., 2008).
Model Predictions
Based on the final BRT models with unimportant predictor variables removed, we predicted the probability of presence of kelp forest across the Nordic region using the ‘predict’ function in the raster package in R (Hijmans, 2022). Predicted probabilities were converted to presence or absence of Laminaria or Saccharina forest by using the ‘threshold’ function in the dismo package, which is based on specific criteria when comparing observations and predictions. Maximizing kappa (the proportion of correctly classified units after accounting for the probability of chance agreement) gave the best results across different evaluation statistics, hence we used this criterion. The identified cutoffs to convert from predicted probabilities to presence of kelp forest were 0.43 and 0.30 for Laminaria and Saccharina, respectively.
To be able to predict kelp forest distribution for the full Nordic region, we created a uniform raster object of all environmental predictor variables included in the models, resampling all GIS-layers to a 30 arcseconds resolution (i.e., the resolution of the MARSPEC layers). While bottom depth of the sample was used in the model fitting, we used the full cover bathymetric data (m) from MARSPEC for the predictions. Model predictions from BRT models are given for all cells regardless of the presence of missing values for some variables, and missing values are set to the overall mean value for that variable. For mean PAR, the available layer lacked values in grid cells with high sea ice cover in northern parts of the region. Therefore, to avoid unrealistic model predictions in these areas with likely lower-than-average PAR, we interpolated these empty cells based on a generalized additive model (GAM) with mean PAR estimated as a smooth function of sea ice cover (Supplementary Figure 8). The interpolated layer of mean PAR is shown in Figure 2.
We estimated the areal cover of kelp forests per Nordic country by summing the area (which is not constant since arcminutes vary with latitude) of all cells with predicted presence of kelp forest within each country’s Exclusive Economic Zones (EEZ, MarineRegions.org, 2021).
Results
Predicted Kelp Distribution
The BRT model predictions indicated that Laminaria forests are found along the Norwegian coast including Svalbard (mostly eastern Svalbard), on the western coasts of Sweden and Denmark, around the Faroe Islands and the southern coast of Iceland, and in some scattered locations along the coast of Greenland (Figure 3). For Saccharina, the model predicted presence of forests along the Norwegian coast north to Lofoten and on Svalbard (mostly western Svalbard), around West, South and East Greenland and at scattered locations in the other Nordic countries. Predicted presence of kelp forests in areas north of the northernmost observations and deeper than the deepest observations were flagged as uncertain or unrealistic (light blue in Figure 3). For Denmark, we furthermore masked out predictions in cells where the substrate was classified as soft bottom, as a detailed substrate layer for Denmark was available from The Geological Survey of Denmark and Greenland (geus.dk, note that this information was not available at a Nordic level).
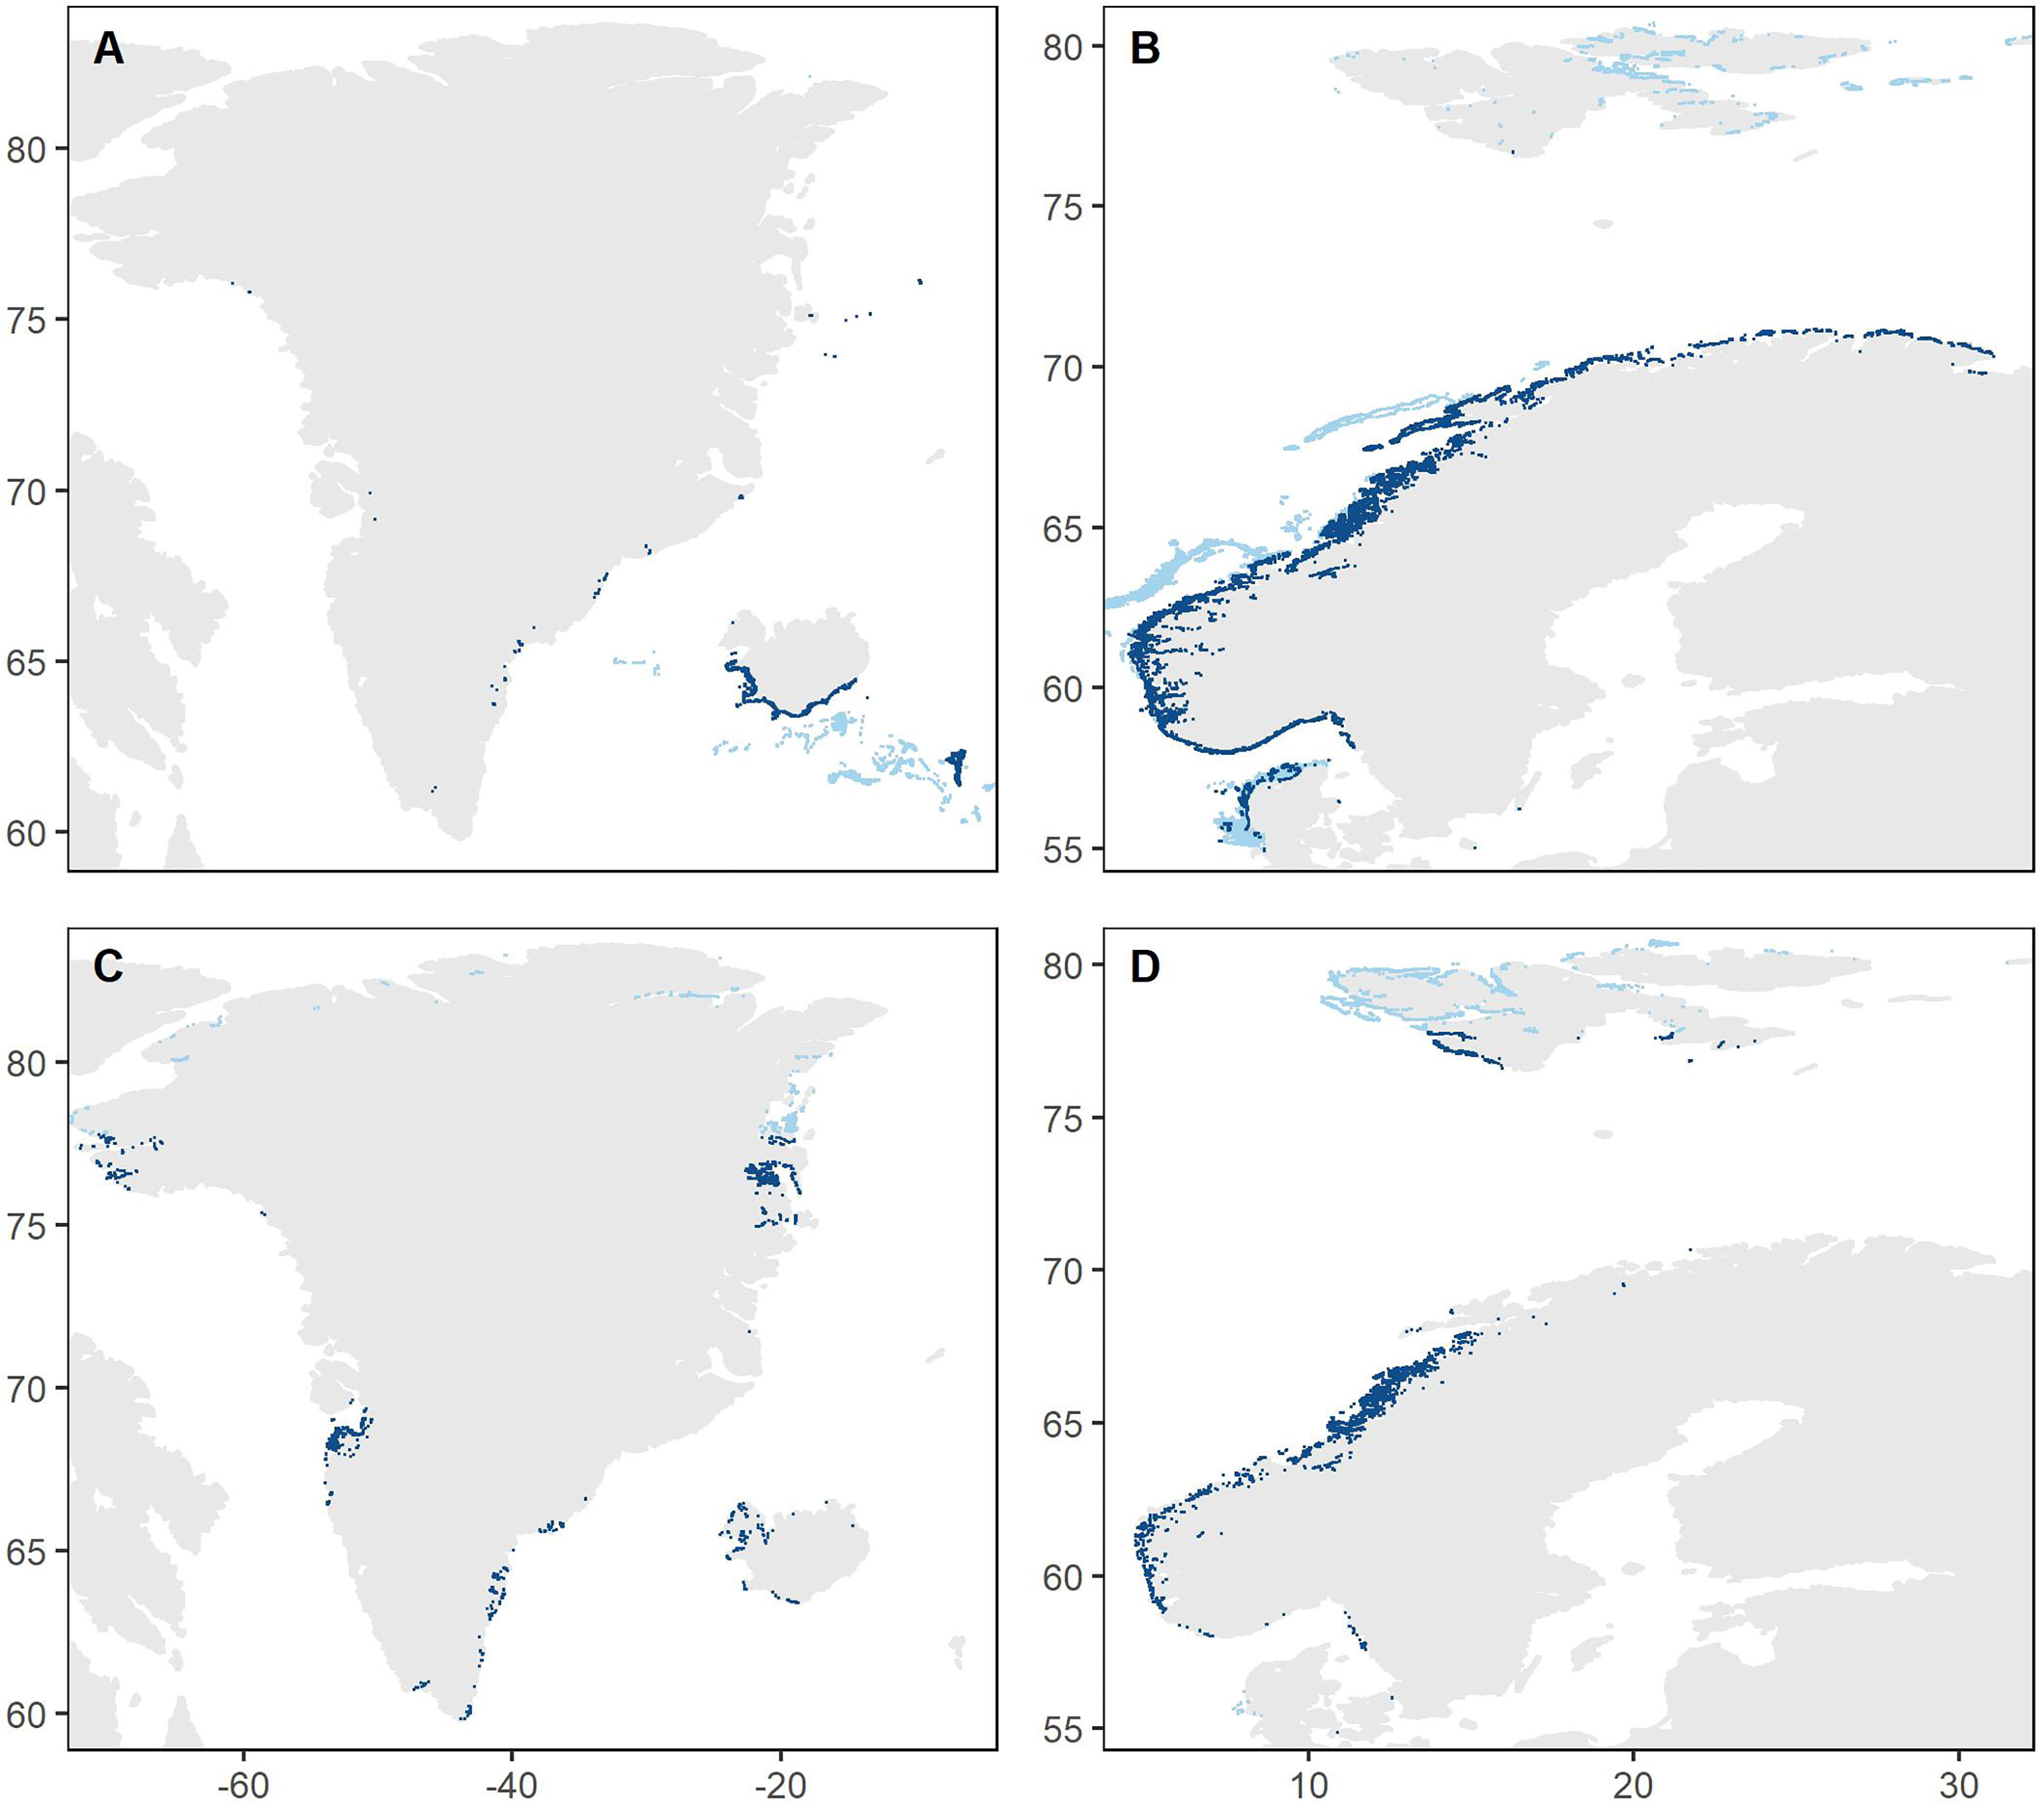
Figure 3 Predicted presence (blue points) of Laminaria (A, B) and Saccharina (C, D) kelp forests (dense or moderately dense forest) across the Nordic region (panels A–D cover the western and eastern parts of the region, respectively). Light blue points illustrate predictions that are highly uncertain or unrealistic as they are either north of the northernmost observation, deeper than the deepest observation or in areas with unsuitable substrate (for Denmark). Areal distribution data are given both with and without these uncertain/unrealistic predictions (Table 1). Note that the point size is increased to allow visualization at this large scale, resulting in an exaggerated impression of the areal extent.
Estimated Kelp Forest Areas
The estimated kelp forest areas for each Nordic country’s EEZ are given in Table 1. Large areas of Laminaria forests are estimated for Norway and Iceland, and to some degree for Denmark and the Faroe Islands. Saccharina forests are estimated to be largest in Norway and Greenland. The all-including estimate of Laminaria forests for Denmark (in parentheses in Table 1) is an overestimate as the predicted areas include known areas with soft bottom substrate. The model also predicted presence of Saccharina along the northern and eastern coasts of Greenland and Svalbard, which are seasonally or permanently ice-covered and where we lack observational data, thus, these estimates are considered uncertain. It should also be noted that the models only include two out of several genera contributing to kelp forests around Greenland, thus the cover of kelp forests there may be underestimated.
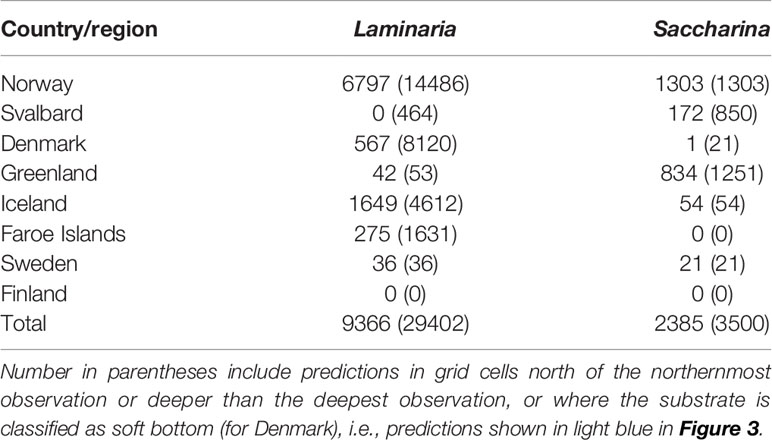
Table 1 Predicted kelp forest area (km2) of the genera Laminaria and Saccharina per Nordic country or region.
Associations With Environmental Variables
Eight explanatory variables were kept in the final BRT model for Laminaria, with the most important being mean sea ice cover, bottom depth and wave fetch (Figure 4). The results indicated that Laminaria forests are associated with low sea ice cover, bottom depths shallower than 30 m and high wave fetch. Moreover, mean SST at around 9-10°C, mean SSS above 25, and mean PAR at the surface around 25-30 mol photons m-2 day appeared favorable for Laminaria.
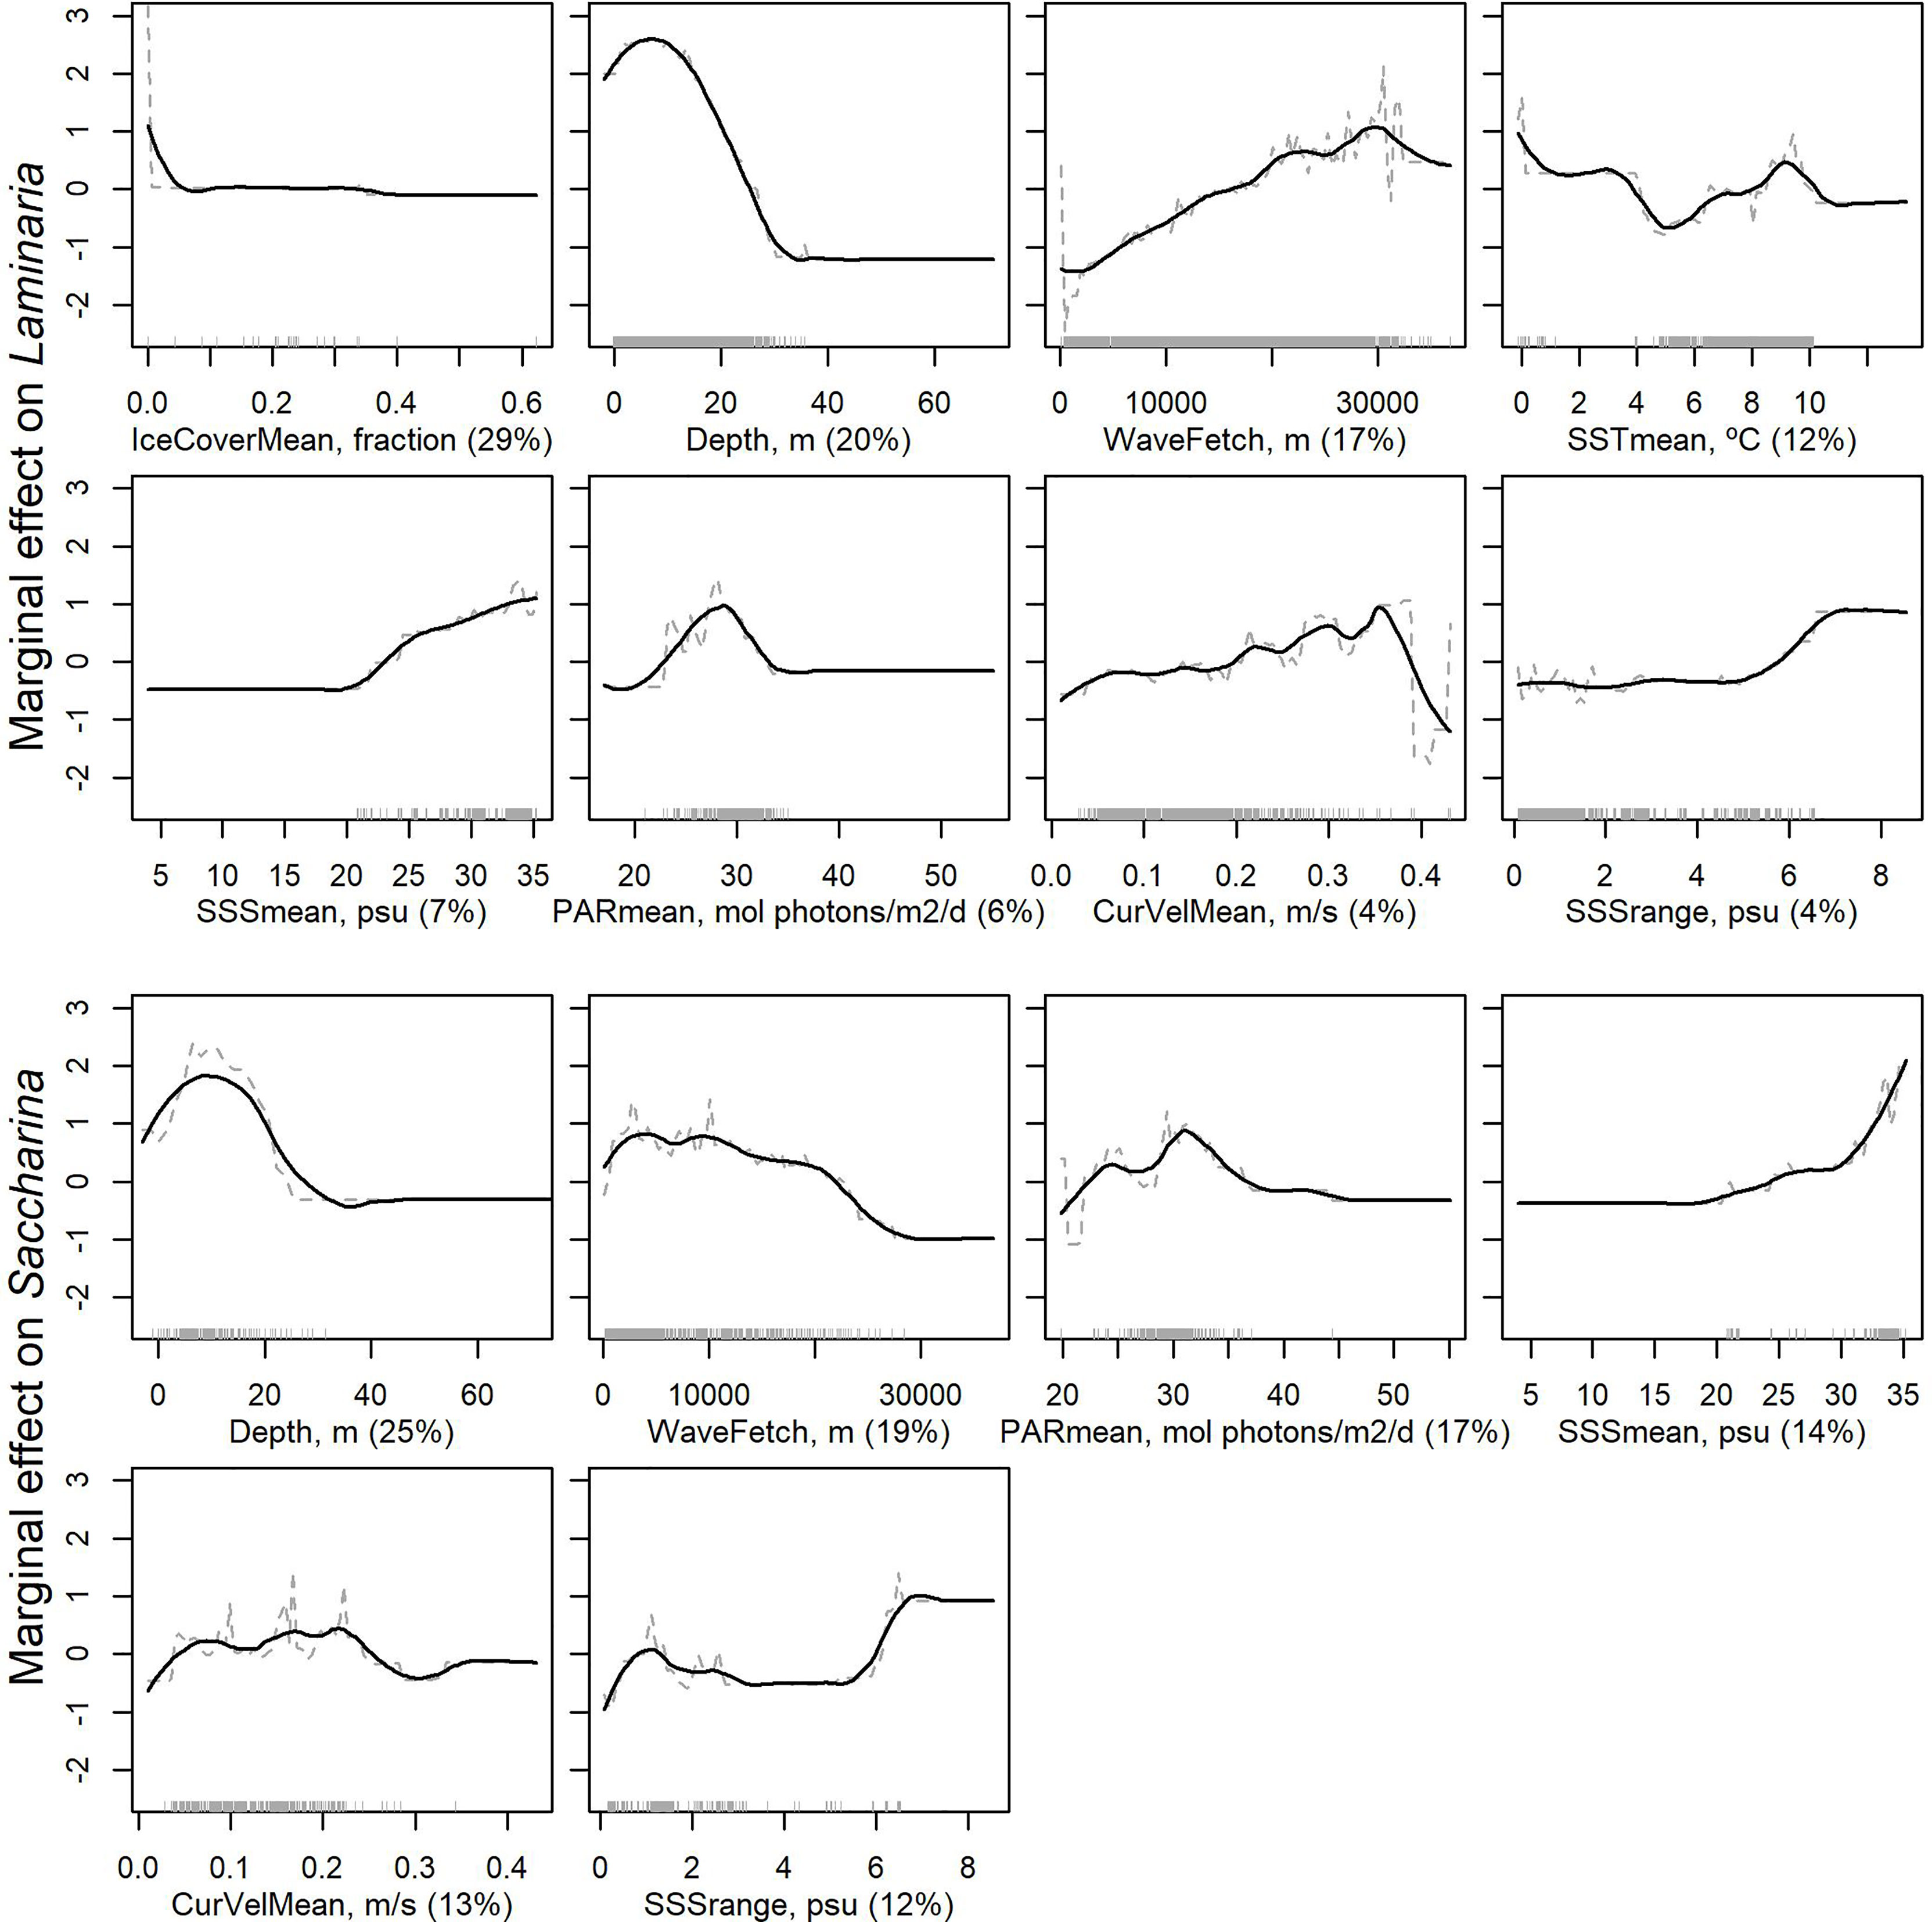
Figure 4 Partial dependence of presence of Laminaria (two upper rows) and Saccharina (two lower rows) forests to the environmental variables kept in the final models, sorted according to degree of influence. The plots show the effect of a variable after accounting for the average effects of all other variables in the model. Grey dashed lines show the marginal effect of the variable and solid black lines give a smooth representation of the response. Numbers in brackets provide the relative contribution of the given variable. The grey rug on the x-axis shows the location of data with recorded presence of Laminaria or Saccharina kelp forest, while the x-axis range is determined by the full datasets including absences.
For Saccharina, bottom depth was the most important explanatory variable among the six variables selected in the final model, and the results again indicated that forests are found in areas shallower than 30 m (Figure 4). In addition, Saccharina forests responded negatively to wave fetch, in contrast to Laminaria, and showed a more complex response to PAR. The most important pairwise interactions identified in the BRT models were between wave fetch and mean PAR for both Laminaria and Saccharina (Supplementary Figure 9).
To further investigate associations with environmental predictor variables and any discrepancies between observations and model predictions, we quantified the variation in the variables at the observed and predicted kelp forest locations, after masking out uncertain/unrealistic model predictions (Table 2). Laminaria forests were on average found in areas with higher wave fetch and current velocity, and in somewhat deeper areas than Saccharina forests. The predicted environmental niches largely agree with the observations with some exceptions. For example, the lowest values of mean SSS, mean PAR and mean SST in grid cells with predicted presence of Laminaria and Saccharina forests are lower than what is indicated by the observations, and the mean SST in areas of predicted Saccharina forests is lower than the mean SST in the location of observations. Both species are predicted to form forests in areas with mean SST values down to -2 ˚C, although the minimum SST value at grid cells with kelp forest observations are -0.1 and 0˚C for Laminaria and Saccharina, respectively.
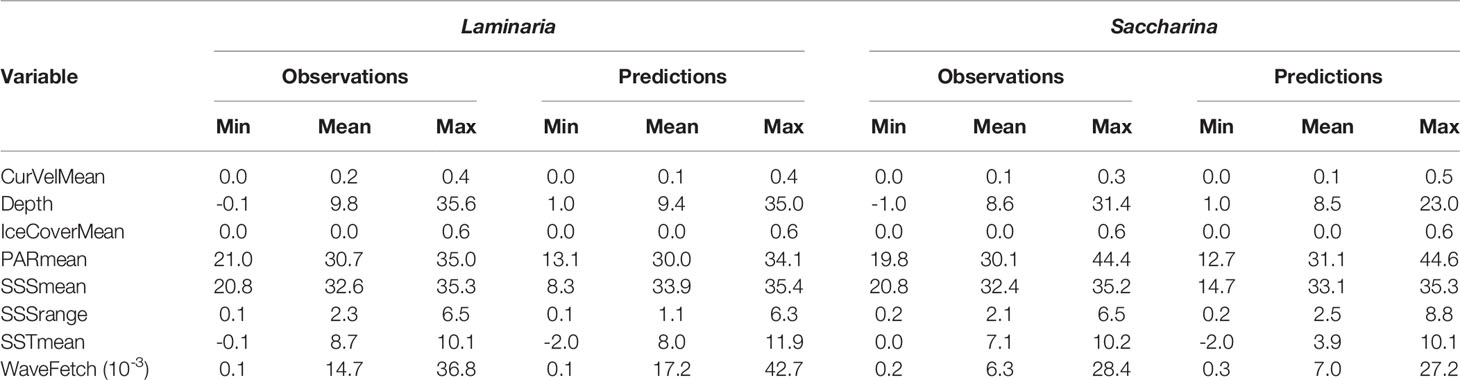
Table 2 Variation in environmental variables (minimum, mean and maximum values) in grid cells with kelp forest observations and in grid cells with predicted presence of kelp forest, after masking out unreliable predictions (see main text).
Model Evaluation
Overall, the BRT models performed well, with the Laminaria model performing better than the Saccharina model (Table 3). Deviance explained, correlation with data and the AUC score were calculated both with training data (used to fit the model) and from cross-validation (CV, with new data, i.e., the portion of data withheld during each model fitting step), and the CV scores are used to evaluate the models’ predictive performance. High scores with training data compared to CV indicate overfitting, but despite a tendency of overfitting, the predictive performance of BRT is generally better than other methods (Elith et al., 2008).
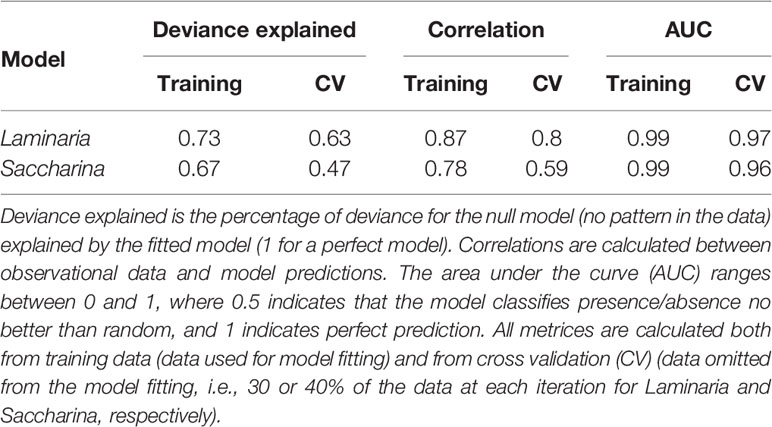
Table 3 Evaluation statistics for the BRT models.
Further details about the models’ performance are found in the Supplementary material (Supplementary Table 1). In short, when comparing observations and model predictions, both the Laminaria and Saccharina models correctly predicted absence in locations of actual absences (>97% of observed absences were predicted to be absences), the Laminaria model correctly predicted presence of kelp forest in 85% of the actual kelp forest observations and the Saccharina model in 76% of the cases.
Discussion
We here present the first distribution maps and estimated areas of kelp forest in the Nordic region based on distribution models developed from compiled data from multiple national monitoring and research programs. In contrast to previous efforts to model large-scale kelp distributions using species occurrence data (Raybaud et al., 2013; Jayathilake and Costello, 2020), our study is based on quantitative data of coverage (%) or semi-quantitative data of densities. This allows us to distinguish and model the distribution of true kelp forests instead of occurrences of single or few plants. By forming three-dimensional biogenic habitats, kelp forests support high levels of biodiversity and production, serve as nursery grounds for commercial fish and invertebrates, and provide a range of additional ecosystem services (Smale et al., 2013; Wernberg et al., 2019). Mapping the areal distribution of kelp forests is a critical first step to quantify their value on regional and global scales and serves as a baseline for future studies of loss or increase (Jayathilake and Costello, 2020).
We combined several large datasets collected with different measures to provide an overall picture of the distribution and total area of kelp forests for the full Nordic region, suitable for discussing the kelp forests’ role at a larger scale. This large-scale approach required several assumptions and simplifications that should be kept in mind when interpreting the results. First, we used a minimum 50% cover threshold (or ‘moderately dense’/‘dense’ cover) to define ‘kelp forest’, which is used in the Norwegian national mapping program to identify large contiguous kelp forests (Bekkby et al., 2013). Areas with less dense kelp cover could still constitute healthy and ecologically important habitats, thus, our results should be considered minimum estimates for the distribution of moderately dense/dense kelp forests. Secondly, we did not include data on kelp species that may be important in parts of the Nordic region (e.g., Agarum clathratum and Alaria esculenta in Greenland), which may lead to an under-estimation of the total kelp forest distribution in these areas. Moreover, the semi-quantitative classification of kelp density (for the Norwegian and Faroese data) and the quantification of kelp cover (for the remaining data) are based on somewhat different approaches between countries (see the Supplementary Material), and are subject to somewhat subjective decisions that may be differently interpreted between countries and field workers. E.g., data collected by divers covering large areas (as for Denmark and Greenland) might lead to lower percent kelp cover estimates than data collected with underwater cameras with a restricted view (as for Norway). At the same time, the chance of observing kelp will increase with the size of the sampling unit. Also, the relatively coarse environmental layers do not capture fine-scale variation in important predictor variables such as bottom depth and light availability, but there are no reasons to assume that the low resolution causes a systematic bias at the pixel level that leads to under- or over estimation of our overall estimates. Finally, we selected a specific criterion (maximizing kappa) to translate estimated probabilities to predicted presence of kelp forest. Using other criteria would have given slightly different predictions, but maximizing kappa gave the best fit of the model predictions to the data. In light of these caveats, the model results are unsuitable for pinpointing exact positions of kelp forests or for management actions at local scales.
The models indicate that Laminaria and Saccharina, the dominant kelp genera in the Nordic region, form blue forests that cover a total of around 12 000 km2, and likely more if we consider areas in the northern part of the region that have not had any observations to be included. This is almost 1% of the estimated global kelp area (Jayathilake and Costello, 2020) and 0.34% of the global macroalgae area, which is estimated to be 1,469,900 km2 and 3,540,000 km2, respectively (Duarte et al., 2005; Krause-Jensen and Duarte, 2016). But considering that the global kelp estimate is based on occurrence data, i.e., including densities lower than our definition of kelp forest, the Nordic region’s contribution to the global kelp area is probably much higher than 1%. It should also be noted that our models are based on current presences and absences of kelp forest, thus, the model predictions represent today’s kelp forest distribution. The potential distribution of kelp forests is likely larger, e.g., in areas which have been heavily grazed by sea urchins (e.g., areas in Norway and Greenland, Norderhaug and Christie, 2009; Krause-Jensen et al., 2012) or where loss of sea ice is increasing the habitat suitability for kelp (e.g., in Greenland and Svalbard, Filbee-Dexter et al., 2019). The presence of sea urchin barrens may have resulted in the models misattributing kelp absence to abiotic variables. However, excluding areas of sea urchin barrens would not necessarily solve this, as the sea urchin barrens have abiotic conditions suitable for both kelp and sea urchins. More knowledge is needed to be able to disentangle the complex interactions of biotic and abiotic factors that enhance sea urchin barrens (see e.g. Christie et al., 2019a).
Kelps occupy rocky substrates from just below the tidal zone down to ~30 m (although individual specimens can in extreme cases penetrate deeper than 60 m along the Greenland coast, and to depths beyond 100 m in deep-water refugia, Graham et al., 2007; Krause-Jensen et al., 2019). Laminaria is typically found in current- and wave-exposed areas, while Saccharina lives more sheltered (Bekkby et al., 2009; Bekkby and Moy, 2011). Our distribution models capture this pattern, with increasing probability of presence of Laminaria forests with increasing wave fetch and current velocity, whereas the probability of presence of Saccharina forests was at the lower end of both of these environmental variables (Figure 4). Ice cover was ranked as the most influential environmental variable for Laminaria. The response pattern indicate presence of Laminaria in ice-free and low-ice areas only. Ice-cover was not included in the simplified model for Saccharina, and Saccharina was predicted to occur in both ice-free and periodically ice-covered areas. This likely reflects the observations that Laminaria is widely distributed along the ice-free Norwegian coast (but is also found in periodically ice-covered areas of the eastern coast of Greenland). Since Saccharina occupies more sheltered areas than Laminaria, the relatively coarse environmental layers may be less suitable to represent its environmental niche compared to Laminaria, as suggested by the poorer model fit for Saccharina.
The models indicate that kelp forests are most widespread along the coasts of Norway, Iceland, Greenland, and Denmark (the overestimate for Denmark is discussed below). The models predict little to no kelp forests along the Swedish and Finnish coasts in the brackish Baltic Sea, which is in accordance with observational data. The areal extent of L. hyperborea and S. latissima has previously been estimated for Norway by Gundersen et al. (2011), using rule-based GIS-models, and by Frigstad et al. (2021), using high-resolution (25 m × 25 m) environmental data. We here estimated the kelp forest areas along the Norwegian coast to be around 7 000 km2 and 1 000 km2 for Laminaria and Saccharina, respectively, which is comparable to the results in the previous studies (3 810 to 5 900 km2 and 2 000 to 3 607 km2 for L. hyperborea and S. latissima, respectively, Gundersen et al., 2011; Frigstad et al., 2021). This indicates that our relatively coarse models capture well the overall distribution of kelp forests of these species.
Krause-Jensen et al. (2020) estimated the total potential area for subtidal macroalgae in the Arctic region to be 514,679 km2, or 267,633 km2 when adjusting for substrate. Country-specific estimates (subtidal macroalgae after substrate-adjustment) were 48,026 km2 for Greenland, 10,771 km2 for Iceland, 15,080 km2 for Northern Norway and 1,945 km2 for Svalbard. These estimates were from BRT and adaptive boosting models based on records of all brown macroalgae (i.e., not only kelp) and all coverages (i.e., not only forests), and are therefore expected to give higher estimates than our models restricted to presence of Laminaria and Saccharina kelp forests. Thus, our estimates represent the current area of moderate to dense forests of Laminaria and Saccharina, and do not show the full potential area of macroalgae in the Nordic region. The differences also illustrate the importance of using quantitative data compared to presence/absence for the results and interpretations of distribution models.
Kelp forests in moderately wave exposed and sheltered areas between 63 and 71°N along the Norwegian coasts were totally grazed by the sea urchin Strongylocentrotus droebachiensis from the 1970s to 1990s. Since the 1990s the kelp forest has gradually recovered in the southern part, likely due to a combination of increased temperatures, being harmful for the sea urchin recruits (Fagerli et al., 2013), and the northwards expansion of crab species that prey on the urchins (Rinde et al., 2014; Christie et al., 2019a). In the most northeastern part of the grazed area, kelp is recovering due to increasing abundance of the red king crab (Christie et al., 2019a). At medium latitudes (below ~67°N), the Laminaria kelp forest is still being grazed down by urchins (Rinde et al., 2014). In southern Norway, a combination of increased temperature, eutrophication and overfishing is likely responsible for a loss of Saccharina in many areas (Moy and Christie, 2012; Sogn Andersen et al., 2013; Filbee-Dexter and Wernberg, 2018) and a shift back and forth between Saccharina and turf algae (Christie et al., 2019b). The Norwegian kelp data mainly cover the period from 2007 to 2018 (Bekkby et al., 2013). Absences of Laminaria and particularly of Saccharina in grazed areas in the north and in areas dominated by turf algae in the south, will cause our area estimates to be lower than the full potential for kelp for Norway, and possibly also lower than today’s distribution due to the recent recovery of kelp in the north.
Iceland and the Faroe Islands were predicted to host large areas of Laminaria kelp forest but little or no Saccharina kelp forests (Table 1). The lack of predicted Saccharina forest is likely driven by the high mean current velocity around the Faroe Islands and along the southern coast of Iceland, and the high wave exposure around the Faroe Islands (Figure 2, the wave exposure data did not cover Iceland). The northwestern coast of Iceland is less exposed, and Saccharina forests were predicted to be present in this region. We were not able to obtain quantitative datasets from Iceland to include at the time of the analyses, but we know from other studies that species of both Laminaria and Saccharina, in addition to other kelp species such as Alaria esculenta, are present along the coast of Iceland (Munda, 1987; Gunnarsson and Hauksson, 2009).
The modelled kelp distribution for the Faroe Islands reflected the observational data available from the archipelago, which showed that although both Saccharina and Laminaria form forests here, Laminaria is more abundant (~40% of all 297 survey stations were classified as being covered by Laminaria forest, compared to only 8% being covered by Saccharina forest). Interestingly, a local study found that L. digitata was present and abundant throughout the exposure range in the Faroe Islands, while S. latissima had limited abundance but was present in areas with high exposure (Bruntse et al., 1999), opposite to the pattern for L. hyperborea and S. latissima in Norway (Bekkby et al., 2009; Bekkby and Moy, 2011).
The models predicted large areas of kelp forest around Denmark (Figure 3), despite few observations of dense kelp forests (Figure 1). The Danish coast is mostly soft bottom, with occasional boulder reefs, scattered stones, or man-made structures where kelp can grow. The models therefore overestimate the current cover of kelp in Danish soft-bottom areas (although the model may simultaneously underestimate the cover of kelp forests in areas influenced by less saline Baltic water, Møller Nielsen et al., 2016). We therefore masked out predictions in soft bottom areas using a detailed substrate layer available for Denmark. To improve model predictions, substrate should be included as a predictor variable, but there are no suitable data covering the full Nordic region. For example, seabed substrate data for Europe are available from EMODnet (emodnet-geology.eu), but the coverage is relatively poor (e.g. Greenland and the Faroe Islands are not included) and the resolution too coarse to correctly represent the high local variation in substrate. In result, a high fraction of the observed presences of kelp forest (~50-60%) were classified to occur on other substrates than hard bottom, which could result in biased model predictions as kelp forests are not associated with soft bottom areas. We therefore decided to not include it as a model variable. Obtaining and implementing high-resolution substrate data would thus constitute a significant step forward in kelp forests distribution modeling. Importantly, apart from having the right substrate, our results indicate that the Danish west coast has favorable environmental conditions for kelp growth, with shallow depths (i.e., sufficient light), high wave fetch, high salinity, and no ice. This region thus appears suitable for kelp growth through cultivation, artificial reefs, or restored boulder reefs.
Along the Swedish coast, kelp forests are mostly limited by salinity. Hard bottom habitat with large biomasses of macroalgae including Laminarales occur at around 2-17 m depth along the northern part of the Swedish Skagerrak coast where surface water is 20-30 psu (Pedersén and Snoeijs, 2001; Karlsson, 2007; Stål and Pihl, 2007). In the Kattegat, surface salinity declines to 15-25 psu, but more saline Atlantic water is present below the halocline. Here, kelps are found on offshore boulder reefs at depths at around 7-12 m, or even down to 20 m (Pedersén and Snoeijs, 2001; Wikström and Lindegart, 2012). Our models reflect that Laminaria and Saccharina forests are present along the Skagerrak coast but decline with low sea surface salinity. The sharp decline in our models, likely driven by the lack of kelp in the brackish Baltic Sea, might however have led to an underestimation of kelp forest cover for Sweden, in particular in offshore boulder reefs in the Kattegat where salinity increases with depth and kelp forests of L. digitata, L. hyperborea and S. latissima may reach higher cover than along the coast (Pedersén and Snoeijs, 2001; Wikström and Lindegart, 2012).
The knowledge on the distribution of kelp forests along the Greenland coast is limited; a few studies have been conducted along the west coast (Krause-Jensen et al., 2012; Krause-Jensen et al., 2019), and a recent survey provided the unpublished data from the east coast included in this study (Wegeberg et al., unpublished data). Considering Greenland’s long coastline, the estimates for Greenland are therefore highly uncertain. Moreover, kelp species in other genera than the ones included here, such as Alaria esculenta and Agarum clathratum, are important contributors to Greenland’s kelp forests. Therefore, focusing on Laminaria or Saccharina only may lead to an underestimation of kelp distribution for Greenland. Similarly, if different kelps occur in combination, using a threshold of 50% cover of Laminaria or Saccharina could lead to an underestimation. However, we found that across the Nordic countries, these genera are rarely found together, and summing their individual cover rarely changed the classification of a station from absence to presence of kelp forest. We therefore opted to model their distribution separately, as they occupy different environmental niches.
The Saccharina model predicted presence of forests along the coast of Greenland from the south to at least 78°N, which is the northernmost observation of Saccharina forest in the dataset included here (Krause-Jensen et al., 2012). In addition, the Saccharina model indicated presence of kelp forest along the northern coast where we lack observational data and mean sea ice concentration is high (>0.5 on a scale from 0-1). While these predictions might be false positives, it is worth noting that even north of 81°N along the northeastern Greenland coast, mean sea ice concentration is always <1 and often <0.7, and mean PAR values often >30 (before extrapolation). Therefore, the environment could be periodically favorable for kelp growth, and will likely become increasingly favorable with further climate warming and concurrent reductions in sea ice cover (Filbee-Dexter et al., 2019; Krause-Jensen et al., 2020).
Similarly, the Svalbard archipelago is predicted to be a suitable area for Laminaria and, to a larger extent, Saccharina kelp forests in our models. Several studies have mapped species richness of macroalgae in fjords around Svalbard (Fredriksen et al., 2019 and references therein). However, most data from Svalbard are presence-only (Krause-Jensen et al., 2020), and we did not obtain suitable quantitative data to include in the models. Nevertheless, Laminaria, Saccharina and other kelp genera are known to be present, with L. digitata and S. latissima being among the dominant species in the sublittoral zone (Fredriksen and Kile, 2012; Hop et al., 2016; Fredriksen et al., 2019). A study from Kongsfjorden showed an increase in kelp biomass with recent warming, especially pronounced for L. digitata (Bartsch et al., 2016).
On a global scale, kelps occur in areas with mean SST ranging from 5°C to 25°C (Jayathilake and Costello, 2020). Since the Nordic region mostly falls within the lower part of this temperature range, one can expect that climate warming would increase rather than decrease the extent of kelp forests in the region, as is indicated by recent observations in the Arctic (Bartsch et al., 2016; Krause-Jensen et al., 2020). However, this is not the case for the southern part of the region. Summer temperatures in the surface water of Skagerrak has increased by 1.6˚C from the 90s until 2014 (Rinde et al., 2016), approaching the lethal temperatures for kelp macrophyte development and growth which is around 21-23˚C (Bolton and Lüning, 1982). Additionally, increased temperature in combination with other environmental stressors, such as nutrient enrichment favoring small and fast-growing filamentous algae (“turf”), now pose a threat to kelp forests in widespread areas across the globe, also in the Nordic region (Filbee-Dexter and Wernberg, 2018).
During the past few decades, the importance of vegetated coastal habitats for various ecosystems services, including as natural carbon sinks, has been recognized (Duarte and Cebrián, 1996; Duarte et al., 2005; Nellemann et al., 2009), but the magnitude of their role is still uncertain. Resolving the large uncertainty regarding the distribution and area occupied by blue forests is considered as the most critical step to identify their roles in the global carbon cycle (Duarte, 2017). In combination with estimates of biomass and rates of net primary production and carbon sequestration, the areal estimates presented here sets the scene for calculating the carbon budget of kelp forests in the Nordic region (see Frigstad et al., 2021 for a recent example). Moreover, the distribution maps can be coupled to regional ocean models to infer the fate of the export of kelp material (e.g. Filbee-Dexter et al., 2020), which is another key knowledge gap in the carbon budgets (Duarte, 2017). Finally, data on species diversity, biomass of commercial species, effects on water quality, primary production, etc., can be scaled up by the areal estimates to contribute to the discussion on the importance of kelp forests and their contribution to ecosystem services.
Data Availability Statement
The study was based on a compilation of different datasets that were standardized for the analyses. Most of the data are publicly available, but the data from Eastern Greenland are not yet published. These will become available along with a publication describing the biogeography of the region, expected in 2022. Requests to access these datasets should be directed to a3Jpc3RpbmEua3ZpbGVAbml2YS5ubw==.
Author Contributions
HG, KH, GA, and DK-J conceived the initial idea. KK performed the modeling and wrote the draft manuscript with support from GA, HG, and ER. All the authors contributed information from their respective research region and field, and commented, improved, and approved the manuscript.
Funding
This study has been supported by the Norwegian Environment Agency (Nordic Blue Carbon Project, #17080044), the Research Council of Norway (OPTIMAKELP, #280732), NIVA (Org. no. 855869942), the Independent Research Fund Denmark (CARMA, #8021-00222 B), the Danish Strategic Research Council (MAB3, #11-116872), the Government of Greenland and the Danish Environmental Protection Agency (DANCEA, J.nr. 2019 – 8703) and the EU Horizon 2020 (FACE-IT, #869154). The Norwegian data were collected with support from the National project for mapping biodiversity - coast 2003-2018 (funded by the Ministry of Climate and Environment, the Ministry of Trade, Industry and Fisheries, and the Ministry of Defence, #190166) and the Norwegian Environment Agency through several kelp-sea urchin projects. Data from the Faroe Islands originated from the BIOFAR program supported by The Faroese Research Council, Nordic Council of Ministers and the Carlsberg Foundation. The data from Western Greenland area originate from the Disko West Environmental Studies in the Disko West area 2009-2011, supported by the Bureau of Minerals and Petroleum, Greenland Government. The data from Northeast Greenland were achieved through a survey financed by the Strategic Environmental Study Program for the Northeast Greenland area (Government of Greenland). The study is also a contribution to the MarineBasis program under the Greenland ecosystem monitoring (www.g-e-m.dk). The Danish data originate from the Danish Marine monitoring program.
Conflict of Interest
The authors declare that the research was conducted in the absence of any commercial or financial relationships that could be construed as a potential conflict of interest.
Publisher’s Note
All claims expressed in this article are solely those of the authors and do not necessarily represent those of their affiliated organizations, or those of the publisher, the editors and the reviewers. Any product that may be evaluated in this article, or claim that may be made by its manufacturer, is not guaranteed or endorsed by the publisher.
Acknowledgments
We thank everyone who kindly contributed with data to this study, including Jacob Carstensen (Aarhus University, Danish data), Grethe Bruntse (Tønder Kommune, Denmark, data from the Faroe Islands), Christoffer Boström (Åbo Akademi University, Finnish data). Michael Bo Rasmussen and Peter Bondo Christensen are thanked for their contribution to collecting the 2009-data from Disko Bay, Greenland. We also acknowledge the contribution of Poul Møller Pedersen, who passed away in 2012, to the collection of Disko Bay data. We also thank all the data collectors from NIVA’s section for Marine Biology and from the Institute of Marine Research (Norway).
Supplementary Material
The Supplementary Material for this article can be found online at: https://www.frontiersin.org/articles/10.3389/fmars.2022.850359/full#supplementary-material
References
Araújo R. M., Assis J., Aguillar R., Airoldi L., Bárbara I., Bartsch I., et al. (2016). Status, Trends and Drivers of Kelp Forests in Europe: An Expert Assessment. Biodivers. Conserv. 25, 1319–1348. doi: 10.1007/s10531-016-1141-7
Assis J., Tyberghein L., Bosch S., Verbruggen H., Serrão E. A., De Clerck O. (2018). Bio-ORACLE V2.0: Extending Marine Data Layers for Bioclimatic Modelling. Glob. Ecol. Biogeogr. 27, 277–284. doi: 10.1111/geb.12693
Bartsch I., Paar M., Fredriksen S., Schwanitz M., Daniel C., Hop H., et al. (2016). Changes in Kelp Forest Biomass and Depth Distribution in Kongsfjorden, Svalbard, Between 1996–1998 and 2012–2014 Reflect Arctic Warming. Polar Biol. 39, 2021–2036. doi: 10.1007/s00300-015-1870-1
Bekkby T., Moy F. E. (2011). Developing Spatial Models of Sugar Kelp (Saccharina Latissima) Potential Distribution Under Natural Conditions and Areas of its Disappearance in Skagerrak. Estuar. Coast. Shelf Sci. 95, 477–483. doi: 10.1016/j.ecss.2011.10.029
Bekkby T., Moy F. E., Olsen H., Rinde E., Bodvin T., Bøe R., et al. (2013). “The Norwegian Programme for Mapping of Marine Habitats - Providing Knowledge and Maps for ICZMP,” in Global Challenges in Integrated Coastal Zone Management. Eds. Moksness E., Dahl E., Støttrup J. (Oxford, UK: John Wiley & Sons, Ltd), 19–30. doi: 10.1002/9781118496480.ch2
Bekkby T., Rinde E., Erikstad L., Bakkestuen V. (2009). Spatial Predictive Distribution Modelling of the Kelp Species Laminaria Hyperborea. ICES J. Mar. Sci. 66, 2106–2115. doi: 10.1093/icesjms/fsp195
Belgrano A., Clausen P., Ejdung G., Gamfeldt L., Gundersen H., Hammer M., et al. (2018). “Biodiversity and Ecosystem Services in Nordic Coastal Ecosystems: An IPBES-Like Assessment,” in The General Overview, vol. 1 . Ed. Belgrano Copenhagen A. (Denmark: Nordic Council of Ministers; Nordic Council of Ministers), 536. TemaNord 2018. doi: 10.6027/TN2018-536
Bolton J. J., Lüning K. (1982). Optimal Growth and Maximal Survival Temperatures of Atlantic Laminaria Species (Phaeophyta) in Culture. Mar. Biol. 66, 89–94. doi: 10.1007/BF00397259
Bruntse G., Lein T. E., Nielsen R. (1999). Response to Wave Exposure by Littoral Species in the Faroe Islands. Fródskaparrit-Ann. Soc. Sci. Færoensis 47, 181–198. https://plen.ku.dk/english/employees/?pure=en%2Fpublications%2Fresponse-to-wave-exposure-by-littoral-species-in-the-faroe-islands(f40b63f0-74c8-11db-bee9-02004c4f4f50)%2Fexport.html
Burrows M. (2020). Wave Fetch GIS Layers for Europe at 100m Scale. Figshare Dataset. doi: 10.6084/m9.figshare.8668127
Christie H., Gundersen H., Rinde E., Filbee-Dexter K., Norderhaug K. M., Pedersen T., et al. (2019a). Can Multitrophic Interactions and Ocean Warming Influence Large-Scale Kelp Recovery? Ecol. Evol. 9, 2847–2862. doi: 10.1002/ece3.4963
Christie H., Sogn Andersen G., Bekkby T., Fagerli C. W., Gitmark J. K., Gundersen H., et al. (2019b). Shifts Between Sugar Kelp and Turf Algae in Norway: Regime Shifts or Fluctuations Between Different Opportunistic Seaweed Species? Front. Mar. Sci. 6. doi: 10.3389/fmars.2019.00072
Dahl L., Dahl K. (2002). Temporal, Spatial and Substrate-Dependent Variations of Danish Hard-Bottom Macrofauna. Helgol. Mar. Res. 56, 159–168. doi: 10.1007/s10152-002-0111-5
Duarte C. M. (2017). Reviews and Syntheses: Hidden Forests, the Role of Vegetated Coastal Habitats in the Ocean Carbon Budget. Biogeosciences 14, 301–310. doi: 10.5194/bg-14-301-2017
Duarte C. M., Cebrián J. (1996). The Fate of Marine Autotrophic Production. Limnol. Oceanogr. 41, 1758–1766. doi: 10.4319/lo.1996.41.8.1758
Duarte C. M., Middelburg J. J., Caraco N. (2005). Major Role of Marine Vegetation on the Oceanic Carbon Cycle. Biogeosciences 2, 1–8. doi: 10.5194/bg-2-1-2005
Dunton K., Dayton P. (1995). “The Biology of High Latitude Kelp”, in Ecology of Fjords and Coastal Waters. Eds. Skjoldal H., Hopkins C., Erikstad K., Leinaas H. (Amsterdam, The Netherlands: Elsevier Science B.V), 499–507.
Elith J., Leathwick J. R., Hastie T. (2008). A Working Guide to Boosted Regression Trees. J. Anim. Ecol. 77, 802–813. doi: 10.1111/j.1365-2656.2008.01390.x
Espriella M., Schaper T., Atchia A., Rose K., Lecours V. (2019). Habitat Mapping of Giant Kelp (Macrocystis Pyrifera) and Devil Weed (Sargassum Horneri) Off the Coast of Santa Catalina Island, California. McGill Sci. Undergraud. Res. J. 14, 34–49. https://geog.ufl.edu/2019/04/01/habitat-mapping-of-giant-kelp-macrocystis-pyrifera-and-devil-weed-sargassum-horneri-off-the-coast-of-santa-catalina-island-california/
Fagerli C. W., Norderhaug K. M., Christie H. C. (2013). Lack of Sea Urchin Settlement may Explain Kelp Forest Recovery in Overgrazed Areas in Norway. Mar. Ecol. Prog. Ser. 488, 119–132. doi: 10.3354/meps10413
Filbee-Dexter K., Pedersen M. F., Fredriksen S., Norderhaug K. M., Rinde E., Kristiansen T., et al. (2020). Carbon Export is Facilitated by Sea Urchins Transforming Kelp Detritus. Oecologia 192, 213–225. doi: 10.1007/s00442-019-04571-1
Filbee-Dexter K., Wernberg T. (2018). Rise of Turfs: A New Battlefront for Globally Declining Kelp Forests. BioScience 68, 64–76. doi: 10.1093/biosci/bix147
Filbee-Dexter K., Wernberg T., Fredriksen S., Norderhaug K. M., Pedersen M. F. (2019). Arctic Kelp Forests: Diversity, Resilience and Future. Glob. Planet. Change 172, 1–14. doi: 10.1016/j.gloplacha.2018.09.005
Fredriksen S., Karsten U., Bartsch I., Woelfel J., Koblowsky M., Schumann R., et al. (2019). “Biodiversity of Benthic Macro- and Microalgae From Svalbard With Special Focus on Kongsfjorden,” in The Ecosystem of Kongsfjorden, Svalbard. Eds. Hop H., Wiencke C. (Cham, Switzerland:Springer Nature Switzerland), 331–371. doi: 10.1007/978-3-319-46425-1_9
Fredriksen S., Kile M. R. (2012). The Algal Vegetation in the Outer Part of Isfjorden, Spitsbergen: Revisiting Per Svendsen’s Sites 50 Years Later. Polar Res. 31, 17538. doi: 10.3402/polar.v31i0.17538
Frigstad H., Gundersen H., Andersen G. S., Borgersen G., Kvile K. Ø., Krause-Jensen D., et al. (2021). Blue Carbon – Climate Adaptation, CO2 Uptake and Sequestration of Carbon in Nordic Blue Forests – Results From the Nordic Blue Carbon Project. Available at: https://norden.diva-portal.org/smash/record.jsf?pid=diva2%3A1525372&dswid=-957.
Gorman D., Bajjouk T., Populus J., Vasquez M., Ehrhold A. (2013). Modeling Kelp Forest Distribution and Biomass Along Temperate Rocky Coastlines. Mar. Biol. 160, 309–325. doi: 10.1007/s00227-012-2089-0
Graham M. H., Kinlan B. P., Druehl L. D., Garske L. E., Banks S. (2007). Deep-Water Kelp Refugia as Potential Hotspots of Tropical Marine Diversity and Productivity. Proc. Natl. Acad. Sci. U. S. A. 104, 16576–16580. doi: 10.1073/pnas.0704778104
Greenwell G., Boehmke B., Cunningham J. GBM Developers (2020). Gbm: Generalized Boosted Regression Models. In: R Package Version 2.1.5. https://CRAN.R-project.org/package=gbm.
Gundersen H., Bryan T., Chen W., Moy F. E., Sandman A. N., Sundblad G., et al. (2016). Ecosystem Services. In the Coastal Zone of the Nordic Countries. Available at: http://www.diva-portal.org/smash/record.jsf?pid=diva2%3A1067839&dswid=-1772.
Gundersen H., Christie H., de Wit H., Norderhaug K. M., Bekkeby T., Walday M. G. (2011). Report No. 6070-2010 CO2 Uptake in Marine Habitats – An Investigation in NIVA. Available at: https://niva.brage.unit.no/niva-xmlui/handle/11250/215208.
Gundersen H., Rinde E., Bekkby T., Hancke K., Gitmark J. K., Christie H. (2021). Variation in Population Structure and Standing Stocks of Kelp Along Multiple Environmental Gradients and Implications for Ecosystem Services. Front. Mar. Sci. 8. doi: 10.3389/fmars.2021.578629
Gunnarsson K., Hauksson E. (2009). Succession and Benthic Community Development in the Sublittoral Zone at the Recent Volcanic Island, Surtsey, Southern Iceland. Surtsey Res. 12, 161–166. https://surtsey.is/wp-content/uploads/2019/08/2009-XII_161-166_Succession-hi_01.pdf
Hijmans R. J. (2022). raster: Geographic Data Analysis and Modeling R Package Version 3.1-15. Available at: https://CRAN.R-project.org/package=raster.
Hijmans R. J., Phillips S., Leathwick J., Elith J. (2020). dismo: Species Distribution Modeling R Package Version 1.3-3. Available at: https://CRAN.R-project.org/package=dismo.
Himes-Cornell A., Pendleton L., Atiyah P. (2018). Valuing Ecosystem Services From Blue Forests: A Systematic Review of the Valuation of Salt Marshes, Sea Grass Beds and Mangrove Forests. Ecosyst. Serv. 30, 36–48. doi: 10.1016/j.ecoser.2018.01.006
Hop H., Kovaltchouk N. A., Wiencke C. (2016). Distribution of Macroalgae in Kongsfjorden, Svalbard. Polar Biol. 39, 2037–2051. doi: 10.1007/s00300-016-2048-1
Hurd C. L., Law C. S., Bach L. T., Britton D., Hovenden M., Paine E., et al. (2022). Forensic Carbon Accounting: Assessing the Role of Seaweeds for Carbon Sequestration. J. Phycol. doi: 10.1111/jpy.13249
Díaz S. M., Settele J., Brondízio E., Ngo H., Guèze M., Agard J, et al. (2019). Summary for Policymakers of the Global Assessment Report on Biodiversity and Ecosystem Services of the Intergovernmental Science-Policy Platform on Biodiversity and Ecosystem Services. Eds. Díaz S., Settele J., Brondízio E. S., Ngo H. T., Guèze M., Agard J., et al. (Bonn, Germany: IPBES secretariat). doi: 10.5281/zenodo.3553579
Jayathilake D. R. M., Costello M. J. (2020). A Modelled Global Distribution of the Kelp Biome. Biol. Conserv. 252, 108815. doi: 10.1016/j.biocon.2020.108815
Karlsson J. (2007). Övervakning Av Vegetationsklädda Hårdbottnar Vid Svenska Västkusten 1993-2006 (Göteborg, Sweden: Göteborgs Universitet).
Krause-Jensen D., Archambault P., Assis J., Bartsch I., Bischof K., Filbee-Dexter K., et al. (2020). Imprint of Climate Change on Pan-Arctic Marine Vegetation. Front. Mar. Sci. 7. doi: 10.3389/fmars.2020.617324
Krause-Jensen D., Duarte C. M. (2016). Substantial Role of Macroalgae in Marine Carbon Sequestration. Nat. Geosci. 9, 737–742. doi: 10.1038/ngeo2790
Krause-Jensen D., Lavery P., Serrano O., Marba N., Masque P., Duarte C. M. (2018). Sequestration of Macroalgal Carbon: The Elephant in the Blue Carbon Room. Biol. Lett. 14 (6), 20180236. doi: 10.1098/rsbl.2018.0236
Krause-Jensen D., Marbà N., Olesen B., Sejr M. K., Christensen P. B., Rodrigues J., et al. (2012). Seasonal Sea Ice Cover as Principal Driver of Spatial and Temporal Variation in Depth Extension and Annual Production of Kelp in Greenland. Glob. Change Biol. 18, 2981–2994. doi: 10.1111/j.1365-2486.2012.02765.x
Krause-Jensen D., Sejr M. K., Bruhn A., Rasmussen M. B., Christensen P. B., Hansen J. L. S., et al. (2019). Deep Penetration of Kelps Offshore Along the West Coast of Greenland. Front. Mar. Sci. 6. doi: 10.3389/fmars.2019.00375
Krumhansl K. A., Okamoto D. K., Rassweiler A., Novak M., Bolton J. J., Cavanaugh K. C., et al. (2016). Global Patterns of Kelp Forest Change Over the Past Half-Century. Proc. Natl. Acad. Sci. U.S.A. 113, 13785–13790. doi: 10.1073/pnas.1606102113
Møller Nielsen M., Paulino C., Neiva J., Krause-Jensen D., Bruhn A., Serrão E. A. (2016). Genetic Diversity of Saccharina Latissima (Phaeophyceae) Along a Salinity Gradient in the North Sea-Baltic Sea Transition Zone. J. Phycol. 52, 523–531. doi: 10.1111/jpy.12428
Macreadie P. I., Anton A., Raven J. A., Beaumont N., Connolly R. M., Friess D. A., et al. (2019). The Future of Blue Carbon Science. Nat. Commun. 10, 1–13. doi: 10.1038/s41467-019-11693-w
MarineRegions.org. (2021). Flanders Marine Institute. Available at: https://www.marineregions.org/eezmapper.php.
Moy F. E., Christie H. (2012). Large-Scale Shift From Sugar Kelp (Saccharina Latissima) to Ephemeral Algae Along the South and West Coast of Norway. Mar. Biol. Res. 8, 309–321. doi: 10.1080/17451000.2011.637561
Munda I. M. (1987). Distribution and Use of Some Economically Important Seaweeds in Iceland. Hydrobiologia 151, 257–260. doi: 10.1007/BF00046138
Nellemann C., Corcoran E., Duarte C. M., Valdeís L., De Young C., Fonseca L., et al. (2009). Blue Carbon: A Rapid Response Assessment.
Norderhaug K. M., Christie H. C. (2009). Sea Urchin Grazing and Kelp Re-Vegetation in the NE Atlantic. Mar. Biol. Res. 5, 515–528. doi: 10.1080/17451000902932985
Öberg J. (2006). Primary Production by Macroalgae in Kattegat, Estimated From Monitoring Data, Seafloor Properties, and Model Simulations. Cont. Shelf Res. 26, 2415–2432. doi: 10.1016/j.csr.2006.07.005
Pedersén M., Snoeijs P. (2001). Patterns of Macroalgal Diversity, Community Composition and Long-Term Changes Along the Swedish West Coast. Hydrobiologia 459, 83–102. doi: 10.1023/A:1012506507322
Raybaud V., Beaugrand G., Goberville E., Delebecq G., Destombe C., Valero M., et al. (2013). Decline in Kelp in West Europe and Climate. PloS One 8, 1–10. doi: 10.1371/journal.pone.0066044
R Core Team. (2020). R: A Language and Environment for Statistical Computing. Available at: http://www.r-project.org/.
Rinde E., Christie H., Fagerli C. W., Bekkby T., Gundersen H., Norderhaug K. M., et al. (2014). The Influence of Physical Factors on Kelp and Sea Urchin Distribution in Previously and Still Grazed Areas in the NE Atlantic. PloS One 9, e100222. doi: 10.1371/journal.pone.0100222
Rinde E., Hjermann D. Ø., Staalstrøm A. (2016). Report No. 7016-2016 Larvae Drift Simulations of the Pacific Oyster in Skagerrak – Influence of Climate Change on Larvae Development, Survival and Dispersal. https://niva.brage.unit.no/niva-xmlui/handle/11250/2386876.
Sayre R., Noble S., Hamann S., Smith R., Wright D., Breyer S., et al. (2019). A New 30 Meter Resolution Global Shoreline Vector and Associated Global Islands Database for the Development of Standardized Ecological Coastal Units. J. Oper. Oceanogr. 12, S47–S56. doi: 10.1080/1755876X.2018.1529714
Sbrocco E. J., Barber P. H. (2013). MARSPEC: Ocean Climate Layers for Marine Spatial Ecology. Ecology 94, 979–979. doi: 10.1890/12-1358.1
Smale D. A., Burrows M. T., Moore P., O’Connor N., Hawkins S. J. (2013). Threats and Knowledge Gaps for Ecosystem Services Provided by Kelp Forests: A Northeast Atlantic Perspective. Ecol. Evol. 3, 4016–4038. doi: 10.1002/ece3.774
Smith A. B. (2021). Enmsdm: Tools for Modeling Niches and Distributions of Species. R Package Version 0.5.3.3. Available at: http://www.earthSkySea.org.
Sogn Andersen G., Pedersen M. F., Nielsen S. L. (2013). Temperature Acclimation and Heat Tolerance of Photosynthesis in Norwegian Saccharina Latissima (Laminariales, Phaeophyceae). J. Phycol. 49, 689–700. doi: 10.1111/jpy.12077
Stål J., Pihl L. (2007). Quantitative Assessment of the Area of Shallow Habitat for Fish on the Swedish West Coast. ICES J. Mar. Sci. 64, 446–452. doi: 10.1093/icesjms/fsm018
Tyberghein L., Verbruggen H., Pauly K., Troupin C., Mineur F., De Clerck O. (2012). Bio-ORACLE: A Global Environmental Dataset for Marine Species Distribution Modelling. Glob. Ecol. Biogeogr. 21, 272–281. doi: 10.1111/j.1466-8238.2011.00656.x
Wegeberg S. (2011). “Benthic Flora”, in Eastern Baffin Bay – A Strategic Environmental Impact Assessment of Hydrocarbon Activities. Eds. Boertmann D. M., Mosbech A. (Roskilde, Denmark: Aarhus University, DCE – Danish Centre for Environment and Energy), 270.
Wegeberg S. (2013). “Benthic Flora”, in Disko West. A Strategic Environmental Impact Assessment of Hydrocarbon Activities. Eds. Boertmann D., Mosbech A. (Aarhus University), 48–55.
Wernberg T., Krumhansl K., Filbee-Dexter K., Pedersen M. F. (2019). “Status and Trends for the World’s Kelp Forests”, in World Seas: An Environmental Evaluation (Academic Press - Elsevier, London, United Kingdom), 57–78. doi: 10.1016/B978-0-12-805052-1.00003-6
Keywords: Kelp forest, distribution, Nordic Region, Laminaria, Saccharina, blue forest, boosted regression tree (BRT)
Citation: Kvile KØ, Andersen GS, Baden SP, Bekkby T, Bruhn A, Geertz-Hansen O, Hancke K, Hansen JLS, Krause-Jensen D, Rinde E, Steen H, Wegeberg S and Gundersen H (2022) Kelp Forest Distribution in the Nordic Region. Front. Mar. Sci. 9:850359. doi: 10.3389/fmars.2022.850359
Received: 07 January 2022; Accepted: 09 May 2022;
Published: 15 June 2022.
Edited by:
Stelios Katsanevakis, University of the Aegean, GreeceReviewed by:
Scott Bennett, University of Tasmania, AustraliaDominique Davoult, Sorbonne Universités, France
Copyright © 2022 Kvile, Andersen, Baden, Bekkby, Bruhn, Geertz-Hansen, Hancke, Hansen, Krause-Jensen, Rinde, Steen, Wegeberg and Gundersen. This is an open-access article distributed under the terms of the Creative Commons Attribution License (CC BY). The use, distribution or reproduction in other forums is permitted, provided the original author(s) and the copyright owner(s) are credited and that the original publication in this journal is cited, in accordance with accepted academic practice. No use, distribution or reproduction is permitted which does not comply with these terms.
*Correspondence: Kristina Ø. Kvile, a3Jpc3RpbmEua3ZpbGVAbml2YS5ubw==