 Maha Hoteit
 Edwina Zoghbi2
 Ayoub Al-Jawaldeh
- 1PHENOL Research Group (Public Health Nutrition Program-Lebanon), Faculty of Public Health, Lebanese University, Beirut, Lebanon
- 2Country Office for Lebanon, World Health Organization, Beirut, Lebanon
- 3Faculty of Arts and Sciences, Department of Nutrition and Food Sciences, Holy Spirit University of Kaslik, Jounieh, Lebanon
- 4World Health Organization Regional Office for the Eastern Mediterranean, Cairo, Egypt
Industrially produced trans fatty acids (IP-TFAs) are a major dietary contributor to non-communicable diseases worldwide. To address the industrially produced trans fatty acids food sources in Lebanon, a mapping exercise was enrolled between January 2019 and April 2021 to establish a national database. The 2019 survey was a pooled data from five separate sources and had relatively 30 types of traditional dishes. In contrast, the subsequent surveys in 2020 had a sample of 35 types of Arabic sweets and 80 types of market food products. The 2021 survey covered all types of butter and margarine available in the Lebanese markets. Our findings show that about 93% of the products tested in Lebanon, between 2019 and 2021, met the World Health Organization recommendations, while about 7% exceeded the limit. The mean level of the IP-TFAs elaidic and linolelaidic acids in most traditional dishes (0.9%), Arabic sweets (0.6%), butter, and margarine (1.6%), and market foods (0.52%) were relatively low compared with other countries. Although trans fatty acids have a small impact on heart disease mortality in Lebanon, they are unquestionably significant. The persistence of food products with high quantities of trans fatty acids poses a health risk to Lebanese citizens. Fortunately, proper laws in Lebanon can easily remedy this situation.
Introduction
In the past 50 years, the world has seen a dramatic shift in the causes of death and disabilities from infectious diseases and nutritional deficiencies to non-communicable diseases (NCDs) led by cardiovascular diseases (CVDs) (1), which causes an estimated 17.9 million deaths every year (2). As a result, the urgent need for policy measures to protect cardiovascular health is more apparent than ever and presents a historic imperative to prioritize and invest in public health by adopting health-promoting policy measures, including industrially produced trans fatty acids (IP-TFAs) elimination. Intake of IP-TFAs is associated with an increased risk of heart attacks and death from coronary heart disease (CHD) (3). A 2% absolute increase in energy intake (EI) from trans-fat has been associated with a 23% increase in cardiovascular risk (4). Although limited data are available on IP-TFAs intake globally, a recent report estimated that the 2017 global market volume of partially hydrogenated oils (PHOs), the main source of IP-TFAs in food, was ~13.6 million tones (5). PHOs constitute 25–45% of total fat (6). The most common non-conjugated IP-TFAs in the daily diet of humans are 18-carbon fatty acids with one double bond in the 9-carbon transposition or two double bonds in the 9 and 12 carbon, called elaidic acid (EA; 9t18:1) and linolelaidic acid (LEA; 9t12t18:2), respectively (7). EA, which is the trans form of oleic acid (OA, C18:1 cis), is the principal TFA found in partially hydrogenated vegetable oil and margarine. Following ingestion, EA is typically integrated into the plasma membrane of cells. EA has also been shown to induce oxidative stress; for example, an EA-rich diet caused oxidative stress in mice due to EA-induced reduction in plasma vitamin E levels (7). EA intake resulted in significant hyperlipidemia, inflammation, and fatty liver alterations (8). In addition, a recent study by Buyun Liu et al. found that plasma EA concentration is associated with a higher risk of depressive symptoms (9). Another study demonstrated that EA could change physiochemical surface properties of lactobacilli, an antimicrobial, cholesterol-lowering, immunoregulatory, and gut-beneficial bacteria (10). LEA is an omega-6 TFA (9E,12E-9t12t18:2), principally discovered in foods with fried or high-heat cooking or partially hydrogenated vegetable oils (11). It was suspected to enhance the adipogenic differentiation favoring obesity (11). Moreover, it was shown that LEA appeared to be potentially more detrimental than EA and that LEA contributed to higher risks of sudden cardiac death compared to other isomers (12). Furthermore, in a survey conducted by Qiu Bin et al., it is discovered that EA and LEA triggered endothelial cell apoptosis via the caspase pathway and the mitochondria pathway and that LEA induced higher human umbilical vein smooth muscle cell proliferation than EA (13). Around 58 countries have introduced laws to date that will protect more than 3 billion people from TFAs by the end of 2021 (14). However, more than 100 countries have yet to act to eliminate TFAs from their national food supply and make the world TFAs free by 2023 (14). The food industry is also becoming more receptive to replacing IP-TFAs in their products with healthier oils and fats. In 2018, TFAs elimination was identified as one of the priority targets in the WHO 13th General Programme of Work, which guides the 5-year work of WHO in 2019–2023 (14). Also in 2018, the REPLACE action package was launched to help countries in removing IP-TFAs from their food supplies (15). In addition, WHO released additional resources in 2019 to support country actions, including six implementation modules and a live policy tracking map, the TFAs Country Score Card 1, to monitor global progress toward the 2023 target (14). In 2020, WHO established a TFA indicator that records whether countries have adopted WHO best-practice policies for eliminating IP-TFAs (16). Their removal from the global food supply could prevent up to 17 million deaths by 2040 and would be the first time an NCD risk factor has been eliminated (17). The Eastern Mediterranean Region (EMR) has witnessed rapid modernization in the past 30 years that has led to a dramatic transformation affecting people's lifestyles and diet. The average intake of saturated fatty acids (SFAs) and TFAs in EMR exceeded the WHO upper limits and was estimated to be 10.3 percent and 1.9 percent of total EI, respectively (18). The highest SFAs intake was reported in Djibouti, Kuwait, Saudi Arabia, Lebanon, and Yemen, while the highest intake of TFAs was reported in Egypt and Pakistan. The main sources of TFAs in the region are margarine, biscuits, French fries, cereal-based foods, fast food, snacks, milk, bakery products, pie, and cake. Lower TFA content was reported in traditional foods (18). With a population estimate of around 6,803,105 million and a severe decline of the gross domestic product from the US $7,661 per capita in 2019 to the US $2,744 in 2020 (19), Lebanon is characterized by a high urbanization rate (88%) (20) coupled with westernization and modernization in diet and lifestyle and higher uptake of NCD risk factors. Similar to the region, the Lebanese population suffers from a high burden of NCDs, accounting for 91% of total annual deaths with CVDs responsible for 47% of total deaths (21). Because IP-TFAs increase the risk for heart disease and are estimated to cause more than 500,000 deaths per year (14) and based on the WHO recommendation that TFAs intake should not exceed 1% of total daily EI (equivalent to <2.2 g/day in a 2,000-calorie diet), providing baseline information on dietary sources of IP-TFAs in Lebanon is a crucial stepstone to reduce the risk of death and hospitalization by CVDs and is one of the strategic interventions under the area of prevention and reduction of risk factors in the Regional Framework for Action on NCDs (22). The main objectives of this article are to:
- Assess IP-TFA levels in frequently consumed traditional dishes, Arabic sweets, processed foods, butter, and margarine in Lebanon.
- Establish a stepping stone for required policies and regulations to mandate limits of TFA levels in oils and foods imported or produced locally.
Materials and Methods
A series of surveys were conducted over the past 2 years. The 2019 survey was not centrally coordinated but instead pooled data from five separate sources having the broadest geographical coverage in terms of location and had relatively a sample size of 30 types of traditional dishes. The samples were identified according to their frequency of consumption (23, 24) and selected for TFA analysis along with two non-conjugated fatty acids (EA and LEA) (25). In contrast, the subsequent surveys 2020 were centrally coordinated having the broadest coverage in terms of products selected and had a sample of 35 types of Arabic sweets and 46 types of market food products. The full methodology of food list identifications and food sampling is described elsewhere (25–27). On the other hand, the 2021 survey was nationally coordinated, with a coverage of 34 types of butter, ghee, and margarine purchased from the Lebanese markets. Lot numbers were checked to ensure that each unit belonged to a different lot. The samples were stored, labeled, and analyzed before expiry dates. Samples were selected to include all types of butter, ghee, and margarine in Lebanon. The analyses were carried out in duplicate for each sample. To further interpret current levels of TFAs and partially hydrogenated fatty acids in Lebanese foods, product categories were compared to similar products found in other countries.
Laboratory Analysis Protocol
After the receipt of food samples by the laboratory, 500 g of each sample was mashed, then analyzed. The remaining samples were kept frozen at −18°C in tight containers for further analysis. The fatty acid profile was measured using gas chromatography. Each analysis method was selected considering guidance from the technical committee at the Industrial Research Institute laboratories in Beirut and following standardized protocols. The Association of Official Analytical Chemists (AOAC) methods were used for the analysis of nutrients in food matrices (28). The full details about the measurement techniques are listed in the study described by Hoteit et al. (27), Association of Official Analytical Chemists (28), and Hoteit et al. (29).
The sum of trans fatty acids was calculated accordingly (28). TFA isomers were later on detected through SP-2560 100-m capillary column (180°C isothermal, H2 at 1.0 mL/min) (30).
Results
Trans Fatty Acid Acids in Frequently Consumed Traditional Dishes
Appetizers, Pastries, and Composite Dishes by Governorates
The mean levels of IP-TFAs in the traditional dishes among all governorates together (average:0.9%) ranged from <0.1 to 1.9 g/100 g of total fat except the dishes Riz a dajaj and Shawarma Lahma, which contained an amount of EA and LEA that both exceeded 2% of fat (Table 1). The comparison between the mean values of the IP-TFA (EA and LEA) in the traditional dishes tested shows that EA was significantly higher than LEA in all traditional dishes (p = 0.00). Per each governorate, the mean level of IP-TFAs in all dishes was 0.4% in Mount Lebanon (average: 0.4%; range: <0.1–2.1%), 1.1% in Beqaa (average: 1.1%; range: <0.1–2.3%), 0.8% in Beirut (average: 1.1%; range: <0.1–11.2%), 1.5% in Tripoli (average: 1.5%; range: <0.1–10.6%), and 0.8% in Saida (average: 0.8%; range: <0.1–2%) (data not shown). Moreover, per each governorate, the mean level of EA was 0.6% in Mount Lebanon, 0.9% in Beqaa, 0.9% in Beirut, 1.2% in Tripoli, and 0.6% in Saida (data not shown).
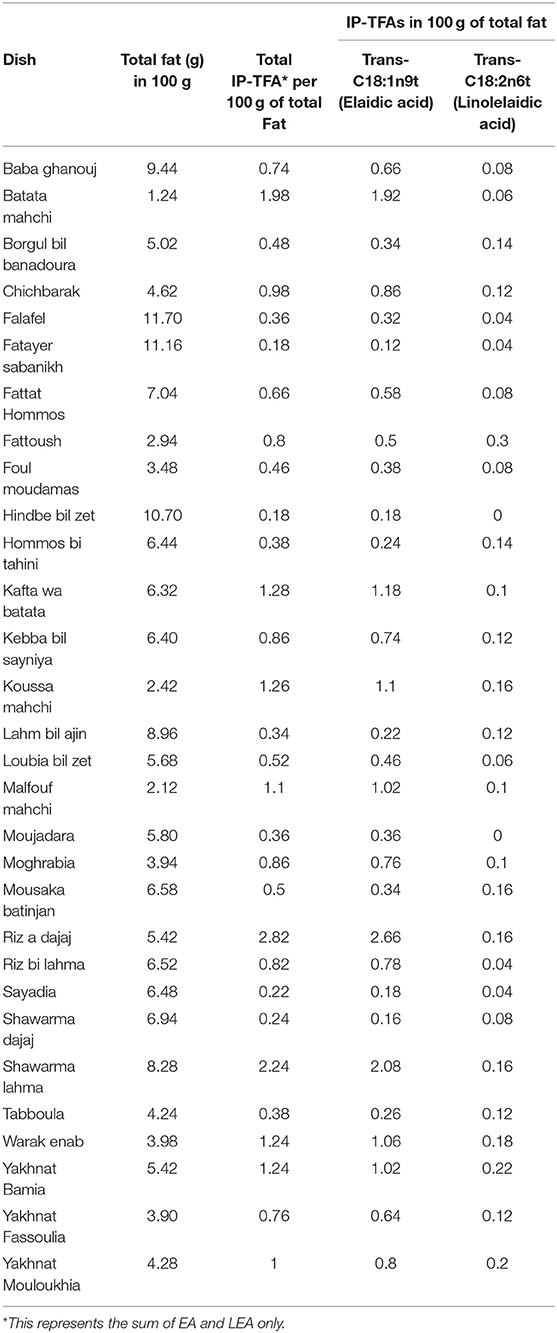
Table 1. Mean levels of total fat in 100 g of edible portions, total IP-TFAs, and IP-TFAs (EA and LEA) in 100 g of fat of frequently consumed traditional dishes among all Lebanese governorates.
Trans Fatty Acid Acids in Frequently Consumed Arabic Sweets
The total average of IP-TFAs in all samples of Arabic sweets was 0.6%, predominantly from EA type (Table 2). Among 35 samples of Arabic sweets, none exceeded 2% as total IP-TFA in 100 g of total fat. The comparison between the mean values of the IP-TFA (EA and LEA) in the Arabic sweets tested shows that EA was significantly higher than LEA in Arabic sweets (p = 0.00).
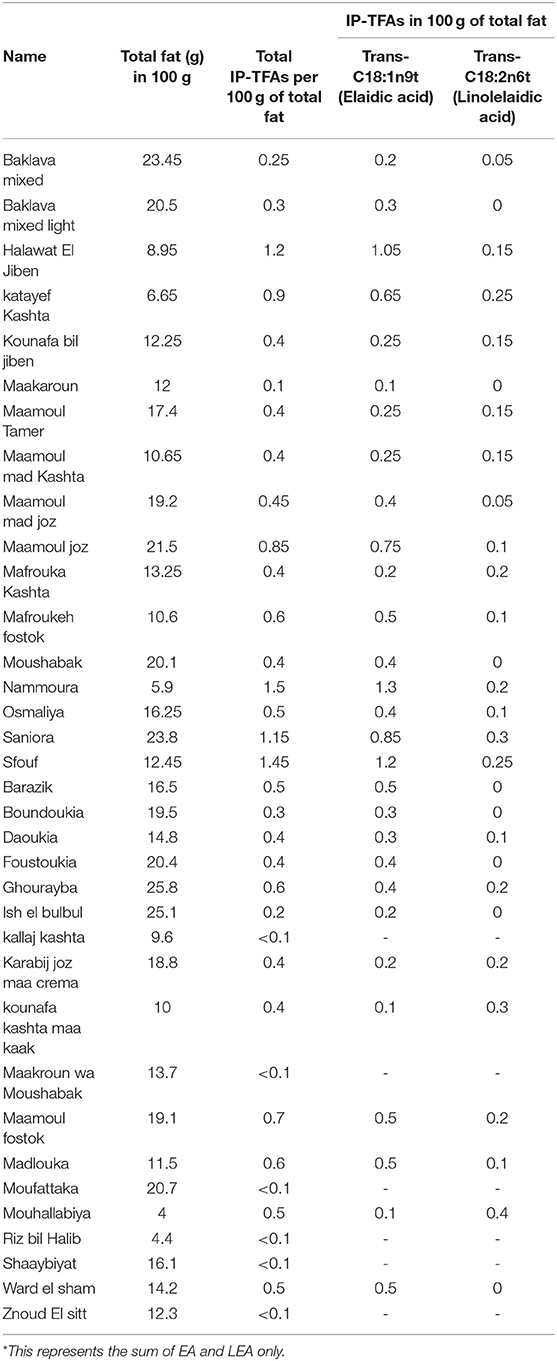
Table 2. Mean levels of total fat in 100 g of edible portions, total IP-TFAs, and IP-TFAs (EA and LEA) in 100 g of total fat of frequently consumed Arabic sweets.
Trans Fatty Acid in Market Foods
Cereals and Bread Group
In the group of cereals and bread, the mean level of IP-TFAs was <2% of total fat except for pain au lait, which is usually prepared from wheat, milk, and butter or ghee to be consumed frequently by children as a sandwich (Table 3).
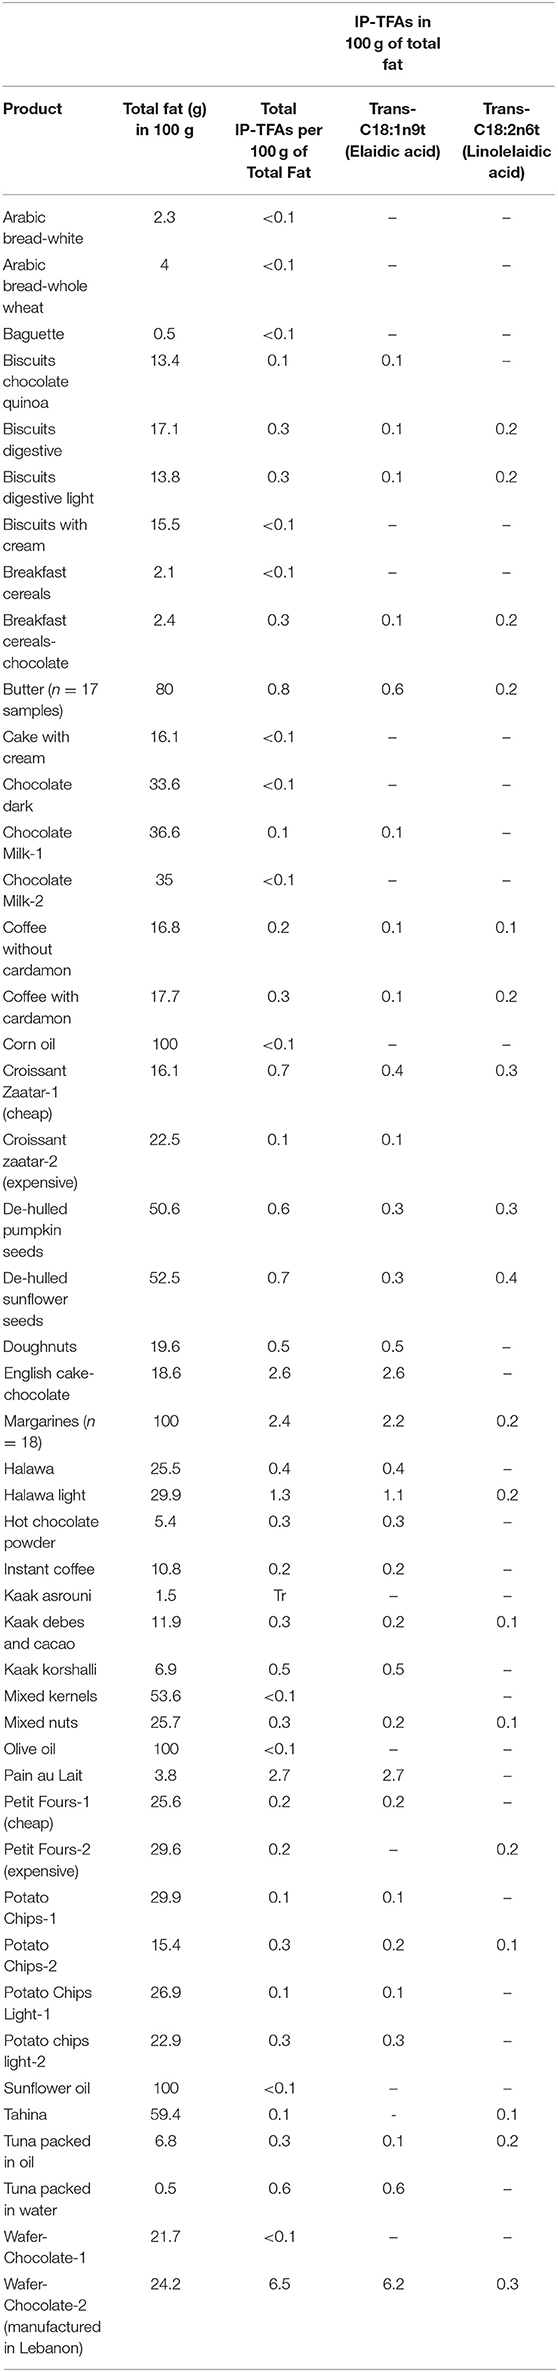
Table 3. Total fat in 100 g of edible portions, total IP-TFAs, and IP-TFAS (EA and LEA) in 100 g of total fat of market food products collected from Lebanese markets.
Butter and Margarine
Particular attention was given to the butter and margarine group as these are used as ingredients, and therefore among the main sources of TFAs in processed foods. The average of total IP-TFAs in 18 margarine used frequently in Lebanon was 2.4% (Table 3) with a range between <0.1 and 11.8% (data not shown). The dominant IP-TFA was EA in almost all these products (Table 3). Within the group of butter, none of the samples exceeded 2% of total fat. The average of total IP-TFAs in the butter and margarine group was 1.6% of total fat, in which EA predominates in these products. In general, the level of total IP-TFAs in cooking oils, Halawa and Tahina, was negligible (Table 3, Figure 1). In addition, Figure 1 shows that the average of total IP-TFAs was equal to 1.6% in the group of butter and margarine.
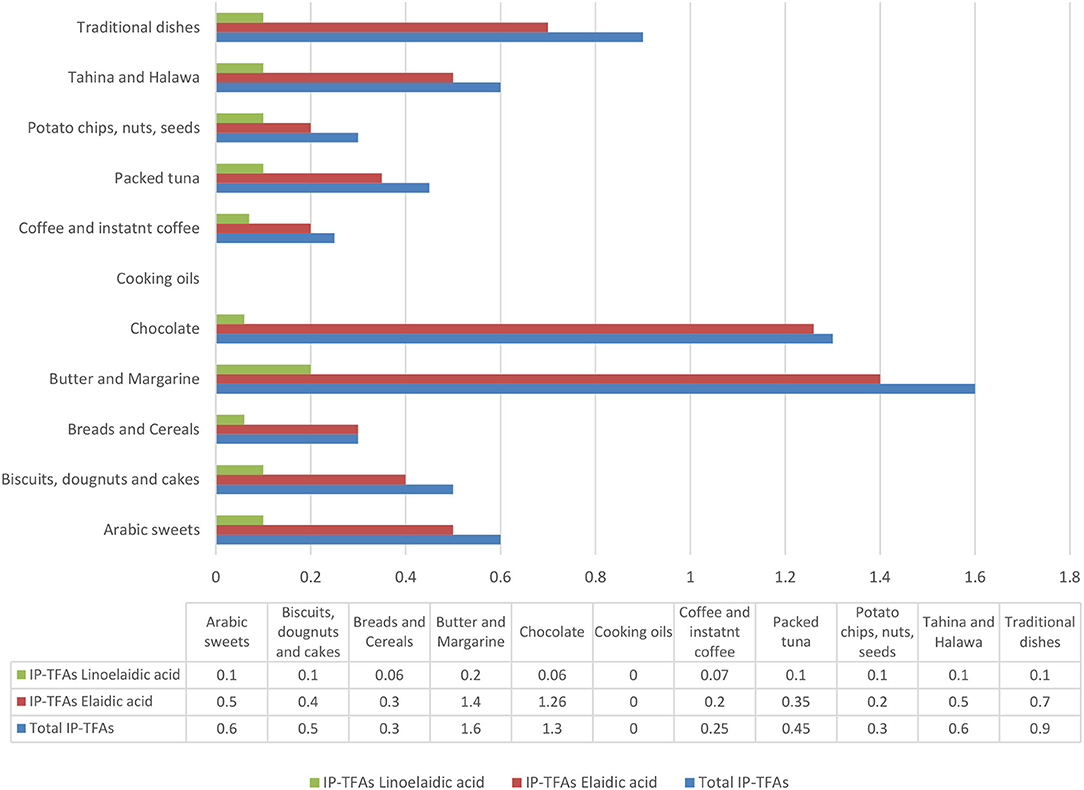
Figure 1. Total IP-TFAs and IP-TFAs averages in all Lebanese food groups tested in this mapping exercise.
Snacks and Processed Foods
As for the group of biscuits, doughnuts, and cakes group, negligible amounts of IP-TFAs were found in these products (average: 0.5%) (Figure 1). On the other hand, the unlabeled English cake (chocolate flavor) had an apparently high amount of total IP-TFAs (2.6% in the total fat), in which EA was dominantly available (Table 3). Despite being unable to discuss the fat type used in unlabeled samples, based on these data, partially hydrogenated fats were certainly present in high amounts.
The data on chocolate products presented an amount of 1.3% as total IP-TFAs (Figure 1), except for the case of wafer-coated chocolate originally manufactured in Lebanon, which contains a level of 6.5% (Table 3).
According to Table 3, Figure 1, it appears that all samples of potato chips, nuts, seeds, coffee, instant coffee, and packed tuna contained low amounts of total IP-TFAs that are below 2% of total fat.
When comparing the mean values of the IP-TFAs (EA and LEA) in the market foods, EA and LEA did not show any significant difference (p = 0.16).
Comparison Between Market Foods Nutrient Content and Nutrition Facts Label
All the products were found to have discrepancies in reporting the actual nutrient content when compared to their respective nutrition facts label (Table 4). For instance, some products such as sunflower and olive oil had matching values for fat content. As for the SFAs content, there was a discrepancy between the nutrition label and nutrient content of the chocolate wafers-brand 2 (19.1/100 g and 9/100 g), chocolate with milk (36.1/100 g and 46/100 g), chocolate-dark (33.1/100 g and 23.3/100 g), and potato chips (20.2/100 g and 10/100 g). With regard to TFAs, it was either mentioned as 0 g or not reported on the nutrition label, while analysis showed traces of TFAs in the foods (Table 4). The comparison between the mean values of fat, SFA, and TFA reported on the label and that analyzed in the laboratory showed no major differences (p = 0.77, 0.173, and 0.264, respectively).
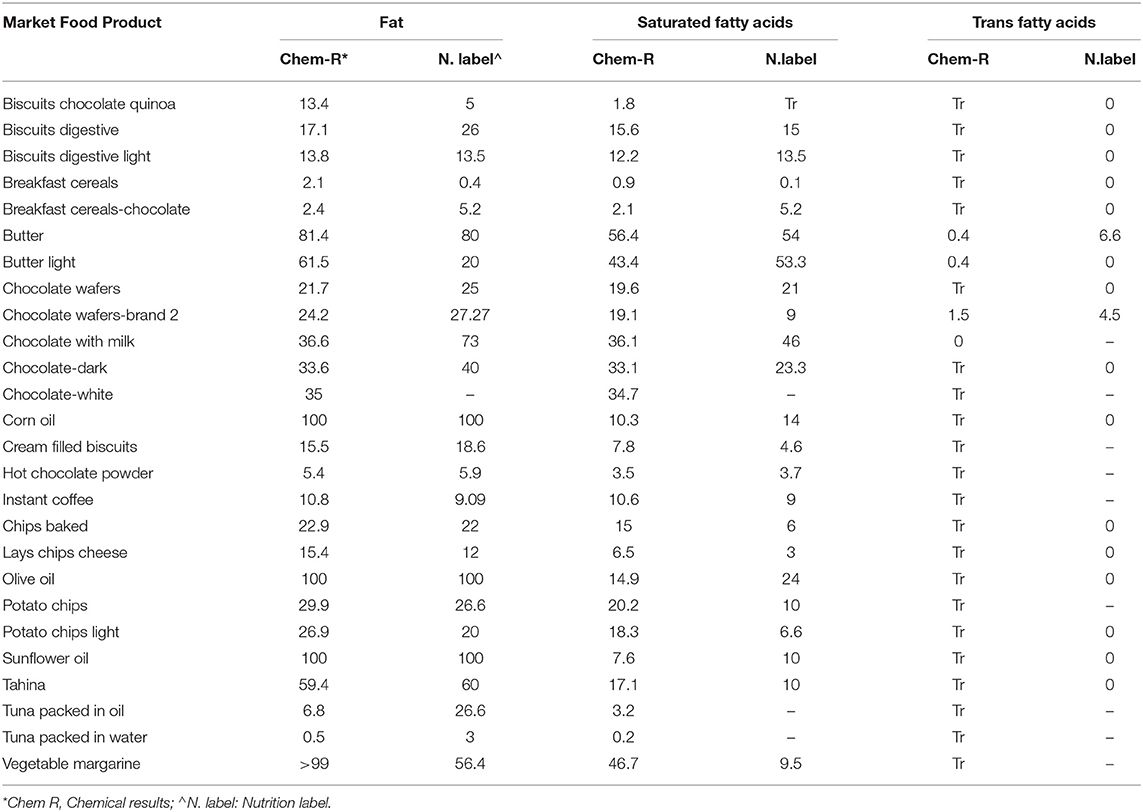
Table 4. Comparison between actual nutrient analysis values of some market-processed food products and reported nutrient values on nutrition fact label.
Discussion
Industrially Produced Trans Fatty Acid Content in Frequently Consumed Foods in Lebanon Compared With Different Countries
The available data demonstrate that categories with the highest IP-TFA levels included Riz a dajaj, Shawarma Lahma, Pain au lait, English cake, Chocolate wafers, and margarine. About 93% of the products tested in Lebanon, between 2019 and 2021, met the WHO recommendations (less than 2% of trans fatty acid in total fat), while about 7% exceeded the limit. As per Tables 1–3, all in all, EA was dominant in almost all the analyzed samples, and its higher amount indicates that hydrogenated oils were a major contributor in the processing of food products or baking and cooking meals. In comparison with other countries all over the globe, a broad range of EA was observed in many food products (Table 4). For instance, the mean level of EA in Baklava (0.2%) was relatively low in our study in comparison with the content of EA in Iran (2.5%) (31). Furthermore, our findings showed that the mean levels of EA in cakes (2.6%) were much lower than the content of EA found in cakes in France (18.5–25.6%) (32), Iran (6.95–18%) (31–33), Poland (7.95%) (34), India (1.92–3.93%) (35), and higher than EA cake content tested in Lebanon in 2015 (1.7%) (36), Korea (1.36%) (37), Turkey (0.37%−1.43%) (38), New Zealand (0.9%) (39), and Malaysia (<0.001%) (40) (Table 4). In addition, the mean levels of EA in biscuits in Iran (9–12.86%) (33), Lebanon 2015 (3.7%) (36), Poland (2.81%) (34), Korea (2.4%) (37), New Zealand (0.9%) (39), and Germany (0.18%) (41) were higher than our results (0.1%), except for Malaysia (<0.001%) (40) and India (0.01%) (35) (Table 4). As for the breakfast cereals, the mean level of EA in our study (0.1%) was much lower than in France (28.9–32.4%) (32) and Korea (0.5–6.75%) (37), and higher than in the UK (0.03%) (42) and Malaysia (<0.001%) (40) (Table 4). Moreover, our finding showed that the mean level of EA in chocolate wafers was 6 times more than EA content in chocolate wafers in Malaysia (40). As for the butter, the New Zealand (39) and Costa Rican butter (43) contained five times more EA, and the Pakistani butter (44) contained three more times EA, compared with our results (Table 4). However, the butter in UK, Germany, and Iran contained 0.22% (42), 0.23% (41), and 0.3% (33) EA, respectively; this is lower than the content of EA tested in our study (0.6%) (Table 4). Also, Table 4 shows that the margarine in Slovenia contained the highest content of EA (34.63%) (45) compared to our findings (2.2%) and other countries. As for the EA content in chips, Iranian chips showed the highest level of EA (10%) compared to our results (0.1–0.3%) and other countries (33) (Table 5). On the other hand, the results of LEA in the food products tested in our study and those in other countries are available in Table 5.

Table 5. Industrially produced trans fatty acids (EA and LEA) in 100 g of total fat per food group among different countries.
Trans Fatty Acid Content in Frequently Consumed Foods in Lebanon Compared to Eastern Mediterranean Countries
Compared to other countries, the average of TFAs in Arabic sweets (0.6/100 g of total fat), bakery products (0.6/100 g of total fat), and biscuits (0.17/100 g of total fat) in our study was relatively low compared to Jordan (4.08, 2.46, and 2.82/100 g of total fat, respectively) (61). Furthermore, the average of TFAs in biscuits in Iran in 2015 (12.86/100 g of total fat) (31), Lebanon in 2015 (9.7/100 g of total fat) (36), and Pakistan (9.3/100 g of total fat) (62) was higher than the value reported in our current study. As for butter and margarine, the highest content of TFAs was observed in Pakistan (9.3–34.9 /100 g of total fat) (62) followed by Morocco (9.1–21.7/100 g of total fat) (63) and the lowest level was observed in our current report. Similarly, cakes in Pakistan contained also the highest level of TFAs (12.02/100 g of total fat) (62) compared to Iran (2015) (6.9/100 g of total fat) (31), Lebanon in 2015 (5.8/100 g of total fat) (36), Jordan (3.4/100 g of total fat) (61), and our current findings (1.3/100 g of total fat). It was observed that cereals and bread tested in Pakistan (14.4/100 g of total fat) (62) contained the highest levels compared to our study (0.15/100 g of total fat) and Jordan cereal-based foods (2.5/100 g of total fat) (61). Furthermore, a decrease in TFAs was observed between the “croissant” tested in this report (0.4/100 g of total fat) and the samples tested in Lebanon 6 years ago (7.8/100 g of total fat) (36). Compared to Iran (2013 and 2016) (0.45–0.72/100 g of total fat) (54–57), to Jordan (0.61/100 g of total fat) (61), to Pakistan (0.96/100 g of total fat) (62), and Tunisia (0.73/100 g of total fat) (60), edible oils tested in our report were TFAs free. Chocolate samples and wafers in our study presented a broad range of TFAs. In the chocolate samples tested currently, the average of TFAs was 0.03%, which was lower than the values reported in Iran (1.24/100 g of total fat) (31) and Pakistan (4.5/100 g of total fat) (62). Although the wafers sold in Lebanese supermarkets and tested recently contained the lowest levels of TFAs (3.25/100 g of total fat) compared to the oldest values in 2015 (14.8/100 g of total fat) (36), it appears that a locally manufactured wafer contained 6/100 g of total fat of TFAs, which exceeded the WHO recommendations. Compared to Morocco (2.1/100 g of total fat) (63) and Jordan (4.8/100 g of total fat) (61), the TFAs average of traditional dishes was relatively low (0.92/100 g of total fat) (Appendix-Table I).
Trans Fatty Acid Intake in Lebanon Compared to Eastern Mediterranean Countries
According to Appendix I, few studies reported that TFAs consumption levels in EMR and estimates were found to range between 0.28 % EI in Tunisia (based on the national survey conducted among adults in 2005) (18) and to reach as high as 6.5% EI in Egypt (64). The value of TFAs intake reported in Lebanon in 2016 (2.3% EI) (65) was relatively high compared to the WHO recommendations of 1% EI. On the other hand, the proportion of CHD deaths due to TFA intake was low in Lebanon (1.02%) compared to the mean of Eastern Mediterranean countries proportions (2.61%). The highest mortality by CHD due to TFA was observed in Egypt followed by Iran and Pakistan (16). Iran and Pakistan implemented mandatory limits to control TFA in foods along with Bahrain, Kuwait, Saudi Arabia, and Jordan in which the death by CHD due to TFA is among the lowest in the region (1.02%).
Comparison Between Lebanese Market Basket Investigation and Other Global and Regional Market Investigations
According to many studies, there was an impact of TFAs and PHFAs labeling on reducing the burden of CVDs due to IP-TFAs (66). According to an unpublished study conducted by our team, 32% only of the products available in the Lebanese markets reported IP-TFAs on their labels (data not shown). Our finding came to hand in hand with Kamel et al. (67), in which 181 food products were sampled from local supermarkets in Saudi Arabia and showed that one-third of the products mentioned IP-TFAs on the nutrition label. Moreover, while the majority of the investigated samples in our project had low levels of IP-TFAs, up to 14 g of TFAs per 100 g of food was observed in certain oils and fats sold at the Lebanese markets. Our findings, concerning the range of IP-TFAs in market products, were relatively low compared to the market investigations published in Stender et al. (68, 69).
Investigation of the Country of Origin of Imported Food Products in Lebanon
Lebanon imported its food products from France (107,957$), Germany (98,250$), Turkey (97,015$), the United Kingdom (75,571$), Italy (70, 571$), Argentina (69,989$), Saudi Arabia (64, 332$), and the United States (57,785$). In addition, the main importation sources of butter, oils, and fats are Denmark, the Netherlands, France, Belgium, Ukraine, New Zealand, the United Kingdom, and Argentina (All of us deal with IP-TFA consumption's clinical aftermath and all of us should be interested in stopping this threat) (20). According to the nutrition labels of tested butter and margarine, the countries of origin from which all the butter and margarine were imported to Lebanon were Turkey (n = 5), Egypt (n = 4), Malaysia (n = 3), Saudi Arabia (n = 1), Sri Lanka (n = 3), UAE (n = 1), Netherland (n = 2), Belgium (n = 3), France (n = 4), Italy (n = 1), Ukraine (n = 1), Germany (n = 2), and Denmark (n = 2) (data not shown). Among all these countries, 33 percent (5 countries over 15) are implementing mandatory national limits and adopting monitoring mechanisms for mandatory of IP-TFAs limits. On the other hand, in the remaining countries, the best-practice TFAs policy passed but was not yet in effect (16). Lebanon, long considered a middle-income country, is rapidly sinking into poverty as it faces a triple shock from the unprecedented economic crisis, the impact of COVID-19 on employment and public health, and the consequences of the Beirut port explosion. Despite that, the actual relative impact of IP-TFAs exposure on heart disease mortality in Lebanon is limited but unambiguously still considerable. The findings in our report highlight the importance of controlling the importation of food products from countries controlling IP-TFA levels in food to avoid sinking Lebanese markets with IP-TFA-rich food products (20), both of which are often ultra-processed, unhealthy, and rich in IP-TFAs. Therefore, this population group is at higher risk of TFA-attributable CVDs.
This study presents some limitations. First, there are many challenges facing the laboratories in Lebanon concerning the testing of IP-TFA, and the lack of standards limits testing other forms of isomers. Second, the food products compared between regions were compared in terms of food groups and not in terms of brands. Moreover, the comparison between traditional dishes or Arabic sweets omits the cooking preparations and ingredients. Third, in the current study, the WHO technique was followed to test the IP-TFA levels in foods tested; however, this was not always reported in many other countries.
Conclusion
For the first time in Lebanon, a valid TFA database is available and ready to be used by healthcare providers. There is more than enough convincing evidence that a high IP-TFAs intake is detrimental to cardiovascular health. Fortunately, this problem in Lebanon is fairly easy to solve via proper legislation. However, the persistence of food products with high IP-TFA levels in Lebanon means that subgroups of the Lebanese population, mainly vulnerable and food-insecure people, are threatened by high levels of TFAs due to frequent consumption of risky products. The inauguration and implementation of policies to curtail IP-TFAs in Lebanon may therefore be legitimized, and such efforts should underline added fats and packaged foods due to the economic crises in which people opt to select cheap oils, including butter, ghee, and margarine instead of vegetable oils. We all deal with the clinical consequences of IP-TFA consumption, and we should all be engaged in putting an end to this threat. Although trans fatty acids have a small impact on heart disease mortality in Lebanon, they are unquestionably significant. The persistence of food products with high quantities of trans fatty acids poses a health risk to Lebanese citizens. Fortunately, proper laws in Lebanon can easily remedy this situation.
Data Availability Statement
The original contributions presented in the study are included in the article/Supplementary Material, further inquiries can be directed to the corresponding author/s.
Author Contributions
MH involved in conceptualization, data curation, formal analysis, investigation, methodology, project administration, supervision, validation, and writing the original draft preparation. EZ was involved in conceptualization, methodology, project administration, writing the original draft preparation, and writing the review and editing. AR and IS involved in methodology, project administration, supervision, and writing the review and editing. CI was involved in writing the review and editing. AA-J involved in data curation, methodology, project administration, supervision, validation, and writing the review and editing. All authors contributed to the article and approved the submitted version.
Funding
This project was funded by RESOLVES to SAVE LIVES.
Author Disclaimer
The authors alone are responsible for the views expressed in this article, and they do not necessarily represent the views, decisions, or policies of WHO or the other institutions with which the authors are affiliated.
Conflict of Interest
The authors declare that the research was conducted in the absence of any commercial or financial relationships that could be construed as a potential conflict of interest.
Publisher's Note
All claims expressed in this article are solely those of the authors and do not necessarily represent those of their affiliated organizations, or those of the publisher, the editors and the reviewers. Any product that may be evaluated in this article, or claim that may be made by its manufacturer, is not guaranteed or endorsed by the publisher.
Acknowledgments
The authors would like to thank the laboratory technician Mr. Halim El Bayeh at the Industrial Research Institute, the Research assistants Ms. Nadia Hallak and Mrs. Iman Kheir, and the students Ms. Jessica Khalifeh and Ms. Layla Abadi at the Lebanese University.
Supplementary Material
The Supplementary Material for this article can be found online at: https://www.frontiersin.org/articles/10.3389/fnut.2021.727548/full#supplementary-material
References
1. Jelwan YA, Asbeutah AAA, Welty FK. Comprehensive review of cardiovascular diseases, diabetes, and hypercholesterolemia in Lebanon. Cardiol Rev. (2020) 28:73–83. doi: 10.1097/CRD.0000000000000290
2. Wang Q, Afshin A, Yakoob MY, Singh GM, Rehm CD, Khatibzadeh S, et al. Impact of nonoptimal intakes of saturated, polyunsaturated, and trans fat on global burdens of coronary heart disease. J Am Heart Assoc. (2016) 5:e002891. doi: 10.1161/JAHA.115.002076
3. World Health Organization. Noncommunicable Diseases: Key Facts. Geneva: World Health Organization (2018). Available online at: https://www.who.int/news-room/fact-sheets/detail/noncommunicable-diseases (accessed March 16, 2021).
4. Remig V, Franklin B, Margolis S, Kostas G, Nece T, Street JC. Trans fats in America: a review of their use, consumption, health implications, and regulation. J Am Diet Assoc. (2010) 110:585–92. doi: 10.1016/j.jada.2009.12.024
5. Persistence Market Research. PHO and non-PHO based oils and fats market: global industry analysis 2013–2017 and forecast 2018–2026 (2018).
6. World Health Organization. REPLACE trans fat: An Action Package to Eliminate Industrially Produced Trans-Fatty Acids. Module 3: Legislate or Regulate. How-to Guide for Trans Fat Policy Action. Geneva: World Health Organization (2020).
7. Ohmori H, Fujii K, Kadochi Y, Mori S, Nishiguchi Y, Fujiwara R, et al. Elaidic acid, a trans-fatty acid, enhances the metastasis of colorectal cancer cells. Pathobiology. (2017) 84:144–51. doi: 10.1159/000449205
8. Park KH, Kim JM, Cho K-H. Elaidic acid (EA) generates dysfunctional high-density lipoproteins and consumption of EA exacerbates hyperlipidemia and fatty liver change in zebrafish. Mol Nutr Food Res. (2014) 58:1537–45. doi: 10.1002/mnfr.201300955
9. Liu B, Sun Y, Xu G, Du Y, Ajjarapu AS, Snetselaar LG, et al. Association between plasma concentrations of elaidic acid, a major trans fatty acid, depression in a nationally representative sample of U.S. adults. J Affect Disord. (2019) 249:301–6. doi: 10.1016/j.jad.2019.02.032
10. Wu Q, Shah NP. NP, effects of elaidic acid, a predominant industrial trans fatty acid, on bacterial growth and cell surface hydrophobicity of lactobacilli. J Food Sci. (2014) 79:M2485–90. doi: 10.1111/1750-3841.12695
11. Wang J, Liang Y, Jian L, Zhang J, Liang S, Xiao S, et al. Linoelaidic acid enhances adipogenic differentiation in adipose tissue-derived stromal cells through suppression of Wnt/β-catenin signaling pathway in vitro. Prostaglandins Leukot Essent Fatty Acids. (2016) 110:1–7. doi: 10.1016/j.plefa.2016.04.004
12. Li J, Rao H, Bin Q, Fan YW, Li Y, Deng ZY. Linolelaidic acid induces apoptosis, cell cycle arrest and inflammation stronger than elaidic acid in human umbilical vein endothelial cells through lipid rafts. Europ J Lipid Sci Technol. (2016) 119:1600374. doi: 10.1002/ejlt.201600374
13. Bin Q, Rao H, Hu JN, Liu R, Fan YW, Li J, et al. The caspase pathway of linoelaidic acid (9t, 12t-C18:2)-induced apoptosis in human umbilical vein endothelial cells. Lipids. (2012) 48:115–26. doi: 10.1007/s11745-012-3728-4
14. World Health Organization. Countdown to 2023: WHO Report on Global Trans-Fat Elimination 2019. Geneva: World Health Organization (2019).
15. World Health Organization. An Action Package to Eliminate Industrially-Produced Trans Fat from the Global Food Supply. Geneva: World Health Organization (2018). Available online at: http://www.who. int/nutrition/topics/replace-transfat (accessed March 15, 2021).
16. World Health Organization. Countdown to 2023: WHO Report on Global Trans-Fat Elimination 2020. Geneva: World Health Organization (2020).
17. Bösch S, Westerman L, Renshaw N, Pravst I. Trans fat free by 2023—a building block of the COVID-19 response. Front Nutr. (2021) 8:645750. doi: 10.3389/fnut.2021.645750
18. Jawaldeh AA, Al-Jawaldeh H. Fat intake reduction strategies among children and adults to eliminate obesity and non-communicable diseases in the eastern mediterranean region. Children. (2018) 5:89. doi: 10.3390/children5070089
19. Available, online at: https://www.statista.com/statistics/455251/gross-domestic-product-gdp-per-capita-in-lebanon (accessed March 28, 2021).
20. World Food Program. WFP Lebanon Country Brief February 2021. Available online at: www.wfp.org/countries/Lebanon/ (accessed June 07, 2021).
22. World Health Organization. Regional Framework for Action. WHO/Noncommunicable Diseases. Cairo: WHO Regional Office for Eastern Mediterranean (2015).
23. Batal M, Hunter E. Traditional Lebanese recipes based on wild plants: an answer to diet simplification?. Food Nutrition Bulletin. (2007) 28(2 Suppl):S303–11. doi: 10.1177/15648265070282S209
24. Issa C, Salameh P, Batal M, Vieux F, Lairon D, Darmon N. The nutrient profile of traditional Lebanese composite dishes: comparison with composite dishes consumed in France. Int J Food Sci Nutri. (2009) 60(Suppl. 4):285–95. doi: 10.1080/09637480903107700
25. Food Composition Data. Traditional Dishes, Arabic Sweets and Market Foods. (2021). Available online at: http://www.ul.edu.lb/common/news.aspx?newsld=3131&lang=2/ (accessed April 29, 2021).
26. Hoteit M, Zoghbi E, Al Iskandarani M, Rady A, Shankiti I, Matta J, et al. Nutritional value of the Middle Eastern diet: analysis of total sugar, salt, and iron in Lebanese traditional dishes. F1000Research. (2020) 9:1254. doi: 10.12688/f1000research.26278.1
27. Hoteit M, Zoghbi E, Rady A, Shankiti I, Al-Jawaldeh A. Development of a Lebanese food exchange system based on frequently consumed Eastern Mediterranean traditional dishes and Arabic sweets. F1000Research. (2021) 10:12. doi: 10.12688/f1000research.27461.1
28. Association of Official Analytical Chemists. Official Methods of Analysis. Washington. 21st edition. (2019).
29. Hoteit M, Zoghbi E, Rady A, Shankiti I, Al-Jawaldeh A. Fatty acids quality in middle eastern traditional dishes, arabic sweets and market foods frequently consumed in Lebanon. Nutrients. (2021) 13:2462. doi: 10.3390/nu13072462
30. Association of Official Analytical Chemists. Official Methods of Analysis. Washington Ce 1h-05, 2017 revised (2017).
31. Bahrami G, Bahrami S, Bahrami M, Pasdar Y, Darbandi M, Rezaei M. The trans fatty acid content of snacks offered in kermanshah. Int J Health Life Sci. (2015) 1:e69803.
32. Wolff RL, Combe NA, Destaillats F, Boué C, Precht D, Molkentin J, et al. Follow-up of the Δ4 to Δ16 trans-18:1 isomer profile and content in French processed foods containing partially hydrogenated vegetable oils during the period 1995–1999. Anal Nutr Implicat. (2000) 35:815–25. doi: 10.1007/S11745-000-0590-2
33. Nazari B, Asgary S, Azadbakht L. Fatty acid analysis of Iranian junk food, dairy, and bakery products: special attention to trans-fats. J Res Med Sci. (2012) 17:952–7.
34. Zbikowska A, Onacik-Gür S, Kowalska M, Rutkowska J. Trans fatty acids in polish pastry. J Food Prot. (2019) 82:1028–33. doi: 10.4315/0362-028X.JFP-18-497
35. Reshma MV, Kiran RC, Nisha P, SobanKumar DR, Sundaresan A, Jayamurthy P. Trans fat content in labeled and unlabelled Indian bakery products including fried snacks. Int Food Res J. (2012) 19:1609–14.
36. Saadeh C, Toufeili I, Habbal MZ, Nasreddine L. Fatty acid composition including trans-fatty acids in selected cereal-based baked snacks from Lebanon. J Food Composit Anal. (2015) 41:81–5. doi: 10.1016/j.jfca.2015.01.014
37. Lee JH, Adhikari P, Kim SA, Yoon T, Kim H, Lee KY. Trans fatty acids content and fatty acid profiles in the selected food products from Korea between 2005 and 2008. J Food Sci. (2010) 75:C647–52. doi: 10.1111/j.1750-3841.2010.01737.x
38. Cakmak YS, Guler GO, Yigit S, Caglav G, Aktumsek A. Fatty acid composition and transfatty acids in crisps and cakes in turkey's markets. Int J Food Propert. (2011) 14:822–9. doi: 10.1080/10942910903453389
39. Saunders D, Jones S, Devane GJ, Scholes P, Lake RJ, Paulin SM. Trans fatty acids in the New Zealand food supply. J Food Comp Anal. (2008) 21:320–5. doi: 10.1016/j.jfca.2007.12.004
40. Akmar ZD, Norhaizan ME, Azimah R, Azrina A, Chan YM. The trans fatty acids content of selected foods in Malaysia. Malays J Nutr. (2013) 19:87–98.
41. Kuhnt K, Baehr M, Rohrer C, Jahreis G. Trans fatty acid isomers the trans-9/trans11 index in fat containing foods. Eur J Lipid Sci Technol. (2011) 113:1281–92. doi: 10.1002/ejlt.201100037
42. Roe M, Pinchen H, Church S, Elahi S, Walker M, Farron-Wilson M, et al. Trans fatty acids in a range of UK processed foods. Food Chem. (2013) 140:427–31. doi: 10.1016/j.foodchem.2012.08.067
43. Baylin A, Siles X, Donovan-Palmer A, Fernandez X, Campos H. Fatty acid composition of Costa Rican foods including trans fatty acid content. J Food Composit Anal. (2007) 20:182–92. doi: 10.1016/j.jfca.2006.01.004
44. Anwar F, bhanger MI, Iqbal S, sultana B. Fatty acid composition of different margarines and butters from Pakistan with special emphasis on trans unsaturated contents. J Food Qual. (2006) 29:87–96. doi: 10.1111/j.1745-4557.2006.00058.x
45. Abramovič H, Vidrih R, Zlatić E, Kokalj D, Schreiner M, Žmitek K, et al. Trans fatty acids in margarines and shortenings in the food supply in Slovenia. J Food Composit Anal. (2018) 74:53–61. doi: 10.1016/j.jfca.2018.08.007
46. Alonso L, Fraga MJ, Juárez M. Determination of trans fatty acids and fatty acid profiles in margarines marketed in Spain. J Am Oil Chemists' Soc. (2000) 77:131–6. doi: 10.1007/s11746-000-0022-8
47. Marekov I, Tarandjiiska R, Panayotova S, Nikolova N. Comparison of fatty acid composition of domestic and imported margarines and frying fats in Bulgaria. Europ J Lipid Sci Technol. (2002) 104:410–8. doi: 10.1002/1438-9312(200207)104:7<410::AID-EJLT410>3.0.CO;2-R
48. Tekin A, Cizmeci M, Karabacak H, Kayahan M. Trans FA and solid fat contents of margarines marketed in Turkey. J Am Oil Chem Soc. (2002) 79:443–5. doi: 10.1007/s11746-002-0503-9
49. Karabulut I, Turan S. Some properties of margarines and shortenings marketed in Turkey. J Food Composit Analy. (2006) 19:55–8. doi: 10.1016/j.jfca.2004.06.016
50. Ratnayake WMN, Gagnon C, Dumais L, Lillycrop W, Wong L, Meleta M, et al. Trans fatty acid content of Canadian margarines prior to mandatory trans fat labelling. J Am Oil Chem Soc. (2007) 84:817–25. doi: 10.1007/s11746-007-1112-y
51. Kandhro A, Sherazi STH, Mahesar SA, Bhanger MI, Younis Talpur M, Rauf A. GC-MS quantification of fatty acid profile including trans FA in the locally manufactured margarines of Pakistan. Food Chem. (2008) 109:207–11. doi: 10.1016/j.foodchem.2007.12.029
52. Suzuki RM, Montanher PF, Jesui VV, Souza NE. Proximate composition and quantification of fatty acids in five major Brazilian chocolate brands. Food Sci Technol. (2011) 31:541–6. doi: 10.1590/S0101-20612011000200040
53. Hernández-Martínez M, Gallardo-Velázquez T, Osorio-Revilla G. Fatty acid profile including trans fatty acid content of margarines marketed in Mexico. J Am Oil Chem Soc. (2011) 88:1485–95. doi: 10.1007/s11746-011-1815-y
54. Hajimahmoodi M, Arami S, Nosrati M. Trans fatty acid content of Iranian edible oils. Food Nutr. Sci. (2013) 4:1167–74. doi: 10.4236/fns.2013.411150
55. Bakeet ZAN, Alobeidallah FM, Arzoo S. Fatty acid composition with special emphasis on unsaturated trans fatty acid content in margarines and shortenings marketed in Saudi Arabia. Int J Biosci. (2013) 3:86–93.
56. Hajimahmoodi M, Poureini M, Moghaddam G, Sadeghi N, Oveisi M, Jannat B. Trans fatty acids profile in different commercial brands of margarine. Anal Chem Lett. (2014) 4:279–86. doi: 10.1080/22297928.2014.972979
57. Abedi A, Hosseini H, Mohammadi A, Abdollahi Z, Hajifaraji M, Khaneghah AM. Fatty Acid (FA) compositions and trans content of frequently consumed edible oils and fats from Iran' Market. Curr Nutr Food Sci. (2016) 12:56. doi: 10.2174/1573401311666150930215645
58. Shaik R, Kuna A, Azam M, Tilathoo R, Kanuri M, Samala G. Effect of rice bran oil spread on the physical, sensory and fatty acid profile of cake. J Food Sci Technol. (2017) 54:2126–34. doi: 10.1007/s13197-017-2652-2
59. Timić JB, Duričić ID, Ristić-Medić DK, Šobajic SS. Fatty acid composition including trans-fatty acids in salty snack food from the Serbian market. J. Serbian Chem. Soc. (2018) 83:685–98. doi: 10.2298/JSC180207039T
60. Selmi S, Ghiloufi R, El Ati J. Trans fatty acids content of selected popular Tunisian fast food (2019). Available online at: https://www.jnsciences.org/agri-biotech/99-volume-68/600-trans-fatty-acids-content-of-selected-popular-tunisian-fast-food.html (accessed June 14, 2021).
61. Mashal R, Oudeh A, Al-Ismail K, Abu-Hammour K, Al-Domi A. Association of dietary intake of trans fatty acids and coronary heart disease risk in jordanian subjects. Pakistan J Nutr. (2012) 11:423–33. doi: 10.3923/pjn.2012.423.433
62. Tarar OM, Ahmed KM, Nishtar NA, Achakzai A, Gulzar Y, Delles C, et al. Understanding the complexities of prevalence of trans fat and its control in food supply in Pakistan. J Clin Hypertens. (2020) 22:1338–46. doi: 10.1111/jch.13943
63. Ministry of health. Unpublished Report on the Fat Profile for Food Products. Rabbat: Ministry of health (2015).
64. Micha R, Khatibzadeh S, Shi P, Fahimi S, Lim S, Andrews KG, et al. Global, regional, and national consumption levels of dietary fats and oils in 1990 and 2010: a systematic analysis including 266 country-specific nutrition surveys. BMJ. (2014) 348:g2272. doi: 10.1136/bmj.g2272
65. Farhat A, Moukarzel S, Jaalouk D, Ayoub J. Consumption of Trans fatty acid and omega 6 to omega 3 ratio in Lebanese adults. Nutr Food Sci. (2016) 46:120–9. doi: 10.1108/NFS-07-2015-0089
66. Satia JA, Galanko JA, Neuhouser ML. Food nutrition label use is associated with demographic, behavioral, and psychosocial factors and dietary intake among African Americans in North Carolina. J Am Diet Assoc. (2005) 105:392–403. doi: 10.1016/j.jada.2004.12.006
67. Kamel S, Otaibi HA. Trans-Fats declaration, awareness and consumption in Saudi Arabia. Curr Res Nutr Food Sci. (2018) 6:748–56. doi: 10.12944/CRNFSJ.6.3.17
68. Stender S. Industrially produced trans fat in popular foods in 15 countries of the former Soviet Union from 2015 to 2016: a market basket investigation. BMJ Open. (2019) 9:e023184. doi: 10.1136/bmjopen-2018-023184
Keywords: traditional dishes, Arabic sweets, market foods, Lebanon, industrially produced trans fatty acids
Citation: Hoteit M, Zoghbi E, Rady A, Shankiti I, Ibrahim C and Al-Jawaldeh A (2021) Assessment of Industrially Produced Trans Fatty Acids in Traditional Dishes, Arabic Sweets, and Market Food Products and Its Risks on Non-communicable Diseases in Lebanon. Front. Nutr. 8:727548. doi: 10.3389/fnut.2021.727548
Received: 05 July 2021; Accepted: 21 September 2021;
Published: 21 October 2021.
Edited by:
Thea Magrone, University of Bari Aldo Moro, ItalyReviewed by:
Kenta Mori, Kobe University, JapanOmer Mukhtar Tarar, Pakistan Council of Scientific & Industrial Research, Pakistan
Copyright © 2021 Hoteit, Zoghbi, Rady, Shankiti, Ibrahim and Al-Jawaldeh. This is an open-access article distributed under the terms of the Creative Commons Attribution License (CC BY). The use, distribution or reproduction in other forums is permitted, provided the original author(s) and the copyright owner(s) are credited and that the original publication in this journal is cited, in accordance with accepted academic practice. No use, distribution or reproduction is permitted which does not comply with these terms.
*Correspondence: Ayoub Al-Jawaldeh, YWxqYXdhbGRlaGFAd2hvLmludA==