 Siddhant Ranjan Padhi1
 Racheal John2
 Arti Bartwal2
 Kuldeep Tripathi2
 Kavita Gupta3
 Dhammaprakash Pandhari Wankhede4
 Gyan Prakash Mishra5
 Sanjeev Kumar6Jai Chand Rana7Amritbir Riar8
 Rakesh Bhardwaj2*
- 1Division of Plant Genetic Resources, ICAR-Indian Agricultural Research Institute, New Delhi, India
- 2Division of Germplasm Evaluation, ICAR-National Bureau of Plant Genetic Resources, New Delhi, India
- 3Division of Plant Quarantine, ICAR-National Bureau of Plant Genetic Resources, New Delhi, India
- 4Division of Genomic Resources, ICAR-National Bureau of Plant Genetic Resources, New Delhi, India
- 5Division of Genetics, ICAR-Indian Agricultural Research Institute, New Delhi, India
- 6Division of Bioinformatics, ICAR-Indian Agricultural Statistics Research Institute, New Delhi, India
- 7Alliance of Bioversity International and CIAT, Region-Asia, India Office, New Delhi, India
- 8Department of International Cooperation, Research Institute of Organic Agriculture FiBL, Frick, Switzerland
Cowpea (Vigna unguiculata (L.) Walp.) is one such legume that can facilitate achieving sustainable nutrition and climate change goals. Assessing nutritional traits conventionally can be laborious and time-consuming. NIRS is a technique used to rapidly determine biochemical parameters for large germplasm. NIRS prediction models were developed to assess protein, starch, TDF, phenols, and phytic acid based on MPLS regression. Higher RSQexternal values such as 0.903, 0.997, 0.901, 0.706, and 0.955 were obtained for protein, starch, TDF, phenols, and phytic acid respectively. Models for all the traits displayed RPD values of >2.5 except phenols and low SEP indicating the excellent prediction of models. For all the traits worked, p-value ≥ 0.05 implied the accuracy and reliability score >0.8 (except phenol) ensured the applicability of the models. These prediction models will facilitate high throughput screening of large cowpea germplasm in a non-destructive way and the selection of desirable chemotypes in any genetic background with huge application in cowpea crop improvement programs across the world.
Introduction
Legumes have high nutritional qualities, are suitable for soil health and show resilience to climate change; these attributes can help to attain food security among low income developing nations of the world. Cowpea (Vigna unguiculata (L.) Walp.) is one such multipurpose legume originating from Africa (1), that may facilitate in providing food security and is adaptable to climate change and harsh conditions (2), becoming a successful crop in arid and semi-arid areas. In Sub-Saharan Africa, Asia, and parts of America, it is a significant pulse crop, grossing a total world production of 8.9 million metric tons (3). Nigeria accounts for 40% of total cowpea production, followed by Niger (26.8%) and Burkina Faso (7.3%). In India, it is grown as a minor pulse in an area of 3.9 mha with a production of 2.21 million tons (4), mainly in the arid and semi-arid tracts of Haryana, Punjab, Delhi, and Western Uttar Pradesh.
Owing to its high nutritional value, cowpea can be a good food source to combat malnutrition in low income developing countries, especially in Asian and African countries (5). It is rich in protein (24/100 g), total dietary fiber (11/100 g), carbohydrates (60/100 g), and low in fatty acids (<2/100 g), with a significant amount of essential amino acids1. High starch in cowpea can be used to make processed products like moin-moin and akara (6). It is a leguminous crop rich in TDF (16–20 /100 g), lowering the risk of cardiovascular diseases, diabetes and heart ailments (7). A number of bio-functional non-nutrients are present in dry cowpea seeds like phytates, flavonoids, and tannins (8). Polyphenols are present in an abundant proportion in legumes, which helps in imparting anti-oxidant properties ranging from 46.5 to 119.6 mg GAE/100 g (9, 10). Phytates are distributed widely in cereals and legumes, mostly stored in the form of phosphate in seeds. It has the ability to chelate divalent cations like Fe, Mg, and Cu, decreasing the bioavailability of the minerals. In cowpeas 0.5–3/100 g phytates has been reported (8, 11).
Huge variability exists in the nutritional attributes of cowpea, i.e., starch, protein, phenolics, phytates, TDF, and even in micronutrients (12); along with genetic relationships the variability in biochemical traits could help to develop new cultivars with superior traits. Despite the fact that crop improvement programs produce a large number no. of crosses/lines each year, but it is difficult to evaluate conventionally through complex methods which are labor intensive, time taking and technically complex. For the evaluation of a large number of accessions, NIRS has been proven to be a better technique. NIRS is a non-destructive technique widely used to predict organic compounds of grain material based on electromagnetic radiation (13). It is known for various advantages when compared to traditional procedures, including rapid determination, non-destructive, minimal usage of reagents, and less analysis of costs (14). Large scale rapid screening previously has been done for fatty acid profile in groundnut, major wood characteristics in Eucalyptus (15, 16). Electromagnetic radiation from 780 to 2,500 nm in the NIR region is covered by this technique (17), and absorption of IR light by the substance under examination is the basis for infrared spectroscopy. Molecular vibrations and rotation are caused by absorption and relative proportion of C–H, N–H, O–H, which forms the primary structure of biomolecules with a frequency similar to those found in the infra-red region of the electromagnetic spectrum (18, 19). These bands are important for identifying molecular interaction between functional groups and obtaining chemical information about the organic substance (20). Establishing a spectrochemical prediction known as spectrum calibration, multivariate regression methods, also known as chemometrics, are utilized to calibrate the NIR spectra to these organic elements due to the diversity of organic compounds extensively in biomaterials (21). The biochemical information included in a substance spectrum characteristic is separated from the physical or chemical information revealed by reference lab values via calibration (22). The analytical capacity of NIRS was determined by the relation between the number of biochemical parameters and the corresponding absorption spectra. Authentication and validation of NIRS prediction models depend on the accuracy of the relationship through pre-processing the spectral data and multivariate statistical analysis. Multiplicative scatter correction (MSC), standard normal variate and detrend (SNV–DT) are common pre-treatment steps (23), whereas multivariate regression techniques like partial least square (PLS), modified PLS (MPLS) and principal component regression (PCR) characterize the relation between biochemical components and spectral data (22).
Among legumes, NIRS prediction models have been developed for physicochemical properties, fatty acid and mineral composition in lentil (24, 25), phytates in green gram (18), neutral detergent fiber and acid detergent fiber fraction in chickpea (26), nutritional quality for chickpea straw (27). In cowpea, NIRS models have been developed to predict nitrogen content in cowpea seed (12, 28), and crude protein content in cowpea leaves (14).
In this study a combination of pre-processing methods (derivatives, gaps, and smoothening) along with MPLS regression have been used with an objective of developing robust NIRS prediction models for five biochemical traits, i.e., protein, starch, TDF, phenols, and phytates, to access the nutritional diversity in cowpea germplasm. These models could be applicable in different sectors of food industry, high throughput screening in national and international gene banks, seed industries and facilitate breeders in crop improvement programs.
Materials and methods
Sample collection
Four hundred seventy-five accessions of cowpea consisting of indigenous and exotic collections were taken from MTS of National Gene Bank at ICAR-NBPGR, New Delhi, India, having high variability in seed morphology. Using Augmented Block Design accessions were grown in Issapur experimental farm, New Delhi, India, following standard agronomic practices (29). Matured and dried seeds were collected, and extraneous material was removed.
Sample selection for NIRS modeling
Using FOSS NIRS 6500, 475 accessions were scanned, and the reflectance spectrum was recorded from 400 to 2,400 nm. Hierarchical clustering was done by Ward's method using squared Euclidean distance of 5 on the normalized spectral data of 475 samples. Major clusters and sub-clusters were identified and separated in the same manner. A set of highly diverse 121 accessions were selected to cover the entire range of variability in the data set. The wet chemistry values of these accessions were used as reference values. These samples were homogenized, ground, and sieved through a 1 mm sieve in FOSS cyclotec, and the flour thus obtained was used for scanning and wet chemistry analysis.
Generation of reference data for NIRS prediction models
Total protein content
Kjeldahl method (AOAC 984.13) (30) was used to estimate total nitrogen content where FOSS Tecator 2300 Kjeltec Analyser Distiller Unit) was used. %N was converted to percent protein using Jone's conversion factor of 6.25.
Total starch content
Total starch content was estimated by Megazyme total starch assay kit as per AOAC 996.11 (30) which uses α-amylase, amyloglucosidase and glucose oxidase peroxidase. Absorbance was recorded at 510 nm using a UV-VIS spectrophotometer, and the results were expressed in g/100 g.
Total dietary fiber (TDF)
TDF was estimated using a commercial assay kit from Megazyme International, Wicklow, Ireland (AOAC 985.29) (30), which includes the use of α-amylase, amyloglucosidase, and protease followed by precipitation with 95% ethanol and the results were expressed in g/100 g.
Total phenolics
Total phenolics was estimated by Folin Ciocalteau Reagent assay (31), which includes both oxidation and reduction reaction. Absorbance was recorded at 650 nm using a UV-VIS spectrophotometer, and the results were expressed in GAE g/100 g.
Phytates
Phytates was estimated using commercial assay kit from Megazyme International, Wicklow, Ireland (AOAC 986.11) (30) with the use of phytase and alkaline phosphatase. Absorbance was recorded at 655 nm, and the results were expressed in g/100 g.
Quality control
All the estimations were carried out in duplicates to ensure replicability and accuracy of the results. To ensure accuracy suitable standards and reagents blanks were used for each biochemical parameter. ASFRM-Rice-2 from PT-8 (INMU, Thailand) was used to validate protein and TDF. Total starch control kit (K-TSCK) control flours (wheat, maize starch) were used for validation of total starch. Total phytic acid kit control oat flour was used as standard reference material for phytic acid.
Spectroscopic analysis
FOSS NIRS 6500 spectrophotometer equipped with Win ISI Project Manager Software Version 1.50 was calibrated using a reference tile (100% white). Approximately 5 gm homogenized samples were loaded and scanned in a circular ring cup with a quartz window (3.8 cm and 1 mm thickness). The average spectrum was recorded by scanning the sample 32 times at 400–2,500 nm and was registered as log (1/R) at increments of 2 nm, where R is the respective reflectance.
Development of calibration and validation sets
For development of calibration and validation set, the accessions were arranged in ascending order and every second value was taken out to make the calibration set. Therefore, calibration and validation sets were obtained in the ratio of 2:1, which ensured uniform variability in both the sets (32). Thus, the accessions were divided into two sets for modeling, i.e., 81 accessions in the training set and 40 accessions in the validation set for all the traits.
Calibration and validation of equations
Win ISI Project Manager Software Version 1.50 was used to develop calibration equations using multivariate analysis by regressing spectral data with laboratory values. MPLS regression with cross-validation was used to develop equations on the above software using full spectra. Various mathematical algorithms, such as SNV–DT (SNV with detrend) were used for scatter correction and pre-processing the spectral data for each biochemical parameter. Moreover, different mathematical treatments like “2,4,6,1”, “2,8,8,1”, “2,4,4,1”, “3,4,4,1”, and “2,8,8,1” were used to develop models where the first digit represents the order of derivative; the second digit represents the gap (data points), third and fourth digits represents the data point in first and second smoothening. The developed calibration equations were assessed by different parameters such as coefficient of determination (RSQ), standard error of cross-validation [SEC(V)], standard deviation (SD), one minus variance ratio (1-VR). SEC(V) of RSQinternal was calculated by Win ISI Project Manager Software V 1.50. The portion of the variation in reference data that may be characterized by the variance in predicted data is displayed using RSQ. High RSQ and lower SEC models are superior to low RSQ and higher SEC values. Only cross-validation was insufficient to assess the accuracy of the models [i.e., with SEC(V) and 1-VR], so RSQexternal (coefficient of determination in external validation), bias (difference between predicted and reference values), SEP (standard error of performance), SEP(C) (corrected standard error of performance) and RPD (ratio of performance to deviation) values are used. RPD values are used for accuracy of MPLS models where if RPD <1.5, the model is not reliable, in between 1.5 and 2.0, it indicates the capacity of a model to distinguish high and low values, in between 2 and 2.5, indicating approximate quantitative prediction, in between 2.5 and 3.0, indicates good quality prediction and if it is >3.0, then the prediction is excellent (13).
Statistical analysis
All of the calibration and prediction was done using Win ISI III Project Manager Software Version 1.50, which applied various mathematical treatments based on spectral and analytical data. Reference and predicted values were monitored using Win ISI Project Manager Software V 1.50 with the developed equation. Using global statistical values like RSQ, slope, bias, RPD and SEP(C), the accuracy and predictive capacity of the model were evaluated. The coefficient of determination (RSQinternal/external) was externally plotted using Veusz statistical package for graphs of all the biochemical parameters.
A paired sample t-test was performed between reference and predicted values at 95% confidence interval using Jamovi statistical software package v1.6.9 (33). Strict parallel analysis was performed to check the reliability of the developed models and the reliability score was calculated by IBM SPSS v17.3 between the predicted and laboratory validated samples.
Results and discussion
Quantification of biochemical parameters
Five nutritional traits were worked out for 121 diverse cowpea accessions, and descriptive statistics are given in Table 1, whereas the box and whisker plots to showcase the variability of each trait are given in Figure 1. Protein was found to be range from 20 to 27.8/100 g, which is the most important trait for any legume. It is within the interval previously reported from 17.4 to 31.7/100 g (34) but lower than the values of 28.1–31.8% for five different Ethiopian cultivars (35). The protein content of cowpea has essential amino acids like lysine, histidine, and aromatic amino acids (36, 37). Starch content varied from 26.7 to 38.7/100 g, which is in agreement with the range of 28.3–36.2/100 g reported (34) but is lower than compared to other legumes like black gram 45/100 g and red bean 46 /100 g (38). Starch content will be useful for making processed products like moin-moin and akara. TDF in our study significantly varied from 12.2 to 22.4/100 g with a mean of 17.3 /100 g, close to the reported values worked by Akissoe et al. (15.6/100 g) but lower than worked values of 27.4/100 g (39, 40). Higher TDF in legumes corresponds to the lowering of cardiovascular diseases, diabetes, obesity, etc. Anti-nutritional factors such as phenolic compounds like phenolic acids, tannins, flavonoids, and phytates were analyzed and found in the range of 0.08–0.545 GAE/100 and 0.583–1.62/100 g, respectively. These compounds, if present in higher quantities, can limit the bioavailability of divalent cations (41).
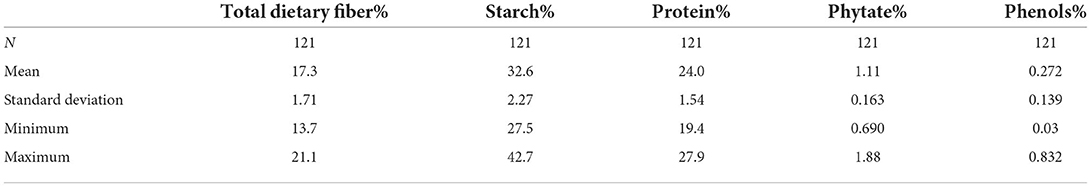
Table 1. Descriptive statistics of total protein, starch, TDF, phenols, and phytic acid.
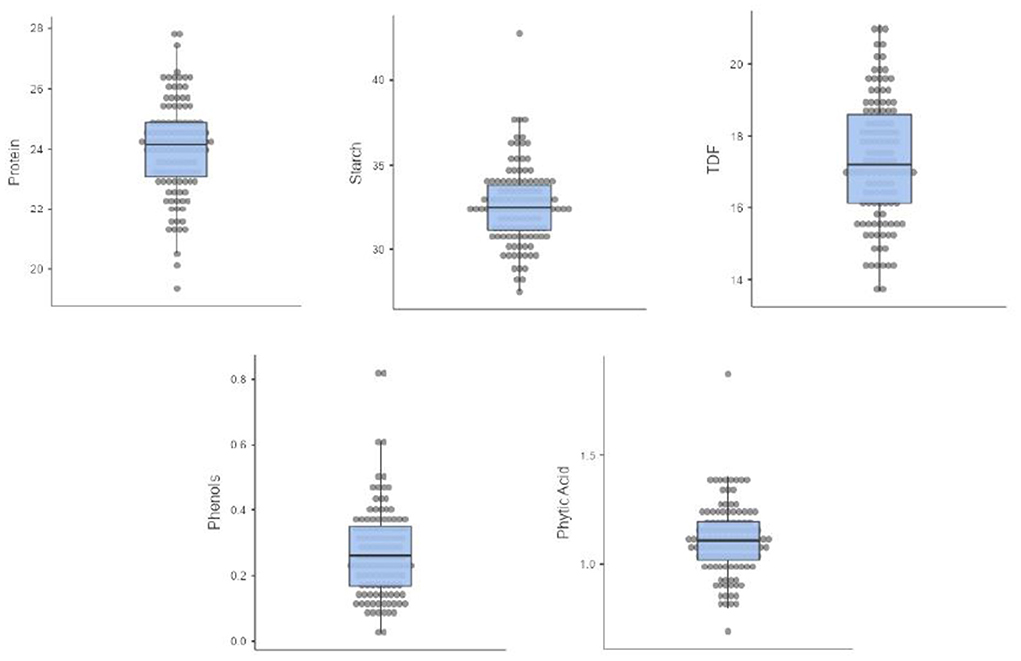
Figure 1. Box and whisker plots of 121 cowpea germplasm showing the distribution of protein, starch, TDF, phenols, and phytic acid.
NIRS spectra acquisition
Combined NIRS spectra of 121 cowpea accessions in the range of 400–2,490 nm is given in Figure 2A. The bands result from overlapping absorption that corresponds to the combination and overtones of vibrational modes N–H, O–H, and C–H, found in proteins, fatty acids, and carbohydrates, respectively. The main absorption bands were observed at 1,196, 1,468, 1,736, 1,934, 2,100, 2,310, and 2,482 nm, as shown in Figure 2B. C–O and N–H stretch, found in the spectral region between 2,000 and 2,222 nm, denoting protein content (42). O–H group can also be found in 1,560–1,640 nm, which can be allocated to the O–H group associated with phytates (18). O–H stretch first overtone of hydroxyl phenol groups present in 1,430–1,470 nm, whereas O–H bending/stretching of polysaccharides was found near the peak of 1,920 nm. The third polysaccharide overtone stretched by asymmetric C–O–O stretch was found near 2,083 nm (43). Unclear peaks were observed near 2,304–2,352 nm; this wavelength characterizes fatty acids and oils; since cowpea has little number of fatty acids, the bands were unclear. Symmetric stretching (–CH) in methyl groups (–CH3) found in a wavelength of 1,200 nm causing weak absorption bands. Similar bands were found in the study of rice flour and its quality properties using NIRS (44).
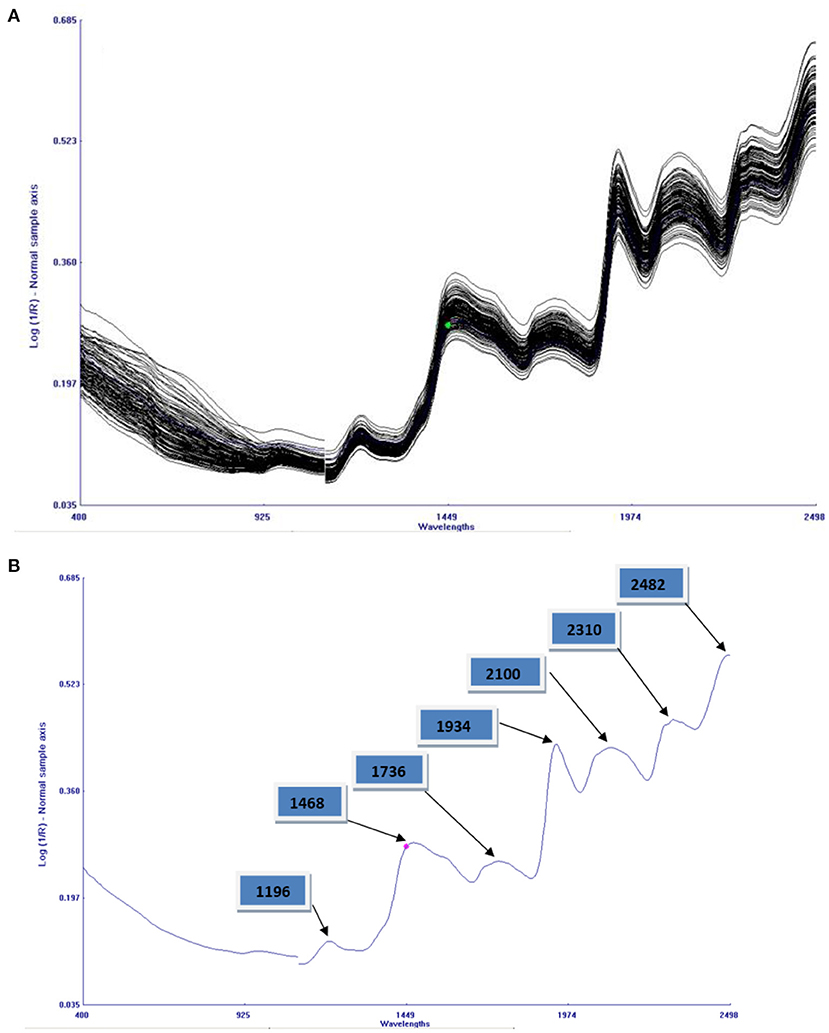
Figure 2. (A) A combined plot of reflectance spectra of all the entire 121 cowpea germplasm. (B) An average reflectance spectrum of cowpea homogenized flour with seven absorption bands.
Calibration of NIRS model
A calibration set is generally referred to as training set providing learning and training to build the model. Regression algorithms like MPLS, PLS, and PCR can be used for model development, but as compared to the PLS algorithm, MPLS is supposed to be more stable and accurate (24) and thus was employed in the present study. Both spectra and reference composition were used in the MPLS technique for generating equations, decreasing the effect of irrelevant large spectroscopic variations. Absorption levels are generally altered due to the variation in the scattering of light and path length variation caused by intervention in sample particles and light. Linear calibration and spectral interpretation of NIR spectra becomes very complex and difficult due to the alterations (13). Spectral pre-processing was employed to diminish the multiplicative effect of particles size and scattering including scatter correction and derivatization techniques (22). SNV works by removing the mean from each spectrum, followed by dividing the value of each signal by the SD of the entire spectrum to center it around zero. Along with SNV, detrend is another approach to correct behavior shift. SNV with detrend (DT) in the present study was employed to avoid any noise in the NIRS signal baseline. Table 2 summarizes the calibration models by MPLS for protein, starch, TDF, phenols, and phytates in homogenized cowpea flour. For the development of calibration equations for various parameters, several mathematical treatments like “2,4,4,1”, “2,4,6,1”, “2,8,8,1”, and “3,4,4,1” were finalized. Our calibration equation was based on the highest 1-VR and RSQinternal, lowest SEC(V) values. Resolution of spectra can be improved by using derivatives 2 and 3, which eliminates baseline shifts and superimposed peaks. The signal-to-noise ratio in the spectral region caused due to erratic high-frequency perturbations can be improved by using gaps 4 and 8 and smoothening (S1, S2). Calibration equations were generated by removing a few outliers (<10), which occurred due to scanning or analytical errors and were removed. As given in the Table 1, RSQinternal for different traits was obtained for protein (0.800), starch (0.997), TDF (0.934), phenols (0.719) and phytates (0.985) for the given mathematical treatments “2,4,6,1”, “2,8,8,1”, “2,4,4,1”, “3,4,4,1”, and “2,8,8,1” respectively.
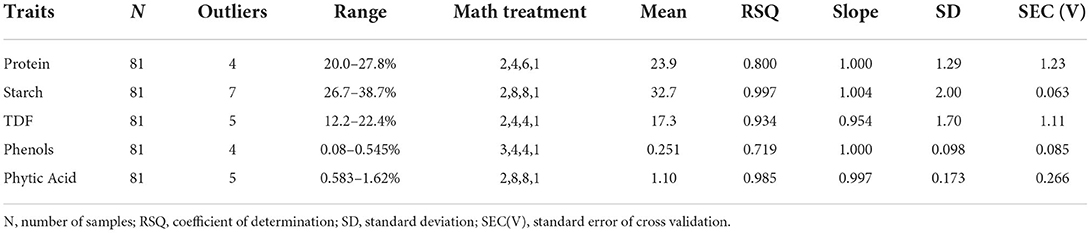
Table 2. Calibration statistics of 81 cowpea accessions.
Validation of the NIRS model
The external validation statistics for the given traits, protein, starch, TDF, phenols, and phytates of 40 samples are shown in Table 3. No outliers were removed in external validation to show higher prediction power and ensure the robustness of developed models. The best fit models were chosen based on higher RSQexternal, RPD, and low SEP, SD, slope, and bias values. To authenticate the model's validity, RPD value was used, which considers both SEP and variation in values and is more precise than SEP(C) (45). Towett et al. (14) found an RSQexternal of 0.93 for crude protein in cowpea leaves, whereas Pande and Mishra (18) found an RSQexternal of 0.97 for phytates in green gram seeds using FT-NIRS. The regression plot of predicted values versus reference values for protein, starch, TDF, phenol and phytic acid are described in Figure 3 respectively. These plots of predicted values versus reference values were developed through Win ISI III project manager V 1.50. Models for proteins, starch, TDF, phenols, and phytates displayed RPD values of 2.80, 5.32, 3.28, 1.78, and 4.45, respectively, denoting the model's excellent prediction power. Our RPD values for protein are in agreement with Ishikawa et al. (2.88) in cowpea (12). RPD value for phenolics (1.78) which shows that the model can distinguish between higher and lower values. Slope denotes the change in predicted values with a unit change in reference values. The ideal value of the slope is 1, and any value close to 1 would indicate an accurate model. The values of slope in our study for different traits were protein (1.12), starch (1.03), TDF (0.954), phenols (1.18), and phytates (0.929). In determining the model accuracy, bias is an important indicator of similarity between reference and predicted values of the model (23). When the reference and predicted values are the same, the bias would be equal to zero, which is the ideal value for bias. An underestimating model will be signified by negative bias, and overestimating model will be signified by positive bias (46). The values of bias for different traits were 0.197 (protein), 0.029 (starch), −0.026 (TDF), phenols 0.003 (phenols), and 0.009 (phytates), where all the developed models were found to be overestimating except TDF which is found to be underestimating.
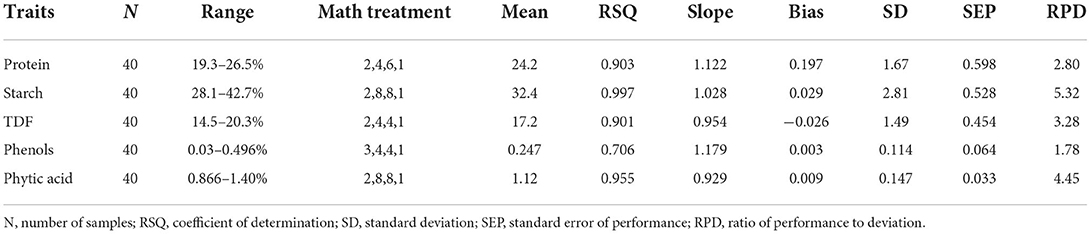
Table 3. External validation statistics of 40 cowpea accessions.
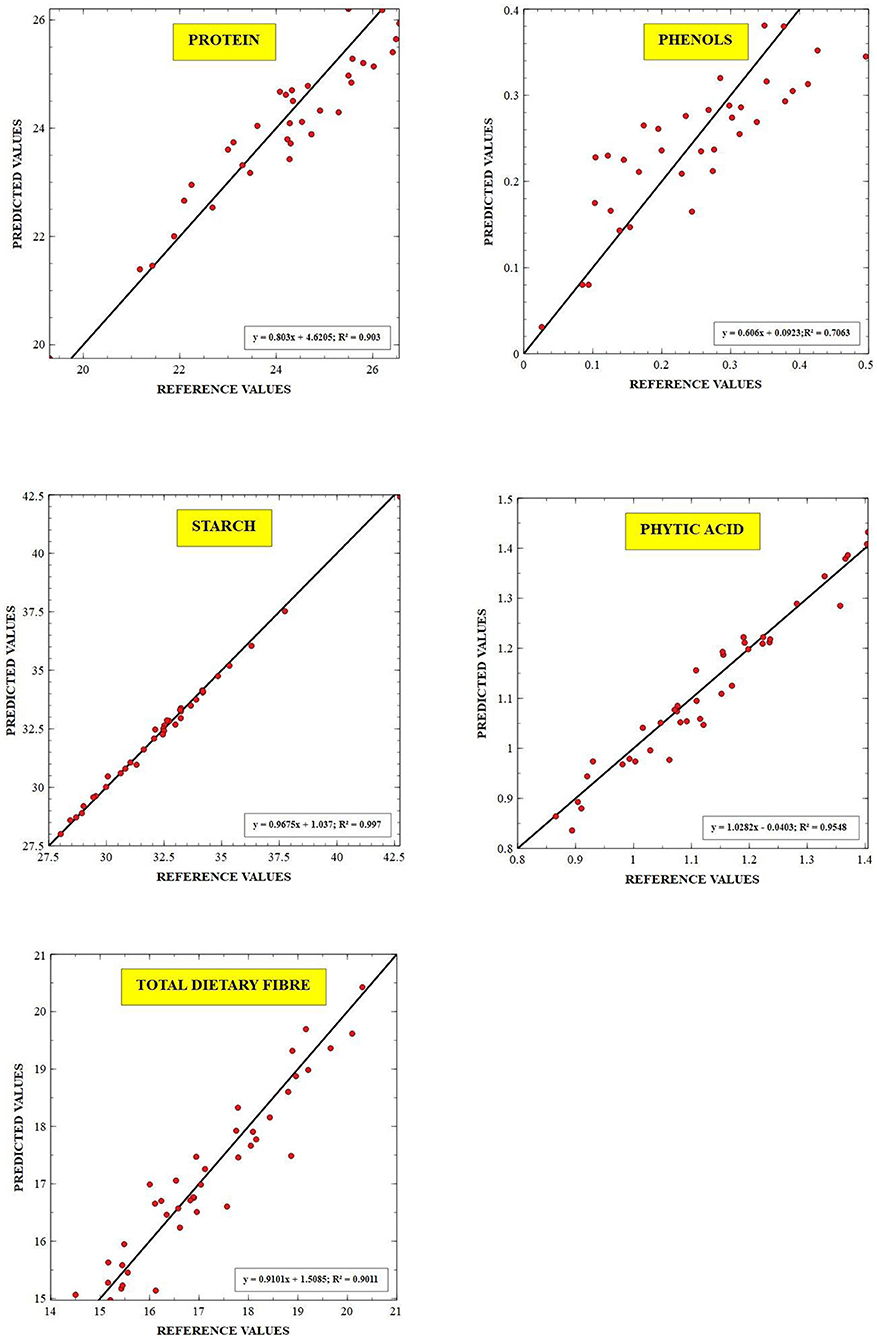
Figure 3. Scatter plot between the reference vs. predicted values for protein, starch, TDF, total dietary fiber, phenols, and phytic acid. RSQexternal–coefficient of determination for validation.
To determine whether the mean of a dependent variable is the same as the analytical and predicted values for the examined biochemical parameters, a paired t-test with a 95% confidence interval was performed. In our study, the p-value came out more than 0.05, indicating the accuracy and reliability of the models (Table 4). The p-values of protein, starch, TDF, phenols, and phytates are 0.158, 0.512, 0.637, 0.639, and 0.114 respectively. Hence no statistically significant differences came out between the means in the NIRS method and standard methods used to analyze the traits.
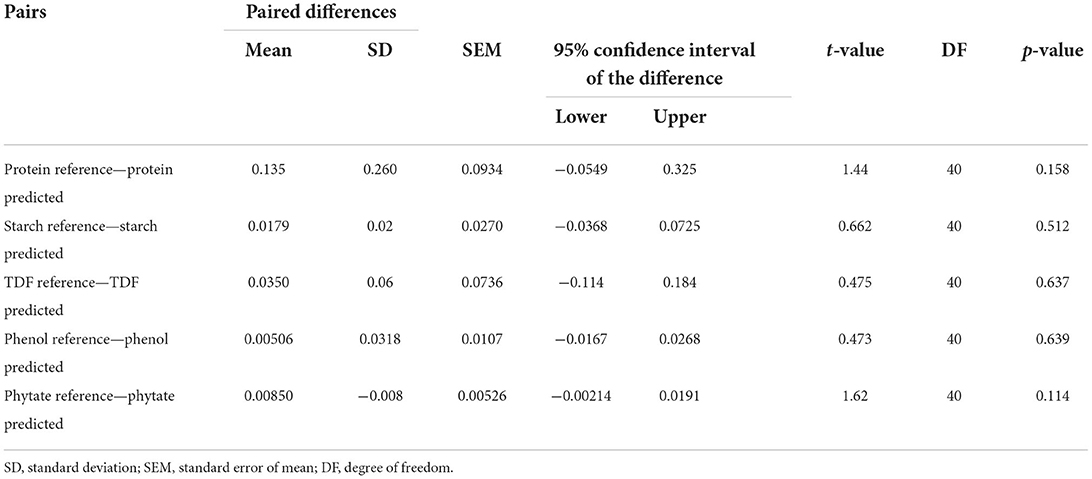
Table 4. Paired sample t-test at 95% confidence interval.
Applicability of the developed models
The validated models were used to predict a sample set of 202 cowpea accessions for use in screening germplasm resources. To ensure the reliability of developed equations, 10% of samples were analyzed by standard methods. The predicted data were arranged in ascending order, and every 11th sample was selected for wet chemistry analysis. The result of predicted and laboratory values are given in Table 5. Correlation studies between the datasets show high correlation for protein (r = 0.97, p < 0.001), starch (r = 0.93, p < 0.001), TDF (r = 0.95, p < 0.001) while slightly low correlation was observed for phenols (r = 0.55, p < 0.01) and phytic acid (r = 0.77, p < 0.01) (Table 6). Strict parallel analysis is used to determine the difference in the means and standard deviations of two datasets where in our study there was agreement in the consistency of results, showing high reliability scores (unbiased) for protein (0.91), 0.92 (starch), 0.97 (TDF), 0.87 (phytic acid) and comparatively low reliability for phenols (0.64) (Table 6).
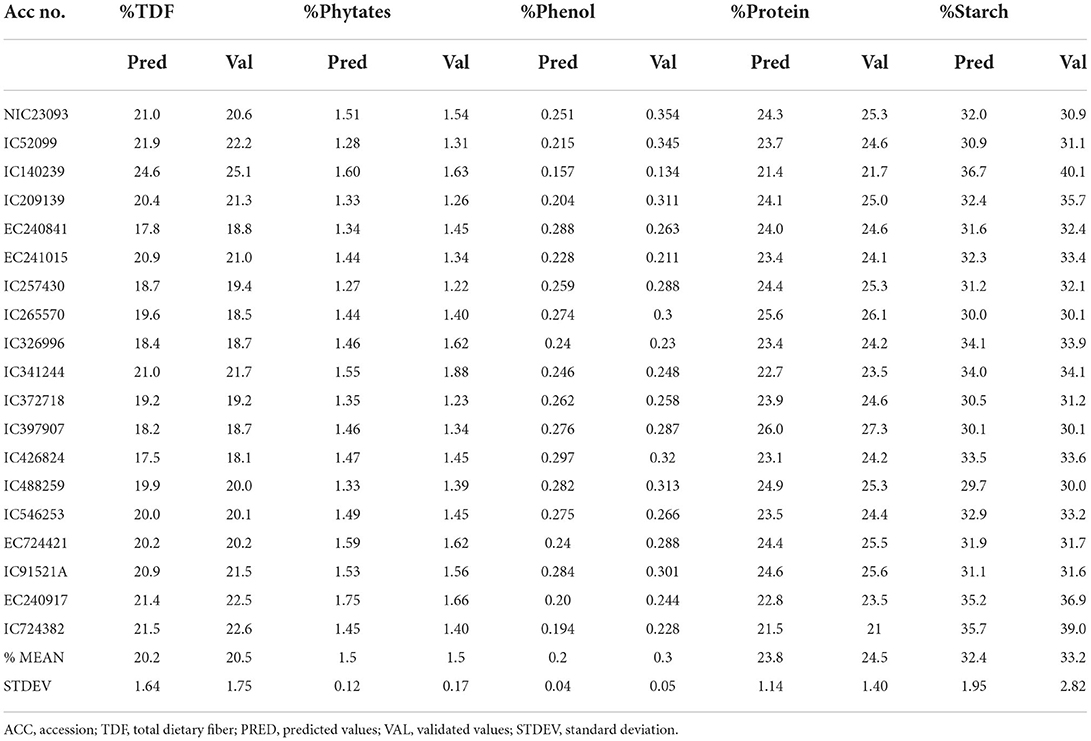
Table 5. Prediction and wet chemical values of selected cowpea accessions.
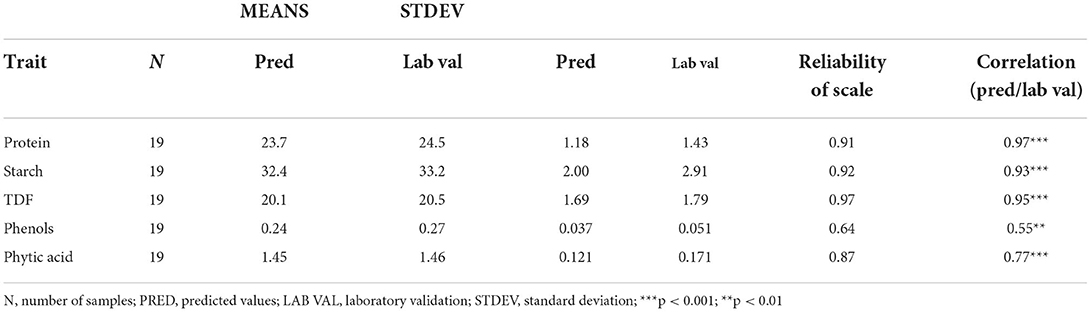
Table 6. Reliability analysis between predicted and laboratory validated values using strict parallel method.
Conclusion
In our study for the rapid prediction of protein, starch, TDF, phenols, and phytates, NIRS was found to be a potential tool. The present work is the first report on the development of prediction models of protein, starch, TDF, phenols, and phytates in cowpea through the MPLS regression method based on the NIR spectroscopy method. MPLS regression was used to develop models which have shown suitability for all the traits. Good RSQexternal and RPD values have been found for multi-trait parameters. Model applicability studies confirmed that these models could predict the traits of diverse cowpea germplasm with excellent accuracy and precision. The use of NIR models substantially reduced the cost and time for analyzing multiple traits in cowpea germplasm without compromising on data quality. Thus, these developed models will facilitate high throughput screening of large cowpea germplasm present in the national and international gene banks throughout the world, for identifying traits specific germplasm and selecting desirable chemotypes in any genetic background with huge application in cowpea crop improvement program across the world. However, these prediction models have been developed in the flour of cowpea but prediction models should also be developed in grain, as it will facilitate the screening of cowpea germplasm in a completely non-destructive way.
Data availability statement
The original contributions presented in the study are included in the article/supplementary material, further inquiries can be directed to the corresponding author/s.
Author contributions
SRP and RJ: biochemical profiling, NIRS modeling, and preparing draft manuscript. AB: reference data generation. KT: provided agronomically diverse cowpea accessions. KG, DW, GM, and JCR: review and critical evaluation of manuscript. SK: statistical analysis and interpretation. AR: revision and resources. RB: conceptualization, planning, and supervision of study. All authors contributed to the article and approved the submitted version.
Funding
This study was supported by funding from Department of Biotechnology, Government of India under project on minor pulses (No. BT/Ag/Network/Pulse-I /2017-18, date:187 24th Oct 2018). In-house project on Biochemical evaluation of Field and vegetable crops. DBT funded and an international collaborative project Consumption of Resilient Orphan Crops & Products for Healthier Diets (CROPS4HD) which is co-funded by the Swiss Agency for Development and Cooperation, Global Programme Food Security (SDC GPFS) and executed in India through FiBL (Research Institute of Organic Agriculture), and Alliance of Bioversity and CIAT with ICAR-NBPGR as a lead partner. Junior Research Fellowship granted to SP by ICAR Research Grant No. 2(9)/2018-HRD dated 30th October 2018.
Acknowledgments
Authors acknowledge the support received from HOD DGE, HOD DGC, Dr. Neeta Singh DGC, Professor PGR and PG School ICAR-IARI in carrying out these studies.
Conflict of interest
The authors declare that the research was conducted in the absence of any commercial or financial relationships that could be construed as a potential conflict of interest.
Publisher's note
All claims expressed in this article are solely those of the authors and do not necessarily represent those of their affiliated organizations, or those of the publisher, the editors and the reviewers. Any product that may be evaluated in this article, or claim that may be made by its manufacturer, is not guaranteed or endorsed by the publisher.
Abbreviations
NIRS, near infrared reflectance spectroscopy; MPLS, modified partial least square; TDF, total dietary fiber; RSQ, coefficient of determination; RPD, ratio of performance to deviation; SEP, standard error of performance.
Footnotes
References
1. Boukar O, Togola A, Chamarthi S, Belko N, Ishikawa H, Suzuki K, et al. Cowpea [Vigna unguiculata (L.) Walp.] breeding. In Advances in Plant Breeding Strategies: Legumes. Cham: Springer (2019). p. 201–243. doi: 10.1007/978-3-030-23400-3_6
2. Muñoz-Amatriaín M, Mirebrahim H, Xu P, Wanamaker SI, Luo M, Alhakami H, et al. Genome resources for climate-resilient cowpea, an essential crop for food security. Plant J. (2017) 89:1042–54. doi: 10.1111/tpj.13404
3. Food Agriculture Organization Corporate Statistical Database (FAOSTAT). (2020). Google Search|Food and Agriculture Organization of the United Nations (fao.org).
4. Giridhar K, Raju PS, Pushpalatha G. Patra C. Effect of plant density on yield parameters of cowpea (Vigna unguiculata L). Int J Chem Stud. (2020) 8:344–7. doi: 10.22271/chemi.2020.v8.i4f.10090
5. Abu-Manga M, Al-Jawaldeh A, Qureshi AB, Ali AM, Pizzol D, Dureab F. Nutrition assessment of under-five children in Sudan: tracking the achievement of the global nutrition targets. Children. (2021) 8:363. doi: 10.3390/children8050363
6. Enwere NJ, McWatters KH, Phillips RD. Effect of processing on some properties of cowpea (Vigna unguiculata), seed, protein, starch, flour and akara. Int J Food Sci Nutr. (1998) 49:365–73. doi: 10.3109/09637489809089411
7. Granito M, Torres A, Frías J, Guerra M, Vidal-Valverde C. Influence of fermentation on the nutritional value of two varieties of Vigna sinensis. Eur Food ResTechnol. (2005) 220:176–81. doi: 10.1007/s00217-004-1011-5
8. Avanza MV, Chaves MG, Acevedo BA, Añón MC. Functional properties and microstructure of cowpea cultivated in north-east Argentina. LWT. (2012) 49:123–30. doi: 10.1016/j.lwt.2012.04.015
9. Xu BJ, Chang SK. A comparative study on phenolic profiles and antioxidant activities of legumes as affected by extraction solvents. J Food Sci. (2007) 72:S159–66. doi: 10.1111/j.1750-3841.2006.00260.x
10. Adjei-Fremah S, Worku M, De Erive MO, He F, Wang T, Chen G. Effect of microfluidization on microstructure, protein profile and physicochemical properties of whole cowpea flours. Innov Food Sci Emerg Technol. (2019) 57:102207. doi: 10.1016/j.ifset.2019.102207
11. Oboh G. Antioxidant properties of some commonly consumed and underutilized tropical legumes. Eur Food ResTechnol. (2006) 224:61–5. doi: 10.1007/s00217-006-0289-x
12. Ishikawa H, Boukar O, Fatokun C, Shono M, Muranaka S. Development of calibration model to predict nitrogen content in single seeds of cowpea (Vigna unguiculata) using near infrared spectroscopy. J Near Infrared Spectrosc. (2017) 25:211–4. doi: 10.1177/0967033517712129
13. Chadalavada K, Anbazhagan K, Ndour A, Choudhary S, Palmer W, Flynn JR, et al. Instruments and prediction methods for rapid access to grain protein content in multiple cereals. Sensors. (2022) 22:3710. doi: 10.3390/s22103710
14. Towett EK, Alex M, Shepherd KD, Polreich S, Aynekulu E, Maass BL. Applicability of near-infrared reflectance spectroscopy (NIRS) for determination of crude protein content in cowpea (Vigna unguiculata) leaves. Food Sci Nutr. (2013) 1:45–53. doi: 10.1002/fsn3.7
15. Nadaf HL, Hanchinal RR. Near infrared reflectance spectroscopy (NIRS) for large scale screening of fatty acid profile in peanut (Arachis hypogaea L.). Legume Res. (2014) 37:272–80. doi: 10.5958/j.0976-0571.37.3.041
16. Baillères H, Davrieux F, Ham-Pichavant F. Near infrared analysis as a tool for rapid screening of some major wood characteristics in a eucalyptus breeding program. Ann For Sci. (2002) 59:479–90. doi: 10.1051/forest:2002032
17. Masitoh F, Rusydi AN. Climatological human comfort using heat and humidity index (Humidex) in Gadingkulon, Malang. IOP Conf Ser Earth Environ Sci. (2020) 412:012026. doi: 10.1088/1755-1315/412/1/012026
18. Pande R, Mishra HN. Fourier transform near-infrared spectroscopy for rapid and simple determination of phytic acid content in green gram seeds (Vigna radiata). Food Chem. (2015) 172:880–4. doi: 10.1016/j.foodchem.2014.09.049
19. Osborne BG. Applications of near infrared spectroscopy in quality screening of early-generation material in cereal breeding programmes. J Near Infrared Spectrosc. (2006) 14:93–101. doi: 10.1255/jnirs.595
20. Shi D, Hang J, Neufeld J, Zhao S, House JD. Estimation of crude protein and amino acid contents in whole, ground and defatted ground soybeans by different types of near-infrared (NIR) reflectance spectroscopy. J Food Compos Anal. (2022) 111:104601. doi: 10.1016/j.jfca.2022.104601
21. Hacisalihoglu G, Larbi B. Settles AM. Near-infrared reflectance spectroscopy predicts protein, starch, and seed weight in intact seeds of common bean (Phaseolus vulgaris L) J Agric Food Chem. (2010) 58:702–6. doi: 10.1021/jf9019294
22. Tomar M, Bhardwaj R, Kumar M, Singh SP, Krishnan V, Kansal R, et al. Satyavathi CT. Development of NIR spectroscopy-based prediction models for nutritional profiling of pearl millet (Pennisetum glaucum (L)) R. Br A Chemo Appr LWT. (2021) 149:111813. doi: 10.1016/j.lwt.2021.111813
23. Wu Y, Peng S, Xie Q, Han Q, Zhang G, Sun H. An improved weighted multiplicative scatter correction algorithm with the use of variable selection: Application to near-infrared spectra. Chemom Intell Lab Syst. (2019) 185:114–21. doi: 10.1016/j.chemolab.2019.01.005
24. Revilla I, Lastras C, González-Martín MI, Vivar-Quintana AM, Morales-Corts R, Gómez-Sánchez MA, et al. Predicting the physicochemical properties and geographical ORIGIN of lentils using near infrared spectroscopy. J Food Compos Anal. (2019) 77:84–90. doi: 10.1016/j.jfca.2019.01.012
25. Lastras C, Revilla I, González-Martín MI, Vivar-Quintana AM. Prediction of fatty acid and mineral composition of lentils using near infrared spectroscopy. J Food Comp Anal. (2021) 102:104023. doi: 10.1016/j.jfca.2021.104023
26. Ramos-Font ME, Tognetti-Barbieri MJ, González-Rebollar JL, Robles-Cruz AB. Potential of wild annual legumes for mountain pasture restoration at two silvopastoral sites in southern Spain: promising species and soil-improvement techniques. Agrofor Syst. (2021) 95:7–19. doi: 10.1007/s10457-018-0340-5
27. Alemu T, Wamatu J, Tolera A, Beyan M, Eshete M, Alkhtib A, et al. Optimizing near infrared reflectance spectroscopy to predict nutritional quality of chickpea straw for livestock feeding. Animals. (2021) 11:3409. doi: 10.3390/ani11123409
28. Muranaka S, Shono M, Manjula K, Takagi H, Ishikawa H. Application of near to midinfrared spectroscopy to estimation of grain nitrogen content in cowpea (Vigna unguiculata) grown under multiple environmental conditions. J Biol Food Sci Res. (2015) 4:16–24.
29. Padhi SR, Bartwal A, John R, Tripathi K, Gupta K, Wankhede DP, et al. Evaluation and multivariate analysis of cowpea [Vigna unguiculata (L.) walp] germplasm for selected nutrients—mining for nutri-dense accessions. Front. Sustain. Food Syst. (2022) 182. doi: 10.3389/fsufs.2022.888041
30. Horwitz W. Official methods of analysis of AOAC International. Volume I, agricultural chemicals, contaminants, drugs/edited by William Horwitz. Gaithersburg (Maryland): AOAC International, 1997. (2010).
31. Singleton VL, Orthofer R, Lamuela-Raventós RM. [14] Analysis of total phenols and other oxidation substrates and antioxidants by means of folin-ciocalteu reagent. In Methods Enzymol. (1999) Jan 1 (Vol. 299, pp. 152–178). doi: 10.1016/S0076-6879(99)99017-1
32. John R, Bhardwaj R, Jeyaseelan C, Bollinedi H, Singh N, Harish GD, et al. (2022). Germplasm variability-assisted near infrared reflectance spectroscopy chemometrics to develop multi-trait robust prediction models in rice. Front Nutr. (2022). 1712. doi: 10.3389/fnut.2022.946255
33. The Jamovi Project (2020). Jamovi. (Version 1.6.9) [Computer Software] 2020. Available online at: https://www.jamovi.org (accessed September 2021)
34. Antova GA, Stoilova TD. Ivanova MM. Proximate and lipid composition of cowpea (Vigna unguiculata L) cultivated in Bulgaria. J Food Compos Anal. (2014) 33:146–52. doi: 10.1016/j.jfca.2013.12.005
35. Teka TA, Retta N, Bultosa G, Admassu H, Astatkie T. Protein fractions, in vitro protein digestibility and amino acid composition of select cowpea varieties grown in Ethiopia. Food Biosci. (2020) 36:100634. doi: 10.1016/j.fbio.2020.100634
36. Jayathilake C, Visvanathan R, Deen A, Bangamuwage R, Jayawardana BC, Nammi S, et al. Cowpea: an overview on its nutritional facts and health benefits. J Sci Food Agric. (2018) 98:4793–806. doi: 10.1002/jsfa.9074
37. Gonçalves A, Goufo P, Barros A, Domínguez-Perles R, Trindade H, Rosa EA, et al. Cowpea (Vigna unguiculata L. Walp), a renewed multipurpose crop for a more sustainable agri-food system: nutritional advantages and constraints. J Sci Food Agric. (2016) 96:2941–51. doi: 10.1002/jsfa.7644
38. Hoover R, Hughes T, Chung HJ, Liu Q. Composition, molecular structure, properties, and modification of pulse starches: a review. Food Res Int. (2010) 43:399–413. doi: 10.1016/j.foodres.2009.09.001
39. Akissoé L, Madodé YE, Hemery YM, Donadjè BV, Icard-Vernière C, Hounhouigan DJ, et al. Impact of traditional processing on proximate composition, folate, mineral, phytate, and alpha-galacto-oligosaccharide contents of two West African cowpea (Vigna unguiculata L. Walp) based doughnuts. J Food Compos Anal. (2021) 96:103753. doi: 10.1016/j.jfca.2020.103753
40. Ghavidel RA, Prakash J. The impact of germination and dehulling on nutrients, antinutrients, in vitro iron and calcium bioavailability and in vitro starch and protein digestibility of some legume seeds. LWT. (2007) 40:1292–9. doi: 10.1016/j.lwt.2006.08.002
41. Panyoyai N, Silsin M, Khongdan J, Paramita VD. Effect of partial replacement of soybean with chickpea to the nutritional and textural properties of Tofu. Indones Food Sci Technol Jl. (2021) 4:27–31.
42. Plans M, Simó J, Casañas F, Sabaté J. Rodriguez-Saona L. Characterization of common beans (Phaseolus vulgaris L) by infrared spectroscopy: comparison of MIR, FT-NIR and dispersive NIR using portable and benchtop instruments. Food Res Int. (2013) 54:1643–51. doi: 10.1016/j.foodres.2013.09.003
43. Zhang K, Zhou L, Brady M, Xu F, Yu J, Wang D. Fast analysis of high heating value and elemental compositions of sorghum biomass using near-infrared spectroscopy. Energy. (2017) 118:1353–60. doi: 10.1016/j.energy.2016.11.015
44. Fazeli Burestan N, Afkari Sayyah AH, Taghinezhad E. Prediction of some quality properties of rice and its flour by near-infrared spectroscopy (NIRS) analysis. Food Sci Nutr. (2021) 9:1099–105. doi: 10.1002/fsn3.2086
45. Prieto N, Pawluczyk O, Dugan ME, Aalhus JL. A review of the principles and applications of near-infrared spectroscopy to characterize meat, fat, and meat products. Appl Spectrosc. (2017) 71:1403–26. doi: 10.1177/0003702817709299
Keywords: MPLS regression, germplasm screening, nutritional composition, RPD, RSQexternal
Citation: Padhi SR, John R, Bartwal A, Tripathi K, Gupta K, Wankhede DP, Mishra GP, Kumar S, Rana JC, Riar A and Bhardwaj R (2022) Development and optimization of NIRS prediction models for simultaneous multi-trait assessment in diverse cowpea germplasm. Front. Nutr. 9:1001551. doi: 10.3389/fnut.2022.1001551
Received: 23 July 2022; Accepted: 25 August 2022;
Published: 23 September 2022.
Edited by:
Kathleen L. Hefferon, Cornell University, United StatesReviewed by:
Lydia Pramitha J., Tamil Nadu Agricultural University, IndiaFacundo Ibañez, National Institute for Agricultural Research (INIA), Uruguay
Copyright © 2022 Padhi, John, Bartwal, Tripathi, Gupta, Wankhede, Mishra, Kumar, Rana, Riar and Bhardwaj. This is an open-access article distributed under the terms of the Creative Commons Attribution License (CC BY). The use, distribution or reproduction in other forums is permitted, provided the original author(s) and the copyright owner(s) are credited and that the original publication in this journal is cited, in accordance with accepted academic practice. No use, distribution or reproduction is permitted which does not comply with these terms.
*Correspondence: Rakesh Bhardwaj, UmFrZXNoLmJoYXJkd2FqMUBpY2FyLmdvdi5pbg==