 Carolina Rojas Quezada
 Felipe Aguilera Sáez
 Giovanni Vecchio
 Stefan Steiniger
- 1Instituto de Estudios Urbanos y Territoriales, Pontificia Universidad Católica de Chile, Santiago, Chile
- 2Centro de Desarrollo Urbano Sustentable CEDEUS, Santiago, Chile
Urban green spaces have shown to be beneficial for the physical and mental wellbeing of the general population—which particularly holds true during an unprecedented, stressful situation such as the COVID-19 pandemic. In urban settings characterized by structural inequality, scarce access to green spaces in a neighborhood can affect the wellbeing of its inhabitants and lower overall resilience of a community. Assuming that the effects of confinement and working from home produce an increased demand for recreational and sports activities, this paper looks to assess the level of preparedness and accessibility of green spaces during the COVID-19 pandemic, considering individual and public measures to avoid contagion. The assessment is carried out through an online exploratory survey and accessibility calculations that are applied to two Chilean cities with a Mediterranean climate, Talca and Chillán. The study considers the quality of green spaces based on (i) official statistics and (ii) a questionnaire directed toward residents. We found that high-quality urban green spaces are accessible to residents of both cities, but rather limited in December 2020 due to low levels of preparedness. Considering the qualities of existing urban green spaces allows for a more precise estimate of their contribution to the wellbeing of neighborhoods, and consequently facilitates better recommendations for urban plans and policies.
Introduction
Urban green spaces have proven to be important for the wellbeing of the general population (Kolimenakis et al., 2021; Reyes-Riveros et al., 2021). As research has shown, the presence of green spaces is associated with a number of benefits, positively affecting both objective physical conditions (Di Nardo et al., 2010) and perceived human health (Maas et al., 2006; Roberts et al., 2021). For example, relaxing and physical activities carried out in parks and squares reduce the effects of depression as well as cardiovascular problems (Gascon et al., 2016; Bull and Hardman, 2018; Chiabai et al., 2020). Similarly, recreational activities in green spaces have been found to alleviate problems derived from stress (Roe et al., 2013) and obesity (Lachowycz and Jones, 2011). In more general terms, neighborhoods that are closer to green areas may be conducive to higher levels of physical activity (Nielsen and Hansen, 2007), which may also reduce mortality related to health problems (Gascon et al., 2016). Scarce exposure to green spaces in urban contexts has been found to affect the quality of life of residents and is associated with lower levels of happiness and wellbeing among inhabitants (Navarrete-Hernandez and Laffan, 2019). As a consequence, assessing the accessibility to green spaces is considered relevant for urban health and sustainability studies, due to the relationship among availability, physical activity of individuals, and the health of different population groups (UN Habitat, 2016; Steiniger et al., 2020; INE, 2021; Amoushahi et al., 2022).
The importance of access to urban green spaces has become even more evident during the COVID-19 pandemic. The unprecedented situation of at-home confinement for many has generated serious harmful effects on mental health, both psychological and psychiatric (Akintunde et al., 2021), exacerbating people's vulnerability to disease. Cities with concentrated or densely populated urban spaces were not prepared to cope with a crisis of this scale or to address the importance of green spaces. Along with other issues, reduced access to green areas, scarce vegetation cover, few green roofs, and a lack of balconies in apartment blocks may have worsened people's psychosocial response to the extreme situations of confinement that COVID-19 has produced (Ugolini et al., 2020; Larson et al., 2022). At the same time, it has been argued that access to green spaces has reduced COVID-19 mortality rates (Klompmaker et al., 2021) and has positively affected the mental health of inhabitants, especially during lockdowns (Astell-Burt and Feng, 2021; Fagerholm et al., 2021; Pouso et al., 2021). However, a deficiency of open and green spaces persists and reflects the existing forms of inequality and social exclusion (Astell-Burt and Feng, 2021; Hoover and Lim, 2021). Considering these previous studies and personal experiences during the pandemic, we argue that a city that is open and connected to its green spaces may be more resilient.
The positive effects of recreation and contact with nature have been confirmed with the progression of the pandemic, especially in relation to mental health (Ugolini et al., 2020; Astell-Burt and Feng, 2021; Fagerholm et al., 2021; Larson et al., 2022). Initially, the pandemic has questioned the reported benefits of frequenting urban green spaces, since the crowding that could occur in public spaces may undermine compliance with the social distancing measures imposed to reduce contagion (Larson et al., 2021, 2022). Even before the pandemic, there were warnings related to overcrowding in urban green spaces located in vulnerable neighborhoods (Mears et al., 2019). However, evidence shows that the risk of contagion is lower in outdoor spaces (Bulfone et al., 2021), and that using parks may be safer than other activities (Johnson et al., 2021). Consequently, at some point during the pandemic, outdoor activities started to be considered essential activities, similar to grocery shopping, thanks to their benefits for individual wellbeing (Ugolini et al., 2020; Lopez et al., 2021). Subsequently, the volume and frequency of use of open spaces did see an increase, as reported for instance in Norway (Venter et al., 2021) or in New York city (Pipitone and Jović, 2021); similarly, citizens from 35 different countries declared that they missed having a garden during confinement and are willing to pay for an accessible green roof (Manso et al., 2021). Despite the different COVID-19-related mobility restrictions in place, several cities introduced measures to safely open city parks at certain times of the day for residents, along with health measures for self-care. The evidence collected during the pandemic shows the importance of maintaining—and a more in-depth study of—accessibility to green areas.
Residents' spatial accessibility to local, basic services—such as parks, schools, grocery stores, etc.—is a hot topic, considering its positive impacts on the environment and personal wellbeing (Litman, 2013; Talen and Koschinsky, 2013; Hall and Ram, 2018). In Europe, this has been demonstrated by the Mayor of Paris, Anne Hidalgo, in 2020, whose re-election campaign was based on the promotion of the “15-min city” (“Le Paris du heure”; Moreno et al., 2021). However, other world regions such as Latin America have shared the same interest in proximity, as demonstrated by the case of Chile (Steiniger et al., 2020; INE, 2021). In Chile, a highly unequal country in an unequal region (Borsdorf and Hidalgo, 2008; Dobbs et al., 2019), accessibility to urban opportunities is related to the socioeconomic level of the population (Vecchio et al., 2020), as well as urban green spaces (Krellenberg et al., 2014). While more than 80% of Chile's population is concentrated in cities, inhabitants often lack walking access to urban green spaces (Steiniger et al., 2020, 2021). Green space distribution and access to parks are often inequitable and unequal within major cities. Nonetheless, vegetation cover, measured in m2 per inhabitant, is often favorable (Rojas et al., 2016). In this context, intermediate Chilean cities (between 50,000 and 300,000 inhabitants) show a better situation in relation to green space provision, being in a more favorable position during a lockdown. In fact, these cities are often favored by their climatic conditions (Steiniger et al., 2021) and many of their green areas are of natural origin, such as hills, wetlands, riverbanks, among others (Rojas et al., 2016; Muñoz et al., 2019). However, planned open spaces such as urban parks often are not necessarily quality spaces, thus complicating their access and use by vulnerable groups, such as older people and people with mobility restrictions (Rojas et al., 2020).
Considering that Chile's climate ranges from desert zones in the North to arctic zones in the South, the natural conditions in several Chilean cities favor the availability of urban green spaces (Steiniger et al., 2021), yet accessibility remains a challenge. Mid-sized cities in central Chile, such as Chillán and Talca, have a Mediterranean climate, which offers favorable conditions for the presence of green spaces to address the potentially increasing demand generated by the pandemic. On the one hand, their intermediate scale, i.e., city size, may facilitate access to green areas by foot; but on the other, their climate conditions and increasingly insufficient rainfalls each year are reducing their vegetation cover (CR2, 2015), due to the need for increased irrigation capacities. According to data from the Center for Climate and Resilience Research (2021)1, Central Chilean cities experience high temperatures in spring and summer. For instance, in 2019, the maximum temperatures exceeded 36°C in Chillán and 35°C in Talca, the two central Chilean cities selected locations for our study of access to green spaces and pandemic restrictions. Average temperature in both cities were around 27°C. However, heat waves presenting much higher temperatures do occur in the Central Valley, and green spaces can play a crucial role in cooling down their surroundings.
In an unequal country, where geographical and institutional vulnerability has exacerbated the impact of the pandemic (Vecchio et al., 2021b), the availability of green spaces has an even greater relevance during a health crisis such as this one. Consequently, this goal of this paper is to analyze the preparedness and accessibility of green spaces in the Chilean cities of Talca and Chillán. Preparedness refers to green space features that promote and remind users to take actions against COVID contagion and is measured through an online perception survey. In this case, accessibility refers to the ability to walk to a green space and is assessed through the use of geographic information systems. To compare the accessibility and well-preparedness, i.e., high quality, of green spaces during COVID-19, we also first evaluate the accessibility of green spaces prior to COVID-19, using green space quality data from the Chilean National Institute of Statistics (INE, 2019).
The online survey was carried out in December 2020 in the two cities. This date was chosen as a time during the pandemic that permitted greater levels of mobility in comparison to previous mobility restrictions and lockdowns implemented by the government. Around this time, the daily infection rate - with a prevalence of the original SARS-CoV-2 - varied between 800 and 2,500 cases (considering a total population of 20 million). This was well below the most critical situation in the previous winter season (i.e. June-August), when cases varied between 1,600 and 4,600 per day (Ministry of Science database, based on the Daily Coronavirus Report, Ministry of Health2) In this sense, considering the time of the survey, we expected an increase in the use of parks and green spaces, in line with reports from other parts of the world (Day, 2020).
Materials and Methods
The Pandemic in Chile: The Government's Step-By-Step Plan
In line with the efforts of several countries to control the spread of the virus by reducing individual mobility (Brauner et al., 2021), the Chilean national government introduced several measures that, as of July 19, 2020, are synthesized in the “Step-by-Step Plan” (Spanish: “Plan Paso a Paso”3, Figure 1). The plan regulates curfews, the activities that can be carried out, and the number of people allowed to gather in different types of spaces. These restrictions are updated every 3 days. Alert levels, known as “phases,” are determined twice a week by the government for each municipality. The plan outlines five different phases (Figure 1) that aim to reduce exposure to COVID-19 contagion by avoiding crowding and limiting mobility, with the most restrictive being “Quarantine” (Phase 1) and the least restrictive being “Advanced Opening” (Phase 5). Until July 2021, a quarantine, i.e., complete lockdown, could be declared in phase 1 (from Monday to Sunday) and phase 2 (weekends only), and people who needed to leave home had to obtain an online permit. However, Phase 3 and up released mobility for people under certain conditions, e.g., the completion of a health passport (“pasaporte sanitario”). Importantly, at the beginning of 2021, the government introduced the possibility to participate in outdoor sporting activities without a permit in Phases 1 and 2. Recreational activities could be performed without a permit only in the morning hours from 5 to 9 am, and 5 to 10 am on the weekends.
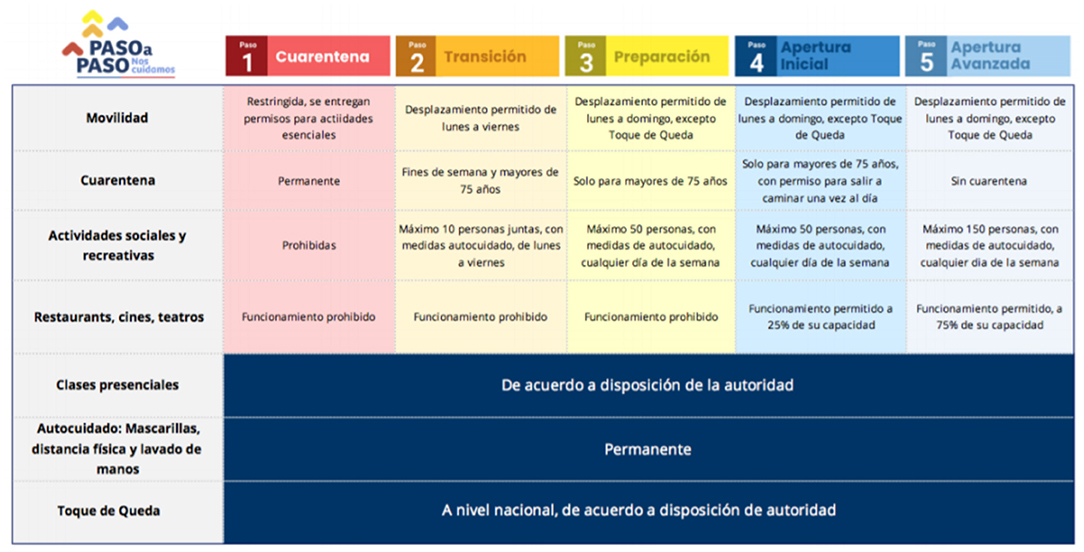
Figure 1. Screenshot of the Step-by-Step plan outlining mobility restrictions in Chile during the pandemic—in Spanish. Source: MINSAL (2020) (Ministry of Health).
Case Studies: The Cities of Talca and Chillán
For the study we focused on two mid-sized cities: Talca (220,400 inhabitants) and Chillán (184,800 inhabitants), which are located between the 35.43°S and 36.59°S latitudes (see Figure 2) in a Mediterranean climate zone. The green space provision indicator gives values of 7.15 m2/inhab. and 5.75 m2/inhab., respectively, according to the National Institute of Statistics (INE, 2019). For 96% of the population in Talca and 92% in Chillán, a public park can be found within a distance of 3 km. Considering the accessibility of public squares and a distance threshold of 400 meters, the results show an excellent population coverage. In Talca and Chillán, 89% and 85% of the population have access to public squares, respectively.
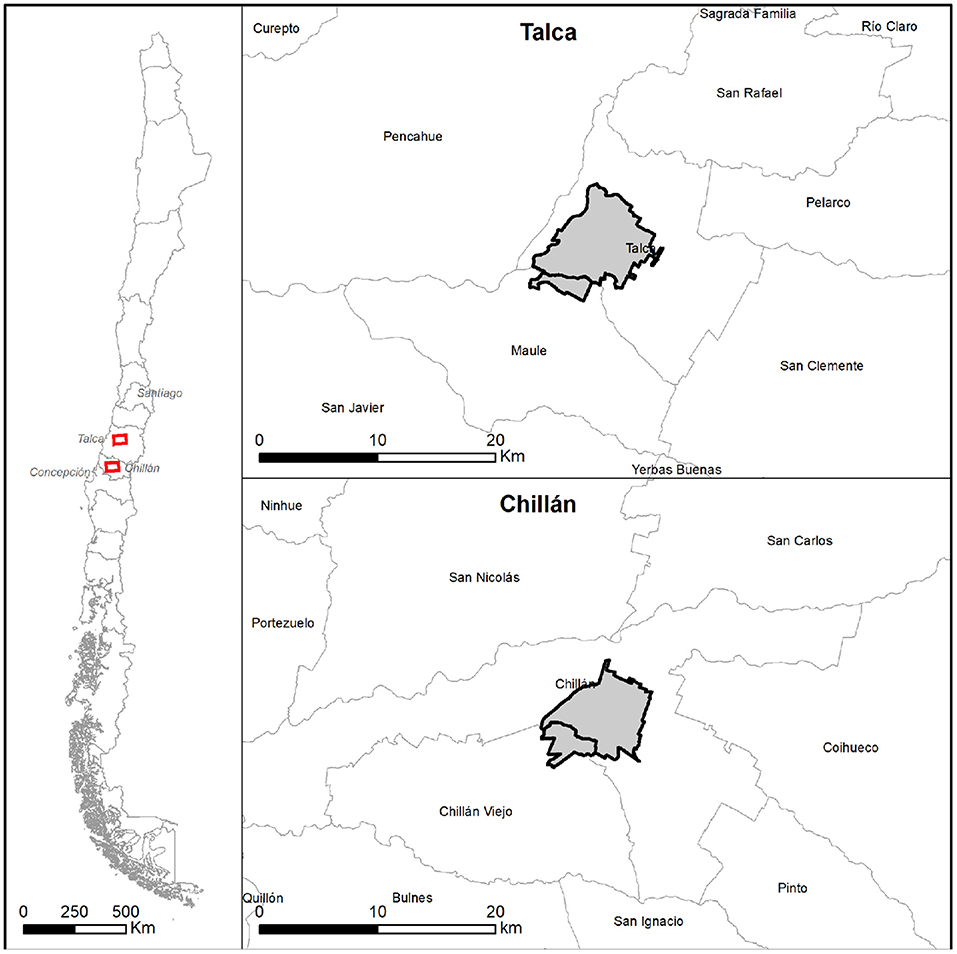
Figure 2. Location of the two Chilean cities in this study: Talca and Chillán. Source: own elaboration.
During the spring of 2020 (from September to mid-December 2020), the total number of confirmed cases per day was declining (Ministry of Health, 2021). In this period, Talca moved between the Phases 2 and 3 of the Step-by-Step plan, while Chillán moved from Phase 1 to 2 at the beginning of October. At the same time, the “Chose to Live Healthy Observatory” observed a shift in modal choices. For example, the use of bicycles increased during the pandemic in Talca, similar to the use of parks and green spaces. This increase was related to lockdown measures, indicating positive effects when well-equipped and safe green spaces are available that are sufficiently prepared and able to accommodate the population (Elige Vivir Sano., 2020).
Considering the provision of urban green spaces, the Chilean National Institute of Statistics (INE, in Spanish), shows a total of 418 neighborhood squares and 35 parks in Talca, and 406 squares and 19 parks in Chillán. This means that both cities have a similarly good availability of public green spaces, although the quality of these differs (INE, 2019). In the case of green spaces, quality is understood and measured by the National Institute of Statistics (INE) in terms of five variables: maintenance, vegetation cover, universal accessibility, safety, and diversity of facilities. A website makes these data available to the public, providing a quality score for each city that is calculated as a weighted average of the five variables for the year 2019 (INE, 2019). For our study, we selected urban squares and parks with vegetation and a surface area of more than 5,000 m2, so as to consider only those parks that can accommodate a large number of people for recreational activities in the context of confinement. In total, we obtained 54 public green spaces for our study in Talca and 43 in Chillán that met the size condition (Table 1, Figure 3).
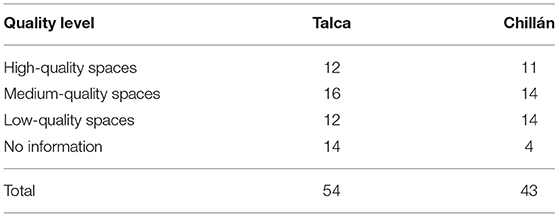
Table 1. Number of parks and neighborhood squares (green areas) in Talca and Chillán according to the three different quality levels as elaborated by INE (2019).
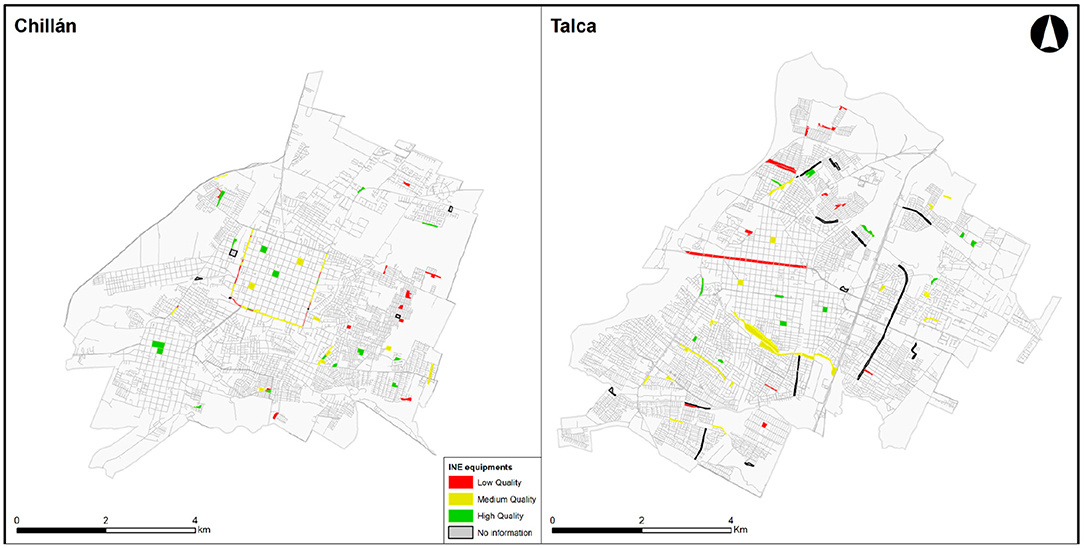
Figure 3. Maps taken from the National Institute of Statistics' online platform (INE, 2019), outlining size and location of green areas in the cities of Talca and Chillán. Colors indicate the square or park quality level out of three possible levels: red–low quality, yellow–medium quality, and green–high quality (gray indicates that no information on quality is available).
Survey on the Perception of Urban Green Spaces
Given the difficulty of performing in-person surveys, we decided to do an online survey on the perception of the quality, i.e., preparedness, of urban green spaces in December 2020. In this sense, the survey was prepared for the two cities of Talca and Chillán with respect to the maps and data presented. Invitations to the survey were distributed via the social media platforms of the Chilean Research Center for Sustainable Urban Development (CEDEUS). At the time of the survey, the number of followers for the different CEDEUS social media accounts, each of which likely reaches different types of audiences, is detailed as follows: Facebook: 4,757 followers, Twitter: 11,095 followers, and Instagram: 8,956 followers. Therefore, the CEDEUS followers provide a good base for an online survey, however, our targeted audience are inhabitants of either Talca or Chillán. Additionally, the study authors promoted the survey using their own social media accounts.
The social media invitation posts contained a link to a survey invitation on the CEDEUS website, which then included two additional links, one for each city. The survey forms were designed and hosted with the “ArcGIS Survey 123” app. The survey questions were designed to explore the preparedness of squares and parks for receiving residents under conditions of social distancing and other general COVID-19 measures. As may be seen from the Spanish survey form in Figure 4, participants were asked to choose a particular green space or square to evaluate. Then she/he was asked to answer 10 multiple-choice questions, provide open-ended comments, and upload a photo of the park. For example, the first question on the survey in Spanish translates to: “How would you rate the condition of the park and/or green area?” The participant was then given multiple-choice options to select from. In the case of the first question, the possible answers were: (a) insufficient, (b) regular, (c) appropriate. The second question was (translated from Spanish): “Does the park have signage indicating the maximum number of people allowed, social distancing reminders, self-protection measures, etc.?” The options given to this question were (a) yes, (b) no, and (c) I don't know. The Appendix and Figures 7A,B provide the complete set of questions along with the results. Further sociodemographic questions, e.g., related to the participant's gender, age, or profession, were not asked.
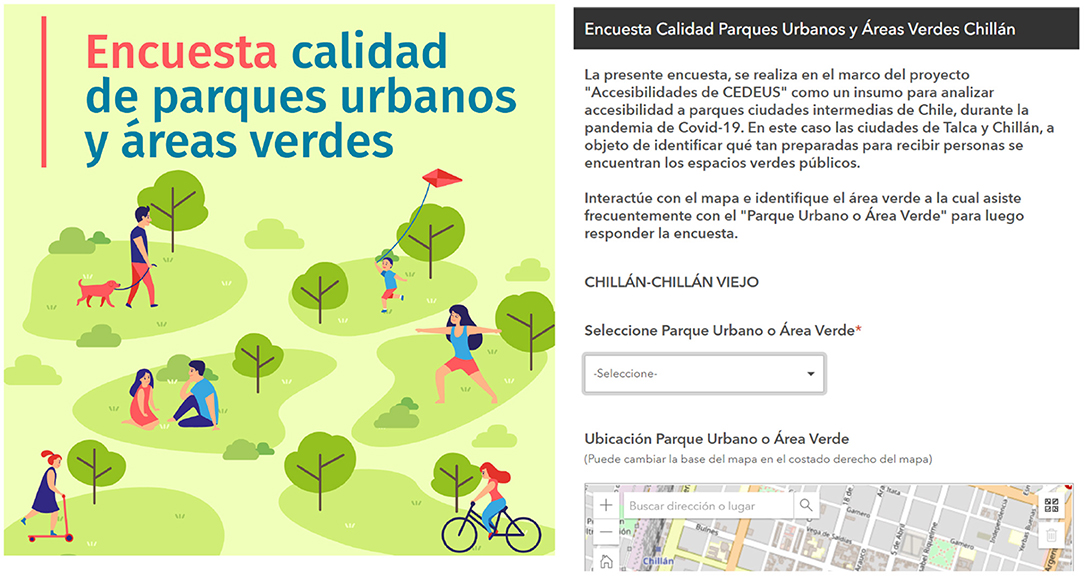
Figure 4. Spanish language invitation and initial survey form on the quality of parks and green areas (for links to the survey form see the Data section).
The survey took place between December 1st and 20th. In this time, we gathered around 60 responses for both cities. Some respondents provided additional comments (12 for Chillán and 16 for Talca) and photos (see Figure 9) to verify the situation of the park or green area. When a park or square was evaluated by more than one person, the results were averaged.
Accessibility Assessment
The quantitative accessibility indicator used estimates the population with walking access to urban squares and parks in the cities of Talca and Chillán. In this sense, accessibility is first calculated for all green spaces as a whole, and then separately for each quality level, considering the quality as per INE (2019) and perceived quality levels from the survey. Three types of data are used, in relation to green space supply, demand, and infrastructure:
• Supply data—include the urban green spaces, that is, the actual squares and parks that are accessible to the population. The entrance to each evaluated park and square is considered as the destination point for walking trips to urban green spaces. No specific criteria of universal accessibility are considered.
• Demand data—include the potential users of urban green spaces, that is, the inhabitants of Talca and Chillán. Data source is the 2017 Chilean National Census. Inhabitants are associated with the census blocks where they live and the georeferenced centroid of each block is the origin point of each trip.
• Infrastructure data—refer to the pedestrian network, that is, the infrastructure by which people access parks. The data source is road network data from OpenStreetMap, but with additional topological corrections.
As for the travel speed, an average walking speed of 3.5 km/h is assumed. This value is obtained considering different international references, such as a walking speed of 4.2 km/h for children (Reyes et al., 2014), 4.5 km/h for adults (Stepniak and Goliszek, 2017), 2.0 km/h for older people (Varela et al., 2009). Finally, access times are estimated using the Network Analyst tool provided by ArcGIS. These are represented in the maps showing accessibility areas with access times, i.e., isochrones, of up to 15, 30, and over 30 min. Thereby, the IDW (Inverse Distance Weighting) spatial interpolation method was used to obtain accessibility times throughout the whole city (Longley et al., 2011). Sixteen maps are produced, eight for each city, differentiating accessibility by quality level based on official statistics and perceived quality, as obtained from the survey. Finally, the percentages of the population with access to green spaces are calculated according to the quality levels and walking times.
Results
Pre-pandemic Park Accessibility
The results calculated in the accessibility evaluation for the most frequently used green areas during the pandemic were classified according to quality and travel time. In the latter case, we consider a threshold of 15 min walking as optimal and walking times of more than 30 min as unfavorable. The results show that, for Talca, urban green space accessibility is excellent in general (more than 80%), due to a large number of parks and squares available within 15 min' walking distance (Figure 5, Table 2). However, when quality is considered, only around 51% of the population has access to high-quality green areas within a 15-min walk, while 41% of the population can access just a low-quality green area within 15 min. Medium-quality green spaces have a better coverage than high-quality spaces, with accessibility for 61% of the population. Given a higher percentage of residents with access to green spaces within 15 min, the percentage of people who need to walk more than 30 min is low, ranging from 27 to 13% for the different quality levels (see Table 2).
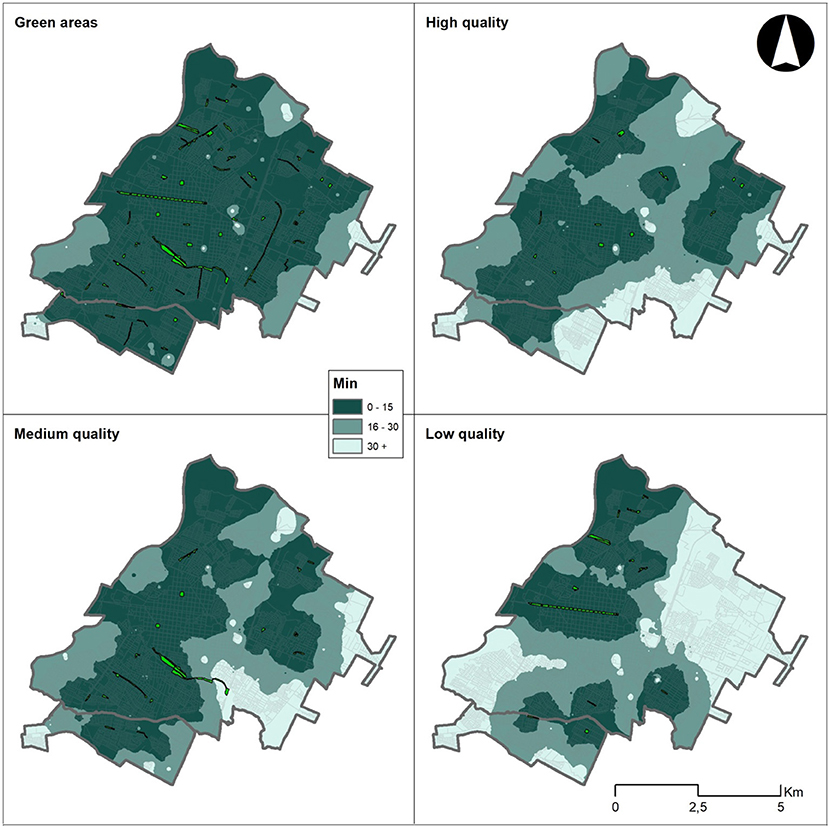
Figure 5. Accessibility of urban green spaces in Talca, for all green areas (top left), and according to quality levels.
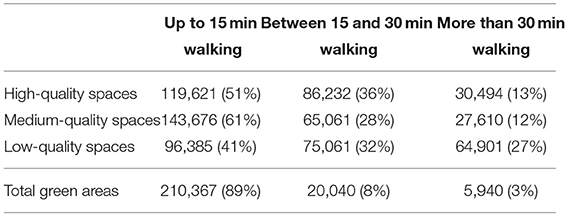
Table 2. Population with access to urban green spaces in Talca, considering a total of 220,400 inhabitants.
Similar results are obtained for the city of Chillán, which shows good accessibility of urban green spaces in general, for nearly 80% of their population (Table 3, Figure 6). When differentiating parks and squares by quality, we find that more than 50% of the population can get to a high-quality park or square in <15 min; the same applies to regular quality spaces (52%; see Table 3). Only 8% of the population needs to walk more than 30 min to get to a high-quality green space and 2% for all green spaces.
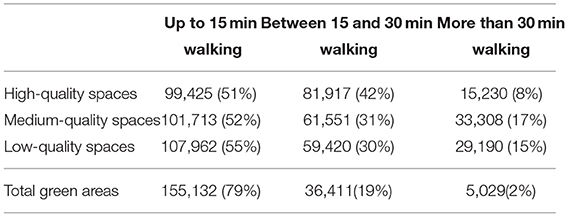
Table 3. Population with access to urban green spaces in Chillán, considering a total of 184,800 inhabitants.
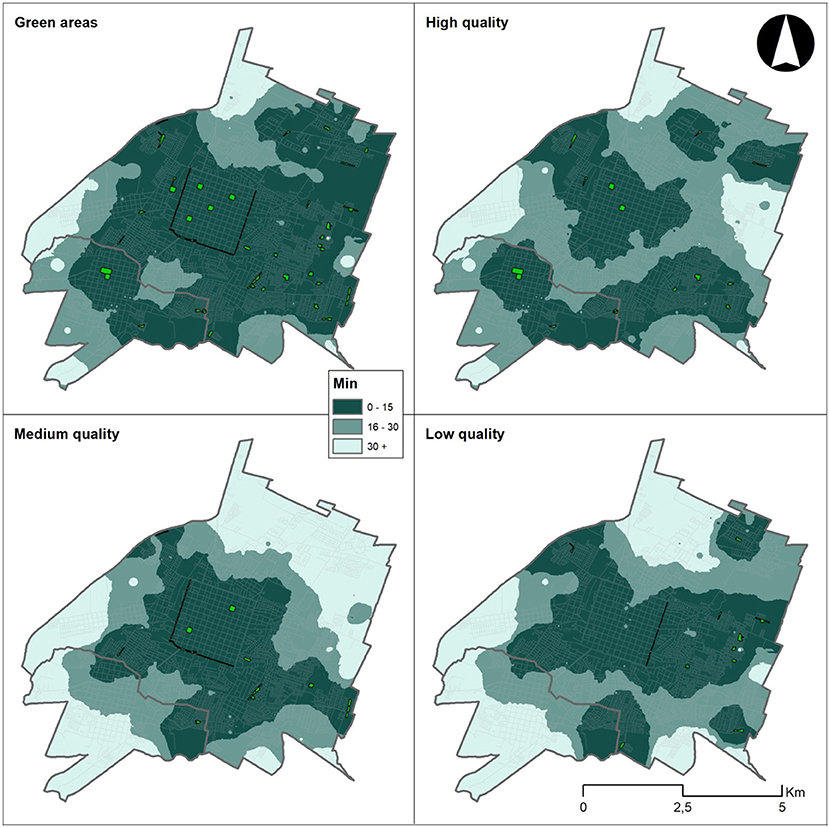
Figure 6. Accessibility of urban green spaces in Chillán, for all green areas (top left), and according to quality levels.
Perception of the Parks During the Pandemic
In total, the 60 respondents evaluated 33 urban green spaces−16 in Talca and 17 in Chillán. As for their quality, it appears that the number of parks and squares with regular or insufficient quality is similar for both cities (Figures 7A,B). In Talca, <25% of the facilities have been found to be adequately prepared for COVID-19 measures, and in Chillán <20% (Question A). For example, respondents mention that they found no signage explaining how to use the spaces safely or reminding them of social distancing (Question B). Moreover, participants indicate that over 70% of the green spaces evaluated do not have more garbage bins, useful for disposable face masks or other waste associated with the prevention of COVID-19 (Question D). As for the closure of park furnishings (e.g., benches, statues, play or fitness equipment, etc.) to avoid contagion through contact with shared surfaces, respondents perceive that these measures have not been implemented in squares and parks, with a negative assessment of 80% in Talca and 70% in Chillán (Question E). However, the perception of the maintenance of social distancing among green space users was more positive: 50% of the respondents in Talca and nearly 60% in Chillán found that social distancing was followed (Question F).
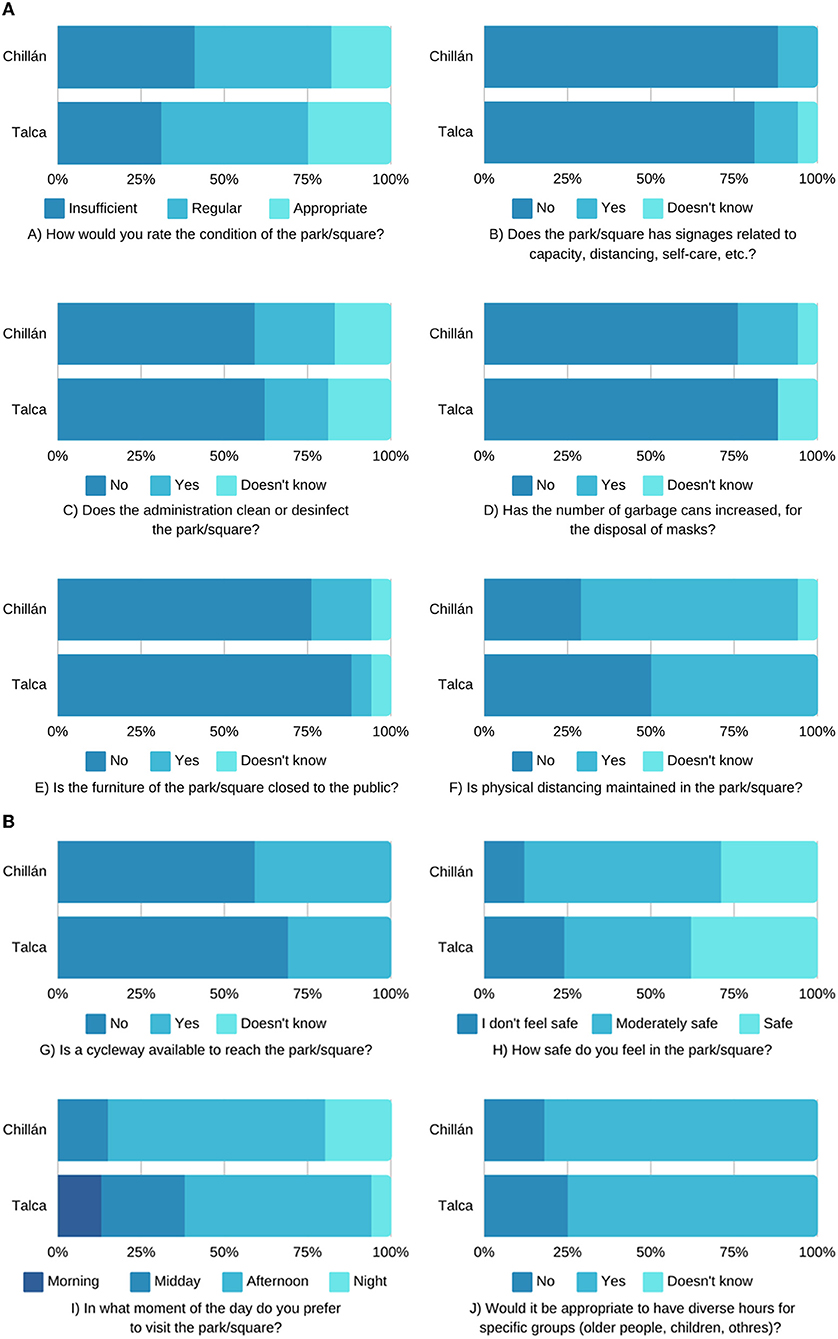
Figure 7. (A) Statistical evaluation of survey responses, questions A to F. (B) Statistical evaluation of survey responses, questions G to J.
Regarding travel options to parks and squares, the possibility of getting to urban green spaces using safe and sustainable transport modes was found to be limited for the two cities examined. Less than 45% of the respondents answered that bicycle routes are available for getting to squares and parks (Question G). Compared to other cities, worldwide and particularly in Latin America (Combs and Pardo, 2021; Vecchio et al., 2021a), the two cities in question did not promote or implement emergency interventions for sustainable mobility during the pandemic.
A further question explored perceived safety when visiting urban green spaces during the pandemic. Here respondents may have referred mainly to self-care considering the history of COVID-19. Overall, participants feel moderately safe, although nearly 25% of the respondents in Talca feel unsafe (Figure 7B-Question H). Along with this question on safety, which may also include concerns related to crime, we asked for the preferred time of the day for visiting the green space (Question I). Here respondents show a strong preference for the afternoon, especially in Chillán. Interestingly, this time slot is preferred despite overlap with online classes (both schools and universities). This preference for using urban green spaces in the afternoon is also in contradiction with the government's COVID-19 measures that allow for physical activity in the morning hours. In this regard, respondents found believed it would be best if different time blocks were assigned to certain demographic or age groups (Question J).
Reassigning Quality Levels During the Pandemic
The quality of parks is re-evaluated and assigned according to the results of the perception survey (Figure 8, Table 4). In particular, we used the responses to question A, “How would you rate the condition of the park and/or green area?” (Figure 7), to assign a new quality level for each green space evaluated by participants. The new assessment indicates that the quality level for several green spaces changed in both cities. Before the pandemic, the evaluation by the INE identified mainly high-quality and medium-quality urban green spaces (>50%). However, during the pandemic, survey participants perceived the most used green spaces as medium-quality and/or low-quality (Table 4), perhaps due to a lack of implementation of COVID-19 protection measures. Figure 9 shows some photos of the parks most mentioned in the survey.

Figure 8. The 33 green spaces that were evaluated by survey participants, colored by perception.
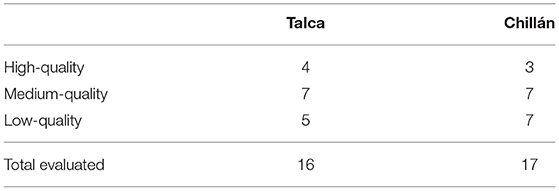
Table 4. Number of parks and squares in Talca and Chillán by quality level, taken from the results of question A of the perception survey.
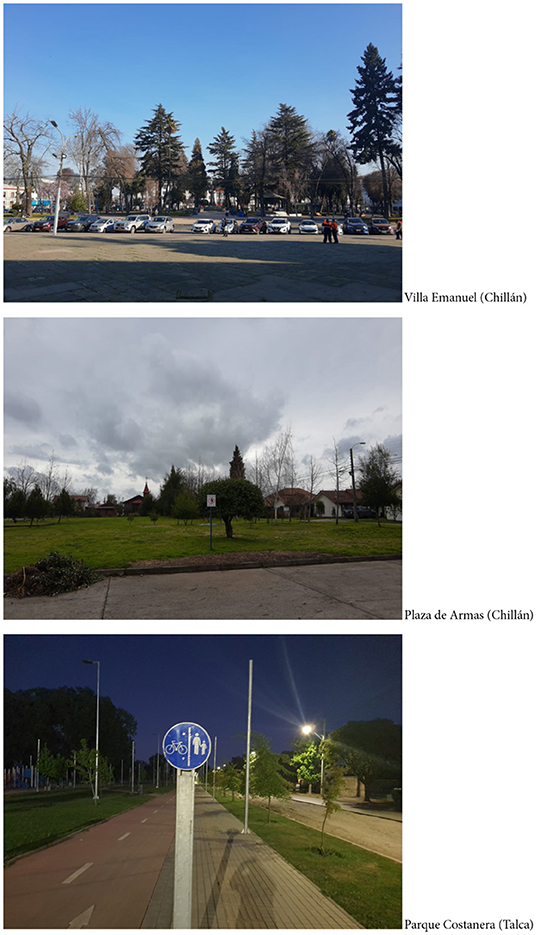
Figure 9. Photographs of green areas in the two cities: (1) Villa Emanuel and (2) Plaza de Armas are the most mentioned urban green spaces in Chillán. In Talca, the most mentioned green space is (3) Parque Costanera (see the map in Figure 8 for location references).
Accessibility of Parks and Squares: Pandemic-Related Variations
It is first important to note that green spaces not evaluated were excluded from the new accessibility analysis. Considering the new perception-based quality levels of the green spaces used during the pandemic, their accessibility was recalculated. In general, and when looking at Chillán (Figure 10, Table 5), around 60% of the city's population has access to the 17 green spaces mentioned in the survey, within a 15-min walk. However, taking the quality levels into account, the accessibility of urban green spaces varies greatly, with the city's central areas offering better accessibility. At least half of the population has no high-quality green space available (Table 5) within 30 min. For the same walking time threshold, medium-quality and low-quality green spaces are able to serve 23 and 35% of the population, respectively.
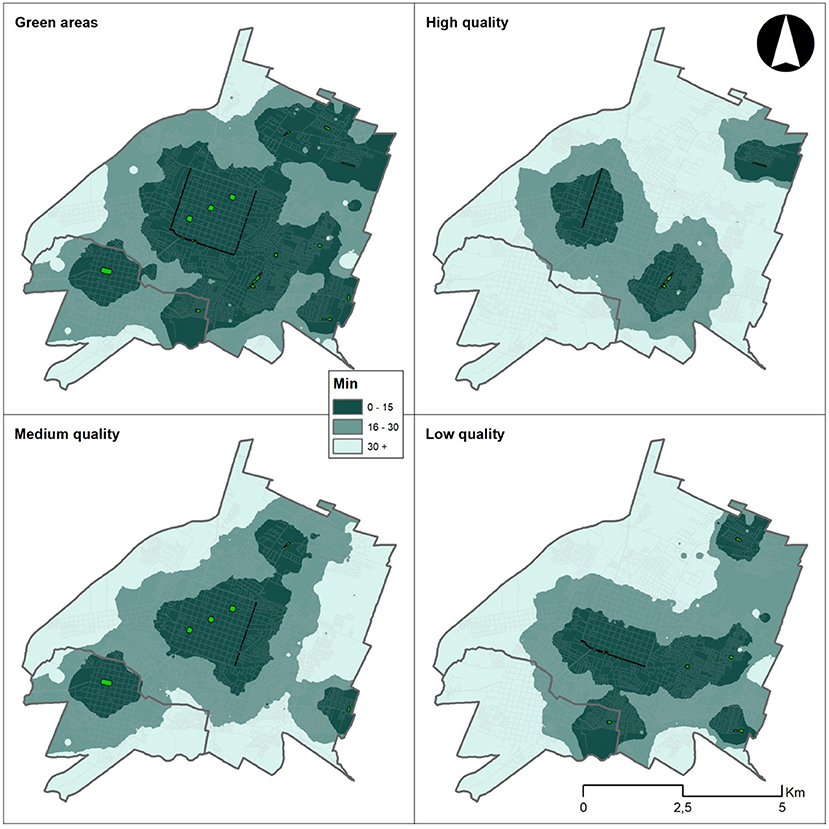
Figure 10. Accessibility of green areas in Chillán, with green space quality levels obtained from the survey.
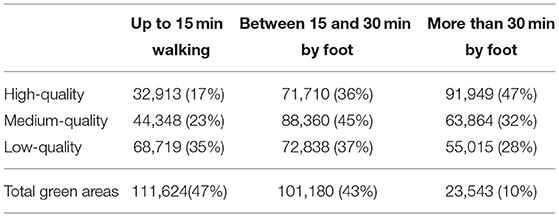
Table 5. Population with access to urban green spaces in Chillán, with quality levels obtained from the survey.
In Talca (Figure 11, Table 6) 60% of the population has walking access within 15 min to the green spaces surveyed. High-quality urban green spaces are located in the city center (middle of the grid plan) and are accessible for 16% of the population within a 15-min walk. Both medium-quality and low-quality green spaces are able to serve 22% of the population, assuming a 15-min walk. High-quality areas are the least accessible in Talca; as for Chillán, barely half of the population (47%) has access to a high-quality green space within a 30-min walk.

Figure 11. Accessibility of green spaces in Talca, with green space quality levels obtained from the survey.
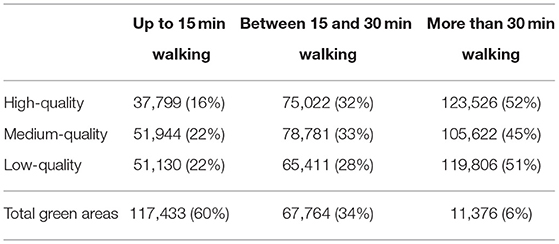
Table 6. Population with access to urban green spaces in Talca, with quality levels obtained from the survey.
Discussion
The survey results on the perception of green space preparedness and our accessibility evaluation of urban green spaces in Chillán and Talca not only indicate the level of quality and provision of significant recreational spaces during COVID-19, but also allow for a broader reflection on the implications for urban planning and policy in other mid-sized cities. Considering the pre-COVID-19 situation, it is applaudable that both cities have worked toward improving the quality of their parks and squares in general, as the official INE quality study shows, with many green spaces being ranked as high-quality and medium-quality. Similarly, it is good news that the accessibility of high-quality green spaces in both cities has been fairly good, since around 50% of the population can access them within a 15-min walk. Hence, both Chillán and Talca appear to provide spaces that can effectively contribute to the physical and mental wellbeing of their inhabitants. However, both cities also show a significant presence of low-quality facilities (22 vs. 32%). We have assessed these low-quality facilities as having good accessibility for the population (41 and 55%), but the maps show that they tend to be located in the peripheral sectors of both cities (Figures 5, 6). If the quality of these can be improved, it would make high-quality urban green spaces available also to residents of the peripheral neighborhoods.
During the COVID-19 pandemic, with lockdowns and telecommuting options or orders, the perception of the importance and value of green spaces has changed positively, demonstrating their impact on the wellbeing of urban residents (Manso et al., 2021) and on their sense of belonging (Pipitone and Jović, 2021). For residents of Chilean cities this holds true, and our pre-COVID accessibility analysis shows that there is good walking access to high-quality urban green spaces in Talca and Chillán, thus supporting the residents' wellbeing in this new and difficult situation. However, health-related measures, such as limiting the number of users and encouraging social distancing, and adequate preparation of green spaces are useful instruments to remind and encourage individuals to be wary of contagion. Considering these measures and the results of our survey, we found that only a few (i.e., 7) green spaces can be labeled as “prepared,” that is, maintaining a high level of quality; however, please keep in mind that we only received feedback on 33 of 97 green spaces for the two cities. Given this situation, the accessibility of high-quality green spaces seems greatly reduced, but implementing the measures that we suggest in our survey (like appropriate signage, more garbage bins, and the closure of certain park equipment, etc.) is neither costly nor complicated. Thus, previous levels of access to high-quality green spaces can quickly be restored.
The size of the two cities also allows for a reflection on accessibility-by-proximity, a concept that has gained attention during the pandemic. During the campaign for the 2020 municipal elections of Paris, the concept of the 15-min city (Moreno et al., 2021) started a revival of the concept of proximity, as a principle that can provide people with sufficient opportunities within a limited walking distance (i.e., 15 min). This reduces travel time and contributes to cities that enhance the wellbeing of their inhabitants and promote sustainability (Steiniger et al., 2020; Moreno et al., 2021). The concept of proximity is nothing new, but the pandemic has once again shown the importance of being able to get to relevant places within short spatial and temporal distances, reducing travel times and the risk of contagion associated with the use of public transport or long times spent in closed public spaces. The concept of a 15-min city has been widely discussed, especially in relation to European cities, where compact form and mixed land use facilitate the promotion of proximity; however, in expansive and segregated cities such as those found in Latin American, proximity is more difficult to promote and only available to few, often affluent areas (Borsdorf and Hidalgo, 2008; Steiniger et al., 2020; see for example Guzman et al., 2021). Nonetheless, mid-sized cities may prove more suitable for the promotion of proximity-based urban planning strategies: not only their limited dimensions reduce the distances to be covered, especially for peripheral areas, but their specific socio-spatial patterns do not necessarily reflect the same forms of segregation as found in metropolitan areas (Vergara and Salazar, 2021).
The possibility of considering the quality of existing urban green spaces also allows for a more precise estimate of leisure spaces available to the population. As the examined cases show, the quality of a square or a park does influence its attraction to neighbors and may affect its use; moreover, evaluations based solely on objective criteria may provide results that differ from perception. This issue highlights two elements that can be crucial to the evaluation of accessibility of city opportunities. First, it is important to consider not only the number of available opportunities but also their quality; in fact, a park that is perceived as safe may experience better use by neighbors and provide a different contribution to the individuals' wellbeing compared to a park perceived as unsafe (Steiniger et al., 2019). Second, people's perception is crucial when considering accessibility, leading to a distinction between objective and perceived accessibility (Talen and Koschinsky, 2013; Lee and Dean, 2018); while the former is assessed using established metrics, the second takes into account the opportunities that people perceive available to them, for example, thanks to a specific transport mode (Lättman et al., 2018). Considering this, a person may perceive that a park is not available not only if they consider it to be unsafe, but also when they feel that the route to reach it is unsafe.
In relation to public strategies focused on urban green spaces, the examined cases show the importance of providing parks and squares and adequately managing them. As the pandemic has shown in relation to other relevant public spaces and services (from public transport to public offices), emergency situations may require the implementation of specific adaptations so that people can continue to access and use such services (Vecchio et al., 2021a). The survey performed, despite some limitations with respect to the number of responses, shows, for example, that the survey takers considered that the preventive measures implemented in parks and squares were not sufficient, reflecting a limited institutional capacity in Chile to adapt crucial public spaces to critical events (Vecchio et al., 2021b). Our reflections are, of course, grounded in the context of the COVID-19 pandemic, but they may also be valid in relation to other possible emergencies or crises. Therefore, especially for growing cities, it is crucial to plan and prepare urban green spaces by taking into account a diversity of aspects, including spatial location, layout, forms of management, etc., since parks and squares are an essential asset for the wellbeing of the population.
Of course, our study has some limitations. First, given individual and public measures due to COVID-19, it was only possible to do an online survey. The resulting number of around 60 responses is also somewhat small, making it rather indicative instead of representative. This holds particularly true for the quality assessment, i.e., preparedness survey, of individual green spaces, where each green space evaluated would ideally have at least five evaluations. As a result, it is not possible to compare the accessibility of high-quality urban green spaces before and during the pandemic, as the green spaces evaluated represent only a subset of the whole (i.e., 33 of 97). Given this, we plan to address these issues by performing an in-person survey within the next year. Therefore, we aim to increase the number of participants, assess the location of their homes, and also collect socioeconomic data to explore differences in green space use and availability among different socioeconomic groups (Pipitone and Jović, 2021).
Conclusions
The accessibility of urban green spaces by quality is excellent in both cities, but quality is a condition that limits the facilities to people in those areas. Considering COVID conditions, the quality of urban parks was insufficient for users to feel safe, thus reducing their impact on wellbeing. The spaces are not prepared for emergencies, as shown by a lack of COVID-19 protection measures.
The capacity to respond in moments of crisis is related to resilience, and this must be a priority for cities after a pandemic—especially in the face of many crises that are happening simultaneously (water scarcity, climate change, and economic consequences) and potentially require open-air spaces of refuge. Urban parks and open spaces feel more protective to people, so it is necessary to pay greater attention to planning to proximity. In that sense, people's perception is a relevant input for the evaluation of accessibility. It provides significant insights into urban plans and policies that intend to promote people's wellbeing, particularly in the case of urban green spaces and active mobility in mid-sized cities in Latin America.
Future research shall focus on measuring reasonable quality to calculate accessibility after a pandemic and lead the city in sustainability i.e., more walkable neighborhoods. COVID-19 has had many negative consequences for cities, such as the decline in use of public transport. However, a greater demand for open and green spaces is an opportunity to improve the quality of public spaces, which may justify the levels of access that need to be further researched.
Data Availability Statement
The raw data supporting the conclusions of this article will be made available by the authors, without undue reservation.
Survey form for Talca: https://survey123.arcgis.com/share/1b20723eec1c4de58703d3e6c4345452.
Survey form for Chillán: https://survey123.arcgis.com/share/f92ceccee740410a822101622b8e0fa0.
Ethics Statement
Ethical review and approval was not required for the study on human participants in accordance with the local legislation and institutional requirements. The patients/participants provided their written informed consent to participate in this study.
Author Contributions
All authors listed have made a substantial, direct, and intellectual contribution to the work and approved it for publication.
Funding
This research was financed by CEDEUS ANID/FONDAP 15110020.
Conflict of Interest
The authors declare that the research was conducted in the absence of any commercial or financial relationships that could be construed as a potential conflict of interest.
Publisher's Note
All claims expressed in this article are solely those of the authors and do not necessarily represent those of their affiliated organizations, or those of the publisher, the editors and the reviewers. Any product that may be evaluated in this article, or claim that may be made by its manufacturer, is not guaranteed or endorsed by the publisher.
Supplementary Material
The Supplementary Material for this article can be found online at: https://www.frontiersin.org/articles/10.3389/frsc.2022.816688/full#supplementary-material
Footnotes
References
Akintunde, T. Y., Musa, T. H., Musa, H. H., Musa, I. H., Chen, S., Ibrahim, E., et al. (2021). Bibliometric analysis of global scientific literature on effects of COVID-19 pandemic on mental health. Asian J. Psychiatr. 63, 102753. doi: 10.1016/j.ajp.2021.102753
Amoushahi, S., Salmanmahiny, A., Moradi, H., Tabrizi, A. R. M., and Galán, C. (2022). Localizing sustainable urban development (SUD): Application of an FDM-AHP approach for prioritizing urban sustainability indicators in Iran provinces. Sustain. Cities Soc. 77, 103592. doi: 10.1016/j.scs.2021.103592
Astell-Burt, T., and Feng, X. (2021). Time for ‘green’during COVID-19? Inequities in green and blue space access, visitation and felt benefits. Int. J. Environ. Res. 18, 2757. doi: 10.3390/ijerph18052757
Borsdorf, A., and Hidalgo, R. (2008). New dimensions of social exclusion in Latin America: From gated communities to gated cities, the case of Santiago de Chile. Land Use Policy. 25, 153–160. doi: 10.1016/j.landusepol.2007.04.001
Brauner, J. M., Mindermann, S., Sharma, M., Johnston, D., Salvatier, J., Gavenčiak, T., et al. (2021). Inferring the effectiveness of government interventions against COVID-19. Science. 371(6531). doi: 10.1126/science.abd9338
Bulfone, T. C., Malekinejad, M., Rutherford, G. W., and Razani, N. (2021). Outdoor transmission of SARS-CoV-2 and other respiratory viruses: a systematic review. J. Infect. Dis. 223, 550–561. doi: 10.1093/infdis/jiaa742
Bull, F. C., and Hardman, A. E. (2018). Walking: a best buy for public and planetary health. Br. J. Sports Med. 52, 755–756. doi: 10.1136/bjsports-2017-098566
Center for Climate and Resilience Research. (2021). Explorador Climático. Available online at: https://explorador.cr2.cl/
Chiabai, A., Quiroga, S., Martinez-Juarez, P., Suárez, C., García de Jalón, S., and Taylor, T. (2020). Exposure to green areas: Modelling health benefits in a context of study heterogeneity. Ecol. Econ. 167, 106401. doi: 10.1016/j.ecolecon.2019.106401
Combs, T. S., and Pardo, C. F. (2021). Shifting streets COVID-19 mobility data: findings from a global dataset and a research agenda for transport planning and policy. Transp. Res. Interdiscip. Perspect.9, 100322. doi: 10.1016/j.trip.2021.100322
CR2 - Center for Climate and Resilience Research. (2015). The 2010-2015 mega-drought: A lesson for the future. Available online at: http://www.cr2.cl/eng/the-2010-2015-mega-drought-a-lesson-for-the-future/
Day, B. H. (2020). The value of greenspace under pandemic lockdown. Environ. Resour. Econ. (Dordr). 76, 1161–1185. doi: 10.1007/s10640-020-00489-y
Di Nardo, F., Saulle, R., and La Torre, G. (2010). Green areas and health outcomes: a systematic review of the scientific literature. Ital. J. Public Health. 7, 402–413.
Dobbs, C., Escobedo, F. J., Clerici, N., de la Barrera, F., Eleuterio, A. A., MacGregor-Fors, I., et al. (2019). Urban ecosystem services in Latin America: mismatch between global concepts and regional realities? Urban Ecosyst. 22, 173–187. doi: 10.1007/s11252-018-0805-3
Elige Vivir Sano. (2020). Microestudio: Aumento del Flujo de Bicicleta en 5 Ciudades de Chile 2019-2020, Observatorio Elige Vivir Sano. Available online at: http://eligevivirsano.gob.cl/
Fagerholm, N., Eilola, S., and Arki, V. (2021). Outdoor recreation and nature's contribution to well-being in a pandemic situation-Case Turku, Finland. Urban For. Urban Green. 64, 127257. doi: 10.1016/j.ufug.2021.127257
Gascon, M., Triguero-Mas, M., Martínez, D., Dadvand, P., Rojas-Rueda, D., Plasència, A., et al. (2016). Residential green spaces and mortality: A systematic review. Environ. Int. 86, 60–67. doi: 10.1016/j.envint.2015.10.013
Guzman, L. A., Arellana, J., Oviedo, D., and Aristizábal, C. A. M. (2021). COVID-19, activity and mobility patterns in Bogotá. Are we ready for a ‘15-minute city'? Travel Behav. Soc. 24, 245–256. doi: 10.1016/j.tbs.2021.04.008
Hall, C. M., and Ram, Y. (2018). Walk score® and its potential contribution to the study of active transport and walkability: A critical and systematic review. Transp. Res. D Transp. Environ. 61, 310–324. doi: 10.1016/j.trd.2017.12.018
Hoover, F. A., and Lim, T. C. (2021). Examining privilege and power in US urban parks and open space during the double crises of antiblack racism and COVID-19. Socio-Ecol. Pract. Res. 3, 55–70. doi: 10.1007/s42532-020-00070-3
INE. (2019). Indicadores de Plazas y Parques Urbanos. Available online at: https://storymaps.arcgis.com/stories/391dac6ee0c3438fbf186aed3ea1cff1
INE. (2021). SIEDU – Sistema de Indicadores y Estándares de Desarrollo Urbano. Instituto Nacional de Estadistica. Available online at: https://www.ine.cl/herramientas/portal-de-mapas/siedu/
Johnson, T. F., Hordley, L. A., Greenwell, M. P., and Evans, L. C. (2021). Associations between COVID-19 transmission rates, park use, and landscape structure. medRxiv. 2020–10. doi: 10.1016/j.scitotenv.2021.148123
Klompmaker, J. O., Hart, J. E., Holland, I., Sabath, M. B., Wu, X., Laden, F., et al. (2021). County-level exposures to greenness and associations with COVID-19 incidence and mortality in the United States. Environ. Res. 199, 111331. doi: 10.1016/j.envres.2021.111331
Kolimenakis, A., Solomou, A. D., Proutsos, N., Avramidou, E. V., Korakaki, E., Karetsos, G., et al. (2021). The socioeconomic welfare of urban green areas and parks; a literature review of available evidence. Sustainability. 13, 7863. doi: 10.3390/su13147863
Krellenberg, K., Welz, J., and Reyes-Päcke, S. (2014). Urban green areas and their potential for social interaction – A case study of a socio-economically mixed neighbourhood in Santiago de Chile. Habitat International, 44, 11–21. doi: 10.1016/j.habitatint.2014.04.004
Lachowycz, K., and Jones, A. P. (2011). Greenspace and obesity: a systematic review of the evidence. Obesity Rev. 12, e183–e189. doi: 10.1111/j.1467-789X.2010.00827.x
Larson, L. R., Mullenbach, L. E., Browning, M. H., Rigolon, A., Thomsen, J., Metcalf, E. C., et al. (2022). Greenspace and park use associated with less emotional distress among college students in the United States during the COVID-19 pandemic. Environ. Res. 204, 112367. doi: 10.1016/j.envres.2021.112367
Larson, L. R., Zhang, Z., Oh, J. I., Beam, W., Ogletree, S. S., Bocarro, J. N., et al. (2021). Urban park use during the COVID-19 pandemic: Are socially vulnerable communities disproportionately impacted? Front. Sust. Cities. 103. doi: 10.3389/frsc.2021.710243
Lättman, K., Olsson, L. E., and Friman, M. (2018). A new approach to accessibility–Examining perceived accessibility in contrast to objectively measured accessibility in daily travel. Res. Transp. Econ. 69, 501–511. doi: 10.1016/j.retrec.2018.06.002
Lee, E., and Dean, J. (2018). Perceptions of walkability and determinants of walking behaviour among urban seniors in Toronto, Canada. J Transport Health. 9, 309–320. doi: 10.1016/j.jth.2018.03.004
Litman, T. (2013). Transportation and public health. Annu. Rev. Public Health. 34, 22–21. doi: 10.1146/annurev-publhealth-031912-114502
Longley, P. A., Goodchild, M. F., Maguire, D. J., and Rhind, D. W. (2011). Geographic Information Systems and Science. 3rd Edition. New York, NY: John Wiley and Sons.
Lopez, B., Kennedy, C., Field, C., and McPhearson, T. (2021). Who benefits from urban green spaces during times of crisis? Perception and use of urban green spaces in New York City during the COVID-19 pandemic. Urban For. Urban Green. 65, 127354. doi: 10.1016/j.ufug.2021.127354
Maas, J., Verheij, R. A., Groenewegen, P. P., De Vries, S., and Spreeuwenberg, P. (2006). Green space, urbanity, and health: how strong is the relation? J. Epidemiol. Community Health. 60, 587–592.
Manso, M., Sousa, V., Matos Silva, C., and Oliveira Cruz, C. (2021). The role of green roofs in post COVID-19 confinement: An analysis of willingness to pay. J. Build. Eng. 44, 103388. doi: 10.1016/j.jobe.2021.103388
Mears, M., Brindley, P., Maheswaran, R., and Jorgensen, A. (2019). Understanding the socioeconomic equity of publicly accessible greenspace distribution: the example of Sheffield, UK. Geoforum. 103, 126–137. doi: 10.1016/j.geoforum.2019.04.016
MINSAL. (2020). Available online at: www.minsal.cl
Moreno, C., Allam, Z., Chabaud, D., Gall, C., and Pratlong, F. (2021). Introducing the “15-Minute City”: Sustainability, Resilience and Place Identity in Future Post-Pandemic Cities. Smart Cities. 4(1), 93–111. doi: 10.3390/smartcities4010006
Muñoz, J. C., Barton, J., Frías, D., Godoy, A., Bustamante, W., Cortés, S., et al. (2019). Ciudades y Cambio Climático en Chile: Recomendaciones desde la evidencia científica. Santiago: Comité COP25. Ministerio de Ciencia, Tecnología, Conocimiento e Innovación.
Navarrete-Hernandez, P., and Laffan, K. (2019). A greener urban environment: Designing green infrastructure interventions to promote citizens' subjective wellbeing. Landsc. Urban. 191, 103618. doi: 10.1016/j.landurbplan.2019.103618
Nielsen, T. S., and Hansen, K. B. (2007). Do green areas affect health? Results from a Danish survey on the use of green areas and health indicators. Health Place. 13, 839–850. doi: 10.1016/j.healthplace.2007.02.001
Pipitone, J., and Jović, S. (2021). Urban green equity and COVID-19: Effects on park use and sense of belonging in New York City. Urban For. Urban Green. 65, 127338. doi: 10.1016/j.ufug.2021.127338
Pouso, S., Borja, Á., Fleming, L. E., Gómez-Baggethun, E., White, M. P., and Uyarra, M. C. (2021). Contact with blue-green spaces during the COVID-19 pandemic lockdown beneficial for mental health. Sci. Total Environ. 756, 143984. doi: 10.1016/j.scitotenv.2020.143984
Reyes, M., Páez, A., and Morency, C. (2014). Walking accessibility to urban parks by children: A case study of Montreal. Landsc. Urban. 125, 38–47. doi: 10.1016/j.landurbplan.2014.02.002
Reyes-Riveros, R., Altamirano, A., De La Barrera, F., Rozas, D., Vieli, L., and Meli, P. (2021). Linking public urban green spaces and human well-being: A systematic review. Urban For. Urban Green. 61, 127105. doi: 10.1016/j.ufug.2021.127105
Roberts, M., Irvine, K. N., and McVittie, A. (2021). Associations between greenspace and mental health prescription rates in urban areas. Urban For. Urban Green. 64, 127301. doi: 10.1016/j.ufug.2021.127301
Roe, J., Thompson, C., Aspinall, P., Brewer, M., Duff, E., Miller, D., et al. (2013). Green space and stress: Evidence from cortisol measures in deprived urban communities. Int. J. Environ. Res., 10(9), 4086–4103. doi: 10.3390/ijerph10094086
Rojas, C., De la Fuente-Contreras, H., Díaz-Muñoz, S., Rueda-Seguel, I., Olguín-Carrillo, N., and Gallardo, M. (2020). Caminando a los Parques Urbanos: Calidad y Acceso Público. AUS [Arquitectura/Urbanismo/Sustentabilidad]. 69–77. doi: 10.4206/aus.2020.n28-09
Rojas, C., Páez, A., Barbosa, O., and Carrasco, J. (2016). Accessibility to urban green spaces in Chilean cities using adaptive thresholds. J. Transport Geo. 57, 227–240. doi: 10.1016/j.jtrangeo.2016.10.012
Steiniger, S., Rojas, C., and Vecchio, G. (2019). “Evaluating walkability with WalkMyPlace-Five reasons why the utility of Walkscore.com may be limited in South America”, in Accepted Short Papers and Posters from the 22nd AGILE Conference on Geo-information Science. Cyprus University of Technology.
Steiniger, S., Villegas, R., de la Fuente, H., Rueda, I., and Truffello, R. (2021). Indicadores de Sustentabilidad Urbana – Aplicación en Capitales Chilenas. Centro de Desarrollo Urbano Sustentable (CEDEUS), Santiago de Chile, Chile. Available online at: http://dx.doi.org/10.13140/RG.2.2.32365.51687/1
Steiniger, S., Wagemann, E., de la Barrera, F., Molinos-Senante, M., Villegas, R., de la Fuente, H., et al. (2020). Localising urban sustainability indicators: the CEDEUS indicator set, and lessons from an expert-driven process. Cities. 101, 102683. doi: 10.1016/j.cities.2020.102683
Stepniak, M., and Goliszek, S. (2017). “Spatio-temporal variation of accessibility by public transport—the equity perspective”, in The Rise of Big Spatial Data. Springer, Cham. p. 241–261. doi: 10.1007/978-3-319-45123-7_18
Talen, E., and Koschinsky, J. (2013). The walkable neighborhood: a literature review. Int. J. Sustain. Dev. 1, 42–63. doi: 10.24102/ijslup.v1i1.211
Ugolini, F., Massetti, L., Calaza-Martínez, P., Cariñanos, P., Dobbs, C., Ostoi,ć, S. K., et al. (2020). Effects of the COVID-19 pandemic on the use and perceptions of urban green space: an international exploratory study. Urban For. Urban Green. 56, 126888. doi: 10.1016/j.ufug.2020.126888
UN Habitat. (2016). SDG Goal 11 Monitoring Framework. United Nations. Available online at: https://landportal.org/library/resources/sdg-goal-11-monitoring-framework
Varela, P. L. F., Ortiz Saavedra, P. J., and Chavez Jimeno, H. A. (2009). Velocidad de la marcha en adultos mayores de la comunidad en Lima, Perú. Revista Medica Herediana. 20, 133–138. doi: 10.20453/rmh.v20i3.1012
Vecchio, G., Tiznado-Aitken, I., and Hurtubia, R. (2020). Transport and equity in Latin America: a critical review of socially oriented accessibility assessments. Transport Rev. 40(3), 354–381. doi: 10.1080/01441647.2020.1711828
Vecchio, G., Tiznado-Aitken, I., and Mora-Vega, R. (2021a). Pandemic-related streets transformations: accelerating sustainable mobility transitions in Latin America. Case Studies on Transport Policy. 9:1825–35. doi: 10.1016/j.cstp.2021.10.002
Vecchio, G., Tiznado-Aitken, I., and Steiniger, S. (2021b). Vulnerable individuals and institutions: the double territorial burden of COVID-19 in Chile. Town Planning Rev. 92, 271–277. doi: 10.3828/tpr.2020.65
Venter, Z. S., Barton, D. N., Gundersen, V., Figari, H., and Nowell, M. S. (2021). Back to nature: Norwegians sustain increased recreational use of urban green space months after the COVID-19 outbreak. Landsc Urban Plan. 214, 104175. doi: 10.1016/j.landurbplan.2021.104175
Vergara, L., and Salazar, G. (2021). Non-metropolitan cities in Latin American urban studies: between'trickle-down urban theory' and 'singularisation theory'. Int. Dev. Plan. Rev. 43. doi: 10.3828/idpr.2020.18
Appendix
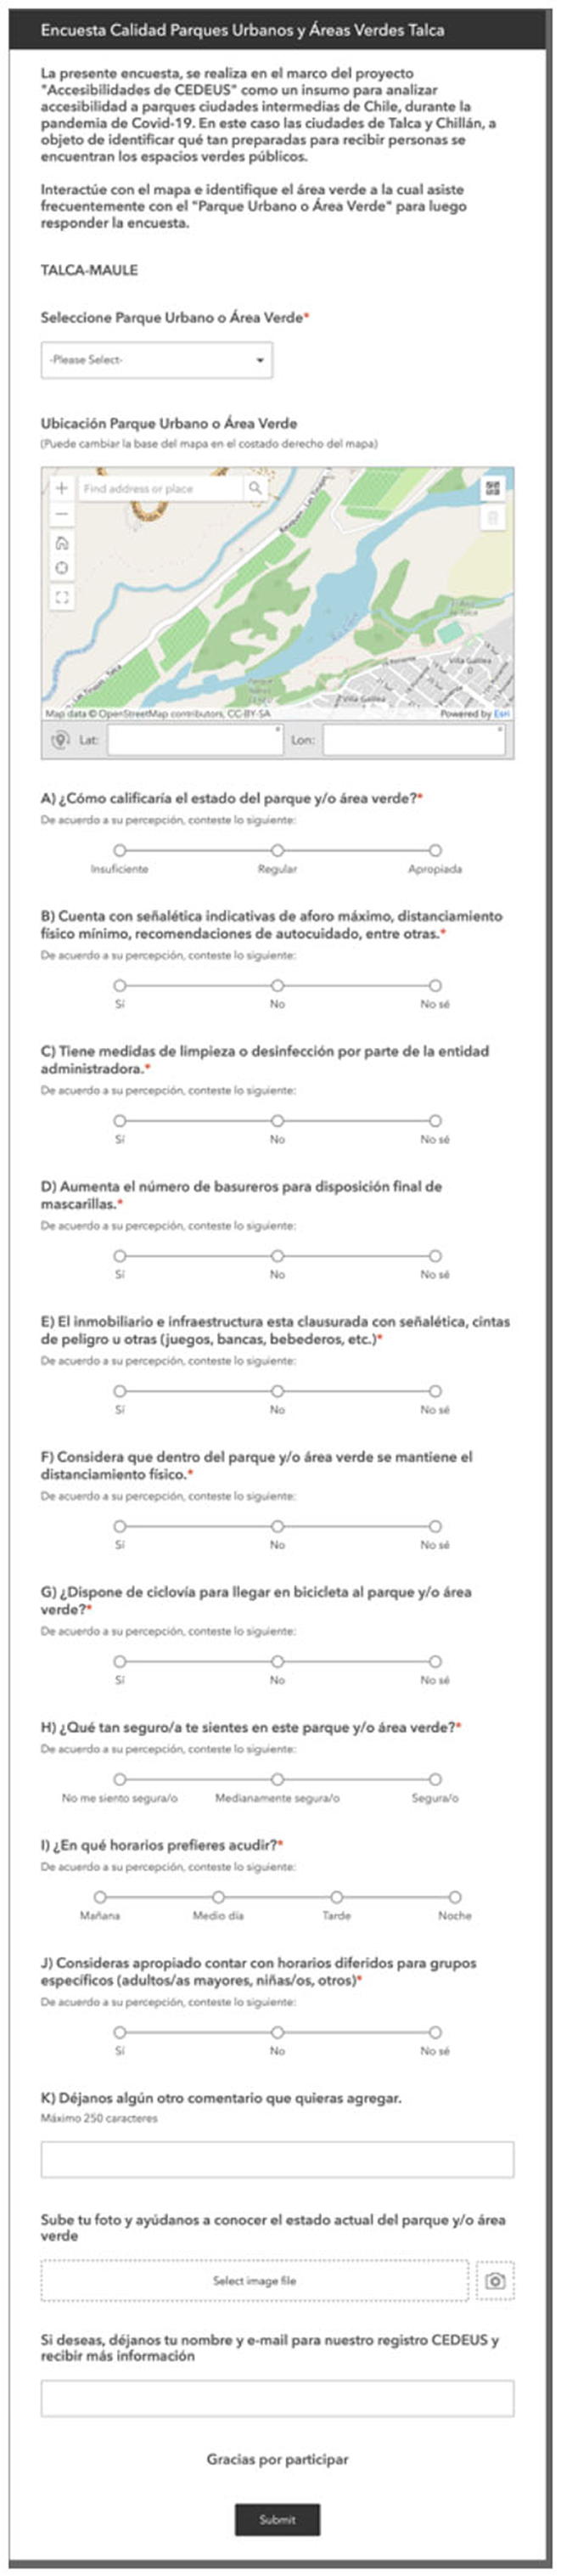
Figure A1. This shows the survey form in Spanish.
Keywords: urban green spaces, parks, accessibility, perception, COVID-19
Citation: Rojas Quezada C, Aguilera Sáez F, Vecchio G and Steiniger S (2022) Perception of Green Spaces Preparedness and Accessibility During COVID-19: An Exploratory Survey in Two Mid-Sized Chilean Cities. Front. Sustain. Cities 4:816688. doi: 10.3389/frsc.2022.816688
Received: 17 November 2021; Accepted: 04 March 2022;
Published: 08 April 2022.
Edited by:
Ignacio Fernández, Universidad Mayor, ChileReviewed by:
Thomas Johnson, The University of Sheffield, United KingdomSimon Bell, University of Edinburgh, United Kingdom
Copyright © 2022 Rojas Quezada, Aguilera Sáez, Vecchio and Steiniger. This is an open-access article distributed under the terms of the Creative Commons Attribution License (CC BY). The use, distribution or reproduction in other forums is permitted, provided the original author(s) and the copyright owner(s) are credited and that the original publication in this journal is cited, in accordance with accepted academic practice. No use, distribution or reproduction is permitted which does not comply with these terms.
*Correspondence: Carolina Rojas Quezada, Y2Fyb2xpbmEucm9qYXNAdWMuY2w=