 Ileen N. Streefkerk1*
 Jens de Bruijn1,2
 Toon Haer1Anne F. Van Loon1Edisson A. Quichimbo3
 Marthe Wens1
 Khalid Hassaballah4
 Jeroen C. J. H. Aerts1,5
- 1Institute for Environmental Studies (IVM), Vrije Universiteit Amsterdam, Amsterdam, Netherlands
- 2Water Security, International Institute for Applied Systems Analysis (IIASA), Laxenburg, Austria
- 3School of Earth and Environmental Sciences, Cardiff University, Cardiff, United Kingdom
- 4Department of Climate and Water Applications, IGAD Climate Prediction and Application Centre (ICPAC), Nairobi, Kenya
- 5Department of IRP, Deltares, Delft, Netherlands
Drought is a persistent hazard that impacts the environment, people's livelihoods, access to education and food security. Adaptation choices made by people can influence the propagation of this drought hazard. However, few drought models incorporate adaptive behavior and feedbacks between adaptations and drought. In this research, we present a dynamic drought adaptation modeling framework, ADOPT-AP, which combines socio-hydrological and agent-based modeling approaches. This approach is applied to agropastoral communities in dryland regions in Kenya. We couple the spatially explicit hydrological Dryland Water Partitioning (DRYP) model with a behavioral model capable of simulating different bounded rational behavioral theories (ADOPT). The results demonstrate that agropastoralists respond differently to drought due to differences in (perceptions of) their hydrological environment. Downstream communities are impacted more heavily and implement more short-term adaptation measures than upstream communities in the same catchment. Additional drivers of drought adaptation concern socio-economic factors such as wealth and distance to wells. We show that the uptake of drought adaptation influences soil moisture (positively through irrigation) and groundwater (negatively through abstraction) and, thus, the drought propagation through the hydrological cycle.
1. Introduction
The impacts of drought on agropastoral communities in Eastern Africa have increased over the past four decades (Haile et al., 2019), including failure of the last four consecutive rainy seasons (Ellerbeck, 2022). Droughts are extreme events characterized by a deficit in water availability. Their typically long duration and large spatial extent affect surface and groundwater resources and water quality, leading to ecosystem damage and socio-economic impacts (e.g., reduced crop or livestock production and insufficient access to clean water). These effects threaten the livelihoods and lives of agropastoral communities. Eventually, it can lead affected communities to adopt adverse coping mechanisms, placing them in need of emergency assistance (WFP, 2019). Therefore, proactive drought adaptation is key to preventing or mitigating the impacts of drought and preparing for a potential increase in extreme drought under climate change (Pörtner et al., 2022).
Adaptation to drought among agropastoral communities is challenging because of the complexity of drought. Drought can develop as a result of natural drivers (e.g., lack of precipitation) and human influences such as water abstraction and deforestation (Van Loon et al., 2016). Furthermore, interactions between drought and society are multifaceted, as social perceptions and human responses to drought impacts vary significantly between individuals and communities (Wang et al., 2016). In addition, drought adaptation strategies in some sectors (e.g., agriculture and energy) can increase the risks for other systems (e.g., ecosystems) (Christian-Smith et al., 2015). Moreover, negative feedback loops such as the supply–demand cycle, where increased water supply accelerates water use, can offset the initial benefits of reservoirs. Such negative feedback loops complicate drought adaptation and risk management (Di Baldassarre et al., 2018). However, two-way feedbacks between hydrological dynamics and human adaptive behavior are often neglected in drought analysis (Montanari et al., 2013; Bierkens, 2015; Van Loon et al., 2016; Wens et al., 2019). Consequently, inadequate representation of these feedbacks can lead to a severe shortcoming in drought assessments and the potential failure of drought or water management strategies (Sivapalan, 2015).
Agent-based models (ABMs) can capture feedbacks caused by heterogeneous human decision-making processes. An ABM is a computational model that can simulate complex systems composed of individual components (known as agents) interacting within an environment through prescribed decision rules (Farmer and Foley, 2009). In the field of water resources, agents can represent diverse actors (farmers, government organizations, etc.) who interact with each other and their environment (e.g., land and water resources) (Kaiser et al., 2020). ABMs are developed to assess the emergent properties and macro-scale processes originating from dynamic individual behavior. Instead of modeling the generic effect of top-down policies, ABMs can simulate the aggregated effects of individual bottom-up decisions, which makes them suitable for analyzing human–water interactions in complex socio-hydrological systems (Troy et al., 2015).
Various studies have used ABMs to investigate interactions between people and water security. In some studies, ABMs have been coupled to an agricultural, water balance or hydrological model (Swamikannu and Berger, 2009; Huber et al., 2019). Other studies have focused on the adaptation behavior of agents in response to drought (Hailegiorgis et al., 2010). Van Oel and Van der Veen (2011) used an ABM to assess the effects of basin closure in the Lake Naivasha region in Kenya. The authors demonstrated the effects of government interventions such as payments for environmental services on water availability. Dobbie et al. (2018) developed an ABM to assess food security for communities in Malawi. However, few studies have assessed the dynamic adaptive feedbacks of agropastoralists coping with drought. In addition, most of the existing ABMs integrating hydrology and human behavior lack a foundation in behavioral theories and a link to spatially explicit hydrological models that can capture dryland processes in Eastern Africa. Therefore, Wens et al. (2020, 2022) developed ADOPT, an ABM for drought adaptation by individual farmers in Kenya, using Protection Motivation Theory (PMT). This theory originates from the domain of psychology and describes how people behave under risk. However, this model focused on crop farmers rather than agropastoralists and is not spatially explicit.
In this research, we further develop (Wens et al., 2020) ADOPT model into a conceptual socio-hydrological framework for agropastoralists (ADOPT-AP) to capture drought–human interactions in dryland regions. We modify ADOPT by coupling it to DRYP (Dryland Water Partition model), a new hydrological model developed for dryland regions (Quichimbo et al., 2021). Additionally, we implement decision rules specifically for agropastoralists' livelihoods. This approach allows us to understand the dynamic feedbacks between drought adaptation and drought hazard in drylands. The modeling framework is applied to a catchment in Kenya. ADOPT-AP uses empirical data from existing surveys to parameterise the model's human behavior component and hydrological data to parameterise the hydrological component. Note that this research does not present a fully calibrated and validated model, rather a conceptual framework and its potential capabilities to explore and understand human-drought feedbacks.
2. Methods
An overview of the proposed model framework can be found in Figure 1. ADOPT-AP consists of three parts: (1) the environment, (2) socio-hydrological interactions and (3) human decision-making. The modeling framework integrates the DRYP hydrological model (Quichimbo et al., 2021) with the human behavior component of the ADOPT model (Wens et al., 2020) and is built upon the ABM package Honeybees (de Bruijn et al., 2022). ADOPT-AP has been designed to simulate individual drought responses by agropastoralists (the agents) within their environment represented by the hydrological model output. Agropastoralists are here defined as households that grow crops, tend livestock or a combination of both as their main livelihood. The socio-hydrological interactions represent the feedbacks between agropastoralists and environmental land–water processes (i.e., water demand and grass and crop yield) of the drylands in Eastern Africa. Human decision-making is represented using PMT, a theory of decision-making under threat (Maddux and Rogers, 1983) and implemented into the model by quantifying the factors that drive the intention to adapt to drought risk.
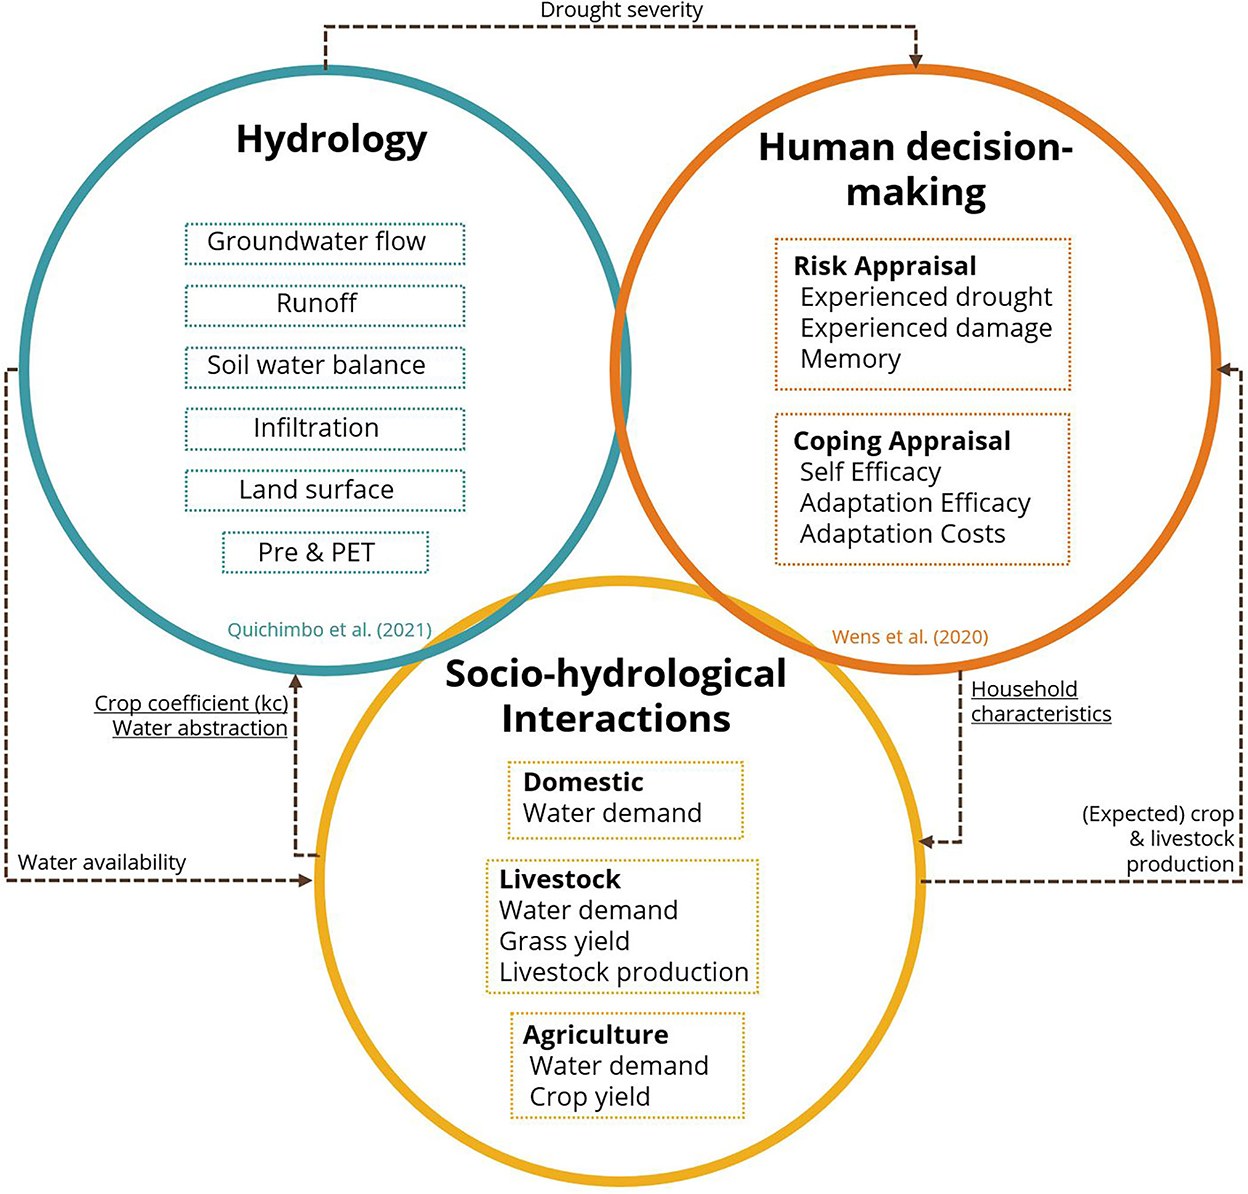
Figure 1. ADOPT-AP framework and interactions between environment (DRYP hydrological model), human decision-making (ADOPT) and socio-hydrological interactions. The linkages show how the different components are connected.
The agropastoralists make adaptation decisions over time. The model includes ~2,500 agents with a heterogeneous set of characteristics. The spatial resolution is 1 by 1 km2 and the temporal resolution is 1 day. Each grid cell has one agent making decisions and changing the environment. Since there is one agent for every grid cell, an agent can represent multiple households, depending on the population density map (i.e., if 100 people live in a cell, the agent represents 100 individuals). Following the Overview, Design Concepts and Details + Decisions (ODD+D) protocol (Müller et al., 2013), a detailed overview of the modeling structure and scheduling is given in the Supplementary material.
2.1. Case study: Upper Ewaso N'giro basin in Kenya
The model was applied to a sub-catchment of the Upper Ewaso N'giro basin in Kenya (Figure 2). Mount Kenya, in the southern part of the catchment, is the local water tower. The catchment and its agents were divided into two parts based on elevation: upstream above 1,300 m and downstream below 1,300 m. These two parts have discernible differences in received precipitation, land use and livelihoods. We later compared these different agent groups in the analysis, an advantage of using ABMs. The upstream part of the catchment is dominated by cropland and forest and has a relatively high altitude. The main livelihood is agropastoralism (i.e., combining agricultural and livestock practices). The downstream part of the catchment is predominantly covered by grassland and scrub, with pastoralism as the dominant livelihood (FEWS NET, 2011). It is a drier lower-lying area (Figure 2).
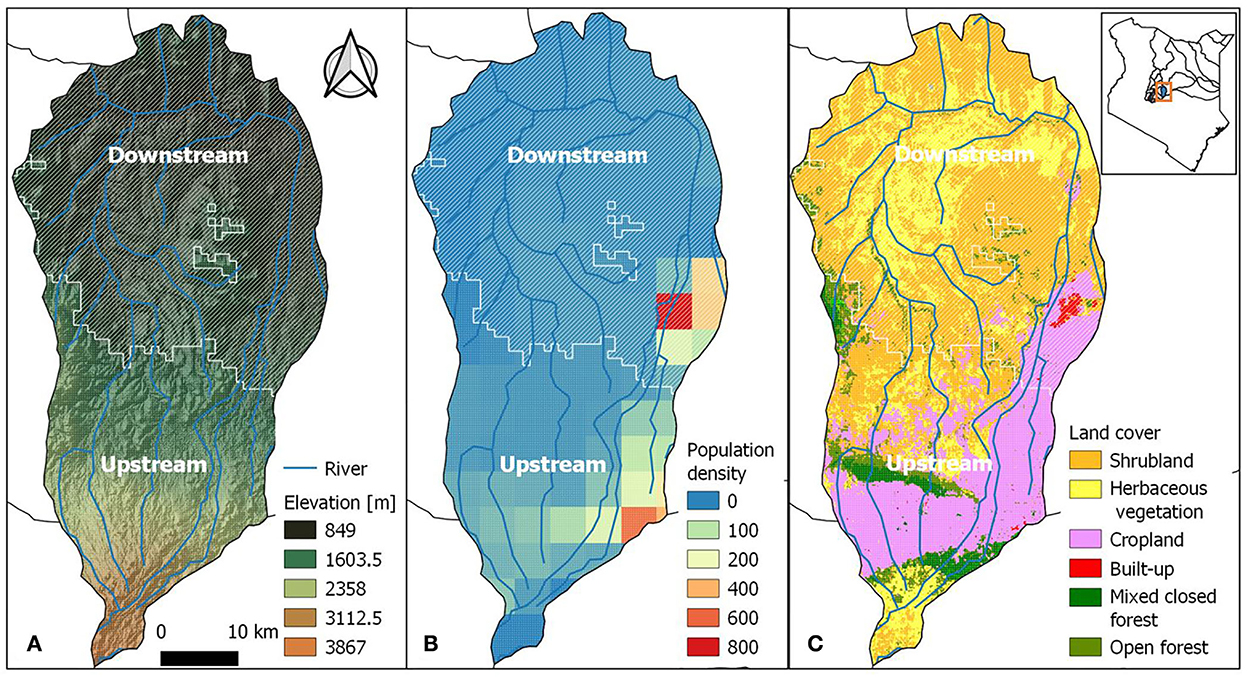
Figure 2. Sub-catchment of Upper Ewaso N'giro basin in Kenya. Elevation (A), population density (B), and land cover (C) maps.
2.2. Environment: Dryland water partitioning model, DRYP
DRYP is a process-based distributed hydrological model developed to capture the main hydrological processes in dryland regions (Figure 1, Environment). Precipitation and potential evapotranspiration are the model's primary driving variables. Precipitation is divided into infiltration and surface runoff, depending on soil moisture conditions. Soil moisture can evaporate directly, be transpired by plants or percolate to the subsurface reservoir (diffuse recharge). Runoff is routed to streams, following the topography. Stream water can be infiltrated through the streambed (transmission losses) if the water table is below the stream's bottom elevation. Conversely, groundwater is discharged into the streams as baseflow if the water table is above the channel stream stage. Transmission losses contribute to the development of ephemeral streams and can recharge subsurface reservoirs, a process known as focused recharge. Water from groundwater aquifers and surface streams can be abstracted by individuals and communities. In addition, irrigation water can be applied to the land (modeled as additional rainfall). Human-induced land use changes are included by altering the crop coefficient (kc), influencing actual evapotranspiration. A more detailed description of the model can be found in Quichimbo et al. (2021).
2.3. Socio-hydrological interactions
The agents are (groups of) agropastoral households that have livestock and cropland. The agents can change the environment through the socio-hydrological interactions of water and land use for domestic, agricultural or livestock purposes. Water can be abstracted from the environment for all three purposes directly from a river or groundwater abstraction point. Groundwater abstraction points are randomly distributed across space due to a lack of information about their number and location. The river network is based on a representation of the catchment (Figure 2).
2.3.1. Domestic
The domestic water demand for households in each cell is calculated for each (daily) time step. It is assumed that households abstract water from the nearest available source: either surface water from a river or groundwater from an abstraction point. Domestic water demand is calculated by multiplying the number of people in a grid cell by the daily water requirement per person (50 L/day per person in rural areas Oageng and Mmopelwa, 2014). Actual water abstraction is limited by the water available in the nearest (non-dry) water source (either river or well).
2.3.2. Agriculture
When households have adopted the adaptation measure “apply irrigation” (not further differentiated in types of irrigation measures), water demand for irrigation is based on the soil moisture deficit (SMD) during the crop growing season, calculated as follows:
where Droot is the rooting depth (mm), θ is the water content (–) and θfc is the water content at field capacity (–). Irrigation demand is derived by multiplying the SMD by the sum of the irrigated land area for each household in a cell. In the sensitivity analysis a variable factor (default of 1) can multiply the SMD, and can represent different types of irrigation methods and their water-efficiency (e.g., drip or furrow irrigation).
Crop yield is calculated based on the ratio between the crop's actual (AET) and potential evapotranspiration (PET). This calculation follows Siebert and Döll (2010) and is slightly more detailed than the FAO approach (Allen et al., 1998). If the ratio is 1 (AET = PET), crop yield is at its maximum, while a lower AET reduces crop yield. The crop coefficient kc, with the reference evapotranspiration, determines a crop's PET, which indicates how much the crop would evaporate, assuming it is healthy and well-watered. The crop coefficient depends on the crop type and its development stage (Allen et al., 1998). We used crop factors for maize and cassava from Siebert and Döll (2010). Actual evapotranspiration indicates how much the crop evaporates based on the current water availability. Crop yield is then calculated by multiplying the maximum (irrigated) yield, following Siebert and Döll (2010):
where a, b, P0, and P1 are crop-specific parameters statistically derived by Siebert and Döll (2010).
2.3.3. Livestock
Households own livestock (Lt) which they usually herd at home. However, livestock can graze in a different location when insufficient grass or water is available at home. At the destination location, livestock drink water and graze. Livestock water demand is calculated by multiplying the number of livestock in a grid cell by the daily water requirement per livestock type (Table 2).
Livestock grazing and reproduction are based on the available grass. To simulate grazing, we followed the FAO Irrigation and drainage paper No. 56 (Allen et al., 1998) (Eq. 4). We estimated the grass yield in a grid cell by scaling down the maximum attainable grass yield in that cell using the ratio between AET and PET and a yield-response factor. Grass yield was not computed in urban or cropland grid cells:
where Kg is a yield-response factor [–], which indicates how a crop responds to a reduction of AET vs. PET averaged over the growth period.
Livestock production (number of animals, Lt) is a function of grass yield Gyield and calculated on yearly basis (Lopez, 2008; Pande and Savenije, 2016). We assumed that no livestock are bought or sold, as this is not common practice in some East African cultures (Watson and Binsbergen, 2006):
where Lt−1 is the number of livestock from the previous year, KL is the capacity (# livestock) given by
where Gyield is the grass yield (kg) described by Eq. 4, (kg/livestock/year) is the feed requirement rate per animal and is the feed residue rate (only 70% of unit feed is fit for livestock; Falvey, 1999). The growth rate rL is a combination of the net birth rate rnet and the growth in livestock size as a result of the conversion of consumed grass to weight gain:
where is the weight gain conversion rate (livestock/kg) and Lt the total number of animals in the grid cell. When a cell contains multiple livestock herds, the yield is proportionally distributed to the quantity of livestock in each herd.
2.4. Human decision-making
In the human decision-making component, agropastoralists can implement four adaptation measures (Figure 3, Table 1). Each implemented adaptation measure affects socio-hydrological interactions and the environment. Table 1 reveals which parameters are changed due to what measure. Two measures are short-term measures with a lifespan of 1 year (crop types and migrating). The other two measures have a lifespan of 10 years.
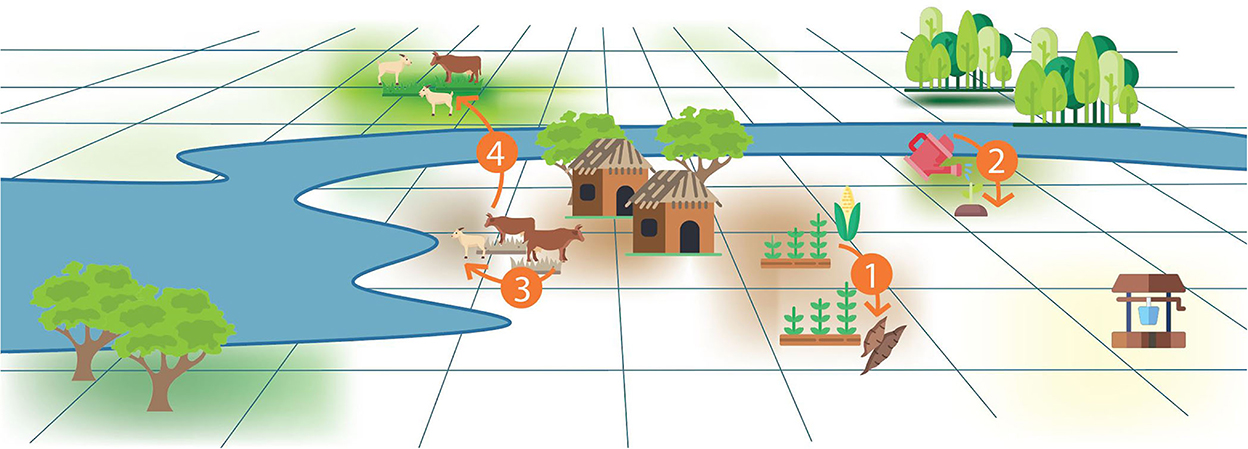
Figure 3. Adaptation measures modeled in ADOPT-AP. 1. Change crop types. 2. Apply irrigation. 3. Change livestock types. 4. Migrate livestock.
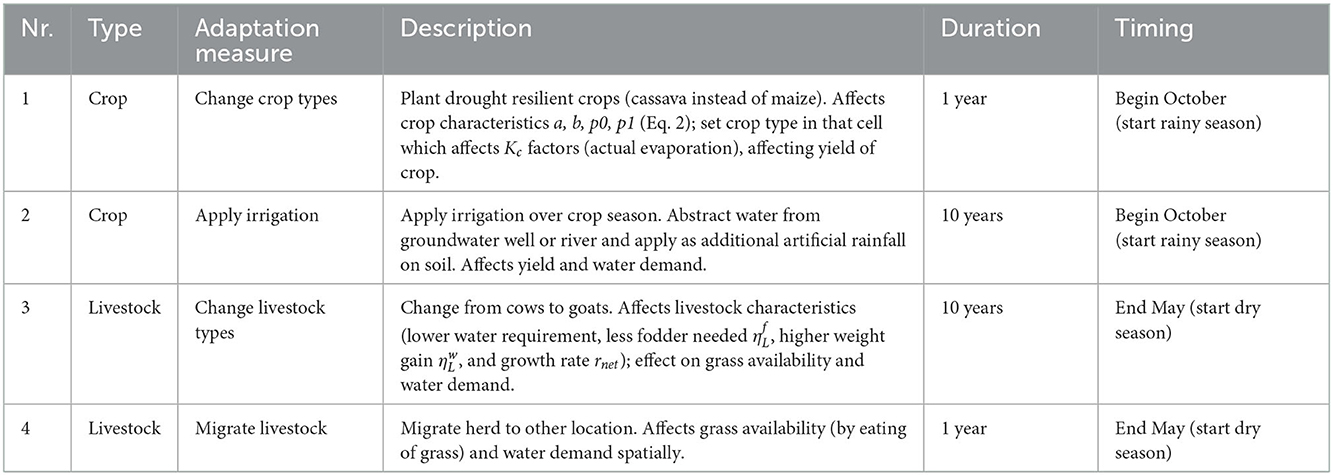
Table 1. Adaptation measure description, effect on environment and decision timing.
Each year, agents decide whether to adopt an adaptation measure. Crop-related adaptation measures are decided at the beginning of October, the start of the long (main) rainy season. Livestock-related decisions are made at the end of May, before the long dry season. The IntentionToAdaptt,m is the final variable that determines whether an agent will implement a specific measure; it is compared with a probabilistic threshold based on the measure's lifespan (Eq. S.1 in Supplementary material).
Agents receive and spend income each year after the long rainy season. Income is determined by the crop and milk production remaining after consumption, which is based on household size. In addition, agents have yearly expenditures depending on their herd and/or farm size. Their wealth and the potential impact of drought influence their adaptive behavior in the subsequent steps. See section process overview and scheduling in the Supplementary material for more details.
We applied the behavioral theory Protection Motivation Theory (PMT) (Eq. 8) to simulate whether an agent implements an adaptation measure (m) (Maddux and Rogers, 1983), which was successfully applied by Wens et al. (2020, 2021, 2022) in a case study in Kenya.
where α [0.334;0.666] and β [0.334;0.666] are weights that sum up to 1 and are randomly determined following Wens et al. (2020).
PMT was created to understand adaptive human behavior (IntentionToAdaptt,m, Eq. 8) under threat. It is based on two psychological factors: (1) RiskApprailsalt; (Eq. 9), which describes how individuals assess the severity of a threat (in this paper, the drought hazard) and (2) CopingAppraisalt (Eq. 11), which describes how people assess ways they can react to the threat. The two cognitive components and their underlying perceptions are influenced by the agent's unique characteristics (age, gender, educational level, access to information, network, etc.,). These characteristics are stochastically determined based on survey data from Wens et al. (2020).
Households' risk perceptions play an essential role in adaptive decision-making (Grothmann and Patt, 2005; Van Duinen et al., 2015). Risk appraisal includes its perceived probability and severity (Deressa et al., 2009, 2011; Van Duinen et al., 2015). It is partly based on the accumulative nature of past experiences, considered an individual drought memory (Viglione et al., 2014). Studies have also found that risk appraisal is primarily shaped by recent harmful events (Gbetibouo, 2009; Rao et al., 2011). However, this awareness decreases over time (Di Baldassarre et al., 2018). Therefore, risk appraisal increases in relation to the relative damage experienced due to drought but decreases if no drought damage occurs. It is expressed as follows:
where RiskAppraisalt is initialized as a random value between zero and one [0;1], and the memory is the risk appraisal of the previous time step t-1. DroughtDamage is computed as the relative loss in livestock or crop production in a specific year compared to the average production of the previous 10 years (Di Baldassarre et al., 2013). It is only calculated when the Standardized Precipitation Evaporation Index (Vicente-Serrano et al., 2010) within a 3 months accumulation period (SPEI-3) falls below −1 at the decision moment. SPEI is computed for each grid cell individually, implying that the values can be different for every agent. DroughtDamage is calculated as follows:
Experiencing a risk does not result in adaptation; the perceived ability to act upon the risk also influences the decision-making process (Deressa et al., 2009, 2011; Eiser et al., 2012; Gebrehiwot and Van Der Veen, 2015). People should feel capable of dealing with the risk at hand (self-efficacy) (Lalani et al., 2016; Zhang and Dallimer, 2016). Intrinsic factors in a household, such as education level, household size, age, network and gender, influence self-efficacy (Mandleni and Anim, 2011; Gebrehiwot and Van Der Veen, 2013; Shikuku et al., 2017). Households also have to believe they can pay for the costs (adaptation costs, i.e., the relative cost of the adaptation measure compared to the agent's liquidity) (Van Duinen et al., 2015). Finally, the perceived degree to which the adaptation options are likely to have an effect (adaptation efficacy) is also significant. The CopingAppraisalt is thus a combination of the perception of self-efficacy, adaptation efficacy and the perceived adaptation costs of the agent:
Receiving information (e.g., through farmer field schools or extension services) about how well an adaptation measure performs influences the perceived adaptation efficacy. The latter is determined by how much the livestock or crop production would have improved if the adaptation measure had been implemented:
1. Change crop type: crop-specific parameters (a, b, P0 and P1) in Eq. 2 changed from maize to casava, resulting in different crop yields.
2. Apply irrigation: ratio AET/PET set to 1 in Eq. 2, resulting in different crop yields.
3. Change Livestock types: livestock-specific characteristics (Eqs. 5–7) changed to parameters for goats, resulting in different livestock production.
4. Migration livestock: gives maximum grass yield (Eq. 4) in surrounding cells, resulting in different livestock production.
If an agent does not have access to external adaptation information, they learn from what happens in their neighbors' field or within their neighbors' herd. Neighbors are the agents in neighboring cells and depend on the neighborhood radius in the model settings (8-connected if radius = 1).
2.5. Model setting and parameterization
Table 2 presents an overview of the data used for input in ADOPT-AP. The model simulation period is from 2005 to 2015. Section details of the Supplementary material provides an overview of the parameter settings used in the model framework.
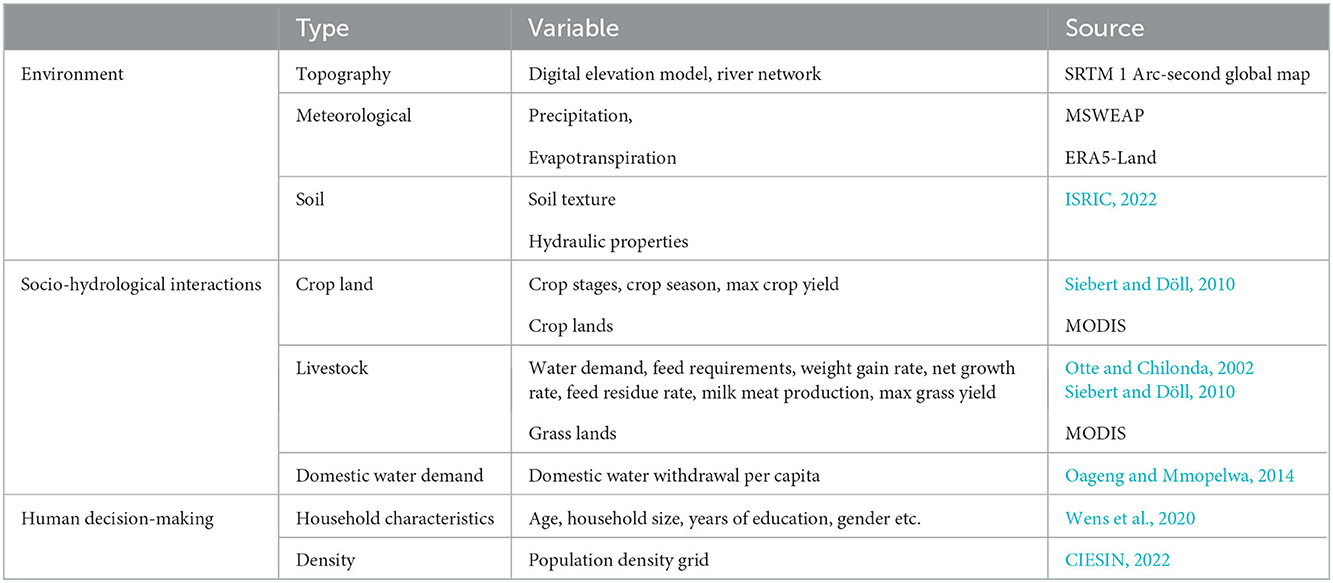
Table 2. Data input for the different components of the ADOPT-AP model.
2.6. Sensitivity analysis
To better understand the dynamic interactions in human behavioral responses to drought over time, we analyzed both sides of the drought–human interaction and conducted a sensitivity analysis.
During the sensitivity analysis, we conducted a systematic Global Sensitivity Analysis (GSA; Sobol, 2001; Xu et al., 2004). Unlike the One-Factor-at-The-Time (OFAT) procedure, GSA tests the individual and combined effects of changing parameter values (Saltelli, 2002; Saltelli et al., 2010). Multiple Monte Carlo simulation runs were executed and evaluated for each parameter value combination since the model contains stochastic elements (Ligmann-Zielinska et al., 2014).
We varied the parameter values of the socio-hydrological interactions and human behavior components (Table 3). The parameters for socio-hydrological interactions are the distribution of the groundwater abstraction points (DA) (the likelihood of an abstraction point in a grid cell) and the irrigation demand factor (IF) of the soil moisture deficit (SMD), which defines irrigation demand (Section 2.3). For the human behavior component, α (AL) (Eq. 8) is considered (and thus β as they add up to 1) with the cost of adaptation measures (AM) (Section 2.4). The neighborhood radius (NR), indicating the circle of notion, is present in both components. The radius represents how far an agent can look for water or communicate with neighbors.
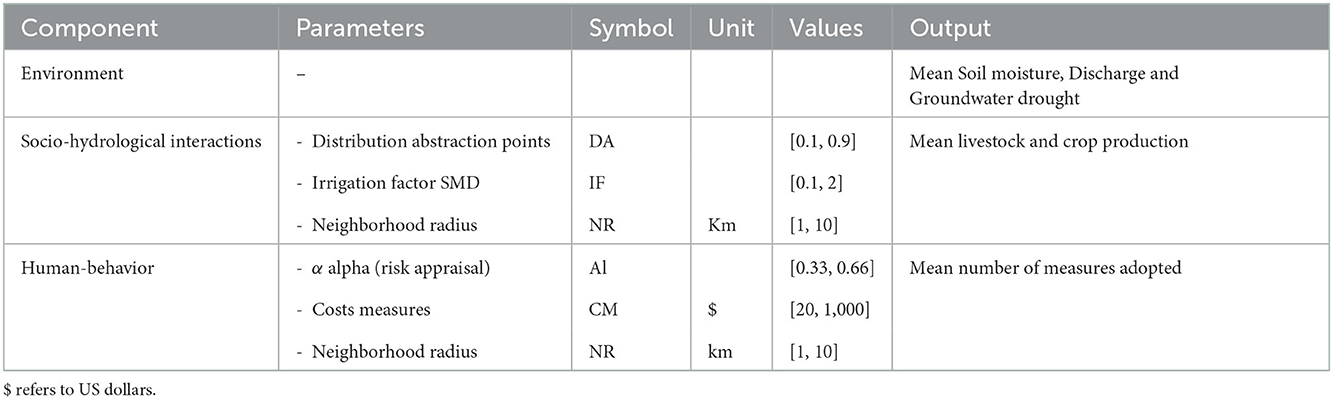
Table 3. Parameters and output variables in global sensitivity analysis.
The effect of changing parameters is tested by examining how they affect output variables over the entire simulation period. Output variables related to the environment and human behavior components are considered. Hydrological variables relate to different types of drought: precipitation (meteorological drought), soil moisture (soil moisture drought), and discharge and groundwater level (hydrological drought). The different types of drought indicators (precipitation, soil moisture, discharge and groundwater deficit) are based on the 80th percentile threshold of the natural model run without human adaptation (Van Loon et al., 2022). Additionally, this threshold can be used to compare drought events between natural model runs (no influence from agents) and model runs including agents (affecting the environment). Hence, we can analyse the influence of agents on different types of drought.
To summarize, the sensitivity analysis includes the following output variables: (1) Environment, mean soil moisture, discharge and groundwater drought; (2) Socio-hydrological interactions, mean livestock and crop production; and (3) Human-behavior, average adaptation measures adopted per household (see Table 3).
The GSA procedure is as follows: parameter sets per sample (n = 12) are produced following the Saltelli and SAlib python package. The method requires 2N distinct samples, depending on the number of parameters evaluated (N = 5), resulting in 32 distinct samples. Ten Monte Carlo simulations were run for all the samples, giving a total of (12*32*10=) 3,840 runs to evaluate the effect of changing parameter values.
A parameter's sensitivity is represented by the Sensitivity Index (SI):
- First-order sensitivity: The first-order SI measures a single parameter's contribution to the output variance.
- Second-order sensitivity: The second-order SI shows the interactions between two parameters.
- Total-order sensitivity: The total-order SI indicates the parameter's total contribution to the output variance, including first and higher-order interactions. The higher the index, the more sensitive the output variance is to changes in the parameter value (Saltelli et al., 2010).
A high sensitivity index reflects that variations in the parameter results into large variations in the output. The sum of first-order SI cannot exceed 1, but the total-order SI can.
3. Results
3.1. Agents' response to drought
In this section, we examine the model simulations to explore how different agents respond to drought. Agents are divided into up- and downstream, based on their geographical location (see Figure 2). The results presented in Figure 4 indicate the average of multiple runs (n = 10) with the standard parameter settings (see section details in the Supplementary material) to better understand the dynamic interactions within human behavioral responses to drought over time.
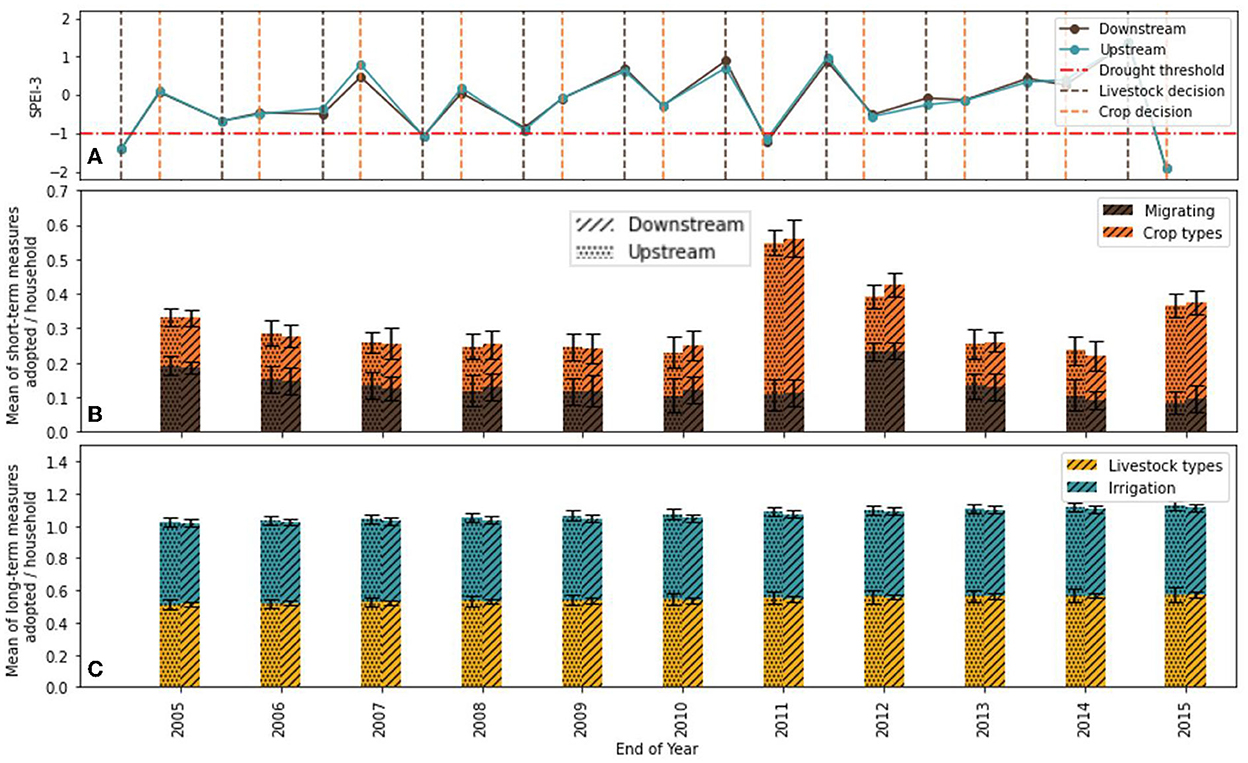
Figure 4. SPEI-3 for livestock and crop decisions over time (A). Mean of short and long-term adaptation measures adopted per household over time (B, C). Striped bars indicate the average for downstream agents and the dotted bars the upstream agents. The error bars indicate the 5th and 95th confidence intervals.
Figure 4A indicates the experienced drought by upstream and downstream agents, expressed in SPEI-3 values, averaged over all agents in a group. Values below the red horizontal line (drought threshold: < SPEI-3 of −1) indicate drought events. The moment livestock decisions are made are represented with vertical brown dotted lines, with the years 2005 and 2008 being drought events (all lying below the SPEI-3 threshold of −1). At the timing of crop decisions, only the years 2011 and 2015 being drought events.
Figures 4B, C highlight the adoption of respectively long-term and short-term livestock and crop adaptation measures over time. The figure demonstrates that a drought event triggers a high implementation rate of short-term adaptation measures (Figure 4B). Conversely, when no (consecutive) drought events occur, the average adaptation rate of short-term measures decreases. High uptake of short-term adaptation measures can be observed during and after 2011, which is known as one the most severe droughts in the East Africa. The 2010/11 East Africa drought started in 2010 with a failed rainy season in October, November, December (OND season) and lasted until late 2011, with impacts felt until 2012 (Lott et al., 2013). It is observed that after the drought in the 2010 OND rainy season, the adoption of different crop types (Figure 4B) increases for the both upstream and downstream agents (~0.6 measures per agent). After the June, July, August (JJA) dry season in 2011 an increase in the uptake of migration as short-term adaptation measure is be observed.
An explanation for the difference between up and downstream agents is that, although all agents have an elevated drought risk perception during and after a drought event, the risk perception is different between upstream and downstream agents due to a differentiated experience with drought impacts. The risk appraisal for the downstream communities in 2011 for crop decisions and in 2012 for livestock decisions was higher (~0.93 for crops and ~0.36 for livestock, respectively) than that of the upstream communities (~0.88 for crops and ~0.30 for livestock, respectively) due to greater drought damage. Combined with a higher coping appraisal, this results in higher uptake of short-term adaptation measures. Due to the differences in risk appraisal for crops and livestock, the uptake of short-term measures was higher for crop decisions in 2011 (~0.5 of changing crop types), than for livestock decisions in 2012 (~0.25 of migration).
There are no major changes in long-term adaptation measures (livestock types and irrigation) over time: a household has, on average, 0.5 long-term adaptation measures (due to initialization, Figure 4C). However, there is a steady but slight increase (~0.1 measures per agent) in the uptake of long-term measures. In contrast to short-term measures, upstream agents adopt more long-term measures than downstream agents, particularly irrigation. An explanation could be that because the upstream agents have more assets compared to downstream agents (average 25% more) due to more favorable climatic conditions, they more likely to adopt a costly long-term measure.
3.2. Socio-hydrological interactions
In Figure 5 various variables within the socio-hydrological interactions component are presented. The variables are outcomes of a single example run. Figure 5A shows the crop yield when the agents would have rainfed maize. Upstream agents (i.e., agents in the south) have a higher potential crop yield compared to downstream agents. On average, the crop yield for upstream agents is 1.98 tons/hectare and for downstream agents 1.7 tons/hectare. The grass yield for the JJA dry season in 2011 is, similarly to the crop yield, higher for upstream agents (~1.70 tons/hectare) compared to downstream agents (~1.63 tons/hectare). Some areas with very high grass yields are observed near the rivers. Figure 5C indicates the livestock migration in 2011, expressed as the number of agents that have moved with their livestock to a specific grid cell. It can be observed that especially the areas around the river streams have an increased number of agents with their livestock, which indicates that in the model the drought has forced pastoralists to search for areas with higher grass production, such as near the rivers (as observed in Figure 5B).
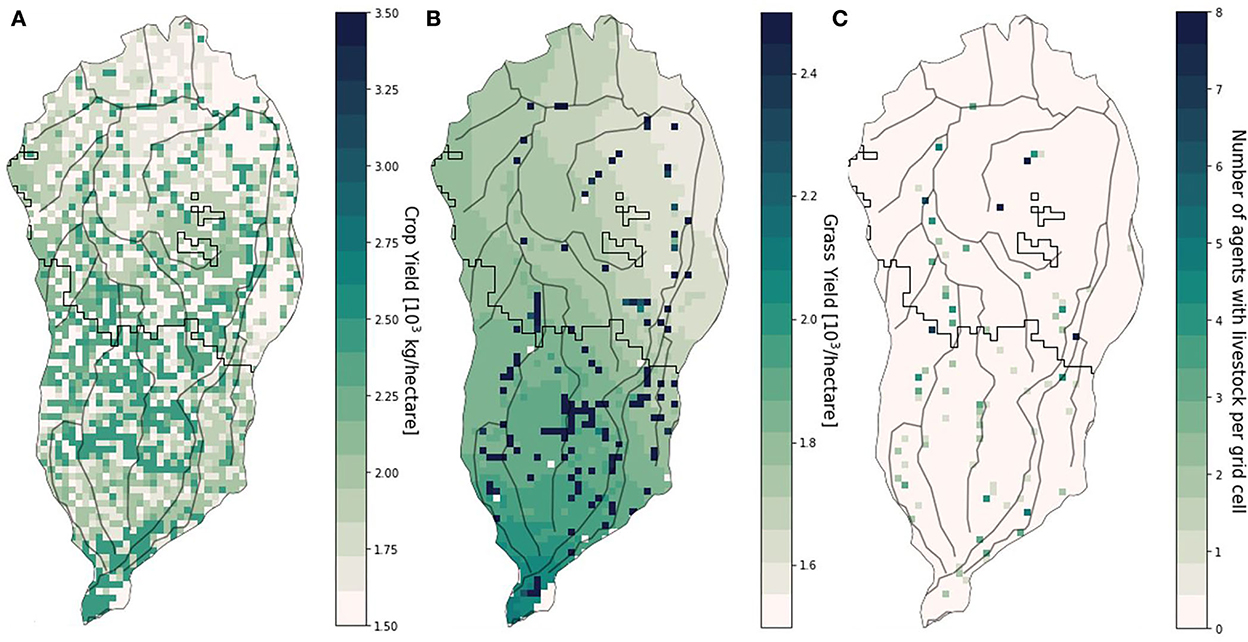
Figure 5. Crop yield of rainfed maize in OND season 2010 (A), grass yield in JJA dry season of 2011 (B), and migration of livestock (C), expressed as the number of migrating agents with livestock in a grid cell in 2011.
3.3. Drought response to agents
Figure 6 demonstrates the effect of human adaptive behavior on drought propagation in the OND season in 2010 (start of the 2011 East African drought). Four time series of drought indicators are represented: the 80th percentile values of precipitation, soil moisture and the groundwater table averaged for the catchment, and discharge at the outlet (see Section 2.6). We distinguish natural conditions, indicating model runs without the influence of human agents (fixed brown line) and conditions influenced by the agents' adaptation decisions in the ADOPT-AP model (turquoise color). The drought severity (red shaded area) can then be defined as the deficit between natural (fixed brown line) or human-influenced (fixed turquoise line) conditions and the drought threshold (dotted black line). Finally, the turquoise band indicates the human influence on different types of drought.
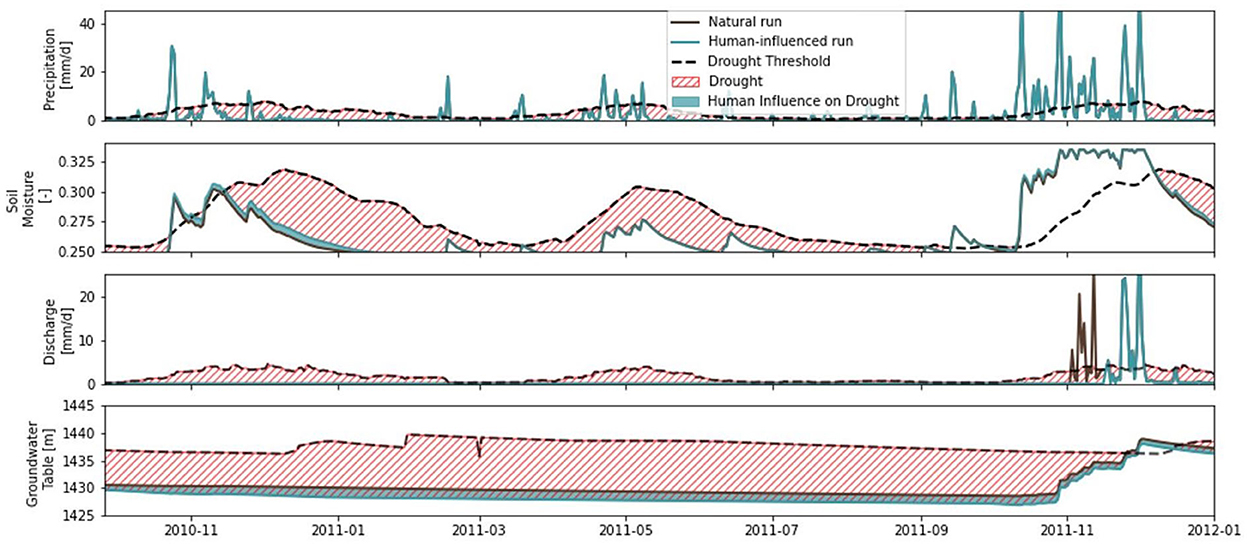
Figure 6. Influence of agents on different types of drought from the 2010 OND to 2011 OND season. The fixed black line shows natural conditions over time without the influence of agents. The drought severity (red shaded area) is the deficit between natural and human-influenced conditions (fixed brown and turquoise lines) and the drought threshold (dotted black line). Precipitation, soil moisture and groundwater table are catchment averages, while discharge shows point values at the catchment outlet.
For all three hydrological variables, the influence of human adaptive behavior is evident. Average soil moisture increases under human influence through irrigation by farmers, resulting in a decrease in soil moisture drought. Conversely, agents decrease the groundwater table elevation through domestic and irrigation water use, increasing hydrological drought. For discharge there is no change in the period from the 2010 OND season until the 2011 OND season because in both scenarios the discharge is zero due to the drought. The drought event ends in the 2011 OND season, causing the discharge to rise early and end of November in the natural scenario. However, the first discharge peaks are not present in the human-influenced scenario and only after continued rain the river in the human-influenced scenario starts to flow, indicating the effect of human water abstractions.
The spatial variability of (human-influenced) soil moisture, discharge and groundwater levels of the 2010 OND season compared to the average of the seasons before, is plotted in Figure 7. Soil moisture is decreased throughout the catchment, with a higher decrease for the western side of the catchment compared to the eastern side. There are some cells that have an increase of soil moisture even during the drought because of irrigation practices. Discharge is also decreased compared to the previous seasons, with the most extreme low flows seen in the upstream part of the catchment. Groundwater levels are decreased throughout the catchment, especially in the western part of the catchment, similarly to the soil moisture plot. The decreases of river discharge and groundwater level are due to the combination of drought and increased abstraction for irrigation.
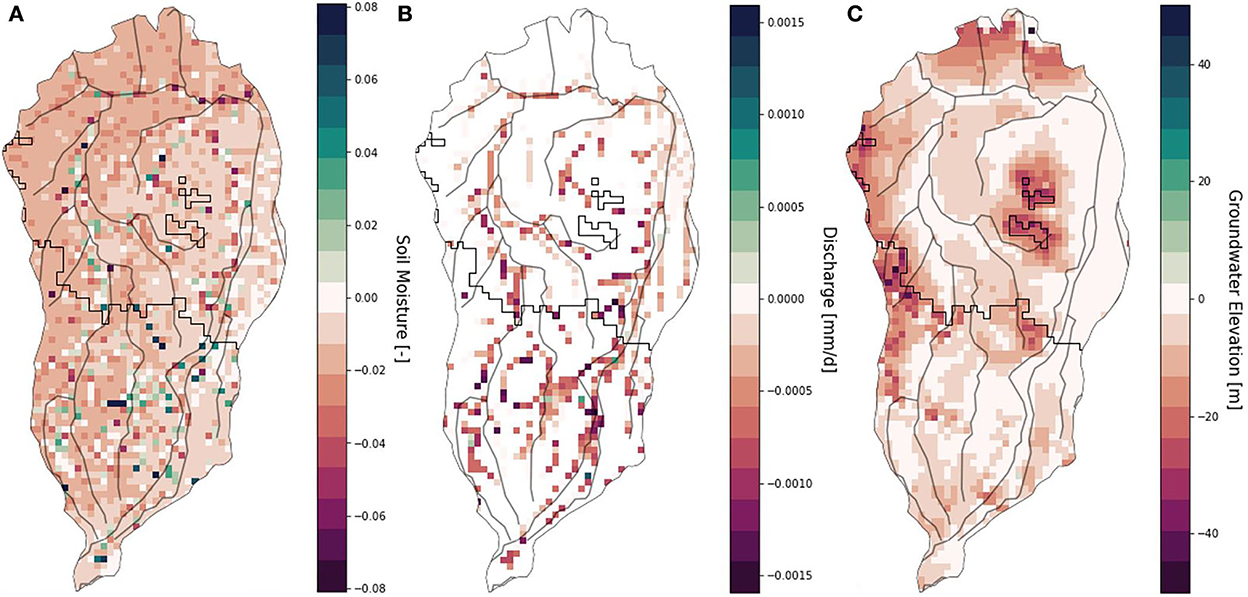
Figure 7. Soil moisture (A), discharge (B) and groundwater elevation (C) in the 2010 OND rainy season, compared to the average of the seasons before (2005–2009). The river network in the figure (gray lines) is for orientation purposes only, see Supplementary material for the modeled river network.
3.4. Sensitivity analysis
Figure 8 illustrates the results of the sensitivity analysis: the sensitivity of drought, production and adaptation output variables to different model parametrisation assumptions. Rows represent the different modeling output variables. The top three rows show the drought-related output variables (soil moisture, discharge and groundwater table). The middle rows represent livestock and crop production, and the bottom four rows show the results for the four adaptation measures (migration, irrigation, crop and livestock types). The columns represent the model variables that were varied during the sensitivity analysis runs (see Section 2.5, Table 3).
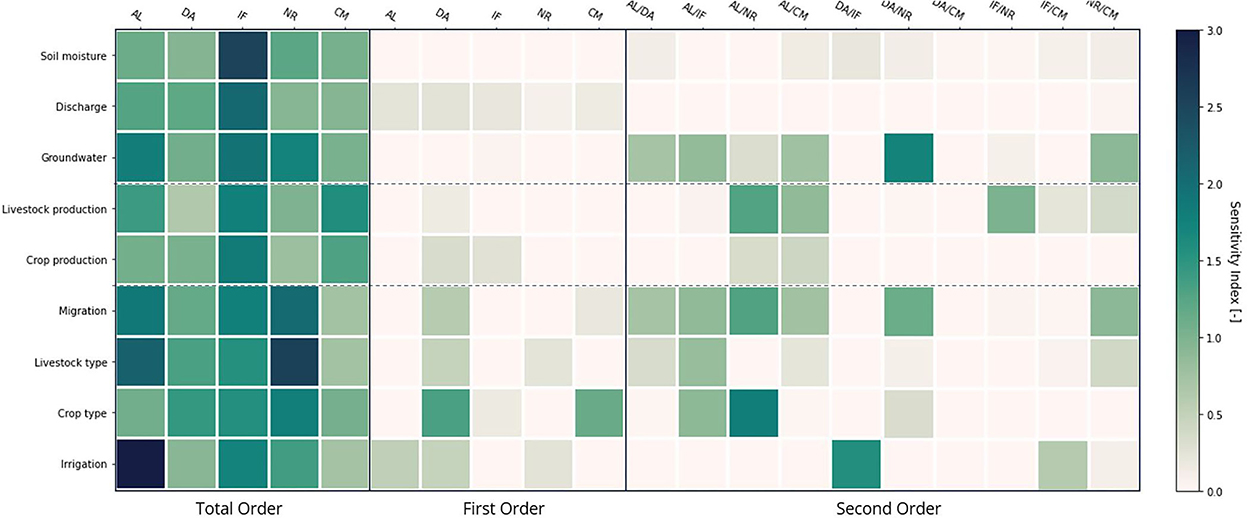
Figure 8. Results of the sensitivity analysis using three different sensitivity indices (see Section 2.6): total (left columns), first (middle columns) and second order (right columns). See Table 3 for an explanation of the abbreviations.
3.4.1. Drought variables
The different types of drought are primarily influenced (indirectly) by the irrigation demand factor (IF), as this factor determines the amount of water abstraction for irrigation purposes from groundwater and rivers, and therefore also the amount of irrigation added to soil moisture. Soil moisture and discharge drought are not sensitive to first-order or second-order interactions, indicating that more complex interaction are important in determining these types of drought. Groundwater drought is, in addition to IF, sensitive to alpha (AL) and the neighborhood radius (NR). These patterns are similar to that of migration and changing livestock types, giving an indication that migration and livestock types influence the groundwater drought. For example, if many agents come together to one grid cell, the livestock production decreases due to less available grass per agent, and consequently water demand also decreases. Similarly, changing crop types decreases water demand as well, as goats require less water than cows. However, as goats also require less grass, the production might increase (compared to cows) and the water demand increases again. Second-order interactions show that the interactions between distribution of abstraction points (DA) and the neighborhood radius are of high importance. A larger neighborhood radius increases the area where agents can take water and interact with other agents. The combination of agents having a larger (or smaller) area to look for potential water sources (NR) and a higher (or lower) chance of having a groundwater abstraction points (DA) influences the groundwater drought.
3.4.2. Livestock and crop production
Livestock production is highly sensitive to three parameters. The irrigation demand factor (IF) influences water availability (as found in previous section), which in turn influences grass availability and livestock production. In addition, alpha (AL) and the cost of measure (CM) influence the livestock production. This finding suggests that adaptation behavior plays a significant role in determining livestock production. In addition to the second-order interaction between IF and NR, the NR interacts with the AL in determining livestock production, while AL interacts with CM as well. NR, AL and CM all three influence the Coping Appraisal, which confirms that adaptation behavior is essential for livestock production. Crop production is primarily influenced by the IF, as crop production and irrigation are strongly linked (irrigation increases crop production). DA and IF have a small direct influence on crop production; a higher chance of being near a water source and an increased irrigation demand increase crop production (and vice versa).
3.4.3. Adaptation measures
The uptake of migration as a short-term measures is mostly influenced by AL, IF, and NR. This finding indicates that the uptake is both influenced by water availably (through IF and NR) and adaptation behavior (AL and NR). Especially the interactions between NR and other parameters (AL, DA, CM) contribute to the high total SI. The neighborhood radius (NR) is the most important parameter is determining whether an agent will migrate. This can be explained by the fact that NR determines how far an agent can migrate and can look for better grass conditions in the area. Similarly to migration, the uptake of livestock types is largely influenced by AL and NR. This finding can indicate that coping appraisal is important, as the weighting (compared to risk appraisal) is determined by AL and NR determines the self-efficacy and adaptation efficacy (knowledge of measure in neighborhood). The adoption of changing crop types is most sensitive to DA, IF, and NR, indicating that water availability may drive the adoption. DA and CM have a direct influence, while AL in combination with IF and NR have an indirect influence. Irrigation uptake is highly sensitive to the AL and IF. AL determines the relative weighting of coping appraisal vs. risk appraisal, implying that one factor is more important than the other for adopting an irrigation measure. IF influences the adaptation efficacy (through increased crop production) of the irrigation measure. The second-order interactions show that especially the interactions between DA and IF are important; IF only comes into play when there is also a water source to abstract water from.
4. Discussion and recommendations
The drought adaptation modeling framework ADOPT-AP was developed to capture dynamic feedback between heterogeneous behavior and drought risk concerning agropastoral livelihood decisions in dryland regions. However, aspects of the framework generate uncertainty in simulated results and require further attention in future research. In this section, the uncertainty of the modeling framework is discussed, together with recommendations for developing the model and a reflection into unintended consequences emerging from feedbacks and coevolution of human-water systems.
4.1. Sensitivity of modeling framework
In general, the modeling framework produced results that confirm the findings of earlier studies. Our results clearly demonstrate that drought events affect risk perception. Depending on the perceived coping capacity, the level of adaptation increases during and after a drought. The results also indicate that each household adopts, on average, 0.1–0.2 short-term measures during a simulation period of 10 years. These figures are similar to the adoption of mulch and fanya juu terraces described in Wens et al. (2020): 0.08–0.25 measures. Regarding long-term measures, the numbers in this study, averaging ~0.05 additional adaptation measures per household after initialization, are comparable with Wens et al.'s (2020) results: a maximum of 0.025–0.5 measures per household (well and drip irrigation). A novel finding in this study is the differentiation in the hydrological environment due to the ABM's bi-directional coupling to a hydrological model. For example, differences were observed between upstream and downstream communities, indicating a drought influence that varies across the catchment area (downstream communities were the most severely affected and adopted more short-term measures).
The sensitivity results show that the amount of irrigation water used (IF) influences all output variables analyzed; drought, livelihood production and adaptation decisions. It highlights the importance of water-human feedbacks in assessing drought risk. Besides, as we do not precisely know the appropriate irrigation demand factor (IF), it is of key importance that empirical research should further investigate this. In addition, the sensitivity analysis shows that the total-order SI cannot be fully explained by the first- and second-order SI, indicating the complexity of the model which is driven by many higher-order interactions.
4.2. Recommendations for future drought adaptation modeling
Our model does not capture all the factors driving the adaptive behavior of pastoralists to droughts. An essential next step in the model's development is to use empirical data from households in the specific region to calibrate behavioral theories and socio-hydrological interactions. This step is significant because the sensitivity analysis indicates the modeling outcomes' sensitivity to behavioral parameters such as the influence of neighbors, risk perception of drought events and perceived coping capacity, as well as socio-hydrological parameters such as the distance to wells and water use for irrigation.
Furthermore, several behavioral components can be influenced by external drivers (e.g., war, dynamic market prices related to crops and livestock and diseases), which could subsequently be included as additional modules. For example, since household assets (e.g., crop and milk sales) largely depend on fluctuating market prices, an economic model could be implemented to simulate such influences (Schreinemachers and Berger, 2011; Amaya et al., 2021). In addition, the influence of government policies and campaigns on the uptake of adaptation measures by pastoralists could be added. For example, Wens et al. (2022) demonstrate how extension services and providing drought risk information to farmers in Eastern Africa influence risk perception and adaptation. Finally, instead of using SPEI as a drought risk indicator influencing the risk appraisal of PMT, different perceptions of drought could be incorporated, including current or recent hydrological conditions, local knowledge of drought predictions or forecast information. Adaptation is currently limited to four measures, but could be expanded in a new version of the model. For example, an adaptation measure that changes water availability at the household level (e.g., rainwater harvesting) would be interesting to study as it can change drought propagation over time (Lasage and Verburg, 2015). In future studies, it is recommended to verify whether practices such as buying and selling livestock are important in the region and whether they should be incorporated as an adaptation measure in ADOPT-AP.
As the agents are heterogenous with different characteristics and responses, the differences in income from livestock and crop production can differ substantially. Further analysis is recommended on factors (initial assets, livestock size, area of land, etc.,) that drive inequitable income distributions (Alam et al., 2022).
Additional agents could be added to ADOPT-AP. For example, government institutions at different organizational levels could be included to facilitate policy (efficiency and enforcement) analysis. Other agents, such as large-scale farms or private company water users, allow for an assessment of the effect of these actors on overall water availability (Kaiser et al., 2020). Climate scenarios or storylines could be explored to understand how future water–human interactions are shaped and influence drought impacts.
More research is also needed on the hydrological aspects and how adaptation decisions are processed in the DRYP model. For example, complex land-surface interactions within the DRYP 2.0 hydrological model would allow assessments of adaptation measures that alter water storage through vegetation (e.g., agroforestry) (Wallace et al., 1999).
4.3. Implications and unintended negative outcomes of adaptation
In a changing climate, it is crucial to develop adaptation measures to sustain livelihoods and ecosystems (Pörtner et al., 2022). Most studies focus on the positive sides of adaptation, and how drought adaptation (e.g., irrigation) reduces drought risk. However, this research shows there can be negative unintended consequences from implementing drought adaptation measures that can emerge from the coevolution between water and human systems (Di Baldassarre et al., 2018; Ward et al., 2020). Alam et al. (2022) categorizes these unintended consequences into negative hydrological externalities and unexpected social feedbacks.
ADOPT-AP is capable of capturing these feedbacks in a spatially explicit manner, as it captures both hydrologic processes and heterogeneity of people. An observed example of an unintended hydrological consequence is that irrigation of crops can lead to a reduction of streamflow or a lower groundwater table, affecting communities downstream more severely. This effect is known as the downstream effect of reservoir development, and our spatial modeling framework shows that upstream water- and land users may decrease the streamflow for downstream users, both directly through abstraction (including groundwater) and indirectly through land changes. Groundwater- and surface water abstractions directly lead to a reduction in downstream (groundwater-) flow thus less water availability for downstream users. Similarly, changes in upstream land use may increase evapotranspiration, decrease runoff, and thus decrease downstream water availability (Veldkamp et al., 2017).
We performed a test that compares the water availability of downstream users (1) with upstream users and (2) without upstream users. The simulation shows that adding upstream users causes a decrease of around 1% in soil moisture, around 1 meter of decrease in groundwater level, and 5% decrease in discharge, compared to the situation without upstream agents.
Another unexpected societal feedback is related to the changes in water demand due to increased irrigation practices and changing livestock types. When comparing a model run with all agents adapting to a run with all agents not adapting, there is an increase of irrigation water demand of around ~15%, while crop production is increased by 3.5%. However, while pastoralists try to adapt to drought in the adaptation scenario to lower the risk for livestock, there is indeed a decrease of livestock water abstraction by ~2% compared to no adaptation, but livestock production is decreased by 2%. This can be explained by the way migration is currently modeled; multiple agents to come together in one grid cell, causing a decrease of grass availability and thus livestock production (and water demand) per agent.
The phenomena of multiple agents migrating to a single grid cell is observed in Figure 5C, and shows the emerging pattern of agents migrating with their livestock toward the rivers. Some case studies indeed show that pastoralist move to flood plains of the rivers in times of drought (Mulder, 2019).
5. Conclusion
The ADOPT-AP modeling framework focuses on improving drought risk assessments by including the dynamic feedback between the hydrological system and the adaptation behavior of a heterogeneous population under drought risk. We coupled a spatially distributed hydrological model to a human behavior-centered agent-based model to simulate feedbacks among communities and between people and their environment. These feedbacks were simulated directly through communication structures and indirectly via water and land use management. Understanding these two-way feedbacks between farmer adaptation and the hydrological system helps to improve future drought impact estimates and allows possible drought policies and their implementation to be tested.
Our results indicate that farmers respond differently to drought due to differences in their hydrological environment. In our case study region, downstream communities were impacted more heavily in the past; these communities implemented more short-term adaptation measures than upstream communities. While on the contrary, upstream agents implemented more long-term adaptation measures due to more favorable climatic conditions increasing their resources. We demonstrated how agents respond to drought events (production losses) and how this can lead to the uptake of different adaptation measures. Furthermore, we evidenced how the uptake of these measures can influence different types of drought (soil moisture and hydrological drought), either increasing or decreasing the severity of drought events. Livestock and crop production are particularly sensitive to water availability (influenced by amount of water abstracted for irrigation).
ADOPT-AP is able to access the unintended negative outcomes of adaptation that can emerge due to the coevolution between water and human systems. Examples include the influence of upstream communities on the water availability of downstream communities and the changing water demand and production due to adaptation.
Further research could include additional empirical data (e.g., from surveys) to simulate more realistic human behavior in ABMs and add adaptation measures and feedback that focus on vegetation dynamics and water storage. Furthermore, different types of agents could be added to analyse the effect of (future) policy implementations. Climate scenarios could be explored to understand how future water–human interactions are shaped and influence drought impacts.
Data availability statement
The original contributions presented in the study are included in the article/Supplementary material, and can be found at: http://doi.org/10.5281/zenodo.7447665. Further inquiries can be directed to the corresponding author.
Author contributions
IS: conceptualization, software, visualization, and writing—original draft. JB: conceptualization, software, and writing—review and editing. TH, AL, and JA: conceptualization, supervision, and writing—review and editing. EQ: software and writing—review and editing. MW: methodology and writing—review and editing. KH: writing—review and editing. All authors contributed to the article and approved the submitted version.
Funding
This work was supported by the European Commission as part of Horizon 2020 under DOWN2EARTH (Grant Agreement ID: 869550) and ERC Grant No. 884442. These funding sources had no involvement in the study design, collection, analysis, and interpretation of data or in the preparation or writing this article.
Conflict of interest
The authors declare that the research was conducted in the absence of any commercial or financial relationships that could be construed as a potential conflict of interest.
Publisher's note
All claims expressed in this article are solely those of the authors and do not necessarily represent those of their affiliated organizations, or those of the publisher, the editors and the reviewers. Any product that may be evaluated in this article, or claim that may be made by its manufacturer, is not guaranteed or endorsed by the publisher.
Supplementary material
The Supplementary Material for this article can be found online at: https://www.frontiersin.org/articles/10.3389/frwa.2022.1037971/full#supplementary-material
References
Alam, M. F., McClain, M., and Sikka, A. (2022). Understanding human-water feedbacks of interventions in agricultural systems with agent based models: a review. Environ. Res. Lett. 17 doi: 10.1088/1748-9326/ac91e1
Allen, R. G., Pereira, L. S., and Raes, D. (1998). FAO Irrigation and Drainage Paper No. 56. Rome: Food and Agriculture Organization of the United Nations. p. e156.
Amaya, M., Baran, A., and Lopez-Morales, C. (2021). A coupled hydrologic-economic modeling framework for scenario analysis. Front. Water 3, 681553. doi: 10.3389/frwa.2021.681553
Bierkens, M. F. (2015). Global hydrology 2015: State, trends, and directions. Water Resour. Res. 51, 4923–4947. doi: 10.1002/2015WR017173
Christian-Smith, J., Levy, M. C., and Gleick, P. H. (2015). Maladaptation to drought: a case report from California, USA. Sustain. Sci. 10, 491–501. doi: 10.1007/s11625-014-0269-1
CIESIN (2022). Gridded Population of the World (GPW), v3. Available online at: https://sedac.ciesin.columbia.edu/data/set/gpw-v3-population-density/data-download (accessed March 31, 2022).
de Bruijn, J. A., Smilovic, M., Burek, P., Guillaumot, L., Wada, Y., and Aerts, J. C. J. H. (2022). GEB v0.1: A Large-Scale Agent-Based Socio-Hydrological Model—Simulating 10 Million Individual Farming Households in a Fully Distributed Hydrological Model, EGUsphere. doi: 10.5194/egusphere-2022-664
Deressa, T. T., Hassan, R. M., and Ringler, C. (2011). Perception of and adaptation to climate change by farmers in the Nile basin of Ethiopia. J. Agric. Sci. 149, 23–31. doi: 10.1017/S0021859610000687
Deressa, T. T., Hassan, R. M., Ringler, C., and Alemu, T. (2009). Determinants of farmers' choice of adaptation methods to climate change in the Nile Basin of Ethiopia. Global Environ. Change, 19, 248–255. doi: 10.1016/j.gloenvcha.2009.01.002
Di Baldassarre, G., Viglione, G., Carr, A., Kuil, G., Salinas, L. J. L., and Blöschl, G. (2013). Socio-hydrology: conceptualising human-flood interactions. Hydrol. Earth Syst. Sci. 17, 3295–3303. doi: 10.5194/hess-17-3295-2013
Di Baldassarre, G., Wanders, N., AghaKouchak, A., Kuil, L., Rangecroft, S., Veldkamp, T. I., et al. (2018). Water shortages worsened by reservoir effects. Nat. Sustain. 1, 617–622. doi: 10.1038/s41893-018-0159-0
Dobbie, S., Schreckenberg, K., Dyke, J. G., Schaafsma, M., and Balbi, S. (2018). Agent-based modelling to assess community food security and sustainable livelihoods. J. Artif. Soc. Soc. Simul. 21, 9. doi: 10.18564/jasss.3639
Eiser, J. R., Bostrom, A., Burton, I., Johnston, D. M., McClure, J., Paton, D., et al. (2012). Risk interpretation and action: a conceptual framework for responses to natural hazards. Int. J. Disaster Risk Reduct. 1, 5–16. doi: 10.1016/j.ijdrr.2012.05.002
Ellerbeck, S. (2022). The Horn of Africa is Facing an Unprecedented Drought. What is World Doing to Help Solve It? World Economic Forum. Available online at: https://www.weforum.org/agenda/2022/07/africa-drought-food-starvation/#:~:text=The%20Horn%20of%20Africa%20is%20facing%20severe%20drought%20following%20four,other%20organizations%20are%20sending%20funds (accessed August 10, 2022).
Farmer, J., and Foley, D. (2009). The economy needs agent-based modelling. Nature 460, 685–686. doi: 10.1038/460685a
FEWS NET (2011). Kenya Livelihood Zone Descriptions. Available online at: https://fews.net/east-africa/kenya/livelihood-description/march-2011 (accessed November 2, 2020).
Gbetibouo, G. A. (2009). Understanding Farmers' Perceptions and Adaptations to Climate Change and Variability: The Case of the Limpopo Basin, South Africa, vol. 849. International Food Policy Research Institute.
Gebrehiwot, T., and Van Der Veen, A. (2013). Farm level adaptation to climate change: the case of farmer's in the Ethiopian Highlands. Environ. Manage. 52, 29–44. doi: 10.1007/s00267-013-0039-3
Gebrehiwot, T., and Van Der Veen, A. (2015). Farmers prone to drought risk: why some farmers undertake farm-level risk-reduction measures while others not?. Environ. Manage. 55, 588–602. doi: 10.1007/s00267-014-0415-7
Grothmann, T., and Patt, A. (2005). Adaptive capacity and human cognition: the process of individual adaptation to climate change. Global Environ. Change 15, 199–213. doi: 10.1016/j.gloenvcha.2005.01.002
Haile, G. G., Tang, Q., Sun, S., Huang, Z., and Zhang, X. (2019). Droughts in East Africa: causes, impacts and resilience. Earth Sci. Rev. 193, 146–161. doi: 10.1016/j.earscirev.2019.04.015
Hailegiorgis, A. B., Kennedy, W. G., Rouleau, M., Bassett, J. K., Coletti, M., Balan, G. C., et al. (2010). An Agent Based Model of Climate Change and Conflict Among Pastoralists in East Africa.
Huber, L., Bahro, N., Leitinger, G., and Tappeiner, U. (2019). Agent-based modelling of a coupled water demand and supply system at the catchment scale. Sustainability 11, 6178. doi: 10.3390/su11216178
ISRIC (2022). Soil Property Maps of Africa at 250 m Resolution. Availability online at: https://www.isric.org/projects/soil-property-maps-africa-250-m-resolution (accessed April 15, 2022).
Kaiser, K. E., Flores, A. N., and Hills, V. (2020). Identifying emergent agent types and effective practices for portability, scalability, and intercomparison in water resource agent-based models. Environ. Model. Softw. 127, 104671. doi: 10.1016/j.envsoft.2020.104671
Lalani, B., Dorward, P., and Holloway, G. (2016). Smallholder farmers' motivations for using Conservation agriculture and the roles of yield, labour and soil fertility in decision making. Agric. Syst. 146, 80–90. doi: 10.1016/j.agsy.2016.04.002
Lasage, R., and Verburg, P. H. (2015). Evaluation of small scale water harvesting techniques for semi-arid environments. J. Arid Environ. 118, 48–57. doi: 10.1016/j.jaridenv.2015.02.019
Ligmann-Zielinska, A., Kramer, D. B., and Spence Cheruvelil, K. (2014). Using uncertainty and sensitivity analyses in socioecological agent-based models to improve their analytical performance and policy relevance. PLoS ONE 9, e109779. doi: 10.1371/journal.pone.0109779
Lopez, S. (2008). “Non-linear functions in animal nutrition,”. in Mathematical Modeling in Animal Nutrition. Centre for Agriculture and Biosciences International (CABI). p. 47–88. doi: 10.1079/9781845933548.0047
Lott, F. C., Christidis, N., and Stott, P. A. (2013). Can the 2011 East African drought be attributed to human-induced climate change?. Geophys. Res. Lett. 40, 1177–1181. doi: 10.1002/grl.50235
Maddux, J. E., and Rogers, R. W. (1983). Protection motivation and self-efficacy: a revised theory of fear appeals and attitude change. J. Exp. Social Psychol. 19, 469–479. doi: 10.1016/0022-1031(83)90023-9
Mandleni, B., and Anim, F. D. K. (2011). Climate Change Awareness and Decision on Adaptation Measures by Livestock Farmers (No. 353-2016-18073). doi: 10.5539/jas.v3n3p258
Montanari, A., Young, G., Savenije, H. H. G., Hughes, D., Wagener, T., Ren, L. L., et al. (2013). “Panta Rhei—everything flows”: change in hydrology and society—the IAHS scientific decade 2013–2022. Hydrol. Sci. J. 58, 1256–1275. doi: 10.1080/02626667.2013.809088
Müller, B., Bohn, F., Dreßler, G., Groeneveld, J., Klassert, C., Martin, R., et al. (2013). Describing human decisions in agent-based models–ODD+D, an extension of the ODD protocol. Environ. Model. Softw. 48, 37–48. doi: 10.1016/j.envsoft.2013.06.003
Oageng, I., and Mmopelwa, G. P. (2014). Water consumption patterns in a rural setting in Ngamiland district, Botswana: the case of Boro village. J. Water Sanit. Hyg. Dev. 4, 720–726. doi: 10.2166/washdev.2014.065
Otte, M. J., and Chilonda, P,. (2002). Cattle and Small Ruminant Production Systems in sub-Saharan Africa—A Systematic Review. Available online at: https://www.fao.org/3/Y4176E/y4176e00.htm#Contents (accessed December 15, 2021).
Pande S, and Savenije, H. H. G.. (2016). A sociohydrological model for smallholder farmers in Maharashtra, India. Water Resour. Res. 52, 1923–1947. doi: 10.1002/2015WR017841
Pörtner, H. O., Roberts, D. C., Adams, H., Adler, C., Aldunce, P., Ali, E., et al. (2022). Climate Change 2022: Impacts, Adaptation and Vulnerability. IPCC Sixth Assessment Report.
Quichimbo, E. A., Singer, M. B., Michaelides, K., Hobley, D. E. J., Rosolem, R., and Cuthbert, M. O. (2021). DRYP 1.0: a parsimonious hydrological model of DRYland Partitioning of the water balance. Geosci. Model Dev. 14, 6893–6917. doi: 10.5194/gmd-14-6893-2021
Rao, K. P. C., Ndegwa, W. G., and Kizito, K. (2011). Climate variability and change: Farmer perceptions and understanding of intra-seasonal variability in rainfall and associated risk in semi-arid Kenya. Exp. Agric. 47, 267–291. doi: 10.1017/S0014479710000918
Saltelli, A. (2002). Making best use of model evaluations to compute sensitivity indices. Comput. Phys. Commun. 145, 280–297. doi: 10.1016/S0010-4655(02)00280-1
Saltelli, A., Annoni, P., Azzini, I., Campolongo, F., and Ratto, M. (2010). Variance based sensitivity analysis of model output. Design and estimator for the total sensitivity index. Comput. Phys. Commun. 181, 259–270. doi: 10.1016/j.cpc.2009.09.018
Schreinemachers, P., and Berger, T. (2011). An agent-based simulation model of human-environment interactions in agricultural systems. Environ. Modell. Softw. 26, 845–859. doi: 10.1016/j.envsoft.2011.02.004
Shikuku, K. M., Winowiecki, L., Twyman, J., Eitzinger, A., Perez, J. G., Mwongera, C., et al. (2017). Smallholder farmers' attitudes and determinants of adaptation to climate risks in East Africa. Climate Risk Manage. 16, 234–245. doi: 10.1016/j.crm.2017.03.001
Siebert, S., and Döll, P. (2010). Quantifying blue and green virtual water contents in global crop production as well as potential production losses without irrigation. J. Hydrol. 384, 198–217. doi: 10.1016/j.jhydrol.2009.07.031
Sivapalan, M. (2015). Debates—Perspectives on socio-hydrology: Changing water systems and the “tyranny of small problems”—Socio-hydrology. Water Resour. Res. 51, 4795–4805. doi: 10.1002/2015WR017080
Sobol, I. M. (2001). Global sensitivity indices for non-linear mathematical models and their Monte Carlo estimates. Math. Comput. Simulat. 55, 271–280. doi: 10.1016/S0378-4754(00)00270-6
Swamikannu, N., and Berger, T. (2009). “Impacts of small scale irrigation on poverty dynamics in the White-Volta Basin of Ghana: an integrated multi-agent simulation approach,” in 7th International Science Conference on the Human Dimensions of Global Environmental Change, April (pp. 26–30).
Troy, T. J., Pavao-Zuckerman, M., and Evans, T. P. (2015). Debates—perspectives on socio-hydrology: socio-hydrologic modeling: tradeoffs, hypothesis testing, and validation. Water Resour. Res. 51, 4806–4814. doi: 10.1002/2015WR017046
Van Duinen, R., Filatova, T., and Geurts, P. (2015). Empirical analysis of farmers' drought risk perception: objective factors, personal circumstances, and social influence. Risk Anal. 35, 741–755. doi: 10.1111/risa.12299
Van Loon, A. F., Gleeson, T., Clark, J., Van Dijk, A. I., Stahl, K., Hannaford, J., et al. (2016). Drought in the anthropocene. Nature Geosci. 9, 89–91. doi: 10.1038/ngeo2646
Van Loon, A. F., Rangecroft, S., Coxon, G., Werner, M., Wanders, N., Di Baldassarre, G., et al. (2022). Streamflow droughts aggravated by human activities despite management. Environ. Res. Lett. 17, 044059. doi: 10.1088/1748-9326/ac5def
Van Oel, P., and Van der Veen, A. (2011). Using agent-based modeling to depict basin closure in the Naivasha basin, Kenya: a framework of analysis. Proc. Environ. Anal. 7, 32–37. doi: 10.1016/j.proenv.2011.07.007
Veldkamp, T. I. E., Wada, Y., Aerts, J. C. J. H., Döll, P., Gosling, S. N., Liu, J., et al. (2017). Water scarcity hotspots travel downstream due to human interventions in the 20th and 21st century. Nat. Commun. 8, 1–12. doi: 10.1038/ncomms15697
Vicente-Serrano, S. M., Beguería, S., and López-Moreno, J. I. (2010). A multiscalar drought index sensitive to global warming: the standardized precipitation evapotranspiration index. J. Climate 23, 1696–1718. doi: 10.1175/2009JCLI2909.1
Viglione, A., Baldassarre, D. I., Brandimarte, G., Kuil, L., Carr, L., Salinas, G., et al. (2014). Insights from socio-hydrology modelling on dealing with flood risk–roles of collective memory, risk-taking attitude and trust. J. Hydrol. 518, 71–82. doi: 10.1016/j.jhydrol.2014.01.018
Wallace, J. S., Jackson, N. A., and Ong, C. K. (1999). Modelling soil evaporation in an agroforestry system in Kenya. Agric. Forest Meteorol. 94, 189–202. doi: 10.1016/S0168-1923(99)00009-X
Wang, W., Ertsen, M. W., and Svoboda, M. D. (2016). Propagation of Drought: from Meteorological Drought to Agricultural and Hydrological Drought. doi: 10.1155/2016/6547209
Ward, P. J. Ruiter, d. e., Mård, M. C., Schröter, J., Van Loon, K., Veldkamp, A., et al. (2020). The need to integrate flood and drought disaster risk reduction strategies. Water Security 11, 100070. doi: 10.1016/j.wasec.2020.100070
Watson, D. J., and Binsbergen, J. (2006). Livestock Marketing in Turkana District, Kenya: Opportunities and Constraints. ILRI Brief 1. Nairobi: ILRI.
Wens, M., Johnson, J. M., and Zagaria, C. (2019). Integrating human behavior dynamics into drought risk assessment—A sociohydrologic, agent-based approach. Wiley Interdiscip. Rev. Water 6, e1345. doi: 10.1002/wat2.1345
Wens, M., Veldkamp, T. I., Mwangi, M., Johnson, J. M., Lasage, R., Haer, T., et al. (2020). Simulating small-scale agricultural adaptation decisions in response to drought risk: an empirical agent-based model for semi-arid Kenya. Front. Water 2, 15. doi: 10.3389/frwa.2020.00015
Wens, M. L., Mwangi, M. N., and van Loon, A. F. (2021). Complexities of drought adaptive behaviour: Linking theory to data on smallholder farmer adaptation decisions. Int. J. Disaster Risk Reduction 63, 102435. doi: 10.1016/j.ijdrr.2021.102435
Wens, M. L., Van Loon, A. F., and Veldkamp, T. I. (2022). Education, financial aid, and awareness can reduce smallholder farmers' vulnerability to drought under climate change. Nat. Hazards Earth Syst. Sci. 22, 1201–1232. doi: 10.5194/nhess-22-1201-2022
WFP. (2019). Forecast-Based Financing - Anticipatory Actions for Food Security. Available online at: https://www.wfp.org/publications/forecast-based-financing-fbf-anticipatory-actions-food-security-2019
Xu, C., Hu, Y., Chang, Y., Jiang, Y., Li, X., Bu, R., et al. (2004). Sensitivity analysis in ecological modeling. J. Appl. Ecol. 15, 1056–1062.
Keywords: drought, feedbacks, agent-based model (ABM), socio-hydrology, agropastoralists, drylands
Citation: Streefkerk IN, de Bruijn J, Haer T, Van Loon AF, Quichimbo EA, Wens M, Hassaballah K and Aerts JCJH (2023) A coupled agent-based model to analyse human-drought feedbacks for agropastoralists in dryland regions. Front. Water 4:1037971. doi: 10.3389/frwa.2022.1037971
Received: 06 September 2022; Accepted: 08 December 2022;
Published: 13 January 2023.
Edited by:
Murugesu Sivapalan, University of Illinois at Urbana-Champaign, United StatesReviewed by:
Riddhi Singh, Indian Institute of Technology Bombay, IndiaXi Chen, University of Cincinnati, United States
Copyright © 2023 Streefkerk, de Bruijn, Haer, Van Loon, Quichimbo, Wens, Hassaballah and Aerts. This is an open-access article distributed under the terms of the Creative Commons Attribution License (CC BY). The use, distribution or reproduction in other forums is permitted, provided the original author(s) and the copyright owner(s) are credited and that the original publication in this journal is cited, in accordance with accepted academic practice. No use, distribution or reproduction is permitted which does not comply with these terms.
*Correspondence: Ileen N. Streefkerk,  aWxlZW4uc3RyZWVma2Vya0B2dS5ubA==