 Veronica Mwangi
 Samuel Owuor
 Boniface Kiteme
 Markus Giger
- 1Department of Geography and Environmental Studies, University of Nairobi, Nairobi, Kenya
- 2Centre for Training and Integrated Research in Arid and Semi Arid Lands Development, Nanyuki, Kenya
- 3Centre for Development and Environment, University of Bern, Bern, Switzerland
Wheat is the second most important carbohydrate staple in Kenya and is produced by both smallholder and large-scale farmers. Smallholders are the majority, but produce <20% of the total national production. Compared to large-scale farmers, they have been considered to be less efficient producers and thus fail to benefit fully from their participation in the wheat value chain. This study aims at establishing the value accruing to smallholder and large-scale farmers participating in wheat production in north-west Mt. Kenya. For comparative purposes and to explore the potential of smallholder farmers, a sample of 58 smallholder and seven large-scale farmers was selected for the study. We use budget analysis to determine the gross output, cost of production and gross margins attained by the smallholder and large-scale farmers. Further, an analysis of constraints to productivity is done to establish the factors hindering farmers from reaching high yield potential. Results of the study show that smallholder farmers obtain lower yields, have higher costs of production per bag of wheat and lower gross margins compared to large-scale farmers. High cost of inputs, low market prices, low bargaining power, high cost of machinery services, diseases and weeds were among factors excluding smallholder farmers from benefitting from their participation in the value chain. However, results also show that smallholder farmers can produce wheat profitably albeit with necessary support. Thus, interventions should consider these constraints and aim at improving smallholder farmers' horizontal and vertical integration in the value chain. We recommend continued investment in research and development on wheat, adoption of climate resilient agricultural practices, improvements in the fertilizer subsidy programme and creating or increasing participation in producer groups that will provide possibilities of increased bargaining power and reduction of costs through improved access to machinery services, markets and credit.
Introduction
Wheat is the second most important staple food in Kenya, making it important for food security (Monroy et al., 2013). Currently, per capita consumption of wheat in the country stands at 43 kilograms per person (KNBS, 2020). However, Muyanga et al. (2005) estimated per capita consumption among high income households at 67 kilograms. Wheat has become an important household expenditure item constituting the greatest proportion of the staple budget, particularly for urban households (Muyanga et al., 2005; Kamau et al., 2011). Wheat consumption has been growing at an average of 4% per year (FAO, 2015) propelled by rising population, increased incomes and urbanization (Negassa et al., 2013; Kiriti Nganga and Mugo, 2018). Urbanization, which is associated with a change of dietary preferences to wheat-based diets, has been a significant factor driving wheat demand upwards (Macharia and Ngina, 2017).
Kenya produces, on average, 300,000 metric tons of wheat annually on about 140,000 hectares of land (Chemonics International, 2010; KNBS, 2020). However, in the last four decades, there has been minimal growth in wheat production, yields and area under production (Negassa et al., 2013). Wheat yields average 2.3 metric tons per hectare and may vary between 1.8 and 3.2 metric tons per hectare depending on the season, region and scale of operation, that is, small-scale vs. large-scale farming. The increasing gap between production and demand is largely met through wheat imports. Currently, Kenya imports nearly two million metric tons of wheat, about six times its production (KNBS, 2020).
The main wheat growing regions in Kenya have an altitude above 1,500 m above sea level. These are Nakuru, Uasin Gishu, Trans-Nzoia, Meru and Laikipia counties (FAO, 2015). However, other areas have opened up in more marginal lands such as Narok county (Kamwaga et al., 2016). Wheat is produced by large, medium-scale and smallholder farmers. Although large and medium-scale farmers are few in number, they produce the bulk (80%) of the total wheat produced, while smallholder farmers, who are the majority, produce 20% of the total output (Chemonics International, 2010). Large-scale wheat farmers are defined as farmers cultivating 40 hectares or more of wheat, are highly mechanized, and own all their farm machinery (Gitau et al., 2010). On the other hand, smallholder farmers cultivate wheat on <5 hectares of land and are dependent on machinery hire (Chemonics International, 2010). Due to mechanization, large-scale farmers have been associated with modern cultivation system, while smallholder farmers are associated with reliance on traditional system of wheat cultivation which uses conventional tools to till and harvest (Tadesse et al., 2019). Smallholder farmers produce an average yield of 15 bags per hectare, which is lower than the national average yield of 25 bags per hectare and much lower than large-scale farmers average yield of 40 bags per hectare (Gitau et al., 2010).
Low wheat productivity has been associated with abiotic and biotic factors such as drought, diseases and pests, which are increasing in intensity and frequency due to climate change (Tadesse et al., 2019). For example, high incidences of the Russian wheat aphid has been confirmed in Kenya, particularly in the Mt. Kenya region, compared to neighboring countries of Ethiopia and Uganda (Macharia et al., 2016). Diseases such as yellow rust and stem rust have remained problematic with minimal success in production of disease resistant varieties (Kamwaga et al., 2016). Other constraining factors to wheat production have been use of old age wheat varieties (Gitau et al., 2010), poor soil and water management practices (Kamwaga et al., 2016), lack of credit, low level of technology-adoption and weak extension systems (Nyangito et al., 2002).
However, among the factors contributing to low yields and productivity, high costs of production has been very important (Nyangito et al., 2002; Chemonics International, 2010). Wheat farming in Kenya is regarded as a high cost activity (Nyoro and Jayne, 1999). High cost of inputs and capital costs contribute greatly to high cost of production. Consequently, smallholder wheat farmers resort to low utilization of inputs, which contributes to their low yields (Chemonics International, 2010; Kiriti Nganga and Mugo, 2018). High costs of production not only limit productivity of wheat farmers but also the competiveness of their wheat in the regional market. It is for this reason, that the government has continued to protect wheat farmers from the price effects of wheat imports through tariffs ranging from 10 to 35% (FAO, 2015). Even with the tariffs, smallholder farmers still remain uncompetitive (Gitau et al., 2010). Moreover, should the imposition of duties on wheat imports diminish, smallholder farmers will cease being competitive, risking exclusion from the value chain. Wheat farmers need support to ease the constraints to production and grow wheat at substantially lower prices in order to sustainably participate in the value chain. Reduction of cost of production has the possibility of lowering wheat prices for domestic consumers and, therefore, studies (Nyangito et al., 2002; Muyanga et al., 2005; Negassa et al., 2013) have recommended the need to address the constraints that lead to high cost of production.
Generally, scientific studies on wheat production in Kenya, as well as those localized to Mt. Kenya region, are scarce. Therefore, we aim to contribute to the literature on wheat production in Kenya and its potential to contribute to food security. We do so by analyzing farmers' economic gains and constraints to production in a high potential wheat producing area that has not received adequate attention. We delve deeper to understand the various costs to production and prices in order to provide insights into the factors contributing to high costs of production and low margins, particularly for smallholders, as well as to understand how they relate to production constraints. In so doing, this paper addresses the potential of smallholder wheat farmers in contributing to the national wheat production and supply. Moreover, we provide insights into potential opportunities and interventions that would enhance inclusive value chain participation for smallholder wheat farmers. The findings of this study provide relevant data and evidence for strategy and policy decisions at the local and national levels.
Theoretical Framework
We use the theory of access (Ribot and Peluso, 2003) to understand the ability of smallholder farmers to benefit from their participation in the wheat value chain. The theory provides a more suitable framework for explaining smallholders “exclusion” from benefiting in agro-food value chains compared to social exclusion (Khan et al., 2015) and property (Bracken, 1960; Schmidtz, 1994) theories. We draw on the theory's analysis framework for identifying the particular benefit(s) from resources; and the mechanisms by which actors gain, control and maintain the benefits in the value chain. The benefit can be in the form of farm gate profits of a crop (Ribot and Peluso, 2003). Building on the classical property's definition of access, Ribot and Peluso (2003) define access as the “ability to benefit from things” as opposed to the “right to benefit from things.” In so doing, they differentiated between a person's right to own things and their ability to benefit from them. These things may include material objects, persons and institutions. The differentiation between “benefit” and “right” is key to the theory of access and forms the key distinction between it and the property theory upon which it is based and departs. Thus, an individual may have the right to property such as land, but may not necessarily have the ability to benefit from utilizing it (McKay and Colque, 2016). In other words, rights may be guaranteed but they are not always accessible (Peluso and Ribot, 2020). By focusing on the “ability” rather than “rights,” the theory gives emphasis on factors, structural and relational, that enable or constrain people from benefiting from resources.
Ribot and Peluso (2003) exemplify their notion of access as bundles of powers and webs that enable actors to gain control and maintain access. The theory posits that people and institutions hold and draw upon different bundles of powers. This bundle of powers represents the multiple ways in which people derive benefits from resources. In other words, they are the mechanisms (means, processes and relations) by which certain persons are enabled to gain, control and maintain access to resources. Such mechanisms of access include structural and relational factors such as technology, capital, markets, labor, knowledge and social relations. For example, large farms benefit from a bundle of powers that include access to capital, finance, technology and organization of marketing (Rapsomanikis, 2015). This implies that factors such as advanced technology, capital and markets benefit those who have access to them. Mechanisms of access may run in succession, as when access to credit is contingent upon prior membership to a particular organization (Ribot and Peluso, 2003).
McKay and Colque (2016) argue that lack of access to the bundle of powers inevitably entails exclusion. Thus, exclusion can be taken as the opposite of access, whereby people lack the ability to benefit from things, especially natural resources such as land. Majority of smallholder farmers in north-west Mt. Kenya have maintained their property rights as most land is titled and land tenure generally considered secure (Giger et al., 2020). However, their inability to access machinery and low cost inputs are important mechanisms of access that exclude them from benefiting from land. Moreover, while smallholders are faced with these factors of productive exclusion, they also lack any organized groups to assist in inclusion. Still, smallholder's exclusion can be partly attributed to exclusionary marketing dynamics present in the value chain. This perception of exclusion as lack of mechanisms of access (Ribot and Peluso, 2003) differs from that which is advanced by social exclusion theory in as far as the later associates exclusion to deprivation caused by disassociation from opportunities in a society (Khan et al., 2015). McKay and Colque (2016) point out that exclusion does not exclude everyone equally and tends to marginalize the poor.
Smallholder farmers are among the poor groups in developing countries (Rapsomanikis, 2015). They face several challenges to productive participation in agro-food value chains such as lack of access to markets, credit, capital, technology, advice, inputs and irrigation water (Salami et al., 2010; IFAD, 2013). These access mechanisms are, however, fundamental in ensuring smallholder farmers benefit from production through improved yields and incomes and hence create sustainable livelihoods. In the Results and Discussion sections, we show how smallholder farmers in north-west Mt. Kenya face exclusion from productive participation in the wheat value chain through lack of access mechanisms to markets, credit, capital, technology and inputs.
Materials and Methods
The Study Area
The region north-west Mt. Kenya administratively falls under the counties of Laikipia and Meru in central Kenya. The area is defined by a marked gradient in altitude from 5,199 m above sea level at Mt. Kenya to 1,700 m above sea level at the lowlands of Laikipia plateau. This has an associated impact on climate with annual mean temperature ranging between 16 and 26°C (Graham, 2012). Areas bordering the slopes of Mt. Kenya receive an annual average rainfall of between 750 and 1,200 mm, while the drier parts of the plateau receive 400 mm (GOK, 2018). There are two rainfall seasons in the area; the long rains from mid-March to May and the short rains in October and November. Unlike other wheat growing regions in the country, the region north-west Mt. Kenya has two wheat growing seasons supported by the bimodal rainfall pattern (Kamwaga et al., 2016). In addition to wheat, the region supports cultivation of barley, maize, beans, Irish potatoes and a wide range of vegetables and fruits (Graham, 2012). Wheat production is largely rain fed for both smallholder and large-scale farmers. Smallholder farmers practice mixed farming, mostly for subsistence but also for sale, while large-scale farmers practice commercial farming on large tracts of land up to over 800 hectares (Giger et al., 2020). The region north-west Mt. Kenya was suitable for study because historically, it is one of the five key wheat producing areas in the country, producing both for the local and national market. Wheat production is an important cash crop for the region and significant in the region from a spatial, social and economic perspective. Data from the agricultural office indicates that the harvested area, as well as production, have largely remained stagnant and hence a need for scientific investigation.
Sampling
The study adopted a multi-stage stratified random sampling procedure to determine a sample of 58 smallholder and 7 large-scale wheat farmers. Wheat farmers were categorized according to their farm sizes: smallholder farmers (<5 hectares) and large-scale farmers (more than 40 hectares). Whereas, the study intended to distinguish medium scale farmers (5–40 hectares) from smallholders and large-scale farmers, they were excluded from the study because they were few and difficult to find within the specified proximity of large-scale farmers. Nevertheless, information on medium-scale wheat farmers in Kenya seems scanty and previous studies and reports have documented little information on this category of farmers. We find that studies (Nyangito et al., 2002; Chemonics International, 2010; Njeru, 2010; Monroy et al., 2013; FAO, 2015) either fail to have this categorization of farmers or put them under the same categorization with large-scale farmers, perhaps indicating their homogeneity of production or low numbers.
The study first identified specific sites within the study area from which the sampled wheat farmers would be drawn. Five sub-locations (smallest administrative unit) were selected from a list of 10 sub-locations that predominantly grow wheat. The five selected sub-locations were Maritati, Mutarakwa, Ethi, Kalalu, and Buuri (see Figure 1). These sub-locations were selected during the reconnaissance survey and with the assistance of local administration and agricultural officers. Based on further key informant interviews with local agricultural officers, we generated a list of 15 large-scale farmers in the five sub-locations, from which seven large-scale farmers were selected and interviewed. To enable comparisons between smallholders and large-scale farmers, smallholders were selected within a 20 km radius of the selected large-scale farms. The 58 smallholder farmers were selected thorough a combination of random and snowball sampling. We generated a list of smallholder farmers from key informants which did not yield a significant sample, hence snowballing was done to fill the gap.
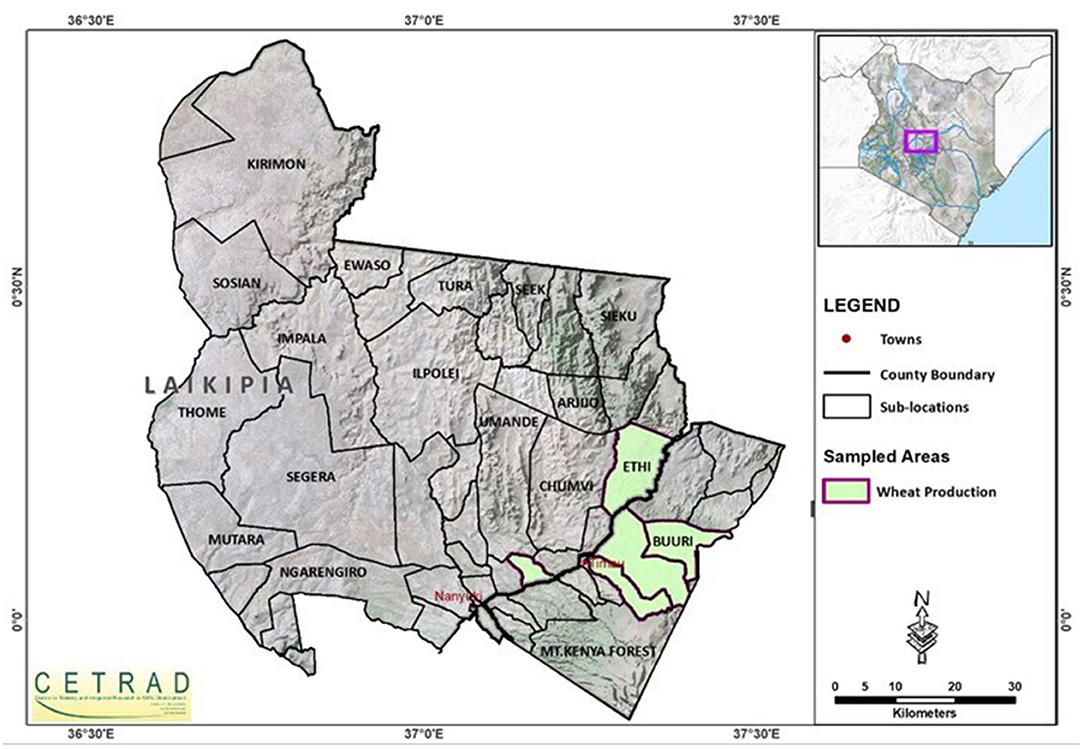
Figure 1. The study area showing sampled sub-locations (Source: Centre for Training and Integrated Research in ASAL Development).
The study was undertaken between October and December 2016, and the data collected pertained to the March-August 2016 wheat growing season. Questionnaires were administered to large-scale farm owners or managers and household heads through face-to-face interviews, with the help of enumerators. The questionnaires included both open and closed questions and collected data on land sizes and tenure, yields, sales, farm gate prices, costs of production, marketing, inputs, institutional support, access to production information and training, access to credit and constraints.
Analysis
The study used descriptive statistics to analyze selected aspects of smallholder and large-scale wheat farmers in the study area. Budgets analysis was used to estimate gross margins, revenue and cost of production. The total volume of production was calculated by aggregating the total amount of produce sold, consumed by the farm family, fed to animals, retained for seed and given away through gifting. Thus, revenue was calculated by multiplying the total volume of production by the farm gate price. Costs of production were divided into variable and fixed costs. The study considered variable costs only which included cost of fertilizers, seed, pesticides (herbicides, fungicides, insecticides), machinery hire and labor. Smallholder farmers considered family labor free of charge. However, in our cost calculation, labor was treated as though it were all hired. As such, family labor was valued at the equivalent of the hired labor, that is, the casual rural wage rate. Cost of inputs such as fertilizer, seed and pesticides were derived by multiplying the quantities utilized by the unit price of each item. The unit price refers to the farmers purchase price per kilogram or liter of the input. Cost of machinery hire was calculated at the hiring price per hectare of cultivated land.
The difference between revenue and costs gave the wheat producers' gross margin. The producer's gross margin represented the amount left over to pay for other costs and realize a profit. Mathematically, this can be represented by the equation:
Where GMi is the gross margin of smallholder or large-scale farmer i; TRi is total revenue of smallholder or large-scale farmer i; and VCi is the variable cost of smallholder or large-scale farmer i.
We analyzed constraints in wheat production to complement gross margin analysis and better understand factors influencing wheat production, beyond budget analysis. Smallholder and large-scale wheat farmers were asked to identify factors constraining their productivity and participation in the value chain. The constraints represent the lacking mechanisms of access necessary for productive participation in the value chain. Analysis of constraints provided a platform to assess how farmers are possibly excluded from the value chain. Both smallholder and large-scale farmers were also asked to suggest possible solutions to the identified constraints and suggest measures that can be undertaken to improve their ability to derive full benefits from wheat production. Key informants were also asked to identify and validate constraints facing wheat farmers as well as suggest possible measures and interventions that could improve farmer's participation in the value chain. While we also collected key data on farm households, this study focused on wheat production, but did not aim to assess the complete farming and livelihood activities and constraints of farmers. This needs to be taken into account when drawing conclusions from our findings.
Results
Characteristics of the Smallholder and Large-Scale Farms
Table 1 presents the characteristics of sampled smallholder and large-scale wheat farms in north-west Mt. Kenya in terms of land use and tenure, yields and sales and marketing channels. The smallholder farmers owned on average 4 hectares of land on which they practice mixed farming. In addition to cultivation of wheat, the study identified at least 15 different crops cultivated by smallholder farmers including maize, potatoes, peas, beans, barley, canola and a variety of fruits and vegetables. Smallholder farmers acquired their land mainly through purchase (60%) and inheritance (53%). On average, smallholder farmers produced wheat on 1.4 hectares of land. With 35% of their land devoted to wheat production, it makes this crop one of their most important crop. More than half (57%) of the smallholder farmers identified the need for crop rotation as the most important determinant of land allocation to different crops. This rotation is important for pest and disease control, as well as for risk reduction within the portfolio of farming activities.
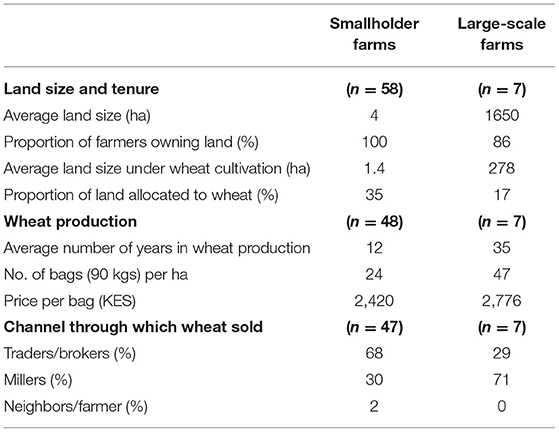
Table 1. Characteristics of sampled smallholder and large-scale wheat farms.
Slightly less than half (48%) of smallholder farmers reported having decreased the proportion of land allocated to wheat from the previous season. About one third (36%) had maintained the same proportion of land and a smaller number (16%) had increased the proportion of land they allocated to wheat production from the previous season. Low yields (39%), crop rotation (29%) and inadequate rains (18%) were the primary reasons why smallholder farmers had reduced the proportion of land allocated to wheat production. On the other hand, large-scale farmers cultivated large tracts of land, averaging 1,650 hectares. The majority (86%) of large-scale farmers owned the farms. Compared to smallholders, large-scale farmers allocated a smaller proportion (17%) of their land to wheat production. The remaining land was allocated to horticulture, pasture, tree cover, production of barley, canola, peas and hay. Similar to smallholder farmers, crop rotation was an important consideration in allocating land to different crop activities.
The smallholder farmers had much lower yields per hectare (24 bags) compared to the large-scale farmers (47 bags). The highest yield per hectare attained for smallholder and large-scale farmers was 59 and 64 bags of wheat, respectively, under rain-fed wheat cultivation, indicating existing potential to improve on yields. One smallholder farmer attained a yield per hectare of 74 bags under irrigation, further indicating potential for higher yields with availability of water. Smallholder farmers sold a 90 kilogram bag of wheat at a farm gate price of KES 2,400 while large-scale farmers sold at a slightly higher price of KES 2,780. High quality of grain and large volumes of production gave large-scale farmers bargaining power.
Interviews with millers revealed preference for wheat from large-scale farmers due to good quality and large volumes. Quality of grain was generally defined according to the moisture content of grain, cleanliness and general appearance. The highest farm gate price was KES 3,000, which was attained by only one smallholder farmer and three large-scale farmers. The lowest price of KES 2,000 was paid to a smallholder farmer, creating a price differential of KES 1,000 between the highest and lowest smallholder farm gate price. This also points to the wide variations in smallholder farm gate prices. Smallholder farmers who belonged to a producers organization had a higher average farm gate price (KES 2,470) compared to those who were not members of any producer association (KES 2,389). However, the producer organizations did not relate to wheat production but other crops such as horticulture and dairy farming. This could perhaps indicate the possibility of farmers accessing market information for different crops through the organizations network.
Farmers sold their wheat either directly to the millers or through brokers. Majority (68%) of the smallholder farmers sold their wheat through brokers. In most instances, brokers were present during harvest and engaged in lengthy price negotiations with smallholder farmers. The price would be decided upon either before or after the harvest depending on the farmer's ability to pay for a combine harvester. In instances where the smallholder farmer could not afford payment for the combine harvester, the trader negotiated a buying price inclusive of the harvesting charges (machinery hire). In a different marketing arrangement, medium-scale millers bought and collected wheat from smallholder farmers. Unlike the smallholders, the majority of the large-scale farmers sold the bulk of their wheat directly to the millers who either collected the grain from the farms or the farmers delivered to the mill. Most large-scale famers belonged to farmers groups that collectively negotiated for the selling price with the millers, while half (57%) of the smallholder farmers that sold wheat did not belong to any farmers' group.
Cost of Production and Gross Margins
The study determined six types of costs of production for smallholder and large-scale wheat farmers as shown in Table 2. These are costs of labor, land preparation, seeds, fertilizers, pesticides and harvesting. The estimated total cost of production for smallholder farmers was KES 39,390 per hectare while that of large-scale farmers was KES 65,880. Land preparation accounted for the largest share of cost of production for smallholder farmers due to high cost of machinery services which constituted 94% of the land preparation cost. Majority (93%) of the smallholder farmers did not own machinery required for wheat production. Instead, smallholder farmers relied on hiring machinery services or use of draft animals and hand tools. The double problem of unavailability of machinery and high cost of hire is also visible in the high harvesting costs for the smallholder farmers. A large proportion (78%) of the harvesting cost constituted hire of combine harvesters. Labor cost accounted for the smallest share of total cost of production given that wheat production is machine intensive thus demanding less labor. Compared to large-scale farmers, smallholder farmers had lower costs on pesticides and fertilizers. However, for some, it was at the expense of good production practices. The study established that smallholder farmers were either not applying or applying comparatively low amounts of pesticides and fertilizers. Moreover, they had a tendency of purchasing the cheapest pesticides in the market which were sometimes ineffective and often hazardous (Ottiger et al., 2018).
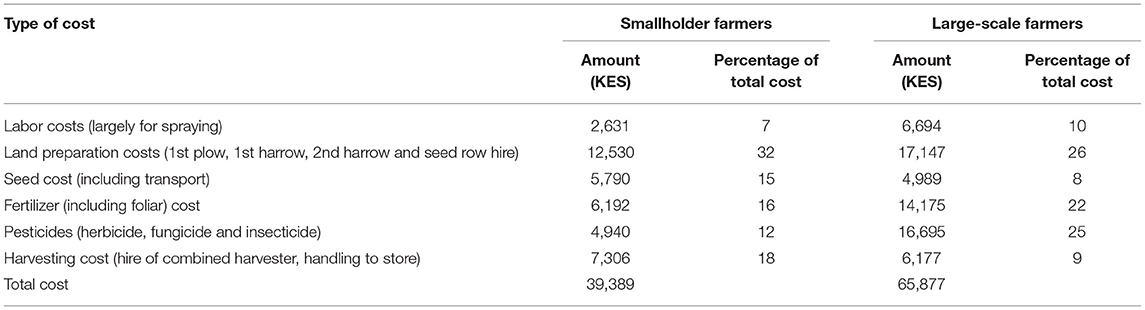
Table 2. Smallholder and large-scale farmer's costs of production (per hectare).
Cost of pesticides and fertilizer formed the bulk of costs for large-scale farmers. And unlike smallholder farmers, large-scale farmers used pesticides in land preparation as opposed to plowing. At least half of the large-scale farmers reported applying conservation agriculture methods such as use of minimum tillage method which avoids plowing in a bid to conserve soil moisture, but relied more on pesticides for control of weeds. Large-scale farmers use at least twice as much pesticides compared to smallholder farmers (Ottiger et al., 2018). In addition, large-scale farmers used up to four different types of fertilizers compared to smallholder farmers who used at most two types. This could perhaps explain the high expenditure on pesticides and fertilizers for large-scale farmers.
The gross margins for smallholder and large-scale farmers are presented in Table 3. For every kilogram of wheat the smallholder harvested, they attained a gross margin of KES 9. On the other hand, large-scale farmers earned KES 16 per kilogram, much higher than the smallholder farmers despite having a higher cost of production. Large-scale farmers attained 200% more gross margin per hectare compared to smallholder farmers. Higher yields and farm gate prices contributed to higher revenue for the large-scale farmers. Large-scale farmers attained twice as much yields and 100% more revenue than smallholder farmers. However, large-scale farmers had a higher cost of production per hectare, 67% more than smallholder farmers. Nonetheless, the cost of production per bag was lower for large-scale farmers compared to smallholder farmers due to higher yields.
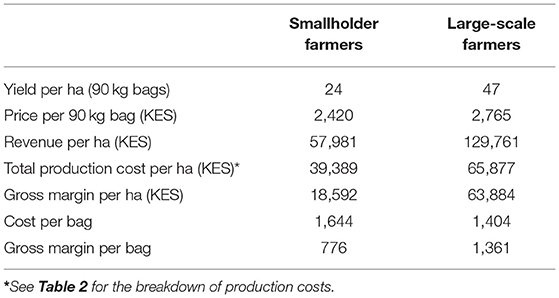
Table 3. Gross margins for wheat farmers.
Constraints to Productivity
This section presents constraints to productivity with a focus on smallholder farmers in order to highlight the lacking mechanisms of access that exclude smallholder farmers from productive participation in the value chain. The major constraints to production identified by at least one third of the smallholder farmers include inadequate and unpredictable rainfall (59%), low market prices and bargaining power (53%), high cost of inputs (48%), unavailability and high cost of machinery services (36%), attack of wheat fields by birds, insects and wild animals (31%) and diseases and stubborn weeds (31%) (Table 4). Other less sighted constraints were lack of access to credit, low productivity, unavailability of labor and subsidized fertilizer, low quality seeds, lack of institutional support, land sub-division, lack of storage facilities, lack of driers, inadequate knowledge on use of inputs and poor infrastructure.

Table 4. Constraints to production identified by smallholder and large-scale wheat farmers.
On the other hand, most of the large-scale wheat farmers identified unpredictable rainfall; and low and fluctuating market prices as their most pressing constraints to production (Table 4). In addition, less than half of the large-scale farmers identified weeds, high cost of inputs, attacks on wheat grain by birds, wildlife, pests and diseases, lack of skilled labor, lack of market and slow rate of seed reproduction by research institutions as constraints to production. We shall discuss the major constraints identified by smallholder farmers in comparison with the same from the large-scale farmers. In addition, we shall indicate solutions to the constraints as suggested by the farmers.
Inadequate and Unpredictable Rains
The risks of inadequate and unpredictable rains was the most cited constraint for both categories of farmers. Wheat production in north-west Mt. Kenya is largely rain fed. Consequently, any change in the amount of rainfall or pattern has a direct impact on production. More than half (59%) of the smallholder farmers pointed out inadequate and unpredictable rainfall as a major challenge in production of wheat. Similarly, four of the seven large-scale farmers identified unpredictable and insufficient rainfall as the most pressing constraint to production. The frequency and extended periods of drought in the past years, a phenomenon that has been linked to climate change, has particularly affected wheat production. Large-scale farmers noted that the unpredictability of rainfall made it difficult for planning. While more than half of the large-scale farmers suggested embracing conservation agriculture practices to conserve moisture and minimize the effect of insufficient rains, few (16%) smallholder farmers suggested provision of water for irrigation.
Low and Fluctuating Prices
Low and fluctuating prices was a major constraint for both the smallholders and large-scale farmers. About half (47%) of the smallholder farmers considered the farm gate price as low, barely covering their costs of production. The results revealed that 41% of smallholder farmers had a negative gross margin. Although, price was not the single contributor to loss making, smallholder farmers considered it an important constraint. The average price received by smallholder farmers was lower compared to large-scale farmers (Table 3). Furthermore, smallholder farmers were scattered and as mentioned earlier, more than half (55%) did not belong to a farmers group hence lacking the power of group negotiation. Other factors that contributed to the low prices included lack of direct marketing link to the millers and low quality wheat grain. Moreover, the majority of the smallholder farmers sold the bulk of their wheat immediately upon harvest when the market was flooded and prices low. Only 14% of smallholder farmers retained part (57%) of their harvest to sell at a later date. Local wheat prices are prone to fluctuations since wheat is a liberalized commodity in Kenya. In fact, large-scale farmers associated low wheat prices to the dampening effect on local prices caused by cheaper imported wheat. Further, they associated fluctuating wheat prices with the changes in the global wheat market prices. To address this constraint, smallholder farmers suggested an increase in farm gate prices (22%) and enhanced direct access to markets (19%), while less than half of the large-scale farmers' proposed better access to markets and stabilization of market prices.
High Cost of Inputs
For both categories of wheat farmers, cost of inputs is a very significant constraint. Wheat production in the study area is input intensive. Farmers use both planting and top dressing fertilizers, and pesticides at least once during a wheat season. These inputs are primarily available to farmers at market prices. However, the government distributes subsidized fertilizers through the National Cereals and Produce Board (NCPB) under a subsidy programme. However, only 17% of smallholder farmers had access to the subsidy programme. Frequent delays in delivery of fertilizer to NCPB stores and to farmers, lack of information on its availability, long and bureaucratic procedure of access, inability to obtain sufficient quantities, long distance to distribution points and perception of the fertilizer as of inferior quality contribute to inefficiency and under performance of the subsidy programme. High cost of inputs results in non-application or application of low quantities of pesticides and fertilizers as smallholder farmers attempt to keep their costs low. Large-scale wheat farmer's pointed out fluctuating foreign exchange rates as a contributing factor to high cost of inputs. The majority of pesticides are imported thus subject to exchange rates (Ottiger et al., 2018). To lower cost of inputs, smallholder farmers suggested subsidies on inputs (40%) and improved access to subsidized fertilizer (17%). However, only one out of the seven large-scale farmers suggested a reduction in prices of inputs.
Unavailability and High Cost of Machinery
Most activities in wheat production require use of machinery, especially for land preparation, planting, spraying and harvesting. Smallholder farmers (36%) were particularly concerned about timely availability of machinery. Unavailability of machinery resulted in delays in land preparation and harvesting with subsequent consequences related to late planting and harvesting. In some instances, smallholder farmers reported resorting to manual tilling of land, use of hand sprayers and hand tools for harvesting, which required more labor and time. The majority (64%) of smallholder farmers planted by broadcasting seed due to either lack of machinery or to cut on the high cost of machinery services. However, this method of planting requires use of more seed. The farmers who broadcasted seed used on average 173 kg of seed per hectare, while those who used planting machinery used 146 kg. It is important to note that unavailability of machinery contributed to the high cost of hire. Smallholder farmers also reported incurring wheat losses during harvest as a result of the poor condition of hired machinery. In addition, combine harvesters were blamed for transfer and spread of problematic weeds like brome grass (Bromus spp.) because a single machine was used in several farms across the wheat growing area. The study observed that rising land subdivision and fragmentation was contributing to difficulties in mechanization and high production costs. About three quarter (70%) of the smallholder farmers had planted wheat on <4 hectares of land. Machinery service providers preferred and prioritized provision of services to farmers with larger parcels of land. Difficulty in accessing machinery services increased with decreasing size of land. This can partially explain the unavailability of machinery to smallholder farmers. Smallholder farmers hiring machinery services for parcels of land <1 acre paid a fee equivalent to an acre (0.4 hectares), raising their production costs. At least 26% of smallholder farmers proposed a reduction of fees on machinery services to address this constraint to production.
Weeds, Diseases and Birds
Both categories of farmers faced problems related to weeds and diseases. Diseases such as wheat rust are persistently problematic to control for wheat farmers (Tadesse et al., 2019). Control of wheat rust involved the application of fungicides. With limited capital and knowledge, smallholder farmers found themselves losing their crop due to delays or failure to control such diseases. Both smallholder and large-scale farmers identified wild oat and brome grass as problematic weeds. Brome grass was particularly difficult to manage due to cropping intensity, enhanced seed dormancy and resistance to herbicides, thus farmers undertook frequent spraying with herbicides making it costly to eliminate. Smallholder farmers identified the Quelea bird as causing damage to wheat fields. They reported spending many hours, in the morning and evening chasing the birds away, with some incurring yield losses. Large-scale farmers mentioned insects such as aphids as a problem for production. Weak agricultural extension services contributed to farmer's lack of information on timely identification of diseases and ways in which to manage them. Results showed that only 30% of smallholder farmers had access to government extension services. The few agricultural extension officers available had responsibility over very large areas making it impossible to reach all farmers. Still they lacked necessary resources like means of transport for efficient delivery of services.
Limited Access to Capital for Smallholder Farmers
The majority (74%) of smallholder farmers had not accessed credit in the past 1 year of the survey. Smallholder farmers who accessed credit borrowed mainly from Savings and Credit Cooperatives. Despite wheat production being capital intensive, farmers faced various challenges in accessing credit. Mainstream lenders like banks were reluctant to lend to smallholder farmers for lack of collateral and an assured consistent flow of income. Moreover, high interest rates discouraged farmers from borrowing. While savings and credit co-operatives have increasingly grown and opened up lending to farmers (KNBS, 2020), the amounts loaned are minimal, limited by the strength of collateral. This in turn limits farmers' growth and expansion. The study noted that a number of smallholder farmers were apprehensive about taking credit particularly from banks for fear of inability to pay in case of crop failure. Even then, only 12% of the smallholder farmers suggested improved access to credit as a means to improve participation in the value chain.
Discussion
We found important differences between smallholder and large-scale farmers in terms of ownership and access to production resources, use of inputs, production practices, yields, farm gate prices, marketing structure and cost of production, confirming findings by earlier studies (Gitau et al., 2010; Njeru, 2010; Mburu et al., 2014). These differences are discussed here and help explain the means by which smallholder farmers are excluded from productive wheat farming. As stated earlier, the exclusion of medium-scale farmers from the study was not by design but their absence from study sites. Whereas, their inclusion would have perhaps provided a broader scope and more insights into their mode of production, we still find that a comparison of smallholders with large-scale farmers has enabled us to highlight the potential of smallholders to upscale production. Moreover, the comparison has enabled us build a case for a more targeted policy approach toward smallholder wheat farmers.
Contrary to our expectations, smallholder farmers allocated a higher proportion of their land to wheat production compared to large-scale farmers. This is despite previous studies (Nyangito et al., 2002; Monroy et al., 2013) showing that wheat production in Kenya, particularly among smallholder farmers is uncompetitive due to high cost of production and competition from other farming enterprises such as dairying. An earlier study by Mahagayu et al. (2007) also found that smallholder farmers in north-west Mt. Kenya devoted about 25% of their land to wheat while the remainder was used for dairying and growing crops such as maize, potatoes and peas. This result is similar to our findings and may indicate that the area under wheat production has remained generally the same. Smallholder farmers seem to choose producing their staple or cash crop but also diversify their production as a risk strategy to mitigate against possible losses, diversify income sources and achieve better diets (Rapsomanikis, 2015; Anderson and Sobol, 2018). This diversification should be put in mind while interpreting our results and focus on wheat should not be taken to imply it is the sole solution to raising incomes and food security. Smallholder households in north-west Mt. Kenya produce at least 60% of the food they consume (Mutea et al., 2019). Studies (Haggblade et al., 2010; Rapsomanikis, 2015; Jayne et al., 2016; AGRA, 2017) have shown that farm income from sale of crops and livestock contribute between 50 and 90% of Africa's smallholders income; and smallholder farmers produce cash crops mainly for sale (Dembele et al., 2018). Wheat forms an important income generating crop in the farmer's portfolio. Past studies (Nyoro and Jayne, 1999) have indicated that wheat production remains attractive owing partly to government support through provision of credit and extension support to farmers, maintenance of a network of collection points and depots and price regulations. Still, interviews with smallholder farmers revealed they were attracted to wheat cultivation due to the minimal labor requirements. However, interviews with large-scale farmers observed a steady shift to crops such as canola, peas, potatoes and horticulture (flowers) that were perceived to fetch better prices. This indicates a form of “self-exclusion” from the wheat value chain to more competitive enterprises. Bearing in mind that large-scale farmers produce the largest proportion of wheat in the country, reduced allocation of land to wheat production could pose a threat to food security as well as existence of the local wheat industry.
Large-scale farmers attained twice as much yields as the smallholder farmers confirming results of earlier studies by Nyoro et al. (2007) and Gitau et al. (2010). We attribute the differences in yields to production related factors such as mechanization, use of inputs such as fertilizers and seeds, control of pests and diseases. Use of conventional tools for wheat production as well as hiring of capital equipment have been shown to increase inefficiencies of farmers and contribute to low productivity (Njeru, 2010; Tadesse et al., 2019). Smallholder farmers in north-west Mt. Kenya tend to use lower quantities of seed and fertilizer against those recommended for broadcasting. Furthermore, fewer smallholder farmers used treated seed compared to the large-scale farmers. In addition, they also used fewer types of fertilizers compared to the large-scale farmers who applied at least four different types, according to their soil requirements. This is consistent with findings by Mburu et al. (2014) that reported high use of inputs such as certified seeds and fertilizers among large-scale wheat farmers while smallholder farmers used recycled seeds. Use of fertilizer, capital inputs and certified seeds have been found to be major determinants of wheat output (Njeru, 2010).
In as much as the results suggest that large-scale farmers achieve higher yields compared to smallholder farmers, both type of farmers are producing below their yield potential. Given a potential yield of 7.5 tons per hectare for the popular seed varieties used by the farmers (Kamwaga et al., 2016), large-scale farmers have unachieved potential of more than 70%. However, such potential can possibly be achieved under optimum conditions. Use of irrigation has the potential to close the yield gaps as water accessibility has been shown to be a significant factor in determining crop productivity (Khamzina et al., 2015). As such, the highest yield of bags per acre was attained by a smallholder farmer practicing irrigation, despite the variations between the same group of farmers. Some smallholder farmers also experienced no yield because of wheat rust and drought, while others had a negative gross margin.
Similar to the difference in yields, large-scale farmers obtained more than double in revenue per hectare compared to smallholder farmers. These results compare well with previous studies by Gitau et al. (2010) and Mburu et al. (2014) who found that large-scale wheat farmers made about three and 1.3 times more profit respectively, compared to smallholder farmers. We postulate that farm gate prices, marketing channels and self-organization among farmers were important factors contributing to the difference in revenue. On average, the farm gate prices for large-scale farmers were higher than that of smallholder farmers. Quality, high volume, marketing channel and organization contributed to higher farm gate prices for large-scale farmers. Interviews with millers and traders revealed a preference for wheat from large-scale farmers because it met moisture content and bushel weight requirements and was generally clean with minimal waste. Another possible explanation for the higher prices obtained by large-scale farmers was their ability to negotiate prices directly with the millers or through a common farmers' group. This explains the fact that most of the large-scale farmers were members of a farmers group through which they exchanged information and knowledge; and collectively negotiated for input and farm gate prices. Comparatively, less than half of the smallholder farmers belonged to a farmers group, none of which had a focus on wheat production. This confirms findings by Chemonics International (2010) and Warsanga and Evans (2018) who found weak associations between smallholder wheat farmers compared to large-scale farmers. Similar to findings by Rapsomanikis (2015), smallholder farmers sold the bulk of their wheat to traders upon harvest when prices tend to be low, another possible explanation for the farm gate prices differentials. Analysis of the single smallholder farmer who attained the highest farm gate price revealed that he retained a large proportion of his harvested wheat and sold after the harvest period. This indicates the possibility of attaining higher prices by storing wheat for sale when market prices are attractive.
Whereas, the cost of production per hectare was higher for large-scale farmers compared to smallholder farmers, cost per bag of wheat produced was higher for smallholder farmers. Similar findings were reported by Nyoro et al. (2007) and Gitau et al. (2010). This finding seems to underline the significance of higher yields. That is, cost of production per bag decreases with increasing yields. This could also imply that smallholder farmers cost minimization strategy through use of low input ratios may compromise on output and margins. Despite smallholder farmers having on average lower costs of production, their cost on seed and harvesting were higher than that of large-scale farmers. Higher seed costs could perhaps be explained by the higher usage of seeds through broadcasting method and seed transportation costs, in addition to the cost of seed. High harvesting costs can be explained by the high cost of machinery services as highlighted under constraints identified by smallholder farmers.
Results revealed several similarities in the constraints to wheat production identified by both smallholder and large-scale farmers. Moreover, these constraints are similar to findings of earlier studies (Hassan et al., 1993; Nyangito et al., 2002; Mahagayu et al., 2007; ASDSP, 2010; Gitau et al., 2010; Mburu et al., 2014). In particular, constraints such as high cost of inputs, machinery services, credit availability and marketing faced by smallholder farmers are similar with the findings of Mahagayu et al. (2007), a study conducted in the same area, indicating persistence of the same constraints over the years. Thus, we argue that this set of constraining factors constitute important access mechanisms without which farmers risk continued low productivity and possibility of eventual exit from wheat production. Constraints such as cost of machinery service and lack of access to credit were unique to smallholder farmers. Analysis of constraints corroborates the results of gross margin analysis, and in particular the differences in yields, farm gate prices and costs. While production constraints apply to both smallholder and large-scale farmers, the later seem to manage them better and remain profitable mainly attributable to their advantage of economies of scale related to use of machinery, input provision and technologies used. This could imply that smallholder farmers stand to benefit from improved linkages with large-scale farmers through transfer of knowledge and skills.
Possible solutions to constraints suggested by farmers mirror the constraints experienced. Although suggested solutions such as subsidies on inputs like fertilizers, seeds and machinery are viable options, studies have shown mixed results on their impact on production. Agricultural input subsidies have been shown to have sustained beneficial impact by increasing production and income, only in the short term (Jayne et al., 2018), while some studies have found it difficult to directly link subsidies to agricultural outcomes like output (Kato, 2016; Lopez et al., 2017; Hemming et al., 2018). Moreover, subsidies have been criticized for crowding out commercial sales and being a disincentive for efficient use of resources by protecting farmers from competition (Emvalomatis et al., 2008; Chirwa and Dorward, 2013). Challenges related to implementation of subsidy programs, as highlighted in this study, impede their success and may be very costly for the government in the long term. In spite of that, in the short term, we recommend revamping the current subsidy program to increase its efficiency. Even so, we argue for adoption of long term oriented solutions that support improved vertical and horizontal linkages among farmers, for example, creating strong associations and cooperatives that actively promote smallholder participation (Fan et al., 2013). Our results have shown that large-scale wheat farmers, through their association, have direct market access and, collectively negotiate better selling prices and lower prices of inputs. This is an indication that smallholders may have the possibility to benefit as such from economies of scale by being organized in groups. Studies (Thomas et al., 2011; Fischer and Qaim, 2014; Mukhovi et al., 2020; Mwangi et al., 2020) have shown that smallholder farmers in developing countries like Kenya obtain economic and social benefits such as improved access to markets and market-related services, credit, information and training from group membership. With the devolution of agriculture in Kenya, we advocate for county-level government support to strengthen farmer groups. Whereas, farmers cooperatives focusing on specialty crops such as coffee have been successful, it is important for the groups to go beyond a single crop due to the diversified nature of crop production associated with smallholders (Fischer and Qaim, 2014).
Conclusion
Wheat will continue being an important staple for Kenyan households, especially in the urban areas, offering a ready market for farmers. Our findings make important contributions to the literature on wheat production in Kenya and in other developing countries. We have shown that smallholder farmers obtain lower yields, have higher costs of production per bag of wheat and lower gross margins compared to large-scale farmers. Moreover, their yields are much lower compared to those obtained through wheat research trials. Based on the theory of access, we obtained an explanation and better understanding of constraints to smallholder farming. We have shown that lack of mechanisms of access such as markets, technology, capital, knowledge and social relations are limiting smallholder farmers' ability to benefit from their participation in the wheat value chain. Yet, past evidence has shown that smallholder farmers will remain important for food production and security in developing countries, at least in the near future. Smallholder farmers seem more challenged than large-scale farmers and hence the focus. Nonetheless, it is equally important to address the concerns by large-scale farmers to provide incentives for increased production and to strengthen the linkages and coexistence of the two production systems.
There is need to develop holistic solutions to support farmers to close yield gaps and reduce costs of production in order to remain profitable. These solutions need to recognize the constraints hindering farmers from participating sustainably in food production. They also need to prioritize the key constraints to production for both smallholder and large-scale farmers. Our findings have shown that some of the constraints identified by both large-scale and smallholder farmers are intertwined, while some have persisted over time, pointing to the absence of growth enablers like access to credit, crop protection tools and affordable production inputs and services. Continued exposure to many challenges and incapacity to deal with them creates a difficult environment for farmers to thrive, while leaving them in a continuous cycle of trying. Eventually, such a situation renders participation in a value chain unsustainable and may exclude farmers from production. A wholesome approach is thus required to effectively address the constraints identified by the farmers.
We, therefore, make the following policy recommendations to enhance smallholder farmers' participation and productivity in the wheat value chain, separated, in supply and demand side interventions.
On the supply side we suggest:
1) Provide support to smallholder farmers to organize themselves around strong farmers' groups or associations to enhance their bargaining power and access to extension services, inputs, machinery services, credit facilities and training.
2) Promote agricultural practices that will improve soil productivity and water conservation, while at the same time enhancing smallholder farmers' resilience to the impact of climate change.
3) Develop credit facilities through local institutions to provide attractive, tailor-made and affordable products and services that are suitable to the needs of smallholder farmers with minimal constraining factors such as collateral and high interest rates.
4) Continued investment in research and development of wheat breeds that are not only of high quality and yields but also resistant to local diseases, pests, weeds and abiotic stress.
5) Strengthen the role of extension services to achieve wider coverage, efficiency in service provision, training and frequent interactions with farmers to enhance their productivity.
6) A review of the national government subsidy program on fertilizers to address its inherent multiple inefficiencies and lengthy processes that hinder smallholder farmers from accessing fertilizers.
7) Operationalization of the national government's Agricultural Sector Growth and Transformation Strategy to improve smallholder farmers' access to inputs such as seeds and equipment, in addition to fertilizers.
On the demand side, we recommend:
1) Support farmers' groups or associations to build stronger linkages to regional and national markets by improving storage facilities and safe post-harvest management.
2) Improve access to market information for smallholder farmers.
3) Encourage perfect competition at the level of wholesale trade in view of improving prices for smallholder producers.
4) Reduce fluctuations of market prices through monitoring and limiting imports of wheat at below market prices.
Data Availability Statement
The raw data supporting the conclusions of this article will be made available by the authors, without undue reservation.
Ethics Statement
Verbal informed consent was obtained from all the sampled population before the study. The participants were informed that the information provided was to remain confidential and only used for research purposes. Approval to carry out research was obtained from Kenya National Commission for Science, Technology and innovation, Permit No. NACOSTI/P/18/33175/20984 as per the University of Nairobi requirements and applicable national regulations.
Author Contributions
VM and MG contributed to the conception and design of the study. VM carried out acquisition, analysis and interpretation of data, and writing the original draft. SO and BK supervised the research. SO, BK, and MG reviewed and edited the manuscript. All authors read and approved the final manuscript.
Funding
This research was funded by the Swiss National Science Foundation (SNSF) through the Swiss Programme for Research on Global Issues for Development (r4d programme), grant number 400540_152033. The funders had no role in the design of the study; in the collection, analyses, or interpretation of data; in the writing of the manuscript, or in the decision to publish the results.
Conflict of Interest
The authors declare that the research was conducted in the absence of any commercial or financial relationships that could be construed as a potential conflict of interest.
Acknowledgments
This research was facilitated by Centre for Training and Integrated Research in ASAL Development (CETRAD). We thank Grace Wambugu and Patricia Mambo for the assistance accorded during data collection and cleaning. We are also thankful to Elizah Peter who prepared the map for this study. Gratitude to Johanna Jacobi for assisting in the conceptualization of the study and initial review of the manuscript. This study was part of Ph.D. work of VM.
References
AGRA (2017). Africa Agriculture Status Report: The Business of Smallholder Agriculture in Sub-Saharan Africa (Issue 5). Nairobi: Alliance for a Green Revolution in Africa (AGRA).
Anderson, J., and Sobol, D. (2018). Executive Summary: CGAP National Surveys of Smallholder Households. Washington, DC: CGAP.
ASDSP (2010). Agricultural Sector Development Strategy 2010-2020. Nairobi: The Agricultural Sector Development Support Programme, Government of Kenya.
Bracken, J. A. (1960). A theory of property according to John Locke (Master's Thesis). Chicago: Loyola University.
Chemonics International (2010). Staple Foods Value Chain Analysis: Country Report-Kenya. Nairobi: USAID.
Chirwa, E. W., and Dorward, A. (2013). Agricultural Input Subsidies: The Recent Malawi Experience, 1st Edn. New York, NY: Oxford University Press. doi: 10.1093/acprof:oso/9780199683529.001.0001
Dembele, B., Bett, H. K., Kariuki, I. M., and Le Bars, M. (2018). Understanding the multiple sources drivers of agricultural income amongst smallholder farmers in Southern Mali. Rev. Agric. Appl. Econ. 21, 32–40. doi: 10.15414/raae.2018.21.02.32-40
Emvalomatis, G., Lansink, A. O., and Stefanou, S. E. (2008). “An examination of the relationship between subsidies on production and technical efficiency in agriculture: the case of cotton producers in Greece,” in Paper Prepared for Presentation at the 107th EAAE Seminar “Modelling of Agricultural and Rural Development Policies” (Sevilla).
Fan, S., Brzeska, J., Keyzer, M., and Halsema, A. (2013). From subsistence to profit: transforming smallholder farms (Food Policy Report). Washington, DC: IFPRI. doi: 10.2499/9780896295582
FAO (2015). Analysis of Price Incentives for Wheat in Kenya (Technical notes series, MAFAP). Rome: FAO.
Fischer, E., and Qaim, M. (2014). smallholder farmers and collective action: what determines the intensity of participation? J. Agric. Econ. 65, 683–702. doi: 10.1111/1477-9552.12060
Giger, M., Mutea, E., Kiteme, B., Eckert, S., Anseeuw, W., and Zaehringer, J. G. (2020). Large agricultural investments in Kenya's Nanyuki Area: inventory and analysis of business models. Land Use Policy 99:104833. doi: 10.1016/j.landusepol.2020.104833
Gitau, R., Mburu, S., Mathenge, M. K., and Smale, M. (2010). Trade and Agricultural Competitiveness for Growth, Food Security and Poverty Reduction: A Case of Wheat and Rice Production in Kenya. WPS45/2011. Nairobi: Tegemeo Institute of Agricultural Policy and Development.
Graham, M. D. (2012). A Wildlife Conservation Strategy for Laikipia County (2012-2030), 1st Edn. Nanyuki: Laikipia Wildlife Forum.
Haggblade, S., Hazell, P., and Reardon, T. (2010). The rural non-farm economy: prospects for growth and poverty reduction. World Dev. 38, 1429–1441. doi: 10.1016/j.worlddev.2009.06.008
Hassan, R. M., Mwangi, W. M., and Karanja, D. D. (1993). “Wheat supply in Kenya: production technologies, sources of inefficiency, and potential for productivity growth,” in CIMMYT Economics Working Paper No. 93-02 (Mexico: CIMMYT).
Hemming, D. J., Chirwa, E. W., Ruffhead, H. J., Hill, R., Osborn, J., Langer, L., et al. (2018). Agricultural Input Subsidies for Improving Productivity, Farm Income, Consumer Welfare and Wider Growth in Low- and Middle-Income Countries: A Systematic Review. London: International Initiative for Impact Evaluation (3ie). doi: 10.23846/SR51062
Jayne, T. S., Chamberlin, J., Traub, L., Sitko, N., Muyanga, M., Yeboah, F. K., et al. (2016). Africa's changing farm size distribution patterns: the rise of medium-scale farms. Agric. Econ. 47, 197–214. doi: 10.1111/agec.12308
Jayne, T. S., Mason, N. M., Burke, W. J., and Ariga, J. (2018). Review: taking stock of Africa's second-generation agricultural input subsidy programs. Food Policy 75, 1–14. doi: 10.1016/j.foodpol.2018.01.003
Kamau, M., Olwande, J., and Githuku, J. (2011). Consumption and Expenditures on Key Food Commodities in Urban Households: The Case of Nairobi. Nairobi: Tegemeo Institute of Agricultural Policy and Development.
Kamwaga, J., Macharia, G., Boyd, L., Chiurugwi, T., Midgley, I., Canales, C., et al. (2016). Kenya Wheat Production Handbook. Nairobi: Kenya Agricultural and Livestock Research Organization.
Kato, T. (2016). Agricultural input subsidies in sub-Saharan Africa - the case of Tanzania (PhD Thesis). England: University of Sussex. doi: 10.19088/1968-2016.130
Khamzina, A., Lamers, J. P. A., Rudenko, I., and Vlek, P. (Eds.). (2015). Restructuring Land Allocation, Water Use and Agricultural Value Chains: Technologies, Policies and Practices for the Lower Amudarya Region, 1st Edn. Göttingen: V&R Unipress. doi: 10.14220/9783737002974
Khan, S., Combaz, E., and McAslan Fraser, E. (2015). Social Exclusion: Topic Guide, Revised Edn. Birmingham: GSDRC, University of Birmingham.
Kiriti Nganga, T., and Mugo, M. G. (2018). “Impact of economic regimes on food systems in Kenya,” in Towards Food Sustainability Working Paper No. 7 (Bern: Centre for Development and Environment (CDE), University of Bern).
Lopez, C. A., Salazar, L., and De Salvo, C. P. (2017). Agricultural Input Subsidies and Productivity: The Case of Paraguayan Farmers. Inter-American Development Bank. doi: 10.18235/0000683
Macharia, G., and Ngina, B. (2017). “Wheat in Kenya: past and twenty-first century breeding,” in Wheat Improvement, Management and Utilization, eds R. Wanyera, and J. Owuoche (Rijeka: InTech), 3–15. doi: 10.5772/67271
Macharia, M., Tebkew, D., Agum, W., and Njuguna, M. (2016). Incidence and distribution of insect pests in rain-fed wheat in eastern Africa. Afr. Crop Sci. J. 24:149. doi: 10.4314/acsj.v24i1.17S
Mahagayu, M. C., Kamwaga, J., Ndiema, A. C., Kamundia, J., and Gamba, P. (2007). “Wheat productivity, constraints associated in the eastern parts of Kenya Timau division,” in 8th African Crop Science Conference Proceedings Vol. 8, ed K. Z. Ahmed (El-Minia), 1211–1214.
Mburu, S., Ackello-Ogutu, C., and Mulwa, R. (2014). Analysis of economic efficiency and farm size: a case study of wheat farmers in Nakuru district, Kenya. Econ. Res. Int. 2014, 1–10. doi: 10.1155/2014/802706
McKay, B., and Colque, G. (2016). Bolivia's soy complex: the development of “productive exclusion.” J. Peasant Stud. 43, 583–610. doi: 10.1080/03066150.2015.1053875
Monroy, L., Mulinge, W., and Witwer, M. (2013). Analysis of incentives and disincentives for wheat in Kenya (Technical notes series, MAFAP). Rome: FAO.
Mukhovi, S., Jacobi, J., Llanque, A., Rist, S., Delgado, F., Kiteme, B., et al. (2020). Social self-organization and social-ecological resilience in food systems: lessons from smallholder agriculture in Kenya and indigenous guaraní communities in Bolivia. Food Stud. 10, 19–42. doi: 10.18848/2160-1933/CGP/v10i01/19-42
Mutea, E., Bottazzi, P., Jacobi, J., Kiteme, B., Speranza, C. I., and Rist, S. (2019). Livelihoods and food security among rural households in the North-Western Mount Kenya region. Front. Sustain. Food Syst. 3:98. doi: 10.3389/fsufs.2019.00098
Muyanga, M., Jayne, T. S., Argwings-Kodhek, G., and Ariga, J. (2005). Staple Food Consumption Patterns in Urban Kenya: Trends and Policy Implications. Nairobi: Tegemeo Institute of Agricultural Policy and Development, Egerton University.
Mwangi, V., Owuor, S., Kiteme, B., Giger, M., Jacobi, J., and Kirui, O. (2020). Linking household food security and food value chains in North West Mt. Kenya. Sustainability 12:4999. doi: 10.3390/su12124999
Negassa, A., Shiferaw, B., Koo, J., Sonder, K., Smale, M., Braun, H. J., et al. (2013). The Potential for Wheat Production in Africa: Analysis of Biophysical Suitability and Economic Profitability. Mexico: CIMMYT.
Njeru, J. (2010). Factors Influencing Technical Efficiencies among Selected Wheat Farmers in Uasin Gishu District, Kenya. AERC Research Paper 206. Nairobi: African Economic Research Consortium.
Nyangito, H., Ikiara, M., and Ronge, E. (2002). Performance of Kenya's Wheat Industry and Prospects for Regional Trade in Wheat Products. Nairobi: Kenya Institute for Public Policy Research and Analysis.
Nyoro, J. K., Ayieko, M., and Muyanga, M. (2007). “The compatibility of trade policy with domestic policy interventions affecting the grains sector in Kenya,” in Paper Presented at the FAO's Workshop on Trade and Policy for Food Products Conducive to Development in Eastern Africa (Rome).
Nyoro, J. K., and Jayne, T. S. (1999). “Trends in regional agricultural productivity in Kenya,” in Kenya Agricultural Marketing and Policy Analysis Project (Nairobi: Tegemeo Institute of Agricultural Policy and Development, Egerton University/Michigan State University).
Ottiger, F., Kiteme, B., and Jacobi, J. (2018). Highly Hazardous Pesticides (HHPs) in Agro-industrial and Smallholder Farming Systems in Kenya. CDE Policy Brief. Bern: CDE.
Peluso, N. L., and Ribot, J. (2020). Postscript: a theory of access revisited. Soc. Nat. Resour. 33, 300–306. doi: 10.1080/08941920.2019.1709929
Rapsomanikis, G. (2015). The Economic Lives of Smallholder Farmers: An Analysis Based on Household Data From Nine Countries. Rome: FAO.
Ribot, J. C., and Peluso, N. L. (2003). A theory of access*. Rural Sociol. 68, 153–181. doi: 10.1111/j.1549-0831.2003.tb00133.x
Salami, A., Kamara, A. B., and Brixiova, Z. (2010). “Smallholder agriculture in East Africa: trends, constraints and opportunities,” in Working Paper Series No.105 (Tunis: African Development Bank).
Schmidtz, D. (1994). The institution of property. Soc. Philos. Policy 11, 42–62. doi: 10.1017/S0265052500004428
Tadesse, W., Bishaw, Z., and Assefa, S. (2019). Wheat production and breeding in Sub-Saharan Africa: challenges and opportunities in the face of climate change. Int. J. Clim. Change Strat. Manag. 11, 696–715. doi: 10.1108/IJCCSM-02-2018-0015
Thomas, T., Gunden, C., Miran, B., and Manoi, M. A. (2011). Farmers' assessment of social and economic benefits derived from cooperatives, private firms and other agricultural organizations in the Aegean region of Turkey. J. Food Agric. Environ. 9, 1085–1087.
Keywords: cost of production, gross margin, smallholders, wheat farmers, yields, theory of access, constraints
Citation: Mwangi V, Owuor S, Kiteme B and Giger M (2021) Assessing Smallholder Farmer's Participation in the Wheat Value Chain in North-West Mt. Kenya. Front. Sustain. Food Syst. 5:657744. doi: 10.3389/fsufs.2021.657744
Received: 23 January 2021; Accepted: 19 May 2021;
Published: 16 June 2021.
Edited by:
Ademola Braimoh, World Bank Group, United StatesReviewed by:
Vengadeshvaran Sarma, Nottingham University Business School, MalaysiaAlisher Mirzabaev, Center for Development Research (ZEF), Germany
Tapan Sarker, Griffith University, Australia
Copyright © 2021 Mwangi, Owuor, Kiteme and Giger. This is an open-access article distributed under the terms of the Creative Commons Attribution License (CC BY). The use, distribution or reproduction in other forums is permitted, provided the original author(s) and the copyright owner(s) are credited and that the original publication in this journal is cited, in accordance with accepted academic practice. No use, distribution or reproduction is permitted which does not comply with these terms.
*Correspondence: Veronica Mwangi, dmVyYXdhbWJ1aUBnbWFpbC5jb20=