 Eduardo Rocha Fukutani1*
 Pablo Ivan Pereira Ramos1
 José Irahe Kasprzykowski1
 Lucas Gentil Azevedo1
 Moreno Magalhães de Souza Rodrigues2
 João Victor de Oliveira Pimenta Lima1
 Helton Fábio Santos de Araújo Junior1
 Kiyoshi Ferreira Fukutani1,3,4
 Artur Trancoso Lopo de Queiroz1
- 1Center of Data and Knowledge Integration for Health (CIDACS), Instituto Gonçalo Moniz, FIOCRUZ, Salvador, Brazil
- 2Laboratório de Análise e Visualização de Dados, FIOCRUZ-RO, Salvador, Brazil
- 3Fundação José Silveira, Multinational Organization Network Sponsoring Translational and Epidemiological Research, FJS, Salvador, Brazil
- 4Faculdade de Medicina, Faculdade de Tecnologia e Ciências, Salvador, Brazil
Human T-lymphotropic virus 1 (HTLV-1) was the first recognized human retrovirus. Infection can lead to two main symptomatologies: adult T-cell lymphoma/leukemia (ATLL) and HTLV-1 associated myelopathy/tropical spastic paraparesis (HAM/TSP). Each manifestation is associated with distinct characteristics, as ATLL presents as a leukemia-like disease, while HAM/TSP presents as severe inflammation in the central nervous system, leading to paraparesis. Previous studies have identified molecules associated with disease development, e.g., the downregulation of Foxp3 in Treg cells was associated with increased risk of HAM/TSP. In addition, elevated levels of CXCL10, CXCL9, and Neopterin in cerebrospinal fluid also present increased risk. However, these molecules were only associated with specific patient groups or viral strains. Furthermore, the majority of studies did not jointly compare all clinical manifestations, and robust analysis entails the inclusion of both ATLL and HAM/TSP. The low numbers of samples also pose difficulties in conducting gene expression analysis to identify specific molecular relationships. To address these limitations and increase the power of manifestation-specific gene associations, meta-analysis was performed using publicly available gene expression data. The application of supervised learning techniques identified alterations in two genes observed to act in tandem as potential biomarkers: GBP2 was associated with HAM/TSP, and CD40LG with ATLL. Together, both molecules demonstrated high sample-classification accuracy (AUC values: 0.88 and 1.0, respectively). Next, other genes with expression correlated to these genes were identified, and we attempted to relate the enriched pathways identified with the characteristic of each clinical manifestation. The present findings contribute to knowledge surrounding viral progression and suggest a potentially powerful new tool for the molecular classification of HTLV-associated diseases.
Introduction
Human T-lymphotropic virus 1 (HTLV-1) belongs to the Retroviridae family and Deltaretrovirus genus, and presents tropism in the infection of T lymphocyte cells (Mirvish et al., 2011). Two diseases are mainly associated with this infection: adult T-cell lymphoma/leukemia (ATLL) and HTLV-associated myelopathy/tropical spastic paraparesis (HAM/TSP) (Gessain and Mahieux, 2012). Around 2–5% of HTLV-infected subjects develop ATLL (Uchiyama et al., 1977) and 0.25–3.8% develop HAM/TSP (Osame et al., 1986), while the majority of HTLV-infected subjects remain asymptomatic (Galvão-Castro et al., 1997). ATLL is a lymphoma-like disease classified into four subtypes: acute, chronic, smoldering, and lymphoma (Shimoyama and members of The Lymphoma Study Group (1984–87)*, 1991). Developing this symptomatology results in a life expectancy less than 1 year in around 65% of affected individuals (Matutes, 2007), in addition to low documented chemotherapeutic response (Yamada et al., 2001). HAM/TSP is characterized as an inflammatory disease of the central nervous system (CNS), can progressively evolve to spastic paraparesis, and results in sensory disturbance in the lower extremities and bladder/bowel dysfunction (Nakagawa et al., 1995).
Currently, ATLL can be diagnosed by integrating cytology and lymphocyte immunophenotyping with HTLV-1 serology (Matutes, 2007). The diagnosis of HAM/TSP is based on clinical evaluation and the exclusion of other disorders and molecular and serological diagnosis, including HTLV-1 serology, Western blotting, and PCR analysis (Yamano and Sato, 2012). In this complex scenario, the identification of biomarkers of this disease is crucial for improving patient care and treatment. With the goal of furthering the understanding surrounding the mechanisms related to disease manifestation, some studies employing gene expression have been conducted. For instance, the downregulation of the FOXP3 gene in T-reg cells was reported to be induced by the HBZ viral protein from HTLV-1. Accordingly, the stimulated proinflammatory response was found to be associated with HAM/TSP development (Yamamoto-Taguchi et al., 2013). Furthermore, other molecules in cerebrospinal fluid, such as CXCL10, CXCL9, and neopterin, have been proposed as promising candidates for prognostic biomarkers of HAM/TSP, offering improved predictive values in comparison to proviral load (Sato et al., 2013).
On the other hand, CAN2 and SPTA2 proteins have been proposed as biomarkers capable of classifying ATLL patients. CAN2 activity was found to induce ATLL cell death and the corresponding gene was downregulated in these cells. In addition, 17 proteins were proposed as capable of classifying healthy controls from asymptomatic carriers (ACs), HAM/TSP, and ATLL patients (Ishihara et al., 2013). Several alterations in anti-inflammatory cytokine levels in infected T cells, e.g., increased IL-10 and suppressed pro-inflammatory cytokines, were also associated with this disease (Kagdi et al., 2018). Another study suggested diagnosing patients by measuring antibody responses to HTLV-1 gag, Env, and Tax proteins (Enose-Akahata et al., 2012); however, this is akin to an immunological diagnosis. Despite the identification of biomarker candidates, various limitations have prevented adoption, as some markers were only identified in specific populations (Yasuma et al., 2016), small sample sizes were used (Ishihara et al., 2013), and the identification was performed only in specific clinical manifestations without appropriate confirmation for use as a general biomarker (Sato et al., 2013; Yamamoto-Taguchi et al., 2013).
To mitigate the impact of low sample sizes, which have limited the interpretation of individual studies, meta-analysis approaches have been employed in the field of gene/marker identification. This approach was used to highlight important genes and molecular pathways in endometrioid endometrial cancer (O’Mara et al., 2016), for the identification of programmed death-ligand 1 as a potential biomarker in glioblastoma (Xue et al., 2017), to identify a set of candidate genes, pathways, and transcription factors not previously associated with the pathogenesis of sickle cell disease (Hounkpe et al., 2015), and to disclose a novel set of candidate genetic markers, pathways, and transcription factors common to both thrombosis and myeloproliferative disorders (Jha et al., 2016). Meta-analysis, in combination with classical approaches and machine learning, has also been applied to identify biomarkers of viral infection in the Aedes aegypti mosquito (Fukutani et al., 2017). This methodology has proven powerful in discriminatory classification using gene expression data and was recently highlighted as a potentially useful method for discovering new evidences (Debray et al., 2017); Sweeney et al., 2017). Given the need to identify biomarkers associated with HTLV-1 infection, and considering the abundance of individual studies that resulted in the generation of gene expression datasets, we performed meta-analysis in an attempt to identify candidate transcriptional biomarkers that could offer improved predictive power in the classification of clinical manifestations in HTLV-1, a novelty in this field that has never been done before.
Methodology
Description of Datasets Comprising the Discovery Dataset
To identify published datasets relevant to HTLV infection, the Gene Expression Omnibus (GEO) database (https://www.ncbi.nlm.nih.gov/geo/) was searched filtering Homo sapiens as the organism of interest and “HTLV” as the keyword. This query returned a total of 41 datasets (search performed in September 2017). After manual evaluation, 32 datasets were excluded due to methodological incompatibility (non-blood cell tissues and absence of symptomatologic information). Of the remaining datasets, three with detailed gene expression by peripheral blood mononuclear cells (PBMCs) were selected to build the Discovery dataset: GSE55851 (Kobayashi et al., 2014), GSE29312, and GSE29332 (Tattermusch et al., 2012). All of the studies that produced these datasets were performed in PBMCs and included at least two different clinical forms of infection, as well as controls (healthy individuals). When combined, the three datasets included 20 controls, 43 AC, 12 ATLL, and 20 HAM/TSP samples (Table 1). For our analysis, the AC samples were discarded to avoid possible classification bias, since this form can evolve to another clinical manifestation at some point during the patient’s life, and no information regarding disease progression was provided. The remaining six datasets performed in other tissue types were used for in silico validation.
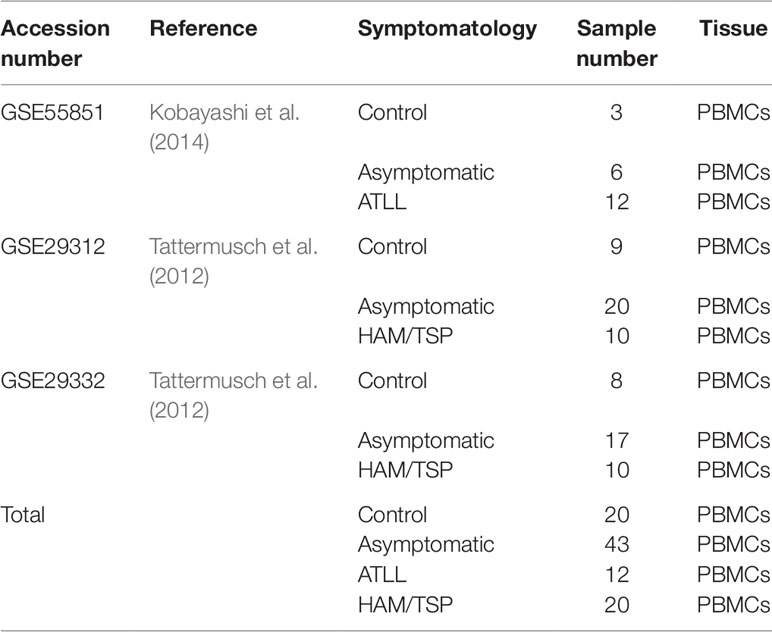
Table 1 Description of the datasets used as the Discovery set.
Data Retrieval, Pre-Processing, and Batch Correction
Raw expression data were downloaded from GEO/NCBI using the GEOquery package (Davis and Meltzer, 2007). Next, the collapseRows R function in the WGCNA package (Miller et al., 2011) was used to collapse the data, and only probes mapping to genes common to all datasets were maintained. Log transformation was applied to the expression data using the preProcessCore package (Bolstad, 2018), and outlier samples were identified and removed by the ArrayQualityMetrics package for R (Kauffmann et al., 2008). The plyr package was subsequently used to merge all data (Wickham, 2011). Following pre-processing, the combined dataset was submitted to a batch correction procedure using an empirical Bayes framework implemented in the ComBat function of the sva package (Leek et al., 2013), with clinical manifestations and original datasets as covariates. This allowed us to account for known or unknown sources of variation in the datasets, enabling the use of samples from different datasets in the integrated dataset (i.e., Discovery dataset). This method allowed for the inclusion of the maximum number of samples for analysis, in addition to more robust data interpretation, leading to the identification of consistent insights regarding biological phenomena. ComBat has been used in other studies and was shown to outperform other similar tools designed for this purpose (Chen et al., 2011). The final dataset consisted of 94 samples, with expression data pertaining to 10,533 genes in total.
Classification of HTLV Patient Clinical Manifestation via Decision Tree
A decision tree classification procedure was performed in the Discovery dataset to identify the key genes related to HTLV patient clinical manifestation (ATLL or HAM/TSP). Decision trees were constructed using the rpart package Therneau et al. (2015), which screens for the key factors that allow for the separation of the groups with maximum accuracy. To measure the performance of the classification model, areas under receiver operating characteristic (ROC) curves were calculated to determine a given model’s sensitivity and specificity. The overall accuracy of a model is calculated by estimating the area under the curve (AUC), permitting measurements of the degree of class separability in a given model. Values approximating 1.0 indicate that the model is suitably capable of distinguishing among different classes. Finally, scatterplots were generated to visualize the dispersion of samples according to the model threshold in order to verify the accuracy estimated by ROC curve analysis.
Co-Expression and Enrichment Analysis of Genes Related to CD40LG and GBP2
A correlation matrix between the genes CD40LG and GBP2 (identified as best classifiers) and all the genes within the Discovery dataset was constructed. Correlation was calculated separately for each group (control, ATLL, and HAM/TSP) using gene expression values measured as biweight midcorrelation coefficients, which function similarly to Pearson’s r, except this technique is more robust with regard to data outliers (Langfelder and Horvath, 2012). Correlations were considered significant using a threshold of |r| ≥0.7 and p-value ≤0.05. Next, correlated genes were clustered according to the functional terms of the REACTOME pathway database (https://reactome.org/). This enrichment analysis was performed using clusterProfilerYu et al. (2012) with the following parameters: p-value threshold = 0.05, Q-value threshold = 0.05, minimum number of genes to cluster = 20, maximum number of genes to cluster = 500.
Description of Datasets Used for Validation
Six microarray expression datasets were retrieved from GEO: GSE17718 (Kress et al., 2010), GSE6034 (Hamamura et al., 2007), GSE38537 (Pinto et al., 2014), GSE33615 (Fujikawa et al., 2016), GSE57259 (Araya et al., 2014), and GSE19080 (no citation available at GEO/NCBI). To confirm the gene signature performance, we performed the gene model comparison in the validation dataset independently, without using the thresholds yielded by the decision tree model estimated during the discovery phase. The model comparison in each different dataset was obtained by applying a logistic regression fitting, which estimated the variable accuracy (CD40LG and GBP2), according to the response variable [determined by dataset metadata (HTLV status)]. Then, the ROC curve and the AUC were measured, which allows the comparison of the gene signature classification power across the validation datasets. A full description of the selected datasets is available in Table S1.
Results
Gene Expression of CD40LG and GBP2 Permits Accurate Discrimination of ATLL and HAM/TSP Patients
The decision tree algorithm identified two genes, CD40LG and GBP2, as the most informative in differentiating between the clinical manifestations of HTLV-infected samples and controls. The expression of CD40LG allowed for the discrimination of individuals with ATLL with 100% accuracy. To correctly classify the remaining samples (HAM/TSP and controls), a second gene (GBP2) was required. Expression levels of GBP2 were able to discriminate HAM/TSP samples with 84.2% classification accuracy, and controls with 100% accuracy, with a 15.8% misclassification rate occurring between HAM/TSP and controls (Figure 1A). In addition, sample dispersion was visually checked by scatterplot using the log expression cutoffs returned by the decision tree algorithm: 6.30 for CD40LG and 12.05 for GBP2 (Figure 1B). Finally, sensitivity and specificity were measured using ROC curve analysis, revealing high accuracy in discriminating among samples using genes CD40LG and GBP2: AUC of 0.90 for controls, 0.88 for HAM/TSP, and 1.00 for ATLL (Figure 1C).
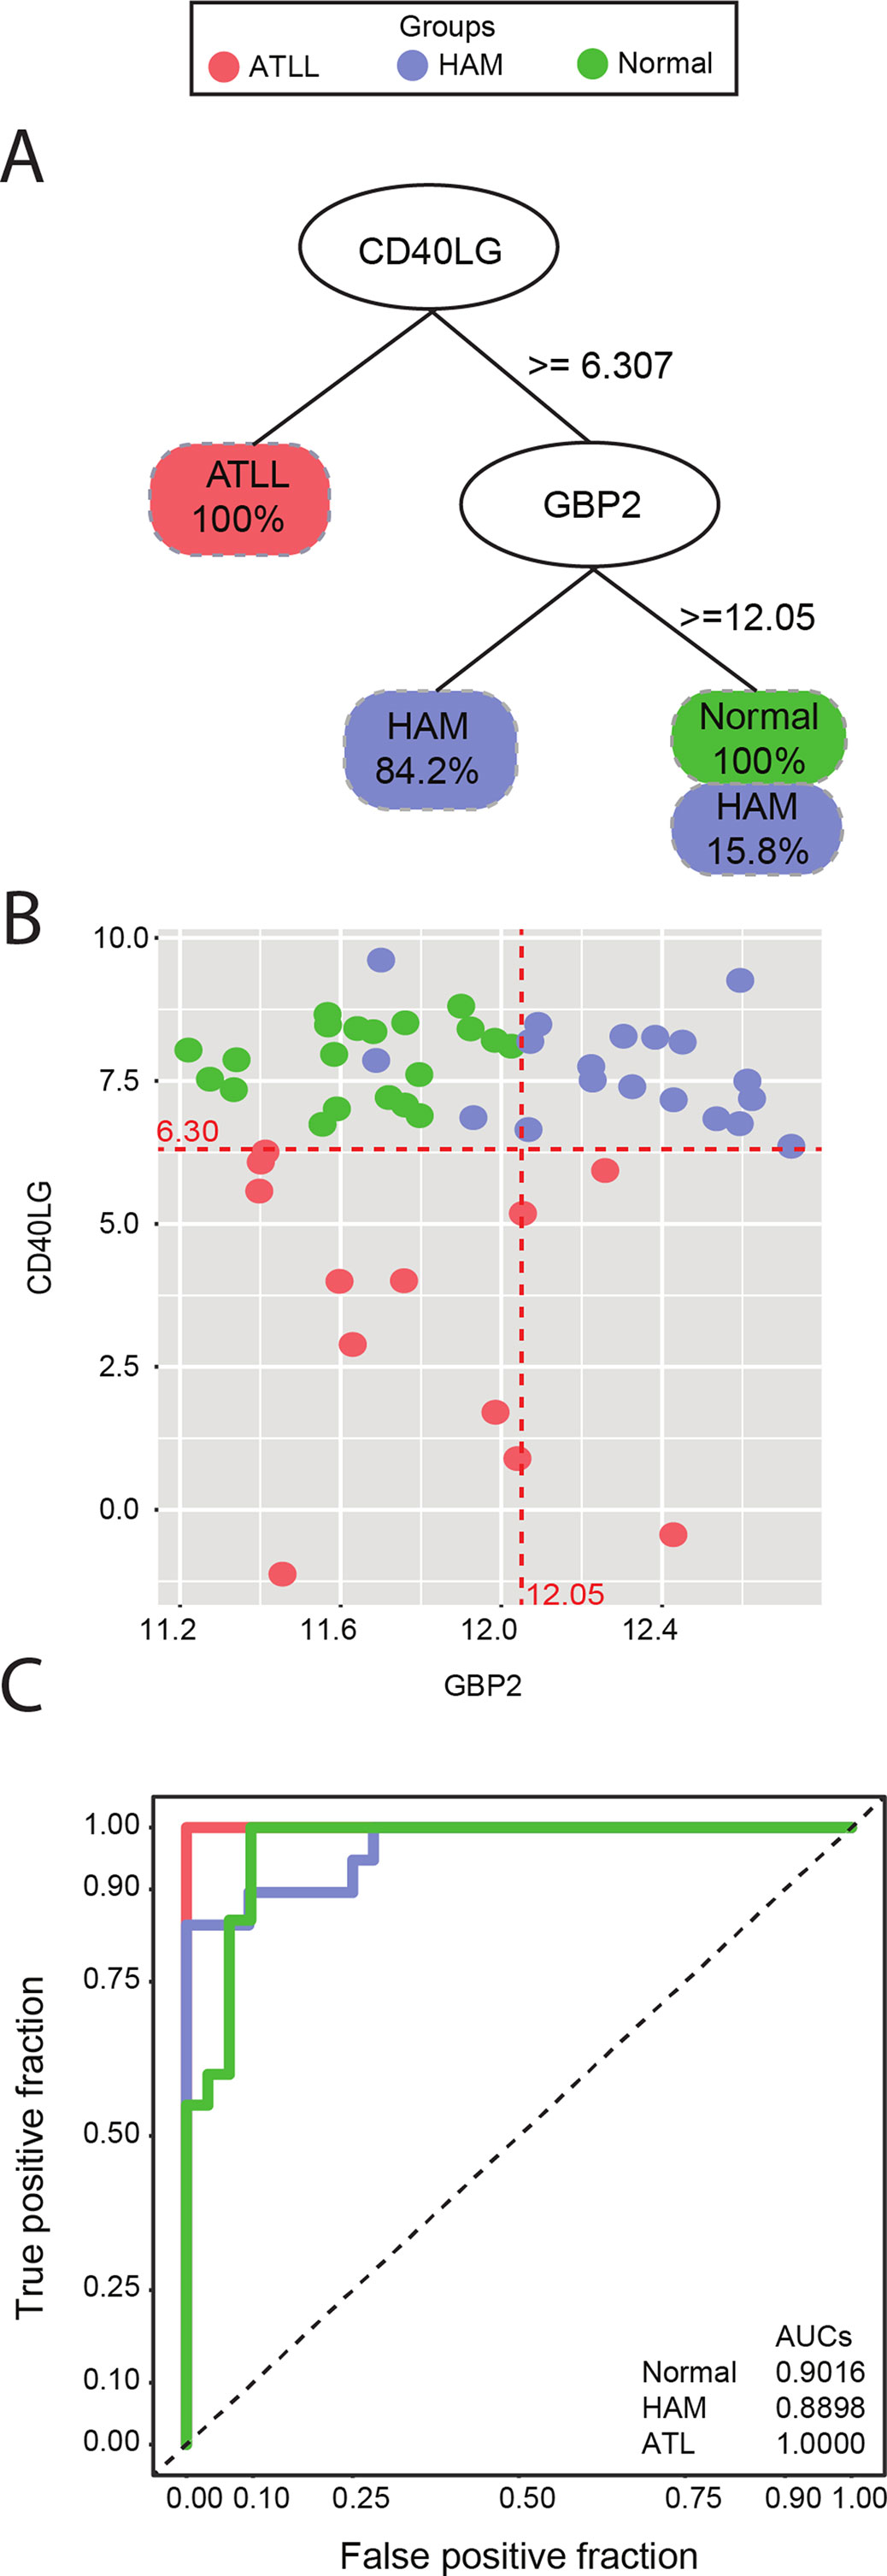
Figure 1 (A) Decision tree classification of three different symptomatologies using CD40LG to separate all ATLL samples from the others, and GBP2 to separate 84.2% of the HAM/TSP samples from controls. (B) Scatterplot of CD40LG (Y axis) and GBP2 (X axis) gene expression detailing the dispersion of the analyzed samples. Red lines represent the thresholds suggested by decision tree analysis. (C) ROC curve representing accuracy. An AUC of 0.9016 was found for the control group, 0.8898 for the HAM/TSP group, and 1.000 for ATLL. The red line represents the ATLL group, blue indicates HAM/TSP, and green is indicative of controls.
Gene Expression of CD40LG and GBP2 Correlate With Various Immune and Metabolic Pathways That Could Impact the Course of HTLV Infection
After evaluating the high predictive power of CD40LG and GBP2 in discriminating HTLV clinical status, the roles played by these genes were investigated. Correlation analysis was performed considering global expression for each clinical manifestation (HAM/TSP or ATLL) and controls. Our results showed that 208 genes were significantly positively (r > 0.7 and p-value < 0.05) and 13 genes were significantly negatively (r > 0.7 and p-value < 0.05) correlated with CD40LG. Also, 84 genes were significantly positively and 1 gene was significantly negatively correlated with GBP2. In contrast, in the ATLL samples, 399 genes were significantly negatively correlated with CD40LG and 743 genes were significantly positively correlated with GBP2. A total of 12 genes were found to be correlated with both CD40LG and GBP2 (OAZ1, SLC39A11, NADK, TMED2, SLC38A5, P4HA1, HM13, MGAT2, HIST1H2BG, UQCRFS1, PTDSS1, and TAP1B) (Figure S1A). In addition, the HAM/TSP samples presented 394 positive and 420 negative correlations, with three being associated with both CD40LG and GBP2 (PWP1, H3F3A, and GNE). In these samples, correlations with CD40LG were mostly positive, with 367 positive correlations, while those with GBP2 were mostly negative, with 230 negative correlations (Figure S1B). More comprehensive information regarding this correlation analysis and the commonly observed genes is available as supplementary material (Tables S2–S4). The gene set previously identified correlated with the biomarkers (CD40LG and GBP2) was analyzed in order to identify their enriched pathways. Thus, the top four pathways identified from being negatively correlated with the CD40LG gene set in the HAM/TSP were “Neutrophil degranulation,” “Signaling by interleukins,” “TRAF6-mediated induction of NFkB and MAP kinases upon TLR7/8 or 9 activation,” and “Toll Like Receptor 7/8 (TLR7/8) Cascade.” The main pathways identified from the gene set that negatively correlated with GBP2 in the HAM/TSP were “SUMO E3 ligases SUMOylate target proteins,” “SUMOylation,” “rRNA processing,” and “tRNA processing” (Figure 2B). Only one pathway was identified from the gene set that positively correlated with CD40LG in HAM/TSP: “SUMOylation of DNA replication proteins.” Several pathways were identified from the genes that were positively correlated with GBP2 in HAM/TSP: “Interferon Signaling,” “Interferon alpha/beta signaling,” “Activation of G protein gated Potassium channels,” “G protein gated Potassium channels,” and “Interleukin-20 family signaling” (Figure 2A).
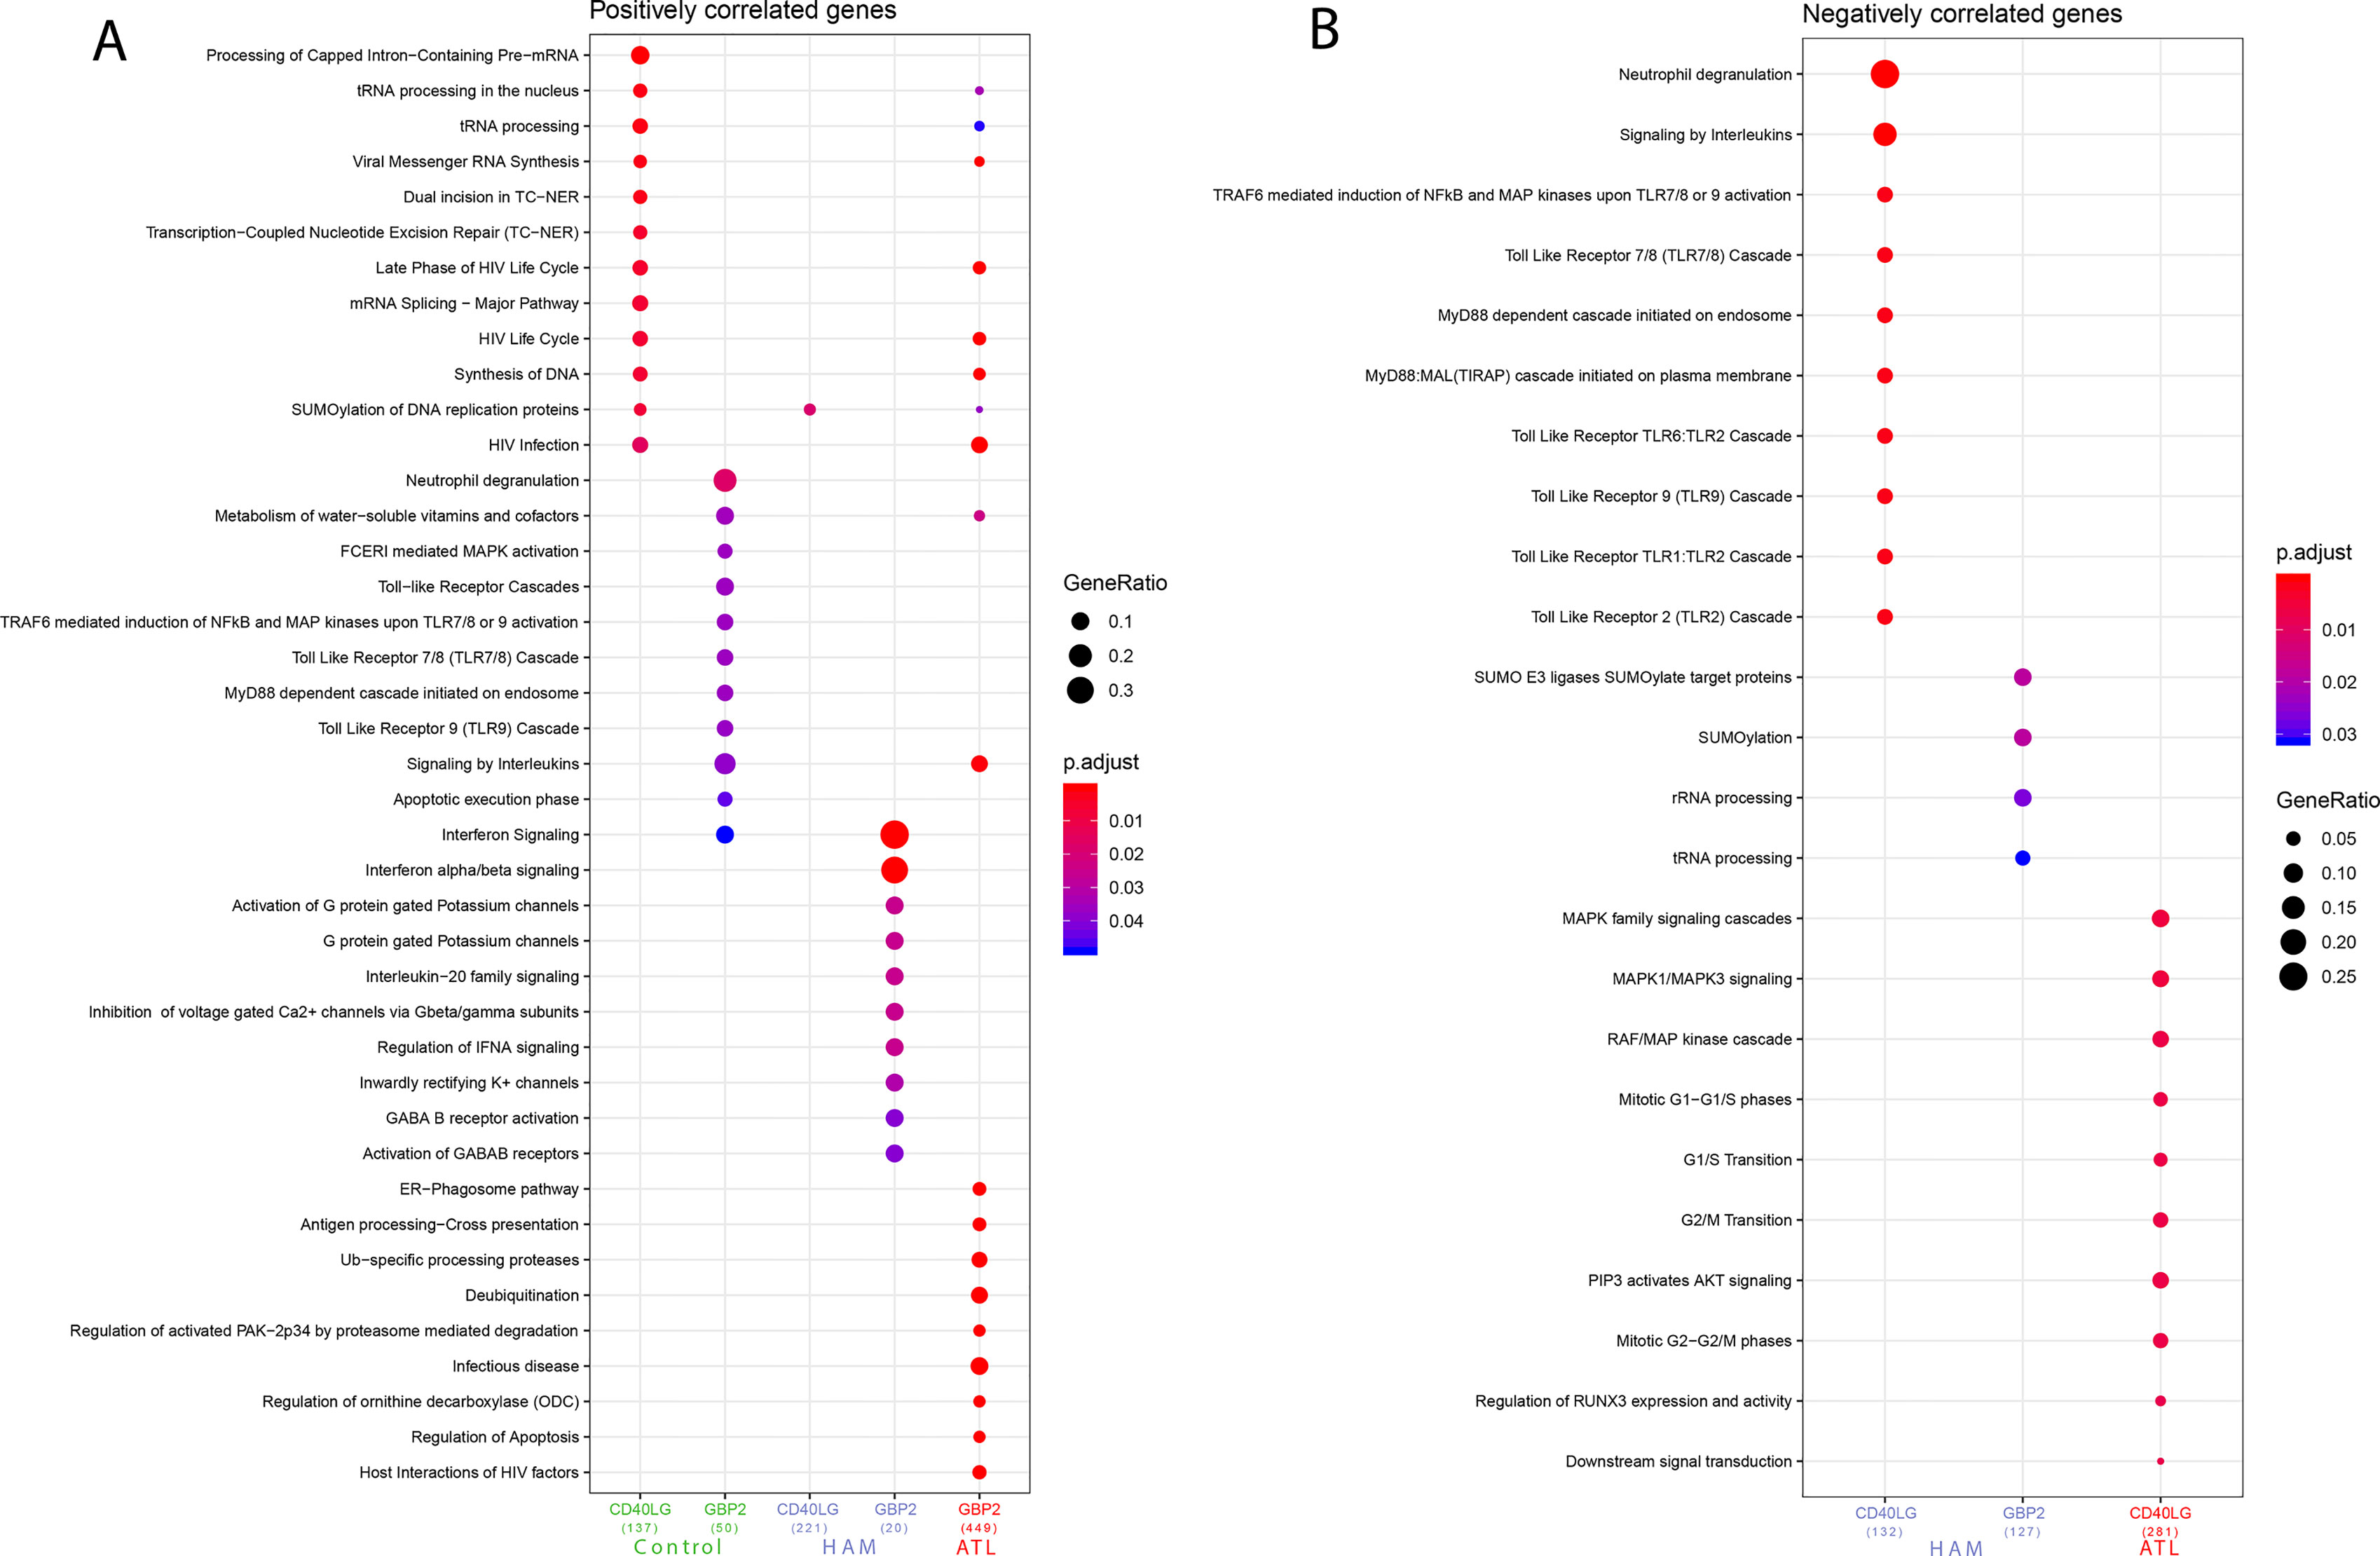
Figure 2 (A) Pathways associated with genes found to be positively correlated with CD40LG and GBP2, grouped according to symptomatology. (B) Pathways associated with genes found to be negatively correlated with CD40LG and GBP2, grouped according to symptomatology. Analysis performed using the following parameters: p-value = 0.05, q-value = 0.2, minimum number of genes to cluster = 20, maximum number of genes to cluster = 500.
The top 5 pathways identified from the gene set that negatively correlated with CD40LG in the ATLL were “MAPK family signaling cascades,” “MAPK1/MAPK3 signaling,” “RAF/MAP kinase cascade,” “Mitotic G1−G1/S phases,” and “G1/S Transition” (Figure 2B). Moreover, the associated pathways from the gene set that positively correlated with GBP2 in ATLL patients were “tRNA processing in the nucleus,” “tRNA processing,” “Viral Messenger RNA synthesis,” “Late Phase of HIV Life Cycle,” and “HIV Life Cycle” (Figure 2A).
By contrast, in the control group, the pathways identified from the gene set that correlated with CD40LG were “Processing of Capped Intron-Containing Pre-mRNA,” “tRNA processing in the nucleus,” “tRNA processing,” “Viral Messenger RNA Synthesis,” “Dual incision in TC-NER,” “Transcription-Coupled Nucleotide Excision Repair (TC-NER),” “Late Phase of HIV Life Cycle,” “mRNA Splicing—Major Pathway,” “HIV Life Cycle,” “Synthesis of DNA,” “SUMOylation of DNA replication proteins,” and “HIV infection.” With regard to GBP2’s positively correlated genes, the following pathways were found in the control group: “Neutrophil degranulation,” “Metabolism of water-soluble vitamins and cofactors,” “FCERI mediated MAPK activation,” “Toll-Like Receptors Cascades,” “TRAF6 mediated induction of NFkB and MAP kinases upon TLR7/8 or 9 activation,” “Toll Like Receptor 7/8 (TLR7/8) Cascade,” “MyD88 dependent cascade initiated on endosome,” “Toll Like Receptor 9 (TLR9) Cascade,” “Signaling by Interleukins,” “Apoptotic execution phase,” and “Interferon signaling” (Figure 2A). Further information regarding the pathways associated with these genes (ENTREZ ID) is available as supplementary material, separated into negatively correlated (Table S5) and positively correlated categories (Table S6).
Validation of CD40LG and GBP2 in Independent Datasets Reveals Classification Robustness in Different Tissue Types
To validate the accuracy of our two-gene model in the discrimination of ATLL, HAM/TSP, and control samples, this model was applied to the other datasets not used in the discovery set: (Kress et al., 2010) (GSE17718), (Hamamura et al., 2007) (GSE6034), (Pinto et al., 2014) (GSE38537), (Yamagishi et al., 2012) (GSE33615), (Olière et al., 2010) (GSE57259), and GSE19080. After downloading and pre-processing these datasets, ROC curve analysis was applied to measure the discriminant power of CD40LG and GBP2 in classifying HLTV-1 clinical manifestations. The discriminant power of this two-gene signature was found to be very high, allowing for the discrimination of the HTLV-1 clinical status in five of the datasets with an AUC value of 1 (GSE17718, GSE6034, GSE38537, GSE33615, and GSE57259). The need to include both genes for accurate classification was evidenced in the GSE19080 dataset (in which the CD40LG gene is absent), yielding a much lower AUC (0.875) in the discrimination of control samples, compared to 0.666 for HAM/TSP samples and 0.5 when discriminating ATLL samples. These validation datasets were derived from a variety of tissues, such as cell lines (StEd, MT-2, Tay and MT-4), CD4 lymphocytes, and PBMCs. The overall accuracy of this two-gene signature model is delineated in Table 2. Also, the sample distribution using the two-gene expression in all validation dataset is summarized in Figure S2.
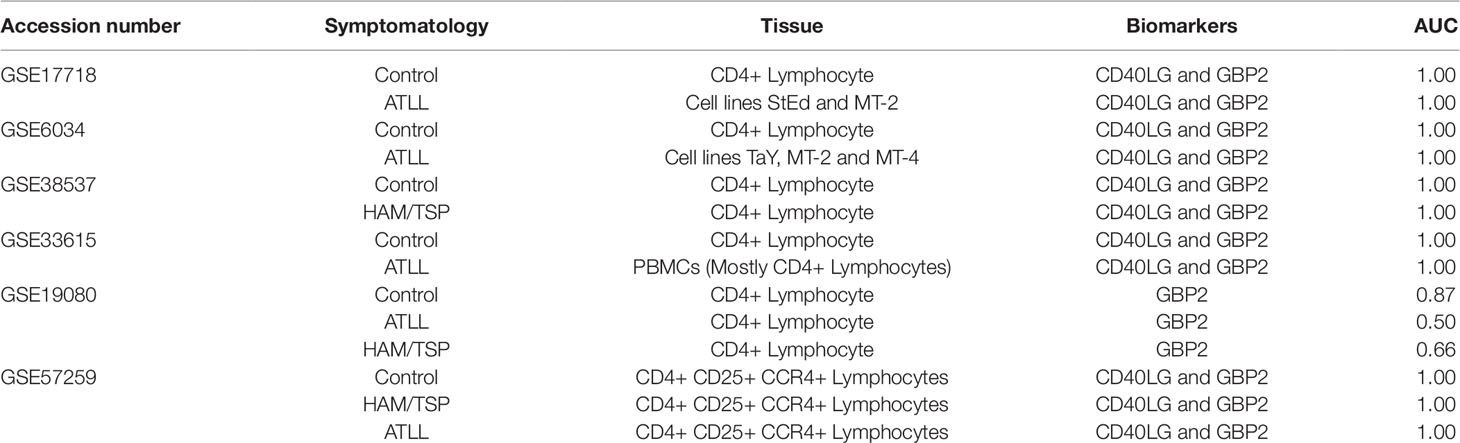
Table 2 Performance of the two-gene signature classifying the samples from validation datasets.
Discussion
To date, few studies have attempted to identify biomarkers capable of discriminating between ATLL and HAM/TSP in HTLV-1 infection. A previous report (Sato et al., 2013) suggested three potential prognostic biomarkers in cerebrospinal fluid for HAM/TSP disease progression: CXCL10, CXCL9, and neopterin. Another study (Baratella et al., 2017) stated that the HBZ protein, exclusively localized in the cytoplasm, could be a biomarker of HAM/TSP. In addition, CAN-2 and SPTA-2 were identified as biomarkers capable of discriminating ATLL (Ishihara et al., 2013). However, these biomarkers were found in a specific population and, to the best of our knowledge, the literature contains no sets of biomarkers offering sufficient accuracy to reliably identify both the ATLL and HAM/TSP phenotypes. With the objective of achieving accurate discrimination, we employed a robust bioinformatic approach to consolidate the available expression data using three different datasets combined into a single Discovery dataset. Three studies were selected for this analysis, one submitted by Kobayashi et al. (acc number: GSE55851) and two submitted by Tattermusch et al. (acc number: GSE29332 and GSE29312). The study by Kobayashi et al. compares gene expression levels in PBMCs from ATLL, asymptomatic, and control patients. The other studies submitted by Tattermusch et al. compared gene expression levels in PBMCs from HAM/TSP, asymptomatic, and control individuals. Next, a data mining technique was applied to the merged, batch-corrected Discovery dataset to identify which variables (genes) could effectively discriminate clinical status among the samples. Decision tree analysis revealed genes CD40LG and GBP2 as discriminators of ATLL and HAM/TSP, offering accuracy rates of 100% and 84.2%, respectively. A previous report identified lower CD40LG expression in cells expressing PTHrP and MIP-1α, two proteins associated with ATLL progression (Shu et al., 2012). The second marker identified herein, GBP2, was previously associated with tax protein activity in HTLV-1 (Arainga et al., 2012). Despite identifying these associations, no previous studies proposed either of these genes as biomarkers of ATLL or HAM/TSP symptomatology.
The CD40LG gene encodes a protein located on the surface of T cells and exerts the role of regulating B cell functions (Stelzer et al., 2016). GBP2 is a guanylate binding protein induced by IFN-γ and is considered as a control factor for tumor cell proliferation and spreading (Messmer-Blust et al., 2010). Our functional approach entailed the correlation of these biomarkers with the global expression of other genes, followed by enrichment analysis using the REACTOME database (Fabregat et al., 2018). This analysis showed that the genes positively correlated with CD40LG are associated with pathways mainly related to tRNA processing, viral replication, and mRNA splicing in the control group. However, in the HAM/TSP group, these genes were only found to be associated with the SUMOylation of DNA replication pathway, which is specifically associated with transcription and replication pathways. In addition, the genes negatively correlated with CD40LG were found to be associated primarily with neutrophil degranulation, signaling for interleukins and several cascades of Toll Like Receptors in HAM/TSP patients. These pathways may be associated with immune responses involving inflammation (Faurschou and Borregaard, 2003; Lacagnina et al., 2018; Weitzman, 2003), which is frequently observed in HAM/TSP patients (Nakagawa et al., 1995).
On the other hand, the genes negatively correlated with CD40LG were found to be associated with MAPK cascade-associated pathways and cell cycle-related pathways. MAPK cascade-related pathways are associated with a wide spectrum of metabolic pathways related to cell proliferation, differentiation, and apoptosis (Shaul and Seger, 2007). Cell cycle-related pathways, such as Mitotic G1-G1/S phases, G1/S Transition, G2/M Transition, and Mitotic G2-G2/M phases, are related to cell proliferation (Matson and Cook, 2017). These pathways are all related to cell proliferation, which is consistent with ATLL symptomatology and the uncontrolled proliferation of T cells (Shimoyama and members of The Lymphoma Study Group (1984–87)*, 1991).
The top pathways that positively correlated with GBP2 were mainly related to HIV infection, tRNA, and viral mRNA processing and synthesis, signaling by interleukins, and apoptosis regulation. The pathways observed to be related to HIV infection may be due to similarities between HTLV-1 and HIV, as both these retroviruses mainly infect T CD4+ lymphocytes. The tRNA and viral mRNA pathways are associated with the highly active processing of RNAs that occurs in ATLL cells. Furthermore, the regulation of apoptosis could be associated with the immortalization of T CD4+ cells that characterizes the leukemic aspect of ATLL (Bellon et al., 2010).
In order to evaluate the predictive power of the CD40LG/GBP2 two-gene signature in the accurate classification of HAM/TSP and ATLL samples, we conducted a validation step using independent datasets, which revealed excellent predictive values. The majority of datasets returned an AUC of 1.0, corresponding to an accuracy rate of 100% when classifying samples as ATLL, HAM/TSP, or controls. In one of six validation datasets (GSE19080), a poorer classification accuracy was found, which is likely due to the absence of the CD40LG in the array, indicating the requirement of both genes in order to maintain reliably consistent classification. Additionally, the selected validation datasets sampled not only PBMCs but also several transformed cell lines, including MT-2, MT-4, StEd, and TaY, as well as isolated CD4+ cells. These high rates of accuracy seen in a diverse range of tissue types serve to confirm the robustness of the two-gene signature identified herein, suggesting a conserved mechanism in the regulation of genes associated with each symptomatology. Despite some limitations such as the absence of available datasets studying HTLV-1 biomarkers in a transcriptional approach and the reduced sample numbers, our findings provide useful biomarkers to independently identify populations affected by HTLV-1.
Conclusion
Our meta-analysis of gene expression datasets in HTLV-1-infected patients with specific disease manifestations identified a two-gene signature (CD40LG/GBP2) allowing for excellent classification of the HAM/TSP and ATLL phenotypes. This signature was subsequently validated in six independent datasets. An exploratory functional enrichment analysis of the genes found to be positively and negatively correlated with this signature revealed diverse activation and repression of pathways relevant to this viral disease. Our findings add to the accumulation of knowledge surrounding HTLV-1 infection and may contribute to early diagnosis, as well as the treatment of related symptomatologies.
Data Availability Statement
Publicly available datasets were analyzed in this study. This data can be found here: GSE55851, GSE29312,GSE29332,GSE17718,GSE6034,GSE38537,GSE33615,GSE57259,GSE19080.
Author Contributions
EF, AQ, KF, MR and PR participated in the data analysis. EF, AQ, KF and PR participated in the manuscript writing. JK, LA, JL and HJ participated in the idea generation for this work.
Funding
AQ acknowledges financial support from the program Inova Fiocruz (Project number VPPIS-001-FIO18).
Conflict of Interest
The authors declare that the research was conducted in the absence of any commercial or financial relationships that could be construed as a potential conflict of interest.
Acknowledgments
We thank Mr. Olival Rocha for his assistance. The authors would also like to thank Andris K. Walter for English language revision and manuscript copyediting assistance.
Abbreviations
ATLL, Adult T-Cell Lymphoma/Leukemia; HAM/TSP, HTLV-associated myelopathy/tropical spastic paraparesis; AC, Asymptomatic Carriers.
Supplementary Material
The Supplementary Material for this article can be found online at: https://www.frontiersin.org/articles/10.3389/fgene.2019.01056/full#supplementary-material
Table S1 | Datasets used on the validation step's detailed information
Table S2 | Correlations observed between CD40LG and GBP2 in the HAM/TSP group.
Table S3 | Correlations observed between CD40LG and GBP2 in the ATLL group.
Table S4 | Correlations observed between CD40LG and GBP2 in the control group.
Table S5 | Detailed information regarding the negatively correlated pathways and associated genes (ENTREZ ID).
Table S6 | Detailed information regarding the positively correlated pathways and associated genes (ENTREZ ID).
Figure S1 | Correlation network based on gene expression values in ATLL samples. Highlighted genes were found to correlate with both CD40LG and GBP2. B - Correlation network based on the gene expression values in the HAM/TSP group. Highlighted genes were found to correlate with both CD40LG and GBP2. C - Correlation network based on the gene expression values in the control group.
Figure S2 | Scatterplot of validation datasets sample distribution using the CD40LG and GBP2's log transformed expression values. The samples can be separated by symptomatology [ATLL (green), HAM/TSP (red) and control (blue)], this separation is shown by the collored ellipses. The GSE19080's scatterplot has only GBP2 within the dataset, the values of X and Y axis are both representing GBP2's log transformed expression value.
References
Arainga, M., Murakami, H., Aida, Y. (2012). Visualizing spatiotemporal dynamics of apoptosis after G1 arrest by human T cell leukemia virus type 1 Tax and insights into gene expression changes using microarray-based gene expression analysis. BMC Genomics 13, 275. doi: 10.1186/1471-2164-13-275
Araya, N., Sato, T., Ando, H., Tomaru, U., Yoshida, M., Coler-Reilly, A., et al. (2014). HTLV-1 induces a Th1-like state in CD4+CCR4+ T cells. J. Clin. Invest. 124, 3431–3442. doi: 10.1172/JCI75250
Baratella, M., Forlani, G., Raval, G. U., Tedeschi, A., Gout, O., Gessain, A., et al. (2017). Cytoplasmic localization of HTLV-1 HBZ protein: a biomarker of HTLV-1-Associated myelopathy/tropical spastic paraparesis (HAM/TSP). PLoS Negl. Trop. Dis. 11, e0005285. doi: 10.1371/journal.pntd.0005285
Bellon, M., Baydoun, H. H., Yao, Y., Nicot, C. (2010). HTLV-I Tax-dependent and -independent events associated with immortalization of human primary T lymphocytes. Blood 115, 2441–2448. doi: 10.1182/blood-2009-08-241117
Bolstad, B. (2018). preprocessCore: A collection of pre-processing functions. Rpackage. 1.44.0. Available at: https://github.com/bmbolstad/preprocessCore.
Chen, C., Grennan, K., Badner, J., Zhang, D., Gershon, E., Jin, L., et al. (2011). Removing batch effects in analysis of expression microarray data: an evaluation of six batch adjustment methods. PLoS One 6, e17238. doi: 10.1371/journal.pone.0017238
Davis, S., Meltzer, P. S. (2007). GEOquery: a bridge between the Gene Expression Omnibus (GEO) and BioConductor. Bioinformatics 23, 1846–1847. doi: 10.1093/bioinformatics/btm254
Debray, T. P. A., Damen, J. A. A. G., Snell, K. I. E., Ensor, J., Hooft, L., Reitsma, J. B., et al. (2017). A guide to systematic review and meta-analysis of prediction model performance. BMJ 356, i6460. doi: 10.1136/bmj.i6460
Enose-Akahata, Y., Abrams, A., Johnson, K. R., Maloney, E. M., Jacobson, S. (2012). Quantitative differences in HTLV-I antibody responses: classification and relative risk assessment for asymptomatic carriers and ATL and HAM/TSP patients from Jamaica. Blood 119, 2829–2836. doi: 10.1182/blood-2011-11-390807
Fabregat, A., Jupe, S., Matthews, L., Sidiropoulos, K., Gillespie, M., Garapati, P., et al. (2018). The reactome pathway knowledgebase. Nucleic Acids Res. 46, D649–D655. doi: 10.1093/nar/gkx1132
Faurschou, M., Borregaard, N. (2003). Neutrophil granules and secretory vesicles in inflammation. Microbes Infect. 5, 1317–1327. doi: 10.1016/j.micinf.2003.09.008
Fujikawa, D., Nakagawa, S., Hori, M., Kurokawa, N., Soejima, A., Nakano, K., et al. (2016). Polycomb-dependent epigenetic landscape in adult T-cell leukemia. Blood 127, 1790–1802. doi: 10.1182/blood-2015-08-662593
Fukutani, K. F., Kasprzykowski, J. I., Paschoal, A. R., Gomes, M., de, S., Barral, A., et al. (2017). Meta-analysis of expression datasets: comparing virus infection and blood-fed transcriptomes to identify markers of virus presence. Front. Bioeng. Biotechnol. 5, 84. doi: 10.3389/fbioe.2017.00084
Galvão-Castro, B., Loures, L., Rodriques, L. G., Sereno, A., Ferreira Júnior, O. C., Franco, L. G., et al. (1997). Distribution of human T-lymphotropic virus type I among blood donors: a nationwide Brazilian study. Transfusion 37, 242–243. doi: 10.1046/j.1537-2995.1997.37297203532.x
Gessain, A., Mahieux, R. (2012). Tropical spastic paraparesis and HTLV-1 associated myelopathy: clinical, epidemiological, virological and therapeutic aspects. Rev. Neurol. 168, 257–269. doi: 10.1016/j.neurol.2011.12.006
GSE19080, Hernandez, E., Oliere, S. (2010). Gene expression profiling in patients infected with HTLV-1: Identification of ATL and HAM/TSP-specific genetic profiles. Gene Expression Omnibus. GSE19080.
Hamamura, R. S., Ohyashiki, J. H., Kurashina, R., Kobayashi, C., Zhang, Y., Takaku, T., et al. (2007). Induction of heme oxygenase-1 by cobalt protoporphyrin enhances the antitumour effect of bortezomib in adult T-cell leukaemia cells. Br. J. Cancer 97, 1099–1105. doi: 10.1038/sj.bjc.6604003
Hounkpe, B. W., Fiusa, M. M. L., Colella, M. P., da Costa, L. N. G., Benatti, R., de, O.. (2015). Role of innate immunity-triggered pathways in the pathogenesis of Sickle Cell Disease: a meta-analysis of gene expression studies. Sci. Rep. 5, 17822. doi: 10.1038/srep17822
Ishihara, M., Araya, N., Sato, T., Tatsuguchi, A., Saichi, N., Utsunomiya, A., et al. (2013). Preapoptotic protease calpain-2 is frequently suppressed in adult T-cell leukemia. Blood 121, 4340–4347. doi: 10.1182/blood-2012-08-446922
Jha, P. K., Vijay, A., Sahu, A., Ashraf, M. Z. (2016). Comprehensive Gene expression meta-analysis and integrated bioinformatic approaches reveal shared signatures between thrombosis and myeloproliferative disorders. Sci. Rep. 6, 37099. doi: 10.1038/srep37099
Kagdi, H., Demontis, M. A., Ramos, J. C., Taylor, G. P. (2018). Switching and loss of cellular cytokine producing capacity characterize in vivo viral infection and malignant transformation in human T- lymphotropic virus type 1 infection. PLoS Pathog. 14, e1006861. doi: 10.1371/journal.ppat.1006861
Kauffmann, A., Gentleman, R., Huber, W. (2008). arrayQualityMetrics—a bioconductor package for quality assessment of microarray data. Bioinformatics 25, 415–416. doi: 10.1093/bioinformatics/btn647
Kobayashi, S., Nakano, K., Watanabe, E., Ishigaki, T., Ohno, N., Yuji, K., et al. (2014). CADM1 expression and stepwise downregulation of CD7 are closely associated with clonal expansion of HTLV-I-infected cells in adult T-cell leukemia/lymphoma. Clin. Cancer Res. 20, 2851–2861. doi: 10.1158/1078-0432.CCR-13-3169
Kress, A. K., Schneider, G., Pichler, K., Kalmer, M., Fleckenstein, B., Grassmann, R. (2010). Elevated cyclic AMP levels in T lymphocytes transformed by human T-cell lymphotropic virus type 1. J. Virol. 84, 8732–8742. doi: 10.1128/JVI.00487-10
Lacagnina, M. J., Watkins, L. R., Grace, P. M. (2018). Toll-like receptors and their role in persistent pain. Pharmacol. Ther. 184, 145–158. doi: 10.1016/j.pharmthera.2017.10.006
Langfelder, P., Horvath, S. (2012). Fast R functions for robust correlations and hierarchical clustering. J. Stat. Softw. 46. doi: 10.18637/jss.v046.i11
Leek, J. T., Johnson, W. E., Parker, H. S., Fertig, E. J., Jaffe, A. E., Storey, J. D., et al. (2013). sva: Surrogate variable analysis. R Package Version 3.
Matson, J. P., Cook, J. G. (2017). Cell cycle proliferation decisions: the impact of single cell analyses. FEBS J. 284, 362–375. doi: 10.1111/febs.13898
Matutes, E. (2007). Adult T-cell leukaemia/lymphoma. J. Clin. Pathol. 60, 1373–1377. doi: 10.1136/jcp.2007.052456
Messmer-Blust, A. F., Balasubramanian, S., Gorbacheva, V. Y., Jeyaratnam, J. A., Vestal, D. J. (2010). The interferon-gamma-induced murine guanylate-binding protein-2 inhibits rac activation during cell spreading on fibronectin and after platelet-derived growth factor treatment: role for phosphatidylinositol 3-kinase. Mol. Biol. Cell 21, 2514–2528. doi: 10.1091/mbc.e09-04-0344
Miller, J. A., Cai, C., Langfelder, P., Geschwind, D. H., Kurian, S. M., Salomon, D. R., et al. (2011). Strategies for aggregating gene expression data: the collapseRows R function. BMC Bioinf. 12, 322. doi: 10.1186/1471-2105-12-322
Mirvish, E. D., Pomerantz, R. G., Geskin, L. J. (2011). Infectious agents in cutaneous T-cell lymphoma. J. Am. Acad. Dermatol. 64, 423–431. doi: 10.1016/j.jaad.2009.11.692
Nakagawa, M., Izumo, S., Ijichi, S., Kubota, H., Arimura, K., Kawabata, M., et al. (1995). HTLV-I-associated myelopathy: analysis of 213 patients based on clinical features and laboratory findings. J. Neurovirol. 1, 50–61. doi: 10.3109/13550289509111010
Olière, S., Hernandez, E., Lézin, A., Arguello, M., Douville, R., Nguyen, T. L.-A., et al. (2010). HTLV-1 evades type I interferon antiviral signaling by inducing the suppressor of cytokine signaling 1 (SOCS1). PLoS Pathog. 6, e1001177. doi: 10.1371/journal.ppat.1001177
O’Mara, T. A., Zhao, M., Spurdle, A. B. (2016). Meta-analysis of gene expression studies in endometrial cancer identifies gene expression profiles associated with aggressive disease and patient outcome. Sci. Rep. 6, 36677. doi: 10.1038/srep36677
Osame, M., Usuku, K., Izumo, S., Ijichi, N., Amitani, H., Igata, A., et al. (1986). HTLV-I associated myelopathy, a new clinical entity. Lancet 1, 1031–1032. doi: 10.1016/S0140-6736(86)91298-5
Pinto, M. T., Malta, T. M., Rodrigues, E. S., Pinheiro, D. G., Panepucci, R. A., Malmegrim de Farias, K. C. R., et al. (2014). Genes related to antiviral activity, cell migration, and lysis are differentially expressed in CD4(+) T cells in human t cell leukemia virus type 1-associated myelopathy/tropical spastic paraparesis patients. AIDS Res. Hum. Retroviruses 30, 610–622. doi: 10.1089/aid.2013.0109
Sato, T., Coler-Reilly, A., Utsunomiya, A., Araya, N., Yagishita, N., Ando, H., et al. (2013). CSF CXCL10, CXCL9, and neopterin as candidate prognostic biomarkers for HTLV-1-associated myelopathy/tropical spastic paraparesis. PLoS Negl. Trop. Dis. 7, e2479. doi: 10.1371/journal.pntd.0002479
Shaul, Y. D., Seger, R. (2007). The MEK/ERK cascade: from signaling specificity to diverse functions. Biochim. Biophys. Acta 1773, 1213–1226. doi: 10.1016/j.bbamcr.2006.10.005
Shimoyama, M., members of The Lymphoma Study Group (1984–87)* (1991). Diagnostic criteria and classification of clinical subtypes of adult T-cell leukaemia-lymphoma. Br. J. Haematol. 79, 428–437. doi: 10.1111/j.1365-2141.1991.tb08051.x
Shu, S. T., Dirksen, W. P., Lanigan, L. G., Martin, C. K., Thudi, N. K., Werbeck, J. L., et al. (2012). Effects of parathyroid hormone-related protein and macrophage inflammatory protein-1α in Jurkat T-cells on tumor formation in vivo and expression of apoptosis regulatory genes in vitro. Leuk. Lymphoma 53, 688–698. doi: 10.3109/10428194.2011.626883
Stelzer, G., Rosen, N., Plaschkes, I., Zimmerman, S., Twik, M., Fishilevich, S., et al. (2016). The GeneCards Suite: from gene data mining to disease genome sequence analyses. Curr. Protoc. Bioinf. 54, 1.30.1–1.30.33. doi: 10.1002/cpbi.5
Sweeney, T. E., Haynes, W. A., Vallania, F., Ioannidis, J. P., Khatri, P. (2017). Methods to increase reproducibility in differential gene expression via meta-analysis. Nucleic Acids Res. 45, e1. doi: 10.1093/nar/gkw797
Tattermusch, S., Skinner, J. A., Chaussabel, D., Banchereau, J., Berry, M. P., McNab, F. W., et al. (2012). Systems biology approaches reveal a specific interferon-inducible signature in HTLV-1 associated myelopathy. PLoS Pathog. 8, e1002480. doi: 10.1371/journal.ppat.1002480
Therneau, T., Atkinson, B., Ripley, B. (2015). rpart: Recursive Partitioning and Regression Trees. R package version 4. pp. 1–10.
Uchiyama, T., Yodoi, J., Sagawa, K., Takatsuki, K., Uchino, H. (1977). Adult T-cell leukemia: clinical and hematologic features of 16 cases. Blood 50, 481–492. doi: 10.1182/blood.V50.3.481.bloodjournal503481
Weitzman, J. (2003). Interleukins in inflammation. Genome Biol. 4, spotlight–20030217. doi: 10.1186/gb-spotlight-20030217-01
Wickham, H. (2011). The Split-Apply-Combine Strategy for Data Analysis. J. Stat. Softw. 40. doi: 10.18637/jss.v040.i01
Xue, S., Song, G., Yu, J. (2017). The prognostic significance of PD-L1 expression in patients with glioma: A meta-analysis. Sci. Rep. 7, 4231. doi: 10.1038/s41598-017-04023-x
Yamada, Y., Tomonaga, M., Fukuda, H., Hanada, S., Utsunomiya, A., Tara, M., et al. (2001). A new G-CSF-supported combination chemotherapy, LSG15, for adult T-cell leukaemia-lymphoma: Japan Clinical Oncology Group Study 9303. Br. J. Haematol. 113, 375–382. doi: 10.1046/j.1365-2141.2001.02737.x
Yamagishi, M., Nakano, K., Miyake, A., Yamochi, T., Kagami, Y., Tsutsumi, A., et al. (2012). Polycomb-mediated loss of miR-31 activates NIK-dependent NF-κB pathway in adult T cell leukemia and other cancers. Cancer Cell 21, 121–135. doi: 10.1016/j.ccr.2011.12.015
Yamamoto-Taguchi, N., Satou, Y., Miyazato, P., Ohshima, K., Nakagawa, M., Katagiri, K., et al. (2013). HTLV-1 bZIP factor induces inflammation through labile Foxp3 expression. PLoS Pathog. 9, e1003630. doi: 10.1371/journal.ppat.1003630
Yamano, Y., Sato, T. (2012). Clinical pathophysiology of human T-lymphotropic virus-type 1-associated myelopathy/tropical spastic paraparesis. Front. Microbiol. 3, 389. doi: 10.3389/fmicb.2012.00389
Yasuma, K., Matsuzaki, T., Yamano, Y., Takashima, H., Matsuoka, M., Saito, M. (2016). HTLV-1 subgroups associated with the risk of HAM/TSP are related to viral and host gene expression in peripheral blood mononuclear cells, independent of the transactivation functions of the viral factors. J. Neurovirol. 22, 416–430. doi: 10.1007/s13365-015-0407-2
Keywords: human T-lymphotropic virus 1, bioinformatics, biomarkers, adult T-cell lymphoma/leukemia, HTLV-1 associated myelopathy/tropical spastic paraparesis, meta-analysis
Citation: Fukutani ER, Ramos PIP, Kasprzykowski JI, Azevedo LG, Rodrigues MMdS, Lima JVdOP, Araújo Junior HFSd, Fukutani KF and Queiroz ATLd (2019) Meta-Analysis of HTLV-1-Infected Patients Identifies CD40LG and GBP2 as Markers of ATLL and HAM/TSP Clinical Status: Two Genes Beat as One. Front. Genet. 10:1056. doi: 10.3389/fgene.2019.01056
Received: 11 June 2019; Accepted: 02 October 2019;
Published: 08 November 2019.
Edited by:
Quan Zou, University of Electronic Science and Technology of China, ChinaReviewed by:
Andrew Dellinger, Elon University, United StatesLei Hou, Massachusetts Institute of Technology, United States
Copyright © 2019 Fukutani, Ramos, Kasprzykowski, Azevedo, Rodrigues, Lima, Araújo Junior, Fukutani and Queiroz. This is an open-access article distributed under the terms of the Creative Commons Attribution License (CC BY). The use, distribution or reproduction in other forums is permitted, provided the original author(s) and the copyright owner(s) are credited and that the original publication in this journal is cited, in accordance with accepted academic practice. No use, distribution or reproduction is permitted which does not comply with these terms.
*Correspondence: Eduardo Rocha Fukutani, eduardofukutani@gmail.com