 Galina V. Novikova1*
 Luis A. J. Mur2
 Alexander V. Nosov1
 Artem A. Fomenkov1
 Kirill S. Mironov1
 Anna S. Mamaeva1
 Evgeny S. Shilov3
 Victor Y. Rakitin1
 Michael A. Hall2
- 1Laboratory of Intracellular Regulation, K.A. Timiryazev Institute of Plant Physiology, Russian Academy of Sciences, Moscow, Russia
- 2Molecular Plant Pathology Group, Institute of Biological, Environmental and Rural Sciences, Aberystwyth University, Aberystwyth, UK
- 3Department of Immunology, M.V. Lomonosov Moscow State University, Moscow, Russia
Ethylene is known to influence the cell cycle (CC) via poorly characterized roles whilst nitric oxide (NO) has well-established roles in the animal CC but analogous role(s) have not been reported for plants. As NO and ethylene signaling events often interact we examined their role in CC in cultured cells derived from Arabidopsis thaliana wild-type (Col-0) plants and from ethylene-insensitive mutant ein2-1 plants. Both NO and ethylene were produced mainly during the first 5 days of the sub-cultivation period corresponding to the period of active cell division. However, in ein2-1 cells, ethylene generation was significantly reduced while NO levels were increased. With application of a range of concentrations of the NO donor, sodium nitroprusside (SNP) (between 20 and 500 μM) ethylene production was significantly diminished in Col-0 but unchanged in ein2-1 cells. Flow cytometry assays showed that in Col-0 cells treatments with 5 and 10 μM SNP concentrations led to an increase in S-phase cell number indicating the stimulation of G1/S transition. However, at ≥20 μM SNP CC progression was restrained at G1/S transition. In the mutant ein2-1 strain, the index of S-phase cells was not altered at 5–10 μM SNP but decreased dramatically at higher SNP concentrations. Concomitantly, 5 μM SNP induced transcription of genes encoding CDKA;1 and CYCD3;1 in Col-0 cells whereas transcription of CDKs and CYCs were not significantly altered in ein2-1 cells at any SNP concentrations examined. Hence, it is appears that EIN2 is required for full responses at each SNP concentration. In ein2-1 cells, greater amounts of NO, reactive oxygen species, and the tyrosine-nitrating peroxynitrite radical were detected, possibly indicating NO-dependent post-translational protein modifications which could stop CC. Thus, we suggest that in Arabidopsis cultured cells NO affects CC progression as a concentration-dependent modulator with a dependency on EIN2 for both ethylene production and a NO/ethylene regulatory function.
Introduction
The cell cycle (CC) is one of the most conserved processes operating in eukaryotic cells and its integrity is essential for an organism's shape and function. The CC has been extensively described in both plants (Dewitte and Murray, 2003) and animals (Norbury and Nurse, 1992) and is regulated by the sequential expression of cyclin-dependent kinases (CDK) which are activated by binding to the cyclins (CYC) (Dorée and Galas, 1994). However, newly emerging CC regulatory steps, especially in plants, require further definition. In particular, ethylene can positively or negatively affect CC progression but these steps have been poorly defined. For example, Love et al. (2009) used both the transgenic ethylene-insensitive and ethylene-overproducing hybrid aspen (Populus tremula × tremuloides) and treatment with an ethylene perception inhibitor 1-methylcyclopropene (1-MCP) to demonstrate that ethylene stimulates cell division in the cambial meristem. Similarly, Ortega-Martínez et al. (2007) suggested that ethylene production and ethylene-modulated cell division was suppressed in the quiescent center of Arabidopsis thaliana roots. On the other hand, CC arrest in parallel with an increase in 1-aminocyclopropane-1-carboxylate (ACC) levels and the activation of ethylene signaling in A. thaliana leaves was observed during osmotic stress (Skirycz et al., 2011).
Another unknown in the plant CC is the role of nitric oxide (NO). There is a considerable literature describing the biological role(s) of NO in plants such as seed dormancy, growth, and development, senescence, respiration, photosynthesis, programmed cell death, antioxidant defense system (for review, Hayat et al., 2009) with the most detailed information available for NO effects during biotic stress (for reviews, Delledonne et al., 1998; Astier and Lindermayr, 2012; Mur et al., 2013) but the potential role of NO in regulating plant CC remains to be defined. This is the case although many studies in mammalian cells have demonstrated the importance of NO to CC progression (Takagi et al., 1994; Tanner et al., 2000; Cui et al., 2005; Kumar et al., 2010).
Preliminary evidence is suggestive of a role for NO in influencing plant CC. Ötvös et al. (2005) studied NO effects on protoplasts derived from alfalfa leaves and showed that low concentrations of chemical NO-donors stimulated incorporation of 5-bromo-2′-deoxyuridine (BrdU), i.e., initiated DNA synthesis. However, higher NO-donor concentrations blocked DNA synthesis. Based on these results it was first speculated that NO at low concentrations positively affected G1/S transition. Similar, concentration-dependent effects for NO, were also suggested by Bai et al. (2012) based on an Arabidopsis apical root meristem model using the NO-donor, sodium nitroprusside (SNP) (2–50 μM). SNP inhibited the main root growth at concentrations higher than 20 μM and its effect was accompanied by a decrease in the size of the root apical meristem, reduced number of cells expressing mitotic cyclin B1;1 (CYCB1;1) and the appearance of cells with damaged DNA. No concentrations of SNP reduced the number of 2C DNA nuclei further indicating that SNP blocked G1/S transition. Considering endogenously produced NO, application of the NO scavenger 2-(4-carboxyphenyl)-4, 4, 5, 5-tetramethylimidazoline-1-oxyl-3-oxide (cPTIO) or the use of the atnoa1 mutant (with lower NO production), resulted in reduced CYCD3;1 expression following the application of trans-zeatin (Shen et al., 2013). There was also an increase in the number of nuclei with 4 and 8C DNA in atnoa1 compared to wild-type Arabidopsis which lead the authors to suggest that NO inhibits endoreduplication and stimulates G1/S transition. In line with this, Zhu et al. (2016) demonstrated NO-induced accumulation of cells in the S-phase during adventitious root formation in cucumber due to up-regulation of the genes involved in G1/S transition, CYCA, CYCB, CDKA, and CDKB. Other studies suggested that NO can act at G0 phase. Addition of cPTIO blocked the derivation of tomato lateral root primordia from the pericycle while applying SNP restored this process by increasing the expression of CYCD3;1 and reducing the expression of KRP2—a negative regulator of the CC (Correa-Aragunde et al., 2006).
In our previous studies on biotic stress, we have demonstrated that NO can stimulate ethylene production in tobacco and Arabidopsis (Mur et al., 2008, 2012). This is also the case with somatic embryogenesis where increasing NO production through suppressing the expression of NO oxidizing Glb1 (hemoglobin class 1) also increased the generation of ethylene (Mira et al., 2015). However, with fruit ripening (Manjunatha et al., 2012), abscission of plant organs (Para-Lobato and Gomez-Jimenes, 2011), and the regulation of leaf senescence (Mishina et al., 2007) NO counteracts ethylene production. Niu and Guo (2012) used both Atnoa1 and the ethylene insensitive 2 (ein2-1) mutants to suggest that NO regulates dark-induced leaf senescence through EIN2. Endoplasmic reticulum (ER)-localized EIN2 (Bisson et al., 2009) is a positive regulator in ethylene signaling in Arabidopsis and ein2 mutants plants are insensitive to almost all aspects of ethylene responses (Alonso et al., 1999). According to the canonical ethylene signaling pathway, in the absence of ethylene, the ethylene receptors at ER interact with CONSTITUTIVE TRIPLE RESPONSE 1 (CTR1) protein kinase, which represses EIN2 followed by ETHYLENE INSENSITIVE 3 (EIN3) and EIN-LIKE 1 (EIL1). These latter are two transcription factors that control the majority of ethylene responses (Chang et al., 2013). Without ethylene, EIN3 and EIL1 are degraded through the action of F-box proteins EIN3-BINDING F-BOX 1 (EBF1) and EBF 2 (Guo and Ecker, 2003), whereas ethylene decreases the reduction of EBF1/2 protein levels in an EIN2-dependent manner. Thus, EIN3/EIL1 are stabilized and activate ethylene responses (An et al., 2010). EIN3/EIL1 also directly regulate the expression of a diverse array of genes including ERF1 (ETHYLENE RESPONSE FACTOR 1) (Chang et al., 2013).
In this current study we sought not only to define NO and ethylene-mediated effects on the plant CC but possible interactions between these signals. We chose to exploit cultured Arabidopsis cells as this would avoid problems associated with intact plants where CC progression may be masked by the presence of diverse intercellular interactions and complex developmental programs. Thus, we studied NO effects on the CC of cultured wild-type (Col-0) and ein2-1 Arabidopsis cells. Here we demonstrate that NO acts as a concentration-dependent modulator of CC progression with a dependency on EIN2 for both of ethylene production and a NO/ethylene regulatory functions.
Materials and Methods
Derivation of Suspension Cell Cultures
Suspension cell cultures of Arabidopsis thaliana (L.) Heynh. wild type (Col-0) and the ethylene-insensitive mutant ein2-1 were generated by A.V. Nosov and A.A. Fomenkov and deposited at the All-Russia Collection of Cultivated Cells of Higher Plants as NFC-0 (for Col-0) and NFCE-2 (for ein2-1). Both cell strains were cultured in 50 mL of Schenk and Hildebrandt medium (Schenk and Hildebrandt, 1972) supplemented with 3% sucrose, 1 mg L−1 2,4-D (Sigma, St. Louis, Missouri, USA) and 0.1 mg L−1 kinetin (Sigma). Cells were grown under constant agitation (110 rpm) at 26°C and 70% humidity. The time of sub-culture was 10 days and inoculated volumes were 1 mL for Col-0 and 2.5 mL for ein2-1. To confirm that the ein2-1 mutation is retained in the cultured cells allele-specific PCR was performed periodically as described by Stepanchenko et al. (2012).
Treatments with Sodium Nitroprusside (SNP)
Cells were treated with freshly prepared solutions of the NO-donor sodium nitroprusside (SNP, Sigma), which were added to the culture medium at concentrations ranging from 2 to 10,000 μM. Cells were incubated with the NO-donor in the light (140 μM m−2 s−1) on an orbital shaker (110 rpm) at 26°C. The incubation time was chosen based on the kinetics of SNP decomposition in the solution (Floryszak-Wieczorek et al., 2006). In all experiments, “NO-exhausted” SNP solutions (generated by allowing NO release in the light for 48 h prior to use) were used as a control treatment. To demonstrate that SNP effects were specific to NO, cultured cells were treated with 100 μM of the NO scavenger cPTIO prior SNP application. All experiments were performed on the fourth day after inoculation of cells into fresh medium when Col-0 and ein2-1 cells were dividing actively.
Determination of NO, ONOO−, and ROS Production in Col-0 and ein2-1 cells
NO production was assessed in 1 mL of cell suspensions with 5 μM DAF-FM DA (4-amino-5-methylamino-2′, 7′-difluorofluorescein diacetate), peroxynitrite (ONOO−)—with 5 μM APF (aminophenyl fluorescein), superoxide with 10 μM DHE (dihydroethidium), intracellular ROS (ROSin)—with 1 μM DCFH-DA (dichlorodihydrofluorescein diacetate). All dyes were purchased from Sigma.
Cells were incubated with the corresponding fluorescent dye for 15 min in the dark and then 200 μL aliquots of cells were transferred to 96-well flat bottom plates (Greiner Bio One, Germany). Plates were scanned in Typhoon Trio+ Imager (GE Healthcare, Boston, Massachusetts, USA) at λex 480 nm and λem BP 520 nm/40 nm for DAF-FM DA, DCFH-DA, and APF, and λex 480 nm and λem BP 580 nm/30 nm for DHE.
NO levels during the sub-cultivation period were expressed as arbitrary units (AU) per 1 g of cell dry weight (DW). Values for ONOO−, superoxide and ROSin production calculated as fluorescence units per 1 μg of protein measured with a BCA Protein Assay Kit (Sigma).
Dye fluorescence was also imaged using an Axio Imager Z2 microscope (Carl Zeiss, Oberkochen, Germany) with a digital camera AxioCam MR, and the appropriate filter units were used. DAF-FM DA was detected at λex BP 475 nm/40 nm; λem BP 530 nm/50 nm. For continuous monitoring of DAF-FM DA fluorescence, module ApoTome (Carl Zeiss) was used. The images were processed using the program AxioVision 4.8 (Carl Zeiss).
All fluorescence experiments were performed with at least three independent sets of Col-0 and ein2-1 cells. Data presented are means of three independent experiments with five replicates ± SE (standard errors).
Measurement of Ethylene and O2 Levels in Col-0 and ein2-1 Cells
Ethylene and O2 levels in cultured cells were measured as described by Rakitin and Rakitin (1986). Briefly, 3–5 mL of cell suspensions in 15 mL glass vials were mounted on an orbital shaker (110 rpm) and kept at 26°C for 10 min in the dark, then vials were sealed with Suba Seals (Sigma) and kept at the same conditions for 0.5–1 h. The vials with fresh SH medium only were used as a blank reference. Prior to measurement, ethylene was concentrated in a Porapak N column (80–100 mesh, 70 × 4 mm, Supelko, purchased from Sigma) at −30°C. After desorption at 50°C, ethylene was measured with a gas chromatograph fitted with a Poropak N column (80–100 mesh, 3 m × 2 mm, Supelko). Ethylene production was calculated as nL per hour per 1 g DW. O2 content was estimated by gas absorption chromatography.
Determination of the Viability of SNP-Treated Col-0 and ein2-1 Cells
Cell viability was assessed after 24 h treatment of Col-0 and ein2-1 cells with SNP at concentrations from 100 to 10,000 μM. Cells were stained with a 0.02% aqueous solution of Erythrosin B (Sigma) and counted using a Univar microscope (Reichert-Jung, Austria). Viability was calculated as percentage of the number of cells unstained with Erythrosin B from their total number.
Isolation of Protoplasts from Col-0 and ein2-1 Cultured Cells
Protoplasts from both strains of cultured cells were isolated at 26°C on an orbital shaker (120 rpm) within 1.0–1.5 h, as described earlier (Nosov et al., 2014). Aliquots (5 mL) of Col-0 and ein2-1 cell suspensions were mixed with equal volumes of solution with major inorganic components of SH medium containing 0.8 M sorbitol, 8 mM CaCl2, 25 mM MES at pH 5.7, 2% cellulase Onozuka R10 (Kinki Yakult, Tokyo, Japan), 0.3% pectinase Macerozyme R10 (Kinki Yakult), and 0.8% hemicellulase Driselase (Fluka, Seelze, Germany). After 1.0–1.5 h incubation, the suspensions were filtered through nylon mesh (40 μm pore size) and washed twice with 2.5 mM CaCl2 in 0.5 M sorbitol. For cell number counting, the protoplast suspensions in the enzyme solution were used without additional filtration and washing. For flow cytometry analysis and microscopy, 1.5 mL of protoplast suspension was added drop-wise into 3.5 mL of cold (4°C) methanol. Protoplasts were fixed in methanol and stored at 4°C before use.
Determination of S-Phase Cells by Flow Cytometry
Cells in S-phase of the CC were determined by incorporation of 5-ethynyl-2′-deoxyuridine (EdU) into DNA. EdU (Invitrogen, Carlsbad, California, USA) was added to a final concentration of 20 μM. After 1-h incubation with EdU its incorporation into DNA was terminated by the addition of 200 μM 2′-deoxythymidine (Sigma) for 5 min then the protoplasts were isolated as described above.
Methanol-fixed protoplasts were washed twice in 0.5 M sorbitol without CaCl2, once in phosphate-buffered saline (PBS, Sigma) with 0.1% Triton X-100 (Sigma), and once in PBS without Triton X-100. EdU incorporation into newly-synthesized DNA was detected by reaction with Alexa Fluor 488 using Click-iT EdU Alexa Fluor 488 HCS Kit (Invitrogen), while DNA was stained with 100 ng mL−1 DAPI (4′, 6-diamidino-2-phenylindol, Sigma). On average, 100,000 protoplasts were analyzed with a Gallios flow cytometer (Beckman Coulter, Brea, California, USA). Alexa Fluor 488 fluorescence was detected in channel FL1 (λex 488 nm, λem 505–545 nm), whereas channel FL9 (λex 405 nm, λem 430–470 nm) was adopted for reading DAPI fluorescence. Data analysis was performed using FlowJo 7.6.2 (http://www.flowjo.com). This method has been typically applied to isolated nuclei (Kotogány et al., 2010) but our earlier assessments demonstrated that isolated cell protoplasts are also suitable for two-parameter flow cytometry (Nosov et al., 2014).
RNA Isolation and Quantitative RT-PCR (qRT-PCR) Analysis
Total RNA was isolated from 100 mg of cells using a Spectrum Plant Total RNA Kit (Sigma) according to the manufacturer's manual. Synthesis of cDNA was performed using 500 ng of total RNA with Oligo(dT)20 primer (Invitrogen) and SuperScript III First-Strand Synthesis System following manufacturer's instructions (Invitrogen).
Amplification mixture (in a total reaction volume of 25 μl) contained 5 ng template cDNA, 5 × qPCRmix-HS SYBR (5 μl) (Evrogen, Moscow, Russian Federation) and 200 nM forward and reverse primers. All the primers used for qRT-PCR are listed in the Table 1. Reactions were run on CFX96 Touch (Bio-Rad, Hercules, California, USA) under the following cycling conditions: 95°C for 3 min, 45 cycles at 95°C for 10 s and 63°C for 30 s followed by melting curve analysis.
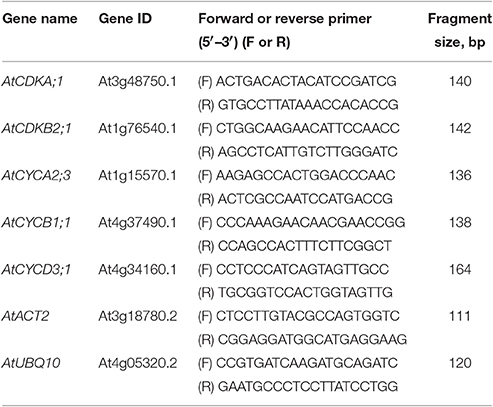
Table 1. Sequences of oligonucleotide primers used for qRT-PCR analysis.
The Cq value was calculated from three independent biological experiments, each with four PCR replicates. AtACT2 (At3g18780.2) and AtUBQ10 (At4g05320.2) were used as reference genes for data normalization as described by Pfaffl (2001) and Vandesompele et al. (2002).
Statistical Analyses
Data were subjected to analysis of variance using Minitab v.14 (Minitab Ltd, Coventry, UK), after which residual plots were inspected to confirm that data conformed to normality. Comparisons of data points from different treatments with controls were performed using Tukey multiple pairwise comparison test. Differences with P < 0.05 were considered significant.
Results
Ethylene and NO Production during the Cell Suspension Sub-Cultivation Cycle
Using actively growing Arabidopsis Col-0 and ein2-1 suspension cells (Figure S1), we studied the roles of ethylene and NO in CC progression. Initial experiments focused on observing the patterns of ethylene and NO generation over the sub-cultivation period. Measurements of ethylene using gas chromatography indicated that maximum ethylene production occurred over the first 5 days following sub-cultivation in both Col-0 (Figure 1A) and ein2-1 (Figure 1B) cell lines although in the latter case levels were very low. To ensure that the observed patterns of ethylene production did not reflect hypoxic culture conditions, which would affect ACC oxidase (ACO) enzyme activity, O2 content was measured. Gas absorption chromatography of Col-0 and ein2-1 cells in Suba Seal closed vials indicated that O2 levels did not drop lower than 20% which would allow ACO function and ethylene production.
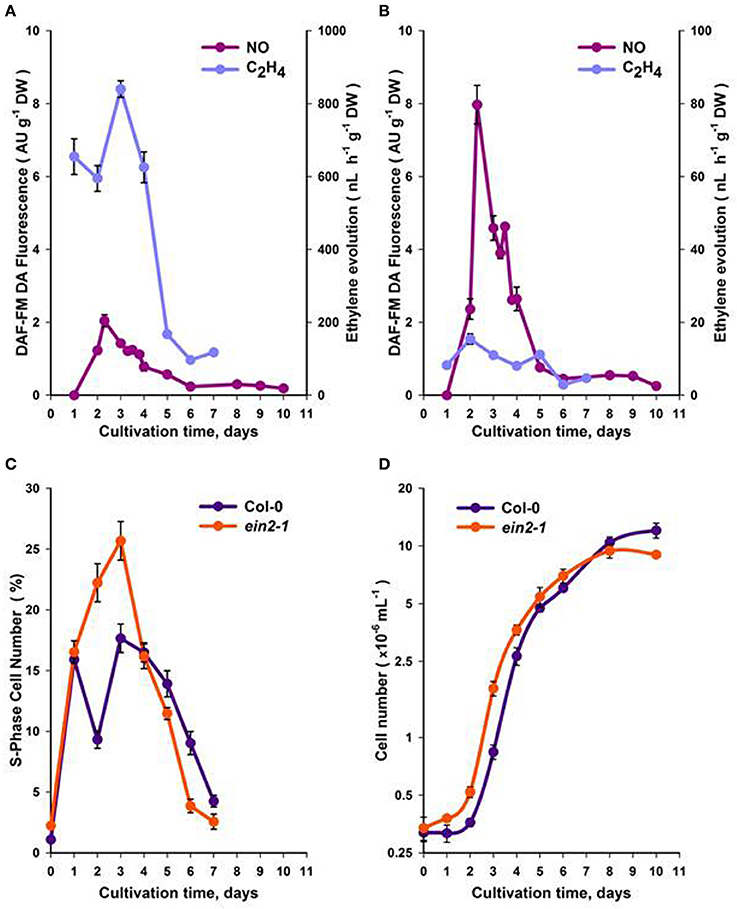
Figure 1. Production of NO and ethylene within a sub-cultivation period of Col-0 (A) and ein2-1 (B) cultures. The portion of S-phase cells (C) and the total cell number (D). On (D), the ordinate axis is represented in a log scale. All values (means ± SE) are the averages of three independent biological experiments with five analytical replicates.
NO production was evaluated within the same sub-cultivation cycle by measuring fluorescence from the NO-specific DAF-FM DA dye. Fluorescence was localized mainly in the cytoplasm and was most pronounced around the nuclei [Figure S2 (video)]. In Col-0 cells, maximum NO production occurred over the first 2–4 days following sub-cultivation (Figure 1A), while in ein2-1 cell suspensions NO production was much higher compared to Col-0 over the same period (Figure 1B).
In Col-0 and ein2-1 cells, ethylene and NO production over the cell sub-cultivation period were compared with cell division. Although both genotypes exhibited similarly shaped curves (Figures 1C,D), within 3–4 days of culturing Col-0 cells displayed fewer S-phase cells compared to ein2-1 but after the 5th day rather more S-phase cells were observed (Figure 1C). This correlated with initially reduced levels of Col-0 cells (to 6 days) but with more cells at 10 days in comparison to ein2-1 cells (Figure 1D).
Assessing the Effects of NO on Suspension Cell Cultures
To assess the effects of NO, cells were treated with the NO-donor, SNP at the day 4 following sub-cultivation, which corresponded to some deceleration of the logarithmic growth phase (Figure 1D) when both Col-0 and ein2-1 cultures retained similar numbers of S-phase cells (Figure 1C).
Addition of increasing concentrations of SNP to Col-0 and ein2-1 cells resulted in corresponding increases in NO production as reported by DAF-FM DA fluorescence (Figure 2A). The specificity of the fluorescence signal was established by its reduction when SNP was co-applied with 100 μM of the NO scavenger, cPTIO (Figure 2A). NO has also been linked to the initiation of cell death (Mur et al., 2008) but neither culture exhibited any significant loss in viability at SNP concentrations up to 500 μM (Figure 2B). Col-0 cells retained 60–70% viability at even higher SNP concentrations, whereas ein2-1 cells exhibited considerable levels of cell death (Figure 2B). These results defined the range of SNP concentrations used in the further experiments.
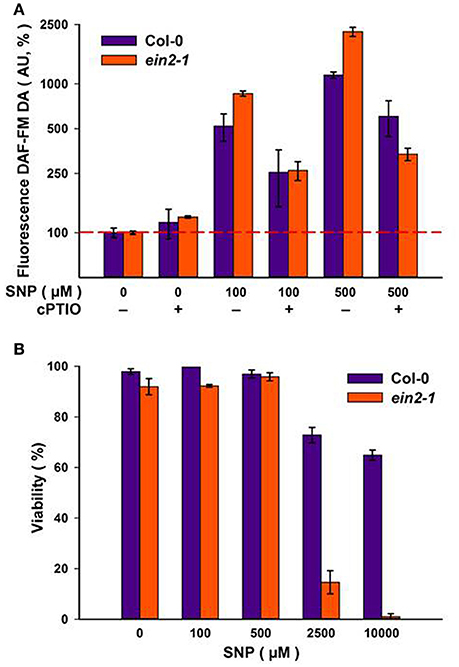
Figure 2. Levels of NO as detected by DAF-FM DA fluorescence at the day four of sub-cultivation of Col-0 and ein2-1 cells after 3-h treatment with sodium nitroprusside (SNP). The specificity of the fluorescent signal is demonstrated by parallel treatments with 100 μM of the NO scavenger cPTIO (A). Cell viability was detected using Erythrosin B (B). On (A), the ordinate axis is represented on a log scale. Values are expressed as mean ± SE of biological triplicates with five analytical replicates.
To assess the impact of SNP on S-phase cells, flow cytometry after incorporation of the thymidine analog, EdU into DNA was used. Both suspension cultures were treated with either exhausted SNP or freshly prepared SNP solutions at concentrations of 5, 10, 20, 100, and 500 μM for 6 h at day 4 of sub-cultivation. EdU was added 1 h before the end of incubation with SNP and detected in the Click-iT reaction with the azide of Alexa Fluor 488.
In Col-0 cultures, a 6-h treatment with SNP at 5 and 10 μM led to an increase in the number of S-phase cells from 13.6% in untreated cells to 16.6 and 21.5% in SNP-treated cells, respectively (Figures 3A,B). When the concentration of the SNP was increased to 20, 100, and 500 μM, the proportion of S-phase cells decreased significantly to 10.1, 9.1, and 7.6, respectively. This decrease was not linked to any effect on cell viability (Figure 2B).
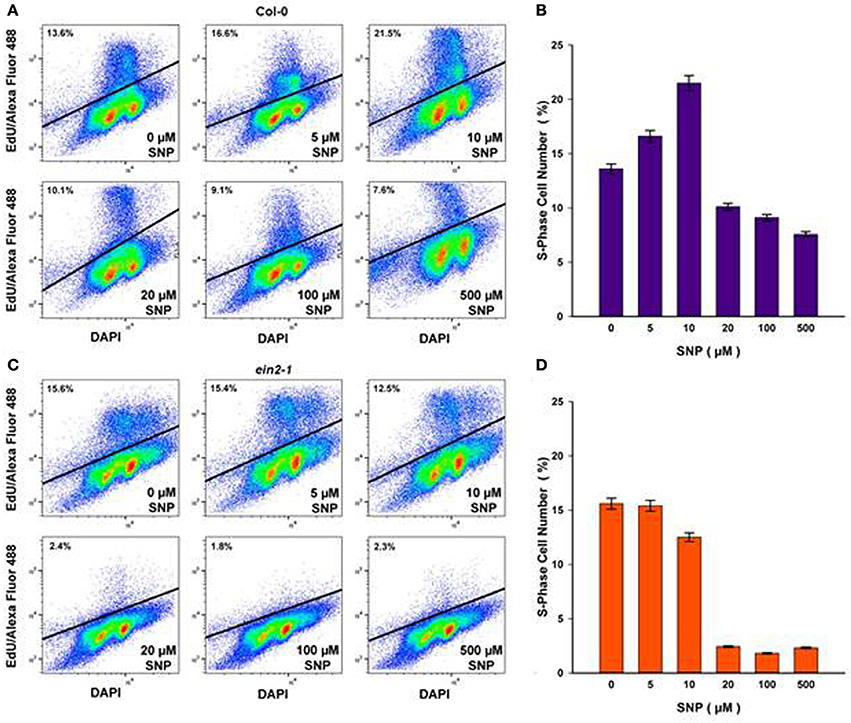
Figure 3. S-phase cells (%) in Col-0 (A,B) and ein2-1 (C,D) after 6-h treatment with SNP as detected by flow cytometry after incorporation of 5-ethynyl-2′-deoxyuridine (EdU) into DNA and the Click-iT reaction with azide of Alexa Fluor 488. Representative bivariate plots of DNA content (based on DAPI fluorescence) and EdU incorporation (based on Alexa fluor) are shown in (A) and (C). Above the solid line is a cluster of protoplasts having tag EdU–Alexa Fluor 488 (S-phase cells). Values in (B) and (D) are means ± SE of three independent biological experiments.
In ein2-1 cells, low SNP concentrations (5 and 10 μM) did not seriously affect the number of S-phase cells as compared to untreated cells (Figures 3C,D), however, when ein2-1 cells were treated with higher concentrations of SNP (20, 100, and 500 μM), a dramatic fall in the number of S-phase cells was observed (Figures 3C,D).
The assessment of SNP effects on ethylene production in cultured cells of both genotypes revealed that it was repressed in Col-0 cells at all concentrations tested but was mostly unchanged in ein2-1 cells (Table 2). Additionally, the ein2-1 cultured cells showed a higher production of reactive oxygen and nitrogen species compared to Col-0 cells (Table 3).
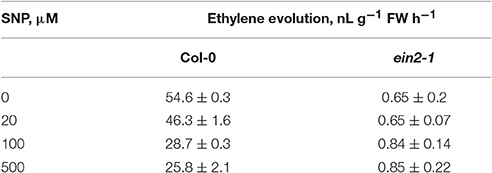
Table 2. Sodium nitroprusside (SNP) effect on ethylene evolution by Col-0 and ein2-1 cultured cells.
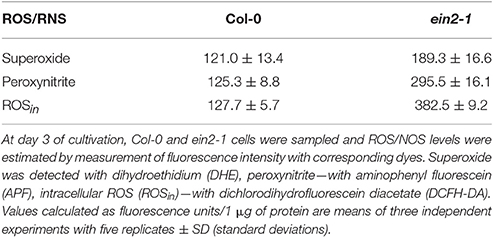
Table 3. Reactive oxygen (ROS) and nitrogen species (RNS) production in Arabidopsis cultured cells of wild type (Col-0) and the ethylene-insensitive mutant ein2-1.
NO and EIN2 Effects on the Expression of Cyclin-Dependent Kinases and Cyclins
To define the molecular events underlying the impact of NO on the transition of CC checkpoints, we examined the effect of SNP on the expression of genes for some CDKs and CYCs (Figure 4). Addition of 5 μM SNP to Col-0 cultures induce significant increases (P < 0.001) with CDKA;1 (Figure 4A) and CYCD3;1 (Figure 4E) that were ≥ two fold compared to controls. With CDKB2;1, CYCA2;3, and CYCB1;1 there were significant increases with 5 μM SNP but were < two fold compared to untreated controls (Figures 4B,C,D). In the Col-0 cultures, addition of SNP at 100 and 500 μM SNP reduced the proportion of S-phase cells (Figures 3A,B) and this was accompanied by the significant (P < 0.01) reduction in the expression of CYCA2;3, CYCD3;1, CDKA;1, CDKB2;1 (Figure 4), whereas the transcription of mitotic cyclin CYCB1;1 was significantly reduced only at 500 μM SNP (Figure 4D). There were no significant changes in CDKs and CYCs gene expression compared to untreated controls with ein2-1 at any SNP concentration with exception in CYCD3;1 at 500 μM SNP (Figure 4E). Figure 4 also compares the response of Col-0 and ein2-1 to SNP and highlight (with the exception of CYCD3;1) the abolition of a significant change in analyzed genes expression in ein2-1 at > 10 μM SNP.
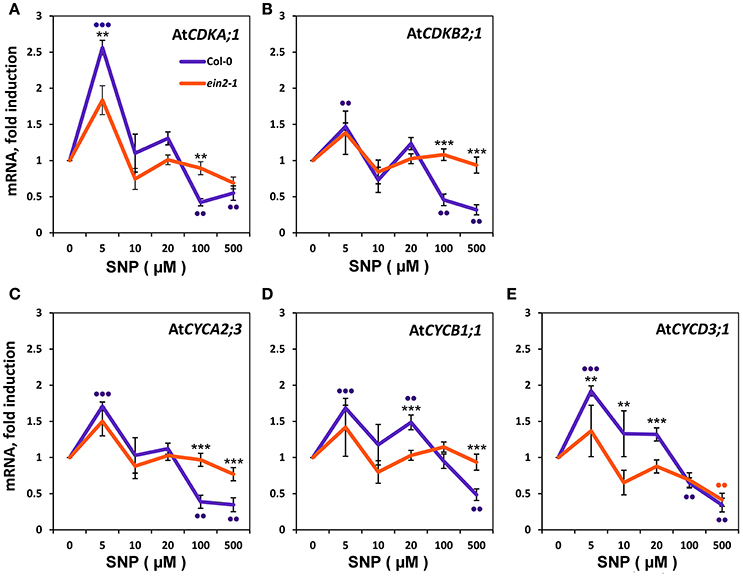
Figure 4. Expression of Cyclins (CYC) and Cyclin-Dependent Kinases (CDK) in Col-0 and ein2-1 cells after 6-h treatment with SNP. mRNA levels in cultured Col-0 and ein2-1 cells were examined by qRT-PCR for CDKA;1 (A), CDKB2;1 (B), CYCA2;3(C), CYCB1;1 (D), and CYCD3;1 (E). For qRT-PCR analysis, AtACT2 and AtUBQ10 were used as the reference genes. Bars indicate standard errors of four technical replicates on biological triplicates. Asterisks indicate significant changes between Col-0 and ein2-1 at a given SNP concentration. *** P ≤ 0.001; ** P ≤ 0.01. Dots indicate significant changes between untreated and SNP-treated Col-0 and ein2-1 cells. ••• P ≤ 0.001; •• P ≤ 0.01.
Discussion
In animal cells, the role of NO in perturbing G1/S transitions of CC has been extensively characterized (Cui et al., 2005; Kumar et al., 2010; Napoli et al., 2013). We here demonstrate similar effects of NO on Arabidopsis cultured cells in a NO concentration dependent manner. Crucially, we have used the ein2-1 mutant to demonstrate a key interaction with ethylene in this regulatory mechanism.
NO and Ethylene Signaling Events Influence CC Progression
Any consideration of the roles of NO and ethylene in the CC must be based on measurements of when these signals are produced. To provide a focus on ethylene effects our experimental strategy was based on comparing NO effects on Col-0 and ein2-1 suspension cultures. Thus, we observed that NO and ethylene were maximally produced during an overlapping period of sub-cultivation. Crucially, the effect of SNP on Col-0 cells suggested that NO could repress rather than initiate ethylene production in Col-0 cells (Table 2). This was in contrast to the hypersensitive response during plant-pathogen interactions, where NO was required for ethylene production (Mur et al., 2008). However, the effect of SNP was consistent with the observed NO-dependent post-translational modification of methionine adenosyltransferase 1 (MAT1) to lower enzyme activity thereby decreasing ethylene synthesis (Lindermayr et al., 2006). Further levels of subtlety in this interaction are revealed by examination of responses in the ein2-1 cultures. These data suggested that when ethylene production was suppressed that of NO was augmented (Figure 1). This implicates EIN2 as a regulatory switch influencing the CC patterns of both NO and ethylene production. Nonetheless, even in the absence of functionally active EIN2 (the case of ein2-1 cells) the CC appeared to operate normally (Figures 1C,D). This could suggest that NO and ethylene production during the CC was irrelevant to the latter's control. However, some impacts on S-phase number and total cell number (Figures 1C,D) were noted. Thus, the relative rates of NO and ethylene production in both Col-0 and ein2-1 cells suggest that these may be essential for the proper progression through the CC. Further, as a recent study showed that Arabidopsis ERFs, including ERF1 were required for the increase in cambial cell division (Etchells et al., 2012), it is appropriate to note our data relating to ERF1 expression (Figure S3). In cultured ein2-1 cells, where the ethylene signal transduction pathway is thought to be abolished (Alonso et al., 1999), we observed a high expression level of ERF1, which is a specific indicator of early ethylene signaling (Lorenzo et al., 2003). Taking into account that cultured ein2-1 cells do not demonstrate reductions in cell number (Figure 1D) differences in ERF1 expression could be the result of reduced ethylene signaling. This could suggest that in the absence of functionally active EIN2 alternative ethylene signaling pathway(s), which is likely to require a low level of ethylene, can operate (Cho and Yoo, 2015).
Ethylene and NO Act at the G1/S Checkpoint in the CC
Typically, synchronized cells are used to study CC regulation, and aphidicolin is the most common chemical employed for culture synchronization. However, aphidicolin affects DNA polymerases and thus DNA replication blocked CC at the G1/S-phase boundary. This situation can be released by washing with fresh media in order to permit cells to move into the succeeding phase of the CC, but we have also shown a sharp increase in ethylene production within an hour after inoculation of cells into the fresh medium (Fomenkov et al., 2015). Therefore, the use of aphidicolin could complicates any dissection of ethylene effects on the CC. To avoid these problems as well as to minimize the mechanical manipulations with cells prior SNP treatments we used asynchronous Col-0 and ein2-1 cultures in order to dissect the roles of ethylene, NO and EIN2 on cell proliferation.
The influence of NO on S-phase cells was estimated by flow cytometry. In Col-0, rather complex NO effects on S-phase were revealed. Low (5 and 10 μM) concentrations of SNP caused S-phase progression (Figures 3A,B), while high concentrations (20, 100, and 500 μM) caused a decrease in the proportion of S-phase cells. This was consistent with the results obtained on animal cells, where low NO concentrations (pM-nM) seemed to favor cell proliferation (Thomas et al., 2008). This may suggest a relative insensitivity to NO in our cultured plant cells (Figures 3A,B) but this was in agreement with those obtained for intact plants (Ötvös et al., 2005). Moreover, it should be kept in mind that SNP does not release all of its NO instantaneously (Mur et al., 2013) and the actual dose of NO obtained by cells from the surrounding medium could be lower than the concentration of SNP which had been used for treatments.
A halt in the CC progression could be associated with cell differentiation which can be preceded by endoreduplication (De Veylder et al., 2007). However, an increase in endoreduplication was not observed in either Col-0 or ein2-1 cells after 6-h treatment with high NO concentrations (data not shown). Currently, it is unclear how far this finding reflected an effect of exogenous NO at the highly reduced level of endogenous ethylene (Figure 1B). It is worth noting that there is a report that high SNP concentrations contributed to endoreduplication in the chlorophyll a/b binding protein under-expressed (cue1) mutant, which produces more NO than wild type and, moreover, is NO supersensitive (Bai et al., 2012).
Our definition of the molecular events underlying NO/ethylene effect on the CC naturally focused on the expression pattern of CYCs and CDKs. CYCs of the D-type (CYCDs) are CDKA;1 partners which control the G1/S transition (Menges et al., 2006; de Jager et al., 2009). CYCA2;3 is a marker of G2/M transition, and CYCB1;1 is a mitotic CYC. CDKB1;1 operates with CYCA2;3 and CDKB2;1/CDKB2;2—with CYCB1;1 (Menges et al., 2005; Inzé and De Veylder, 2006; Van Leene et al., 2010; Komaki and Sugimoto, 2012). Referring to the results presented, we suggest that in Col-0 cells NO application at low concentrations positively influences CC progression at G1/S transition (Figures 3A,B) at least due to stimulation of CDKA;1 and CYCD3;1 expression (Figures 4A,E). It should be noted, that expression of CYCA2;3, CYCB1;1, and CDKB2;1 operating at G2/M transition and in M-phase of CC barely increased (Figures 4C,D,B), further suggesting that low concentrations of NO stimulated G1/S transition. At the same time, in ein2-1 cells, low concentrations of SNP had little effect on both the S-phase index (Figures 3C,D) and expression of the genes associated with the CC (Figure 4) compared to Col-0.
Based on the above observations, it is possible to suggest a tentative model for NO/ethylene effects on the CC of Arabidopsis cultured cells (Figure 5). Under standard cultivation conditions, cells of Col-0 (with functional EIN2) and ein2-1 (with “broken” EIN2) have opposite levels of ethylene and NO production but almost the same levels of proliferation which should be controlled by appropriate transcription/translation of CDKs and CYCs (Figure 5A). High levels of endogenous NO apparently inhibit ethylene production in ein2-1 cells as exogenous NO does in Col-0 cells. Low level of endogenous ethylene in ein2-1 cells likely provides the cell proliferation control bypassing EIN2. Treatment of Col-0 cells with low concentrations of NO (5 and 10 μM of SNP) on the background of low endogenous NO level stimulates cell transition into S-phase of CC due to increased expression of associated CDKA;1 and CYCD3;1 (Figure 5B). In ein2-1 cells with high endogenous NO level, the low concentrations of NO supplied (5 and 10 μM of SNP) do not affect both the index of S-phase cells and expression of CDKs and CYCs tested. Under such circumstances CC progression remains unchanged (Figure 5C). In Col-0 cells, high levels of exogenous NO decrease the expression of CDKA;1, CDKB2;1, and CYCA2;3, CYCB1;1, CYCD3;1 resulting in downregulation of CC progression (Figure 5D). Finally, the treatments of ein2-1 cells with high concentrations of NO on the background of the high endogenous NO level have no significant effect on the expression of the CC-associated genes but rapidly reduce the number of S-phase cells indicating that G1/S transition comes to a stop (Figure 5E). Thus, from the above appears that CDKA;1 is the main response to low (5 μM) SNP and EIN2 is required for full responses at each SNP concentration. Additionally or alternatively, the CC progression might be mediated by NO-dependent post-translational protein modifications including those involved in CC regulation (Figure 5E) since ein2-1 cultured cells accumulate substantial amounts of both ROS and RNS (Table 3). Clearly, such a simple model requires further characterization but it does generate several hypotheses on which further studies can be based.
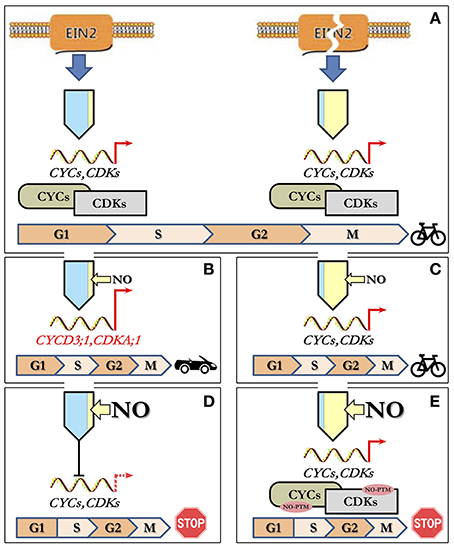
Figure 5. Model describing concentration-dependent NO–ethylene interactions influencing CC progression. (A) Under standard growth conditions, cultured Col-0 and ein2-1 cells have opposite levels of ethylene (blue) and NO (yellow) production with a similar proliferation activity controlled by appropriate regulation of CDKs and CYCs. (B) Treatment of Col-0 cells with low NO concentrations (narrow yellow arrow) results in stimulation of G1-to-S phase transition due to increased expression of CDKA;1 and CYCD3;1. (C) In ein2-1 cells with high endogenous NO, low concentrations of NO supplied do not affect either the index of S-phase cells or the expression of CDKs and CYCs leading to unchanged CC progression. (D) At high levels of exogenous NO (wide yellow arrow), in Col-0 cells, the expression of CC-related genes is reduced and concomitantly CC progression slows down. (E) Treatment of ein2-1 cells with high NO concentrations on the background of the high endogenous NO level have no significant effect on the expression of CC-associated genes but a sharp reduce in the number of S-phase cells indicates a stop in G1/S transition most likely due to NO-dependent post-translational modifications (NO-PTM) of the CC-related proteins.
To our knowledge, this is the first report demonstrating EIN2-dependent NO-provoked CC regulation in cultured plant cells. The data presented here point to the similarity of NO effects on the CC progression in cells of whole plants and in vitro cultured plant cells and, moreover, show the similarity of these effects to those in animal cells. Perhaps, most importantly, the NO-dependent effects on the CC progression, which were revealed in our work, provide a possible link to the functioning of ethylene signaling pathway(s).
Author Contributions
GN Designed and supervised most of the experiments and contributed to the writing of the paper; LM Contributed to the design of the experiments and the writing of the paper; AN Contributed to the design of the experiments and the writing of the paper. Contributed to the drawing up of the integrated model presented in Figure 5; AF provided technical support in maintaining the cell cultures and drawing up figures presented; KM undertook the qRT-PCR experiments; AM undertook all NO donor treatments and flow-cytometry based experiments; ES designed and supervised the flow-cytometry based experiments; VR undertook ethylene measurements; MH was involved in discussion on experimental design and contributed to the writing of the paper.
Conflict of Interest Statement
The authors declare that the research was conducted in the absence of any commercial or financial relationships that could be construed as a potential conflict of interest.
Acknowledgments
This work is supported by grants from the Russian Science Foundation No. 14-24-00020 (for GN, KM, and AM), by a BBSRC Institute Strategic Programme Grant (BBS/E/W/10964A01A) (for LM), and the Russian Foundation for Basic Research No. 14-04-00333 (for AN), No. 16-34-00834 (for AF). The flow cytometry assays were performed with the equipment granted by Lomonosov Moscow State University Program of Development.
Supplementary Material
The Supplementary Material for this article can be found online at: http://journal.frontiersin.org/article/10.3389/fphys.2017.00142/full#supplementary-material
Figure S1. Microphotographs of Arabidopsis thaliana cultured cells of wild type (Col-0) and ethylene-insensitive mutant ein2-1. Bar scales are 20 μm.
Figure S2 (video). NO visualization within Arabidopsis thaliana (Col-0) cells represented as sequential series of the cell's optical sections stained with DAF-FM DA (Axio Imager Z2 with ApoTome.2 function).
Figure S3. Expression of ERF1 (At4g20550) in Col-0 and ein2-1 cultured cells at day two of sub-cultivation as detected using RT-PCR. Primers used for amplification were (F) TTCAGTCCCCATTCTCCGGC, (R) GCCGTCGTCTTACGCCTCTG. The numbers under the bands indicate the expression of ERF1 relative to AtUBQ10 expression used as the reference gene. Arrow indicates the fragment size (bp).
References
Alonso, J. M., Hirayama, T., Roman, G., Nourizadeh, S., and Ecker, J. R. (1999). EIN2, a bifunctional transducer of ethylene and stress responses in Arabidopsis. Science 284, 2148–2152. doi: 10.1126/science.284.5423.2148
An, F., Zhao, Q., Ji, Y., Li, W., Jiang, Z., Yu, X., et al. (2010). Ethylene-induced stabilization of ETHYLENE INSENSITIVE3 and EIN3-LIKE1 is mediated by proteasomal degradation of EIN3 binding F-box 1 and 2 that requires EIN2 in Arabidopsis. Plant Cell 22, 2384–2401. doi: 10.1105/tpc.110.076588
Astier, J., and Lindermayr, C. (2012). Nitric oxide-dependent posttranslational modification in plants: an update. Int. J. Mol. Sci. 13, 15193–15208. doi: 10.3390/ijms131115193
Bai, S., Li, M., Yao, T., Wang, H., Zhang, Y., Xiao, L., et al. (2012). Nitric oxide restrain root growth by DNA damage induced cell cycle arrest in Arabidopsis thaliana. Nitric Oxide 26, 54–60. doi: 10.1016/j.niox.2011.12.001
Bisson, M. M., Bleckmann, A., Allekotte, S., and Groth, G. (2009). EIN2, the central regulator of ethylene signalling, is localized at the ER membrane where it interacts with the ethylene receptor ETR1. Biochem. J. 424, 1–6. doi: 10.1042/BJ20091102
Chang, K. N., Zhong, S., Weirauch, M. T., Hon, G., Pelizzola, M., Li, H., et al. (2013). Temporal transcriptional response to ethylene gas drives growth hormone cross-talk in Arabidopsis. eLife. 2:e00675. doi: 10.7554/eLife.00675
Cho, Y. H., and Yoo, S. D. (2015). Novel connections and gaps in ethylene signaling from the ER membrane to the nucleus. Front. Plant Sci. 5:773. doi: 10.3389/fpls.2014.00733
Correa-Aragunde, N., Graziano, M., Chevalier, C., and Lamattina, L. (2006). Nitric oxide modulates the expression of cell cycle regulatory genes during lateral root formation in tomato. J. Exp. Bot. 57, 581–588. doi: 10.1093/jxb/erj045
Cui, X., Zhang, J., Ma, P., Myers, D. E., Goldberg, I. G., Sittler, K. J., et al. (2005). cGMP-independent nitric oxide signaling and regulation of the cell cycle. BMC Genomics. 6:51. doi: 10.1186/1471-2164-6-151
de Jager, S. M., Scofield, S., Huntley, R. P., Robinson, A. S., den Boer, B. G., and Murray, J. A. (2009). Dissecting regulatory pathways of G1/S control in Arabidopsis: common and distinct targets of CYCD3; 1, E2Fa and E2Fc. Plant Mol. Biol. 71, 345–365. doi: 10.1007/s11103-009-9527-5
De Veylder, L., Beeckman, T., and Inzé, D. (2007). The ins and outs of the plant cell cycle. Nat. Rev. 8, 655–665. doi: 10.1038/nrm2227
Delledonne, M., Xia, Y., Dixon, R. A., and Lamb, C. (1998). Nitric oxide functions as a signal in plant disease resistance. Nature 394, 585–588. doi: 10.1038/29087
Dewitte, W., and Murray, J. A. (2003). The plant cell cycle. Annu. Rev. Plant Biol. 54, 235–264. doi: 10.1146/annurev.arplant.54.031902.134836
Dorée, M., and Galas, S. (1994). The cyclin-dependent protein kinases and the control of cell division. FASEB J. 8, 1114–1121.
Etchells, J. P., Provost, C. M., and Turner, S. R. (2012). Plant vascular cell division is maintained by an interaction between PXY and ethylene signalling. PLoS Genet. 8:e1002997. doi: 10.1371/journal.pgen.1002997
Floryszak-Wieczorek, J., Milczarek, G., Arasimowicz, M., and Ciszewski, A. (2006). Do nitric oxide donors mimic endogenous NO-related response in plants? Planta 224, 1363–1372. doi: 10.1007/s00425-006-0321-1
Fomenkov, A. A., Nosov, A. V., Rakitin, V. Y., Sukhanova, E. S., Mamaeva, A. S., Sobol'kova, G. I., et al. (2015). Ethylene in the proliferation of cultured plant cells: regulating or just going along? Rus. J. Plant Physiol. 62, 815–822. doi: 10.1134/S1021443715060059
Guo, H., and Ecker, J. R. (2003). Plant responses to ethylene gas are mediated by SCFEBF1/EBF2-dependent proteolysis of EIN3 transcription factor. Cell 115, 667–677. doi: 10.1016/S0092-8674(03)00969-3
Hayat, S., Hasan, S. A., Mori, M., Fariduddin, Q., and Ahmad, A. (2009). “Nitric Oxide: chemistry, biosynthesis, and physiological role,” in Nitric Oxide in Plant Physiology, eds S. Hayat, M. Mori, J. Pichtel, and A. Ahmad (Germany: Wiley-VCH), 1–16.
Inzé, D., and De Veylder, L. (2006). Cell cycle regulation in plant development. Annu. Rev. Genet. 40, 77–105. doi: 10.1146/annurev.genet.40.110405.090431
Komaki, S., and Sugimoto, K. (2012). Control of the plant cell cycle by developmental and environmental cues. Plant Cell Physiol. 53, 953–964. doi: 10.1093/pcp/pcs070
Kotogány, E., Dudits, D., Horváth, G. V., and Ayaydin, F. (2010). A rapid and robust assay for detection of S-phase cell cycle progression in plant cells and tissues by using ethynyl deoxyuridine. Plant Methods 6:5. doi: 10.1186/1746-4811-6-5
Kumar, S., Barthwal, M. K., and Dikshit, M. (2010). Cdk2 nitrosylation and loss of mitochondrial potential mediate NO-dependent biphasic effect on HL-60 cell cycle. Free Rad. Biol. Med. 48, 851–861. doi: 10.1016/j.freeradbiomed.2010.01.004
Lindermayr, C., Saalbach, G., Bahnweg, G., and Durner, J. (2006). Differential inhibition of Arabidopsis methionine adenosyltransferases by protein S-nitrosylation. J. Biol. Chem. 281, 4285–4291. doi: 10.1074/jbc.M511635200
Lorenzo, O., Piqueras, R., Sánchez-Serrano, J. J., and Solano, R. (2003). ETHYLENE RESPONSE FACTOR1 integrates signals from ethylene and jasmonate pathways in plant defense. Plant Cell 15, 165–178. doi: 10.1105/tpc.007468
Love, J., Björklund, S., Vahala, J., Hertzberg, M., Kangasjärvi, J., and Sundberg, B. (2009). Ethylene is an endogenous stimulator of cell division in the cambial meristem of Populus. Proc. Natl. Acad. Sci. U.S.A. 106, 5984–5989. doi: 10.1073/pnas.0811660106
Manjunatha, G., Gupta, K. J., Lokesh, V., Mur, L. A. J., and Neelwarne, B. (2012). Nitric oxide counters ethylene effects on ripening fruits. Plant Signal. Behav. 7, 476–483. doi: 10.4161/psb.19523
Menges, M., de Jager, S. M., Gruissem, W., and Murray, J. A. H. (2005). Global analysis of the core cell cycle regulators of Arabidopsis identifies novel genes, reveals multiple and highly specific profiles of expression and provides a coherent model for plant cell cycle control. Plant J. 41, 546–566. doi: 10.1111/j.1365-313X.2004.02319.x
Menges, M., Samland, A. K., Planchais, S., and Murray, J. A. H. (2006). The D-type cyclin CYCD3;1 is limiting for the G1-to-S-phase transition in Arabidopsis. Plant Cell 18, 893–906. doi: 10.1105/tpc.105.039636
Mira, M., Adel, E.-S., and Stasolla, C. (2015). Ethylene is integrated into nitric oxide regulation of Arabidopsis somatic embryogenesis. J. Genet. Eng. Biotechnol. 13, 7–17. doi: 10.1016/j.jgeb.2015.01.001
Mishina, T. E., Lamb, C., and Zeier, J. (2007). Expression of a nitric oxide degrading enzyme induces a senescence programme in Arabidopsis. Plant Cell Environ. 30, 39–52. doi: 10.1111/j.1365-3040.2006.01604.x
Mur, L. A. J., Laarhoven, L. J. J., Harren, F. J. M., Hall, M. A., and Smith, A. R. (2008). Nitric oxide interacts with salicylate to regulate biphasic ethylene production during the hypersensitive response. Plant Physiol. 148, 1537–1546. doi: 10.1104/pp.108.124404
Mur, L. A. J., Mandon, J., Persijn, S., Cristescu, S. M., Moshkov, I. E., Novikova, G. V., et al. (2013). Nitric oxide in plants: an assessment of the current state of knowledge. AoB Plants 5:pls052. doi: 10.1093/aobpla/pls052
Mur, L. A. J., Sivakumaran, A., Mandon, J., Cristescu, S. M., Harren, F. J. M., and Hebelstrup, K. H. (2012). Haemoglobin modulates salicylate and jasmonate/ethylene-mediated resistance mechanisms against pathogens. J. Exp. Bot. 63, 4375–4387. doi: 10.1093/jxb/ers116
Napoli, C., Paolisso, G., Casamassimi, A., Al-Omran, M., Barbieri, M., Sommese, L., et al. (2013). Effects of nitric oxide on cell proliferation. J. Am. Coll. Cardiol. 62, 89–95. doi: 10.1016/j.jacc.2013.03.070
Niu, Y.-H., and Guo, F.-Q. (2012). Nitric oxide regulates dark-induced leaf senescence through EIN2 in Arabidopsis. J. Integr. Plant Biol. 54, 516–525. doi: 10.1111/j.1744-7909.2012.01140.x
Norbury, C., and Nurse, P. (1992). Animal cell cycle and their control. Annu. Rev. Biochem. 61, 441–470. doi: 10.1146/annurev.bi.61.070192.002301
Nosov, A. V., Fomenkov, A. A., Mamaeva, A. S., Solovchenko, A. E., and Novikova, G. V. (2014). Extra perspectives of 5-ethynyl-2'-deoxyuridine click reaction with fluorochrome azides to study cell cycle and deoxyribonucleoside metabolism. Rus. J. Plant Physiol. 61, 899–909. doi: 10.1134/S1021443714060144
Ortega-Martínez, O., Pernas, M., Carol, R. J., and Dolan, L. (2007). Ethylene modulates stem cell division in the Arabidopsis thaliana root. Science 317, 507–510. doi: 10.1126/science.1143409
Ötvös, K., Pasternak, T. P., Miskolczi, P., Domoki, M., Dorjgotov, D., Szücs, A., et al. (2005). Nitric oxide is required for, and promotes auxin-mediated activation of, cell division and embryogenic cell formation but does not influence cell cycle progression in alfalfa cell cultures. Plant J. 43, 849–860. doi: 10.1111/j.1365-313X.2005.02494.x
Para-Lobato, M. C., and Gomez-Jimenes, M. C. (2011). Polyamine-induced modulation of gene involved in ethylene biosynthesis and signaling pathways and nitric oxide production during olive mature fruit abscission. J. Exp. Bot. 62, 4447–4465. doi: 10.1093/jxb/err124
Pfaffl, M. W. (2001). A new mathematical model for relative quantification in real-time RT-PCR. Nucleic Acid Res. 29:e45. doi: 10.1093/nar/29.9.e45
Rakitin, V. Y., and Rakitin, L. Y. (1986). Determination of gas exchange and ethylene, carbon dioxide, and oxygen contents in plant tissues. Sov. Plant Physiol. 33, 403–413.
Schenk, R. U., and Hildebrandt, A. (1972). Medium and techniques for induction and growth of monocotyledonous and dicotyledonous plant cell cultures. Can. J. Bot. 50, 199–204. doi: 10.1139/b72-026
Shen, Q., Wang, Y., Tian, H., and Guo, F. (2013). Nitric oxide mediates cytokinin functions in cell proliferation and meristem maintenance in Arabidopsis. Mol. Plant 6, 1214–1225. doi: 10.1093/mp/sss148
Skirycz, A., Claeys, H., De Bodt, S., Oikawa, A., Shinoda, S., Andriankaja, M., et al. (2011). Pause-and-stop: the effects of osmotic stress on cell proliferation during early leaf development in Arabidopsis and a role for ethylene signaling in cell cycle arrest. Plant Cell 23, 1876–1888. doi: 10.1105/tpc.111.084160
Stepanchenko, N. S., Fomenkov, A. A., Moshkov, I. E., Rakitin, V. Y., Novikova, G. V., and Nosov, A. V. (2012). Phytohormone interplay controls proliferation of in vitro cultivated cells of Arabidopsis thaliana ethylene-insensitive mutants. Doklady Biol. Sci. 442, 46–49. doi: 10.1134/S0012496612010139
Takagi, K., Isobe, Y., Yasukawa, K., Okouchi, E., and Suketac, Y. (1994). Nitric oxide blocks the cell cycle of mouse macrophage-like cells in the early G2+M phase. FEBS Lett. 340, 159–162. doi: 10.1016/0014-5793(94)80128-2
Tanner, F. C., Meier, P., Greutert, H., Champion, C., Nabel, E. G., and Luscher, T. F. (2000). Nitric oxide modulates expression of cell cycle regulatory proteins: a cytostatic strategy for inhibition of human vascular smooth muscle cell proliferation. Circulation 101, 1982–1989. doi: 10.1161/01.CIR.101.16.1982
Thomas, D. D., Ridnour, L. A., Isenberg, J. S., Ridnour, A. L., Isenberg, J. S., Flores-Santana, W., et al. (2008). The chemical biology of nitric oxide: implications in cellular signaling. Free Rad. Biol. Med. 45, 18–31. doi: 10.1016/j.freeradbiomed.2008.03.020
Van Leene, J., Hollunder, J., Eeckhout, D., Persiau, G., Van De Slijke, E., Stals, H., et al. (2010). Targeted interactomics a complex core cell cycle machinery in Arabidopsis thaliana. Mol. Syst. Biol. 6, 397. doi: 10.1038/msb.2010.53
Vandesompele, J., De Preter, K., Pattyn, F., Poppe, B., Van Roy, N., De Paepe, A., et al. (2002). Accurate normalization of real-time quantitative RT-PCR data by geometric averaging of multiple internal control genes. Genome Biol. 3:0034.1–0034.11. doi: 10.1186/gb-2002-3-7-research0034
Keywords: Arabidopsis thaliana, cell culture, cell cycle, cell proliferation, ethylene, nitric oxide
Citation: Novikova GV, Mur LAJ, Nosov AV, Fomenkov AA, Mironov KS, Mamaeva AS, Shilov ES, Rakitin VY and Hall MA (2017) Nitric Oxide Has a Concentration-Dependent Effect on the Cell Cycle Acting via EIN2 in Arabidopsis thaliana Cultured Cells. Front. Physiol. 8:142. doi: 10.3389/fphys.2017.00142
Received: 14 November 2016; Accepted: 23 February 2017;
Published: 10 March 2017.
Edited by:
M. Iqbal R. Khan, International Rice Research Institute, PhilippinesReviewed by:
Weibiao Liao, Gansu Agricultural University, ChinaYi Wang, Institute for Horticultural Plants, College of Horticulture, China Agricultural University, China
Palakolanu Sudhakar Reddy, International Crops Research Institute for the Semi-Arid Tropics (ICRISAT), India
Copyright © 2017 Novikova, Mur, Nosov, Fomenkov, Mironov, Mamaeva, Shilov, Rakitin and Hall. This is an open-access article distributed under the terms of the Creative Commons Attribution License (CC BY). The use, distribution or reproduction in other forums is permitted, provided the original author(s) or licensor are credited and that the original publication in this journal is cited, in accordance with accepted academic practice. No use, distribution or reproduction is permitted which does not comply with these terms.
*Correspondence: Galina V. Novikova, gv.novikova@mail.ru