 Chara Ch. Mitropoulou
 Iordanis A. Naziris
 Nikos Ath. Kallioras1
 Nikos D. Lagaros
- 1Institute of Structural Analysis and Antiseismic Research, School of Civil Engineering, National Technical University of Athens, Athens, Greece
- 2Special Service of European Union Structural Funds for the Ministry of Maritime Affairs and Insular Policy, Piraeus, Greece
The coupled lateral-torsional response is observed in building structures subjected to dynamic excitation due to lack of symmetry in terms of mass/stiffness in any of the stories’ plan views; such structural systems are called eccentric. Much damage and even collapse are concerned with building structures with asymmetric plan views. Combined torsional-translational vibration of their structural system results in higher ductility demands, especially to vertical structural elements located at the perimeter of the plan view. This study examines the minimization problem of the torsional response of an eccentric, multi-story reinforced concrete (RC) building by strengthening its vertical structural elements with RC jackets. The problem of minimizing the eccentricity between mass and rigidity centers for all story layouts and the corresponding minimization problem of the eccentricity between mass and strength centers for all stories are considered two separate formulations for the reduction of the torsional response optimization problem. Based on recent studies, the center of strength is preferable for assessing the torsional response of buildings in case of inelastic response. The imperialist competitive algorithm (ICA), a member of the family of evolutionary search algorithms, is used to solve the two optimization problems. The optimization problems are formulated for the case study building considered after assessing its structural behavior and capacity through nonlinear static analyses before and after strengthening. The later process was implemented to meet code requirements and examine the improvements achieved through optimization.
1 Introduction
During the structural design phase, which remains the subject of research for engineers and scientists, the goal is to develop a structural system that can reliably and predictably withstand dynamic excitation (i.e., due to extreme actions such as blast loading or seismic excitation). Coupling translational with torsional response can be observed due to either variance between actual and considered mass distribution and stiffness or dynamic excitations that introduce a torsional component on the structural response. This component is developed due to eccentricity between the centers of mass (CM) and rigidity (CR) of the structural system. Such a structural system is called eccentric or torsionally unbalanced. When this kind of structural system is subject to horizontal dynamic excitations, the inertia forces developed can be represented by point loads passing through the mass center, while the forces modeling the resisting extreme action can be represented as point loads passing through the stiffness center. This pair of opposing point loads generates the torsional component of the response on the structural system coupled with the translational one.
It is worth mentioning that the foundations of modern research on the dynamic behavior of single and multi-story asymmetric structures were set by a series of studies that identified some of the key parameters influencing the performance of such systems. For instance, Goel and Chopra (1990) and Kan and Chopra (1977) identified and assessed the distribution of stiffness and strength and the torsional coupling, respectively. Further influential studies regarding the response of one-story structures are included in the works of Peruš and Fajfar (2005), Palermo et al. (2013), Palermo et al. (2017), and Trombetti and Conte (2005). Additionally, Fajfar (2000) and Fischinger (Fajfar and Fischinger, 1988; Fajfar and Gašperšič, 1996; Marušić and Fajfar, 2005) analyzed the nonlinear response of multi-story buildings under seismic loads. Bosco et al. (2012), Bosco et al. (2013), Bosco et al. (2015) also approached the behavior of multi-story asymmetric buildings, while De Stefano and Pintucchi (2008) presented a useful overview of the research advancements about the seismic response of both the plan and vertically irregular structures.
As proved by Kan and Chopra (1977) and presented in more detail by Reem and Chopra (1987), accurate and reliable prediction and assessment of the response of eccentric multi-story buildings in the elastic stage cannot be determined because, in multi-story buildings, except in a special case, the center of rigidity is not defined unambiguously but depends on seismic loading. Eurocode 8 (1994) and its Greek national annex provided the definition of a fictitious axis of rotation (optimum torsion axis) from which static eccentricity is measured. Regarding the post-elastic structural response stage, things are even vaguer. For example, Stathopoulos and Anagnostopoulos (2005) questioned the adoption of a single coefficient of behavior q provided by modern earthquake design provisions. However, during the past 30 years, research efforts were performed in this direction (estimating and predicting the response of eccentric buildings), and various design criteria/estimation of torsional action have been proposed (Stathi et al., 2015).
In buildings designed with older regulations (before 1995 and especially before 1985), significant non-uniformities are observed during the formation of the static system. On the contrary, new buildings are characterized by greater regularity, thanks to the provisions of modern earthquake design codes (Anastassiadis et al., 1998; Makarios and Anastassiadis, 1998; Xenidis et al., 2006). Modern earthquake design codes try to provide general directions (simple as possible structural systems, arrangement of strong stiffness elements in the perimeter, etc.), aiming to derive as rigid as possible buildings but also with limitations in terms of geometry and distribution of stiffness and mass along the height and floor plans. However, in relevant provisions based on simplified shear-beam, one-story models, the “flexible” side frames exhibit higher ductility demands than the “stiff” side ones (Stathopoulos and Anagnostopoulos, 2005). The advancements of computational techniques and algorithms have allowed scientists in several fields to approach multiple complex problems in new and efficient ways. Particularly in engineering, such techniques have significantly contributed to the shift from traditional trial-and-error practices to fully automated ones, incorporating search algorithms. There are many examples from the past where researchers have explored the potential of implementing optimization approaches to structural engineering challenges. Furthermore, the behavior of asymmetric structures subjected to horizontal loads, such as earthquakes, especially regarding their torsional response, is addressed in numerous research studies, which in some cases also incorporate optimization approaches to solve the arising problems.
Specifically, Terzi and Athanatopoulou (2021) proposed a measure to define the optimum torsion axis through the twist axis. This measure demands the sum of story translational displacements of the axis to be minimal. Dang et al. (2021) developed a two-stage optimization approach for designing isolated buildings incorporating genetic algorithms to identify the optimal parameters of the isolated layer. Almazán and de la Llera (2009) showed that the optimal damper location depends on the static eccentricity and frequency ratio of the bare structure, the total amount of supplemental damping considered, and the frequency content of the excitation. Li and Han (2003) optimized the positioning of multiple tuned mass dampers (MTMD) for asymmetric structures, while Ismail (2015) aimed at forcing the isolated asymmetric structures to behave as symmetric structures, eliminating torsional responses. Similarly, Georgoussis (2015) suggested a way to minimize the torsional response of inelastic multi-story buildings with simple eccentricity, and Yiu et al. (2014) introduced a practical method for evaluating lateral-torsional coupling in the elastic earthquake response of asymmetric multi-story buildings. In order to minimize the torsional effects in asymmetric tall buildings, Şahin (2012) proposed a new algorithm in MATLAB. Lagaros et al., in two studies (2006 and 2009), developed optimum design approaches for improving the seismic performance of 3D RC buildings, including the minimization of the rigidity eccentricity. In the same context, Duan and Chandler (1997) developed an optimized procedure for designing torsionally unbalanced structures subjected to earthquake loading, considering both the serviceability and the ultimate limit states. Three studies (Li et al., 2008a; Li et al., 2008b; Li et al., 2008c) extensively dealt with the properties of soil-asymmetric building-active multiple tuned mass dampers (AMTMD) interaction system, suggesting guidelines for the design and implementation in earthquake reduction of asymmetric structures built on soft soil foundation. Guo and Li (2009) established a model of primary-secondary systems concerning lateral-torsion coupling and interaction between primary and secondary systems and used a complex mode theory and pattern research method for the secondary system’s optimal position. They also analyzed the influencing factors of optimal position, such as eccentricity of the primary system, direction of earthquake input, site of different classification, mass, frequency, and damping ratio of the secondary system. Chandler et al. (1995) examined the influence of accidental eccentricity on inelastic seismic torsional effects in buildings reaching some useful conclusions regarding the effectiveness of code accidental torsional provisions and the ductility demand for the flexible-edge element in torsionally unbalanced structures. Finally, Etedali and Kareshk (2022) proposed a procedure for the optimal design of isolators in the base story of asymmetric base-isolated structures to mitigate torsional responses. In this work, the minimum eccentricity optimization problem is formulated for the case of multi-story reinforced concrete (RC) building structures associated with the problem of selecting the characteristics of their vertical structural elements strengthening strategy. In order to offer the designer/practitioner a tool to understand the procedures described in the study, an open-access web application is provided, where optimization-based strengthening is provided, among others (LINK).
2 Eccentricity in Multi-Story Building Structures
2.1 Equations of Motion
Contrary to what is observed for the case of single-story building structures, in the case of multi-story ones, the centers of mass, rigidity, and strength do not lie over a vertical axis. Another difference observed in the case of multi-story buildings is that the locations of the centers of stiffness, twist, and shear depend on the stiffness of the system and the torsional or lateral loads exerted. However, a special type of multi-story buildings can be designed where, in each story, these centers coincide, laying over a common, vertical axis independent of lateral loading. The typical centers that can be defined for each story of the multi-story building are the following: stiffness center (also called rigidity center) is the location on each floor where any set of static horizontal forces of arbitrary magnitude and direction is applied to cause no rotation or twisting on any of the stories (Hejal and Chopra, 1989). Another definition of the stiffness center of a building is that it corresponds to the location on each floor where if a static horizontal force is applied, it develops translational deformation without rotation or twisting. However, the rest of the floors may rotate or twist (Humar, 1984). The principal axes of a floor are two orthogonal axes passing through its center of rigidity. If a set of static horizontal loads is applied along one of the two principal axes of each floor, then the floor is deformed along the direction of the applied loads, without a twist. The mass center is the location on the diaphragm where the component of the inertial forces of the floor passes. If the masses of the vertical elements are negligible compared to those of the floor and the mass distribution on the floors of the building is uniform, then the center of mass coincides with the geometric center of the floor. The static eccentricity of the ith story refers to the distance between mass and stiffness centers.
The equations of motion of a multi-story building, considering linear behavior, where damping is ignored for simplicity in the description, for the case of a dynamic action along the x- and y-axis, developing accelerations
with reference to the center of mass CM,
with reference to the rigidity center CR,
where
where scalars
2.2 Location of Stiffness or Rigidity Center
To calculate the coordinates of the stiffness center (also called rigidity center) for the case of a multi-story building structure, let us consider the stiffness matrix of Eq. 1, which is defined according to degrees of freedom (DOF)
Thus,
where
Thus, solving the system of Eq. 7a, Eq. 7b, with respect to the unknowns
However, Eq. 8a, Eq. 8b do not always lead to diagonal matrices, thus unique definition of the centers of stiffness. Unique locations of stiffness centers do not always exist. They depend on loading; that is, different load distributions lead to different locations of the stiffness centers. In such a case, the coordinates of the stiffness centers can be derived through the following procedure:
where static lateral loads are introduced along the height of the building structure, leading to the following expressions:
where
2.3 Location of Strength Center
As mentioned earlier, the regulations are based on an elastic response; the simulation of the torsional effect, however, needs to consider the inelastic state of the body (determination of the torsional axis in the inelastic phase, ability to receive the shear forces of torsion from the structural elements) that will determine the collapse mechanisms of the building and thus give the ability to the engineer to estimate the required ductility of the components and compare it with the available one. There are many relevant ones in the literature (e.g., Stathopoulos and Anagnostopoulos, 2005). It has been proposed to replace the rigidity center (CR) with that of the strength center (CV). The center of strength (CV) is the position of the diaphragm through which the recommended strength of all vertical elements passes. Strictly unrestrained is a building whose mass and stiffness centers are not identical (eccentric) (Paulay, 1998; Penelis and Penelis, 2019). According to the above, the CV endurance center is determined as follows:
where
with
3 Strengthening of RC Building Structures
Several options are available for intervention aiming to retrofit structures (Costa et al., 2017; Ganguly, 2020). 1) Repair–reinforcement of critical areas on existing structural elements: jacketing is the most popular method of this category, contributing to strengthening and retrofitting structural elements. It is adopted to upgrade bearing load capacity based on improvements on the structural design or restore its integrity due to failures on the structural elements (steel jacketing, reinforced concrete jacketing, glass fiber reinforced polymer jacketing, fiber-reinforced polymer (FRP) jacketing, hybrid jacketing and shape memory alloy (SMA) wire jacketing, near-surface mounted (NSM) fiber-reinforced polymer (FRP) jacketing, etc.). 2) Add new load-bearing elements (new structural system, shear walls, steel frame, etc.): filling shear walls of the load-bearing frame structural system, expansion (reinforcement of existing brickwork, demolition of brickwork and addition of RC shear walls, steel stiffeners/dampers). 3) Addition of dampers: seismic isolation systems. All the above-mentioned options are part of a structural intervention strategy.
3.1 Structural Intervention Aiming to Remove Irregularities in the Floor Plan
In order to choose how and where to intervene in the building aiming to improve its structural performance is to increase stiffness and flexural strength of some structural elements selectively, for example, for the case of columns aiming to modify the location of the centers of elastic stiffness and strength and possibly minimize the corresponding eccentricities. According to Tassios (1982), a selective increase in stiffness takes place 1) after low-intensity random actions (e.g., low-intensity explosions and small earthquakes), 2) when the building is very flexible, and 3) when it is necessary to correct irregularities in the distribution of stiffness in height or extent. Selective increase of flexural strength occurs due to 1) irregularity of strengths in height or plan (i.e., torsion might be observed during yield of some elements) and 2) insufficiency of flexural strength locally or damage of a structural element. Such problems require a selective increase in stiffness and flexural strength of the columns. The most suitable strengthening method is the use of reinforced concrete jacketing (Kanepe, 2017).
3.2 Column Jacketing
The construction of jackets on RC columns is a repair and reinforcement method successfully applied in numerous cases. The method is used to repair or strengthen the element (local or total jacketing). In addition to improving the three basic features of the column, jacketing also does not affect the architectural characteristics of the strengthened section, reduces slenderness of the strengthened element, improves the structural performance of the columns due to confinement, and increases the level of fire protection. Based on the type of concrete, jacketing is classified into two different categories. Jacketing made of cast concrete is used in jackets where the thickness exceeds 8 cm (t ≥ 8 cm), while their construction requires formwork. Casting is implemented by means of low pressure, and the size of the aggregates should not be large. The use of fluids and admixtures that prevent drying shrinkage is recommended. The disadvantages of this technique are the difficulty of concreting, especially at the top of the column. In cases where the total thickness is less than 10 cm (t ≤ 10 cm), Jacketing made of sprayed/shot concrete is used, while no formwork is required for pouring or placing into them. Particular attention should be paid to ensuring the vertical surface of the jackets via guides usage. The drying shrinkage in this type of concrete jackets is greater. Thus, proper maintenance is required.
The construction provisions of RC jackets are the result of research and experience from the application of the method in practice: For sprayed/shot concrete jacketing, the minimum thickness must be 5 cm; for cast concrete jacketing with one row of reinforcements, the thickness must be 8–12 cm; and for cast concrete jacketing with two rows of reinforcement, the minimum thickness must be 12 cm. In the case where the thickness of the jacketing is small (i.e., less than 7.50 cm), the provisions of the concrete regulations related to the coatings of the reinforcement bars are not satisfied together with those related to the form of hooks at the ends of the stirrups. Thus, in case of a small thickness of the jacket, the ends of the stirrups need to be welded.
4 The Minimum Eccentricity Problem Combined With Columns Strengthening for RC Building Structures
4.1 Problem Formulation
The main objective of this study is to formulate optimization problems that will lead to the redesign of existing RC structures, which may have been reinforced to meet the required safety conditions of the applicable Regulations, in order to create designs with the minimal torsional response and therefore improved behavior. The wording used in this work is based on the problem of minimizing the
where
The notations marked in Figure 1 are the following:
where
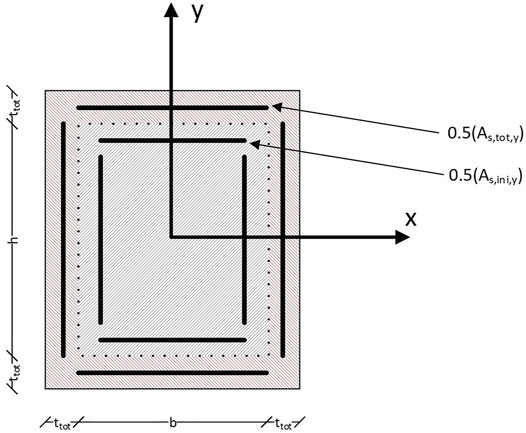
FIGURE 1. Strengthening of RC cross section to calculate its resistance to axial bending with axial force.
The following assumptions are considered for the implementation of the algorithm. First assumption: a common RC jacket is constructed with thickness
4.1.1 Calculation of the Objective Functions
The steps of the algorithm for calculating the rigidity eccentricity
Step 1: calculation of the moment of inertia along the directions of local axes x and y for each column by the method of the equivalent cross section.
Step 2: calculation of the cracked stiffness of the cross section for each column.
Step 3: calculation of CR stiffness center coordinates (for the pure frame or wall system).
Step 4: calculation of the objective function according to Eq.13a.
Accordingly, the steps of the algorithm for calculating the strength eccentricity
Step 1: discretization of the cross section according to Eq. 14b, Eq. 14a.
Step 2: calculation of bending moment resistance for combined loading of bending and axial loading. Given that the element is considered monolithic, its strength was reduced by coefficient
Step 3: calculation of shear strength considering a bending failure according to Eq. 12a, Eq. 12b.
Then, given that the shear strength of the columns is available along the two principal axes, the following steps are performed:
Step 4: calculation of the coordinates of the center of resistance.
Step 5: calculation of the objective function according to Eq.13b.
4.1.2 Data Entry
In order to introduce the information required by the problem formulation, a common matrix of the input data is used [data (N,14)], where
4.2 Solving the Optimization Problem
Search algorithms represent an iterative procedure that requires an initial guess of the problem solution. Then, a sequence of improved designs are generated until the optimal or the best compromise solution is achieved. The type of strategy that the algorithm relies on for generating the new designs categorizes the optimization procedure. The search algorithm is characterized by robustness, in which the algorithm needs to be able to handle a variety of problems efficiently; efficiency, in which the algorithm should not require too much computing power to converge; and accuracy in which the algorithm needs to be able to recognize an acceptable solution accurately, without being sensitive to arithmetic errors.
A fast algorithm may require too much storage to deal with problems with many design variables. On the contrary, a highly robust algorithm may require many iterations, thus increasing computational time to reach the optimal design. Some algorithms preserve part of the information from the previous designs, while others only use information from the current design. As far as the type of information, the algorithms are classified into zero-, first-, or second-order algorithms. Zero-order algorithms use the information obtained through objective function value only during the search process. First-order algorithms, in addition to the objective function value, make use of the information obtained through the first-order derivative of the objective function. In contrast, second-order algorithms, in addition to the objective function value and its first derivative, use the information obtained through the second-order derivative of the objective function.
Zero-order algorithms are divided into deterministic or mathematical and stochastic algorithms, depending on how the new designs are generated. In general, deterministic ones approach the optimal design very quickly. Their main disadvantage is that they are easily trapped in local minima. Stochastic algorithms search for the optimal solution through random processes, generating better designs based on the existing ones. They are not as easily trapped into local minima as deterministic algorithms. They require much more computing power to converge. For many years, deterministic algorithms were the exclusive tool for solving structural design optimization problems. However, stochastic algorithms have been explored since the 1960s. During the last 2 decades, stochastic algorithms have been extensively applied in the field of structural design optimization at the research level and have managed to provide solutions to particularly demanding and complex problems. Search algorithms are also classified into algorithms that, in each iteration, deal with one design only and those that deal with a population of designs. All deterministic algorithms deal with one design in each iteration. Concerning the stochastic algorithms, simulated annealing is the most popular search algorithm that also deals with one design in each iteration.
A large and very popular category of stochastic search algorithms that deal with a population of designs in each iteration are the well-known evolutionary or Darwinian algorithms. They usually model a natural, social, or biological process. Evolutionary algorithms are characterized by robustness and the ability to identify the area of the global optimum design due to the random search process. However, they require a large number of function evaluations. Genetic algorithms and evolution strategies are the best-known evolutionary algorithms. For dealing with the optimization problems addressed in the framework of the IMSFARE project, the imperialist competitive algorithm (ICA) was employed, which is briefly described in the next section.
4.3 Imperial Competitive Algorithm
ICA (Atashpaz-Gargari and Lucas, 2007) is an evolutionary search algorithm inspired by imperialist competition. So far, it has been used successfully in different optimization problems of numerous areas of engineering and science. The independent populations are called countries and are of two types, colonies and imperialists, all of which together form empires. The colonial/imperialistic competition between empires is the basis of the algorithm. During this competition, the weak empires collapse while the strong ones take over the colonies of the weak empires. This competition successfully converges to the stage where there is only one empire after the collapse of all the rest, whose colonies are positioned in the same location with the imperialist, having the same cost (i.e., the same objective function value). From one point of view, ICA can be considered the social equivalent of genetic algorithms. ICA is the mathematical model and computational simulation of human social evolution, while genetic algorithms are based on the biological evolution of species. Subsequently, the steps of the algorithm and how the imperialist competition between empires is modeled is provided in more detail.
Step 1 (creation of initial empires): like any other evolutionary algorithm, ICA starts with a random initial population (countries in the world). Some of the countries are chosen to be the colonialists/imperialists and the rest form the colonies of these imperialists. These original colonies are divided among the imperialists according to their power, proportional to their cost. It should be mentioned that the cost of a country (design) refers to the objective function value. Let
Depending on the initial cost of the countries, they are divided into
Thus, the original colonies pass into the possession of each colonialist and form the first empires, depending on the power of each colonialist according to the relation
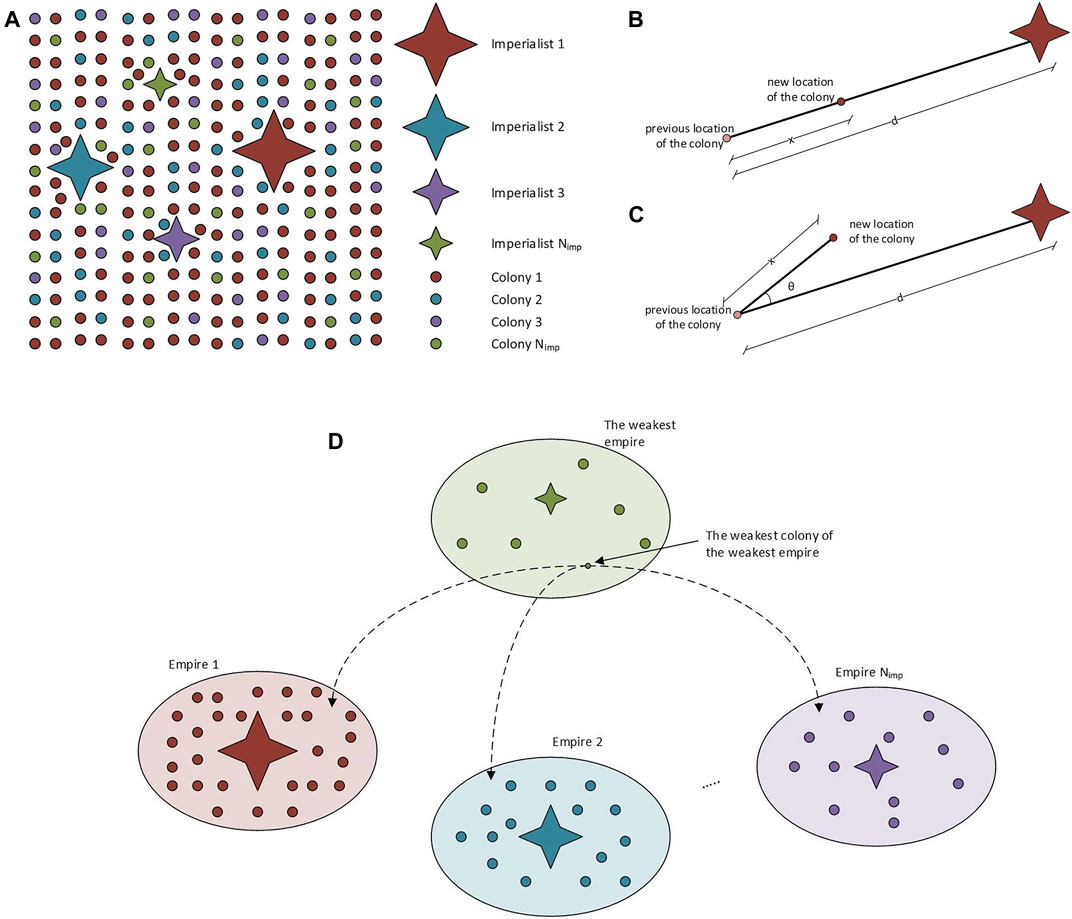
FIGURE 2. The imperial competitive algorithm. (A) Formation of the initial empires. (B) Movement of colonies toward their associated colonialist. (C) Moving colonies to their associated colonialist with a possible deviant address. (D) Imperialist competition. The stronger an empire, the more likely it is to take possession of the weakest colony of the weakest empire.
Step 2 (movement of colonies of an empire to the imperialist): once the colonies are divided into empires, they start moving toward their imperialist. In this way, the imperialists improve their colonies by moving the whole population of countries toward positions of lower cost. This movement takes place along the vector joining the colony to the imperialist, as shown in Figure 2B. The colony travels a distance of
Step 3 (change of position between the colonialist and a colony): if a colony moving toward the colonialist identifies a better position of lower cost than the colonialist, then they change their positions. In other words, this colony becomes the new colonialist of the empire. The algorithm continues with the new colonialist, and the colonies of the empire (including the former colonialist) move toward the new colonialist.
Step 4 (total power of the empire): The total cost of the nth empire is calculated as follows:
where the value
Step 5 (imperialist competition): imperialist rivalry gradually leads to loss of power for the weakest empires and strengthening the strongest ones, while all empires try to take possession of colonies of other empires. This is modeled in the algorithm by selecting some of the weakest colonies of the weakest empires and making competition between the other empires over who will acquire these colonies (Figure 2D). The empires with the greatest power are most likely to dominate this competition. The normalized cost of the empire is given by
Vector
Step 6 (exclusion of powerless empires): empires left without colonies are considered collapsing and excluded from the competition.
Step 7 (convergence): in the end, only one empire will remain (the most powerful) after the collapse of the rest, and all colonies will be under its occupation. At this point, all colonies are in the same place and have the same cost to each other as to the colonial. In this ideal world, there is no difference between colonies and the colonialist.
5 Numerical Tests
This section provides the numerical tests for describing the implementation of the proposed design framework to achieve the optimized strengthening of the vertical structural elements of an RC building structure. Aiming to assess and then minimize the torsional response, a three-story RC building structure is considered. The plan view, common for all stories, is gamma-shaped (Figure 3) with an area of 89 m2, and the storys’ height is equal to 3 m. It corresponds to a residential building and is located in the Municipality of Zografou (hazard zone Z1, according to the Greek hazard map for the city of Athens (Papazachos et al., 1993).
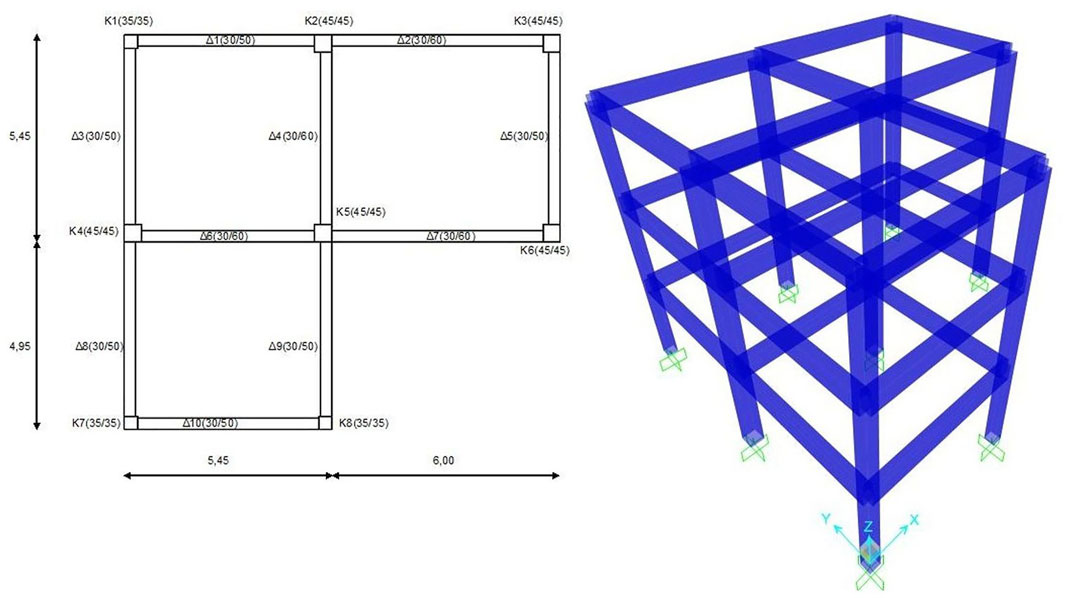
FIGURE 3. Typical floor plan of the case study building structure and its simulation.
The building is analyzed as a space frame structural system, where the contribution of infill walls on the structural response against the horizontal loads of the random action (e.g., explosion and earthquake) is neglected. Therefore, it is assumed that these loads are received from the other structural elements, namely, beams, columns, and shear walls, the first two of which are simulated with frame elements having 6-DOF. The slabs are not inserted in the model, but the diaphragm function of the floors is ensured by coupling the story’s model nodes, while the ground supports are considered to be fully fixed.
Some characteristics of the construction materials were used. Concrete: the original structural system was considered to use concrete of quality C20/25 with a modulus of elasticity Ecm = 29 Gpa. Given that the case study refers to an existing structure that will be assessed by means of inelastic analyses, the average strength is considered,
The vertical loads considered for assessing the building comply with Eurocode 1 (1995). Permanent loading: self-weight of slabs (considering the thickness of 18 cm) is equal to 4.5 kN/m2, roof covering 1.5 kN/m2, and infill walls 1.7 kN/m. Live loading: rooms 2.0 kN/m2. The elastic design spectrum used to evaluate the building in implementing the ATC-40 (Applied Technology Council, 1996) methodology was defined based on EC8. In the specific building, the parameters are Ζ1 (agR = 0.16), significance II (γI = 1.00), and ground B (ΤΒ = 0.15, ΤC = 0.50, TD = 2.50, S = 1.20). Initially, a maximum number of 12 eigenmodes is selected. As already mentioned, the vibrating mass is set for the combination of G + 0.3Q.
It is observed that the first eigenmode is the fundamental one for the Y direction with a mass participation rate of around 83%, while the second eigenmode is the fundamental one for the X direction with a participation rate of around 81%. The primary step in introducing the non-linearity of the members is to define the non-linear properties of the materials. For concrete failure, deformation in compression and bending was considered equal to 2‰ and 3.5‰, respectively, while for steel, the failure deformation was considered equal to 20‰. The ETABS for the extraction of the baring capacity curve during the static inelastic analysis is based on the step-by-step method, that is, the formation of concentrated plastic hinges on the elements until the establishment of the baring collapse mechanism implementing a force-control approach. The next step is the definition of the location of plastic hinges in the structural elements and the definition of their inelastic behavior, that is, the formation of their behavior curve in terms of the moment-chord rotation angle. Given the values of
For the calculations in the case of columns, it is necessary to determine the axial forces for the load combination G + 0.3Q (Table 1) for beams and columns. In Table 1, the first index for the column elements denotes the story and the second one its location in the plan view; that is, K34 is K4 (as denoted in Figure 4) at the third story. In Table 1, b and h refer to the dimensions of the rectangular cross section; db denotes the mean diameter of the longitudinal steel reinforcement; Lnet and Ls denote the net length of the element and the distance of extreme cross section from the location of zero bending moment, respectively; (1/R)y and (1/R)u represent the yield and ultimate capacity values of the curvature; and My and Mu symbolize the yield and ultimate bending capacity of the element. A plastic failure mode is selected, and then, depending on the element for which the plastic hinge is defined, the critical failure mode is selected (bending based for the beams and interaction of bending and axial one for the columns). The performance levels of the element are also defined on the curve. Note here that all elements were considered primary, and the positions of the plastic hinge formation are defined at the ends of the beams and columns.
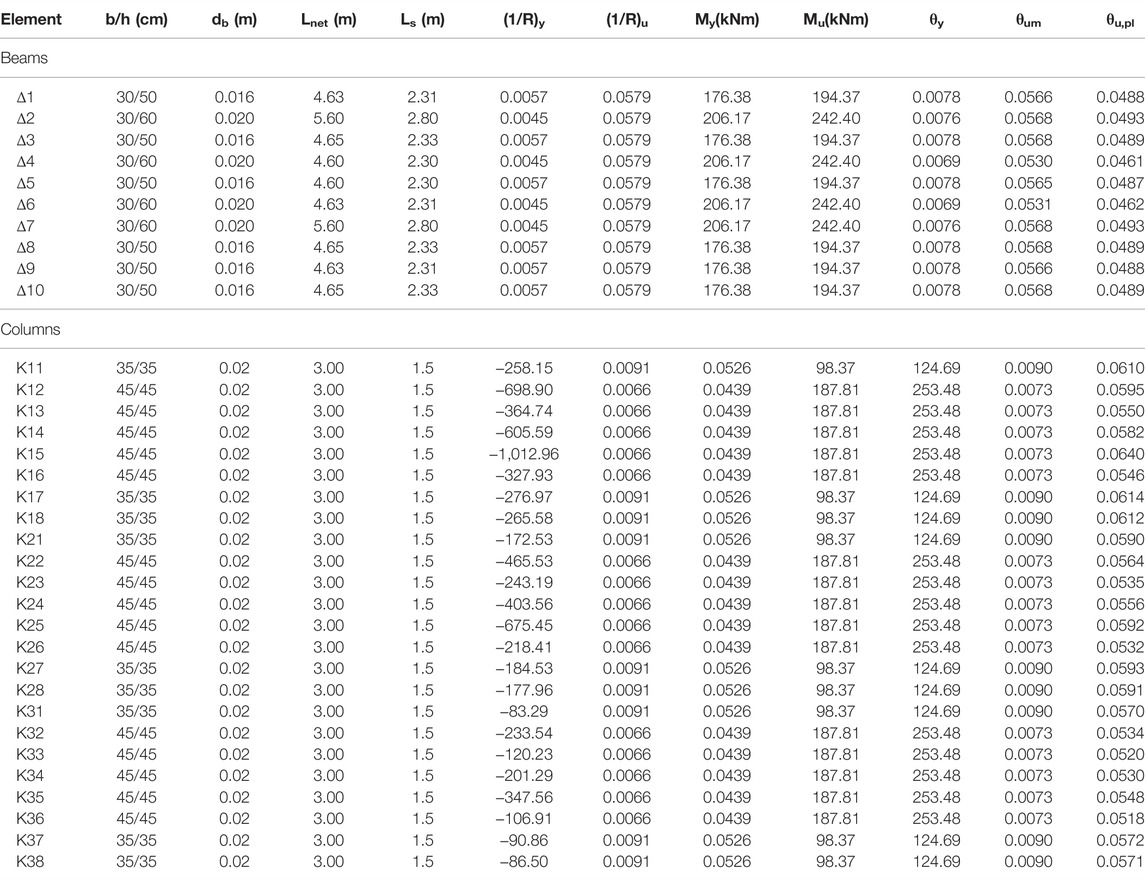
TABLE 1. Calculation of moment-chord rotation angles
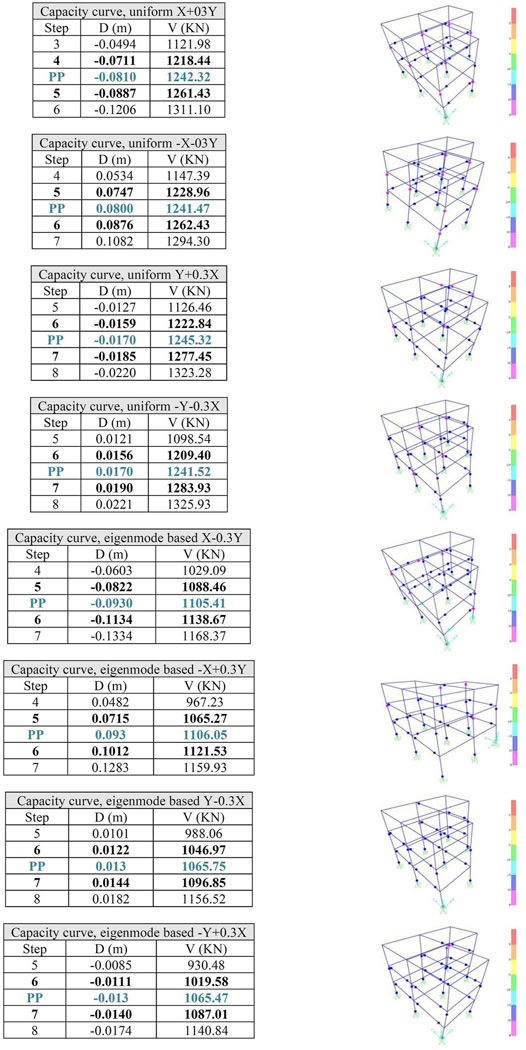
FIGURE 4. Deformation view of the structural system at the performance point for the different distributions of the horizontal loads.
5.1 Assessment of the Original RC Building Structural System
5.1.1 Distributions of Horizontal Loads
According to KANEPE, for the needs of the nonlinear static analyses, the application of at least two different load distributions in height is required. Thus, the “uniform” and the “eigenmode-based” distributions are used. The eigenmode-based distribution is in line with the shape of the fundamental eigenmode along the direction examined. As observed through the eigenmode analysis, the fundamental eigenmode along the X direction is the second one, while for the Y direction, it is the first. For spatial superposing of the random actions, the structure according to KANEPE is analyzed for loads in two directions, where the base shear relative contribution 10:3 and 3:10, “positive” and “negative” sign, is also considered and assessment takes place for the most unfavorable stress/strain quantities observed for each structural element. In particular for both uniform and eigenmode-based distribution + X + 0.3Y and + X−0.3Y (positive direction X); X + 0.3Y and −X−0.3Y (negative direction X), accordingly for Y direction, the application of loads is performed in two phases. Initially, the vertical loads (combination G + 0.3Q) are applied, followed by sixteen nonlinear static analyses for the combination of horizontal loads.
5.1.2 Results of the Assessment
Figure 4 depicts the performance point (PP) along with the previous and next steps of the base shear-deformation (V-D) resistance curve together with the view of the deformed structural system with the location of the formation of the plastic hinges for the eight most unfavorable combinations of horizontal loads. The definition of PP is carried out according to Procedure A described in ATC-40 report [Applied Technology Council (ATC), 1996], and the target displacement is calculated through an iterative procedure using the elastic demand diagram for equivalent damping ratio updated during the iterations. According to Procedure A, the capacity of a structure to resist lateral forces is compared to the demand given by a response spectrum. The response spectrum represents the demand, while the pushover curve (or the “capacity curve”) represents the available capacity. The steps of the method are briefly summarized. 1) Perform pushover analysis and determine the capacity curve in base shear (
In particular, for the uniform distribution by + X (the most unfavorable combination is X + 0.3Y), the analysis based on the uniform X + 0.3Y distribution of the horizontal loading was performed in seven steps. The performance point (V, D) = (1,242.32, −0.0810) was observed between steps 4 and 5. In Table 2, it is observed that plastic hinges have been formed in 9 + 27 = 36 edges of structural elements (denoted in pink (BtoIO) and blue (IOtoLS) columns). However, the limit of the chord rotation angle for the “life safety” performance level (blue) has not been exceeded for any of them. The building is therefore considered safe for this distribution of horizontal loads.
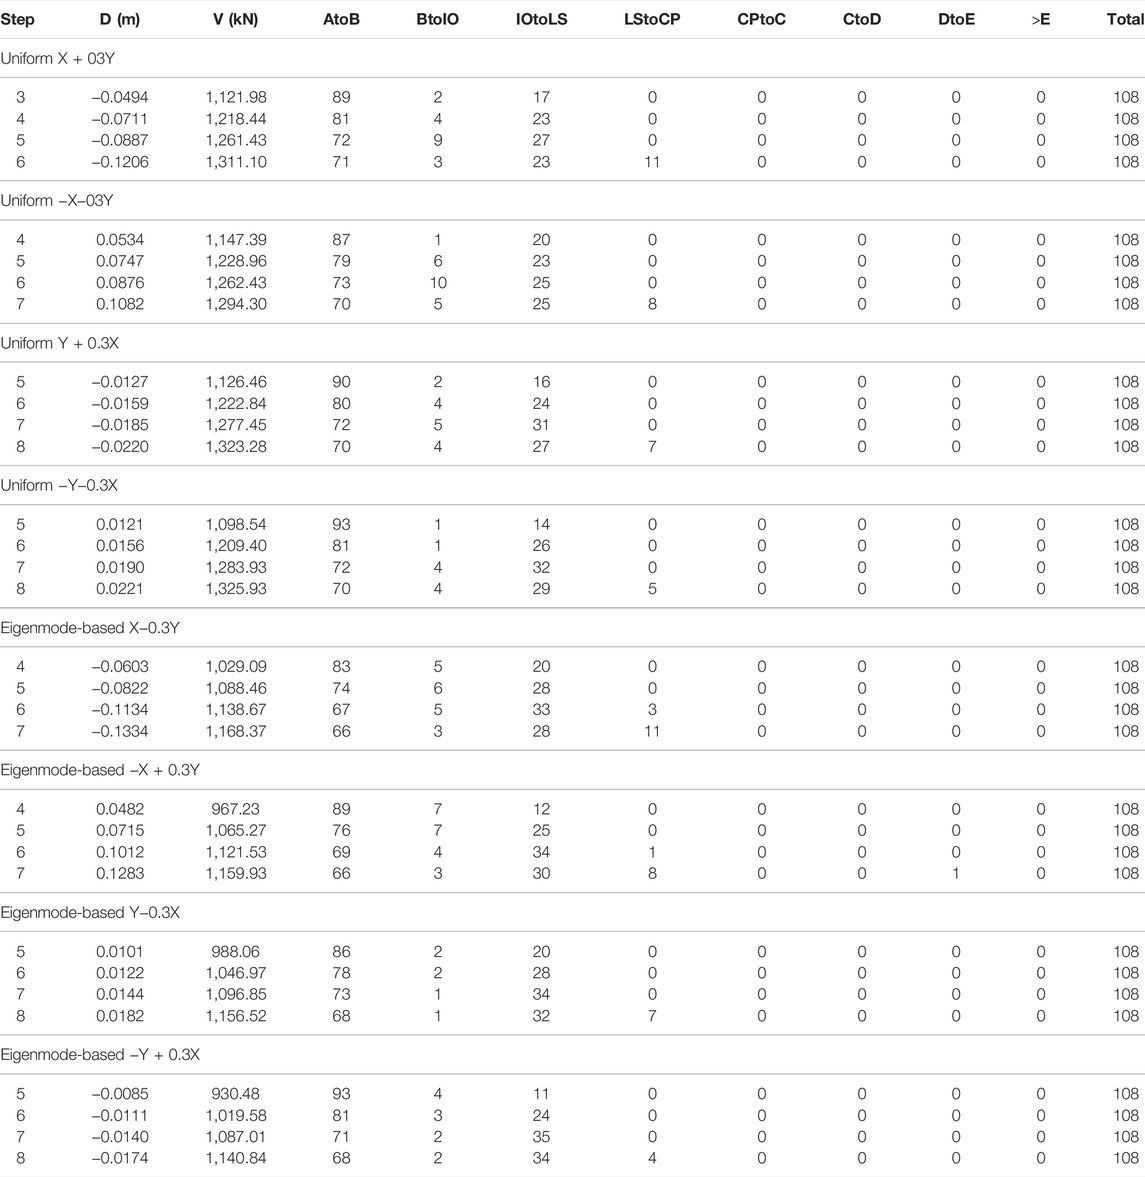
TABLE 2. Status of plastic hinge in the various steps of pushover analysis.
For the uniform distribution by −X (worst combination o −X−0.3Y), the analysis based on the uniform −X−0.3Y distribution of the horizontal loading was performed in eight steps. The performance point (V,D) = (1,241.47, 0.080) was observed between steps 5 and 6. In Table 2, it is observed that plastic hinges have been formed in 10 + 25 = 35 edges of structural elements (denoted in pink (BtoIO) and blue (IOtoLS) columns). However, the limit of the chord rotation angle for the “life safety” performance level (blue) has been exceeded for any of them. The building is therefore considered safe for this distribution of horizontal loads. For the uniform distribution by + Y (the most unfavorable combination is Y + 0.3X), the analysis based on the uniform Y + 0.3X distribution of the horizontal loading was performed in eleven steps. The performance point (V, D) = (1,245.32, −0.0170) was observed between steps 6 and 7. In Table 2, it is observed that plastic hinges have been formed in 5 + 31 = 36 edges of structural elements (denoted in pink (BtoIO) and blue (IOtoLS) columns). However, the limit of the chord rotation angle for the “life safety” performance level (blue) has been exceeded for any of them. The building is therefore considered safe for this distribution of horizontal loads. For the uniform distribution by −Y (worst combination −Y−0.3X), the analysis based on the uniform −Y−0.3X distribution of the horizontal loading was performed in eleven steps. The performance point (V, D) = (1,241.52, 0.017) was observed between steps 6 and 7. In Table 2, it is observed that plastic hinges have been formed in 4 + 32 = 36 edges of structural elements (denoted in pink (BtoIO) and blue (IOtoLS) columns). However, the limit of the chord rotation angle for the “life safety” performance level (blue) has been exceeded for any of them. The building is therefore considered safe for this distribution of horizontal loads.
Accordingly, for the eigenmode-based distribution by + X (the most unfavorable combination is X−0.3Y), the analysis based on the eigenmode-based X−0.3Y distribution of the horizontal loading was performed in eight steps. The performance point (V, D) = (1,105.41, −0.093) was observed between steps 5 and 6. In Table 2, it is observed that plastic hinges have been formed in 5 + 33 + 3 = 41 edges of structural elements [denoted in pink (BtoIO), blue (IOtoLS), and light blue (LStoCP) columns)]. In three of them, the limit of the chord rotation angle was exceeded for the “life safety” performance level (blue). These elements correspond to beams Δ4 and Δ10 of the ground floor and column K18. For the eigenmode-based distribution by −X (most unfavorable combination o −X + 0.3Y), the analysis based on the eigenmode-based −X + 0.3Y distribution of the horizontal loading was performed in seven steps. The performance point (V, D) = (1,106.05, 0.093) was observed between steps 5 and 6. In Table 2, it is observed that plastic hinges have been formed in 4 + 34 + 1 = 39 edges of structural elements [denoted in pink (BtoIO), blue (IOtoLS), and light blue (LStoCP) columns)]. In one of them, the limit of the chord rotation angle was exceeded for the “life safety” performance level (blue). This element corresponds to column K17. For the eigenmode-based distribution by + Y (the worst combination is Y−0.3X), the analysis based on the eigenmode-based Y−0.3X distribution of the horizontal loading was performed in ten steps. The performance point (V, D) = (1,065.75, 0.013) was observed between steps 6 and 7. In Table 2, it is observed that plastic hinges have been formed in 1 + 34 = 35 edges of structural elements [denoted in pink (BtoIO) and blue (IOtoLS) columns]. However, none of them has exceeded the limit of the chord rotation angle for the “life safety” performance level (blue). The building is therefore considered safe for this distribution of horizontal loads. For the eigenmode-based distribution by −Y (worst combination o −Y + 0.3X), the analysis based on the eigenmode-based −Y + 0.3X distribution of the horizontal loading was performed in ten steps. The performance point (V, D) = (1,065.47, −0.013) was observed between steps 6 and 7. In Table 2, it is observed that plastic hinges have been formed in 2 + 35 = 37 edges of structural elements [denoted in pink (BtoIO) and blue (IOtoLS) columns]. However, none of them has exceeded the limit of the chord rotation angle for the “life safety” performance level (blue). The building is therefore considered safe for this distribution of horizontal loads. A typical moment rotation curve along with the notation of the PP and the coloring of Table 2 and those that follow is provided in Figure 5.
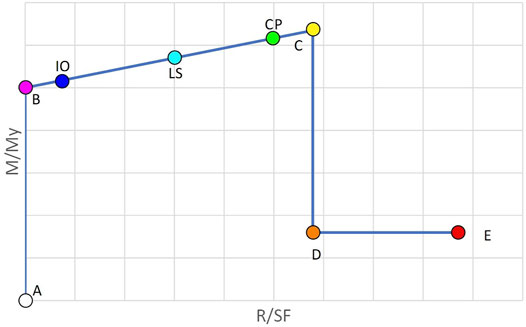
FIGURE 5. A typical moment rotation curve (M: moment, My: yield moment, R: rotation, SF: safety factor).
Based on the most unfavorable responses of the structural system obtained for the random design action of EC8 (European Committee for standardization ENV 1998-1-1:1994) through the various distributions of horizontal loads, it is concluded that the structural system as a whole is not safe for the specific intensity of the random action because structural elements Δ6 and Δ10 of the ground floor, K17 and K18, develop deformations larger than the acceptable ones, those defined by the “life safety” performance level in terms of the chord rotation angle. The next step is to strengthen some of these elements to enter the safe region.
5.2 Strengthening Based on Design Provisions
Based on the investigation of the previous section during the assessment of the structural system presented, for some elements (Δ6 and Δ10 of the ground floor, K17, K18), the chord rotation angle exceeded the limit set for “life safety” performance level defined by Kanepe (2017); that is, these elements during the design earthquake develop damage greater than acceptable. Given that all the structural elements are considered primary, the specific structural system as a whole is not considered safe. For this reason, in this part of the investigation, strengthening interventions of these elements will be examined so that the redesigned structural system meets the design goal B1 of Kanepe (2017), that is, for the design earthquake (10% probability of exceeding within the conventional life time of 50 years), all structural elements of the construction to be located before the level corresponding to the “life safety” performance level. After various tests of interventions that did not always have positive results for the redesigned structural system, strengthening column K7 along its height with RC jacketing was selected. The process of strengthening and re-assessment of the redesigned structural system, during which this new design is considered safe (meeting the design objective), is described in this section.
A 10 cm RC jacketing with 8Ø20 reinforcement is used to strengthen column K7. The strengthened structural system is assessed by means of nonlinear static analyses based on the distributions of the horizontal loads. Note that for the strengthened structural system, the first eigenmode is the fundamental one along the Y direction while the second one is along the X direction. In Table 3, the performance points for the strengthened structural system are compared with those of the original one.

TABLE 3. Status of plastic hinges in the various steps of pushover analysis.
As observed from Table 3, the performance points of the strengthened structural system for the various loading combinations show a small increase of the base shear by 90–130 kN, of the order of about 8%. As far as the target displacements are concerned, they are significantly reduced for the distributions of the X direction while they practically remain unchanged for the distributions of the Y direction. This can be partially explained as follows: in the X direction, column K7 participates in the baring frame K7-Δ10-K8, where both columns K7 and K8 contribute with the less rigid orientation of their cross section. Thus, it becomes the weakest one among all baring frames of the structural system. Along the Y direction, strengthening did not contribute significantly because the Y-baring frames were originally more rigid. Due to the reduction of target displacements along the X direction, no structural element of the redesigned structural system develops any longer damage for the design earthquake larger than the acceptable ones, those defined by the “life safety” performance level. For the original structural system, distributions along the X direction developed structural elements exceeding this performance level. In addition, the number of edges entering the plastic zone was also reduced in most loading distributions. As a general conclusion, it can be said that the specific strengthening operation is considered successful because the redesigned structural system is now safe and shows better structural behavior for the design earthquake.
5.3 Strengthening Based on Minimizing Torsional Response
In this part of the study, the process described previously for calculating the components of the problem formulations is integrated into the ICA algorithm, aiming to minimize the torsional response of the building. Previously, the structural system was strengthened to meet the design target B1 of Kanepe (2017); then, two cases are considered for strengthening the structural system based on improved torsional response: minimum stiffness and strength eccentricities. As a result, the following information is obtained through the solution of the two optimization problems: 1) thickness of RC jacketing to strengthen the columns, in case of minimizing stiffness eccentricity, and 2) thickness and reinforcement of RC jacketing to strengthen the columns, in case of minimizing the eccentricity of strengths. The designs obtained for the two cases are assessed by means of nonlinear static analyses in comparison with the original design (OD: original design) and the re-design based on strengthening by Kanepe (2017) (KSD: KANEPE based strengthened design). For the implementation of the ICA-based strengthening design framework, a set of data needs to be provided required by the formulation of the optimization problem. Based on these data and with reference to the problem formulation (rigidity or strength eccentricity) during the iterations of the ICA search procedure, new designs, defined with respect to the location, width, and reinforcement of the RC jacketing of each vertical structural element, are derived. For handling the discrete design variables, the procedure described by Lagaros et al. (2022) is followed, according to which they are treated as equivalent continuous variables, using the correction function of the following simple expression:
5.3.1 Entry of Building Data Into Problem Formulation
According to the previous description, the data required for the two problem formulations are configured (Table 4) below.
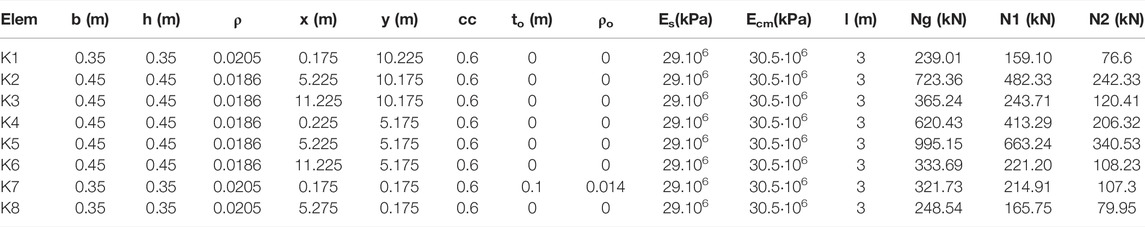
TABLE 4. Ground floor data register.
The plan view is the same for all stories, and the only difference can be found in the last column corresponding to the axial forces of the columns. The axial forces of the columns are obtained by means of linear analyses of KBD for the combination G + 0.3Q. Regarding the minimization problem of strength eccentricity, three cases will be examined (one for each story). The solution corresponding to the best compromise solution will be adopted, where lower eccentricities for all three stories are derived. The data required (columns 2 to 13 of Table 4) for solving the minimization problem of stiffness eccentricity are the same for all three stories. In particular, for each vertical structural element, ρ and ρο denote the percentage of longitudinal reinforcement and the one of existing RC jackets, respectively; tο refers to the width of the RC jackets; x and y denote the coordinates of the center of mass; and cc is the cracking coefficient; that is, Ng stands for the axial force of the ground floor, N1 of the first floor, and N2 for the second one. For the RC jacketing, concrete quality C20/25 is considered, as well as steel reinforcement B500C. The mass centers of all floors coincide because the plan view is the same for all stories, thus creating a centripetal axis for the building. Uniform distribution of the vertical loads was considered on the floor slabs; thus, the mass center coincides with the geometric center of the floors.
5.3.2 Eccentricities of Initial and Strengthened by KANEPE Structural System
The eccentricities of the original structural system and those of the strengthened one are calculated first (Table 5), where variation stands for the reduction of the eccentricity values corresponding to the strengthened design compared to the ones of the original design. The axial forces used to calculate the strength eccentrics are derived from linear analyses performed for the two structural systems (OD and KBD) for the combination G + 0.3Q. For the case of KBD, they are identical to those of Table 4.
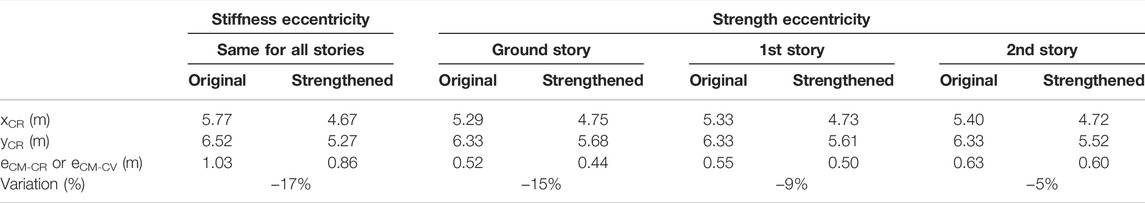
TABLE 5. Stiffness and strength eccentricities for the two structural systems.
5.3.3 Minimize Stiffness Eccentricity
In this part of the study, the problem of the minimum rigidity eccentricity problem is solved and the results obtained are discussed. The specific problem is formulated once. Thus, a unique solution is derived for all three stories. Given that ICA is an evolutionary search algorithm, it operates based on a population of solutions. The convergence history records the best solution found so far and that of the average value among the population members. Although the convergence history of the optimization procedure takes place shortly before the 2000 iterations, ICA managed to significantly reduce the stiffness eccentricity (cost function) value in less than 500 iterations. When an empire is left, the average cost is equal to the minimum. The optimal solution is located in the position (imperialist position) (0.19, 0.20, 0, 0.20, 0.15, 0.20, 0, 0.19) and has a cost, that is, giving value to the objective function of the problem (imperialist cost) equal to e = 0.0074 m ≈ 7 mm. Each column will therefore be reinforced accordingly. The K7 column is already reinforced with a 10 cm RC jacket. Its final RC jacket will be 10 cm. The RC jackets, for the design of the new body with the minimized rigidity eccentricity, are introduced with the minimum mechanical reinforcement rate of 1%.
5.3.4 Minimize Strength Eccentricity
In this part of the study, the minimum strength eccentricity problem is solved and the results obtained are discussed. The iteration histories of the problems solved independently for the three stories are obtained. Similar to the problem of minimum rigidity, the convergence history is recorded for each of the three problems solved, with respect to the best solution found so far and the average objective function value. The strength eccentricity minimization problem is more time-consuming (1 min/iteration) in contrast to the stiffness eccentricity one, where 2,500 iterations were performed in just a few minutes. Thus, fewer iterations were chosen to identify convergence (around 100). However, as shown in the above history diagrams, the strength eccentricity value is reduced quickly, reaching zero during the first 40 to 80 iterations. Specifically, the optimal solution is located in the position (imperialist position) reported for all three stories in Table 6.
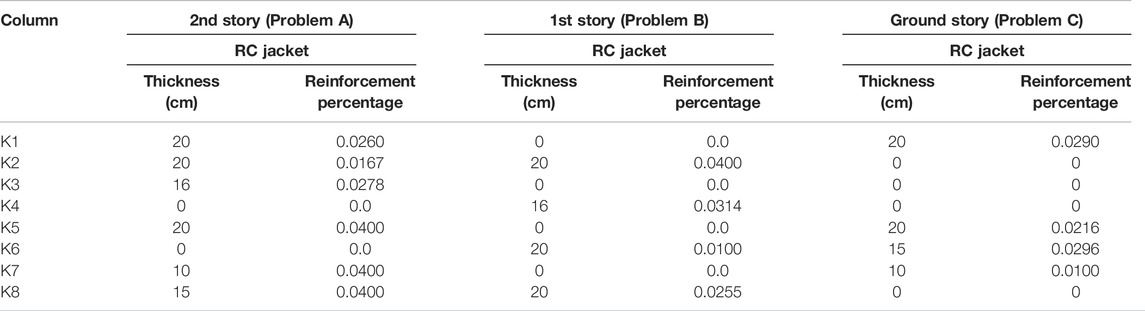
TABLE 6. Column reinforcement thickness to minimize the strength eccentricity of the second floor.
The cost values obtained for the three problems A, B, and C along with the eccentricities of the other two stories are provided in Table 7. For Problem A, the imperialist cost value is equal to e = 0.00063 m < 1 mm. For Problem B, the imperialist cost value is equal to e = 0.0018 m ≈ 2 mm. For Problem C, the imperialist cost value is equal to e = 0.0003 m < 1 mm. For this solution, the strength eccentricities of the other floors of the building are as follows:
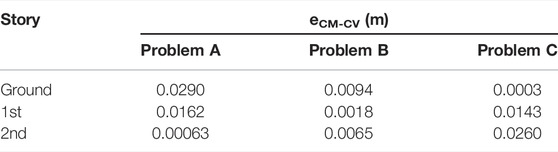
TABLE 7. Minimized strength eccentricity values obtained for the tree problems.
It can be noticed that the optimal floor solutions show a sensitivity because they differ quite a lot from floor to floor. Nevertheless, the optimal solution obtained for the first floor (Problem B) gives low values of eccentricity to the other floors (less than 1 cm). Therefore, it is neither realistic nor practical to use different RC jacketing for a given column along the stories of the building. The strengthening solution obtained through Problem B, according to Table 7, is used.
5.4 Assessment of the Strengthened Structural Systems
5.4.1 Eigenmode Analyses
The results of the eigenmode analyses performed for each of the two new structural systems derived through minimization of the eccentricities are presented below. Based on the eigenvalue analyses results, it seems that, for both structural systems, the first eigenmode is the fundamental one along the Y direction while the second eigenmode is the fundamental one along the X direction. It is also worth mentioning that the first three eigenperiod values were significantly reduced in relation to the ones of the original structural system, as expected because due to strengthening, the structural systems became significantly more rigid compared to the original one. Also, note that the mass participation rate of the third eigenmode, which is mainly torsional, was decreased.
5.4.2 Nonlinear Static Analyses
Nonlinear static analyses are performed for the two new structural systems. Their seismic behavior is compared with the corresponding one of the original and the strengthened ones designed to meet the B1 goal of Kanepe (2017). The 16 distributions of the horizontal loads mentioned earlier are also used to perform these analyses. The capacity curves derived are presented first (Figure 6), where an estimate of how the interventions affected the overall behavior of the structural systems can be obtained. For every horizontal load distribution, two groups of curves are obtained: those of the original and strengthened designs and those of the designs obtained through eccentricities minimization. These two groups of curves show similar stiffness and capacity. As observed in Figure 6, the ultimate load capacity and the initial stiffness of the designs obtained through eccentricity minimization were almost doubled, while the post-cracking stiffness was increased slightly.
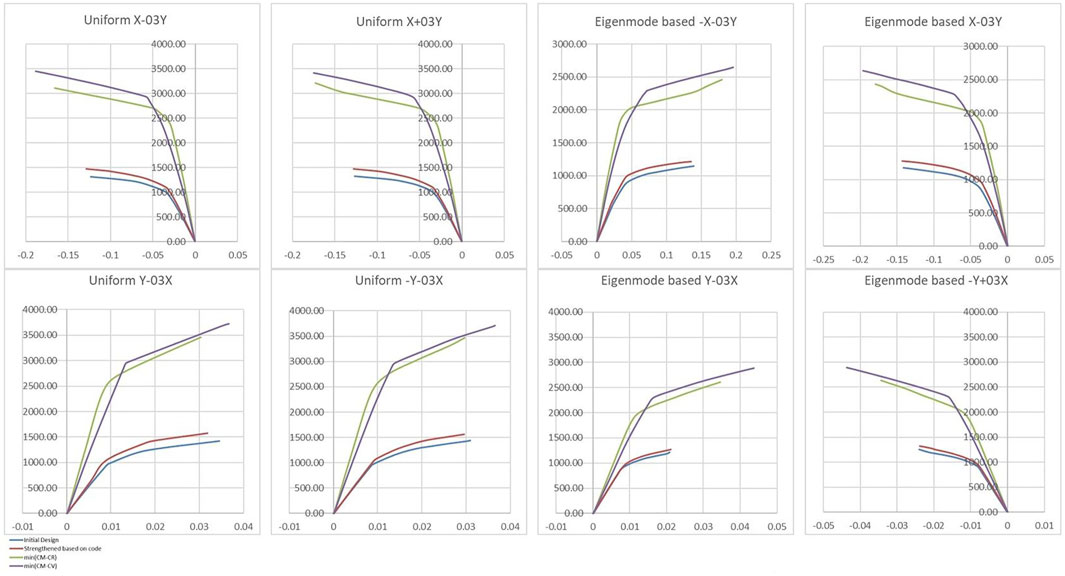
FIGURE 6. Capacity curves.
Subsequently, the behavior of the structural systems measured for the design earthquake (target displacement, yield base shear demand) for the most unfavorable distributions per direction is presented. Finally, the tables containing the ductility demand of the columns also for the design earthquake are presented. The structural systems derived through the optimization process in comparison to the original and strengthened based on Kanepe (2017) depict a large increase in the stiffness and bearing capacity (almost doubled) and a significant increase in ductility due to the extensive use of RC jackets at the columns. In Table 8 the following notations are used, performance points for the initial design (PP IN), strengthened based on the design code (PP DC), strengthened based on minimum rigidity eccentricity (PP CR), and strengthened based on minimum strength eccentricity (PP CV).
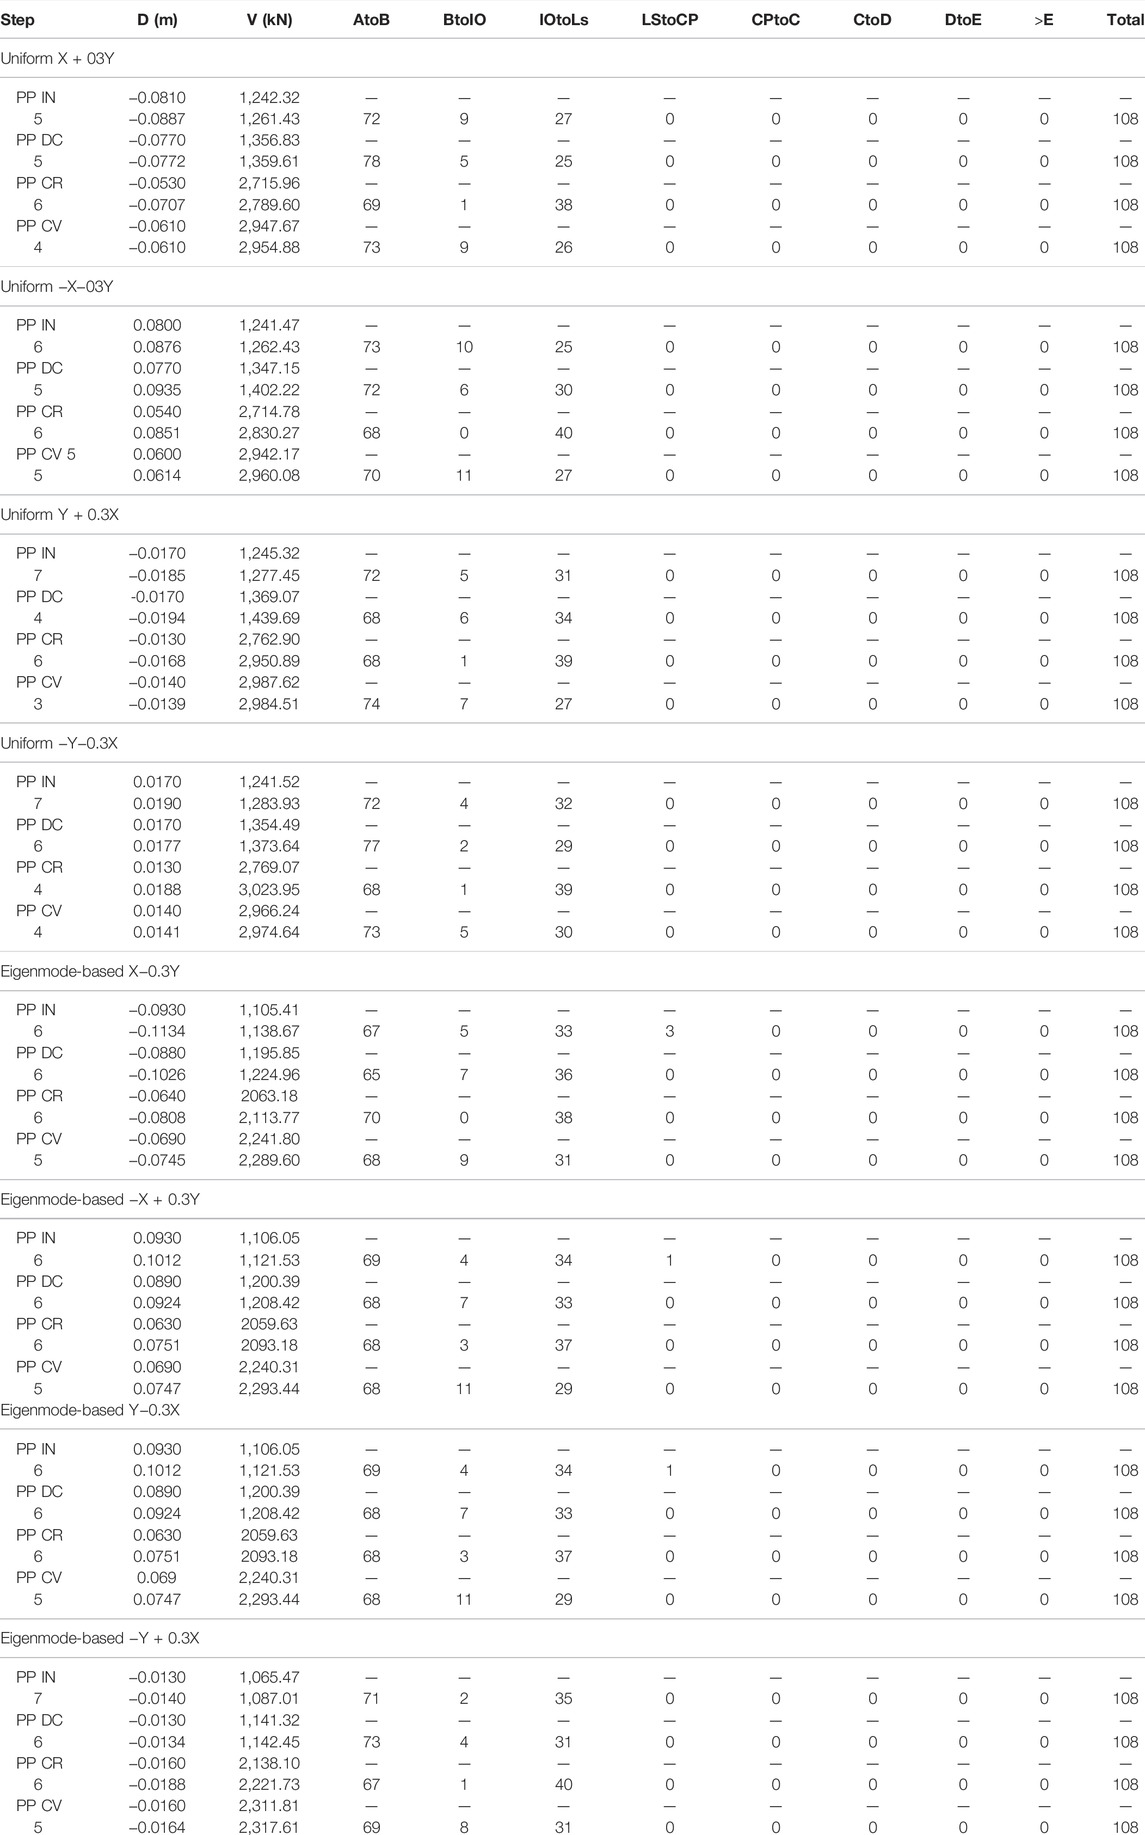
TABLE 8. Status of plastic hinges in the various steps of pushover analysis.
Comparing the performance points (PPs) of the structural systems derived through the optimization process with the original one and the strengthened one based on the design code (Kanepe, 2017), the following observations can be stated: 1) the base shear value for PP was almost doubled for both new structural systems. 2) The deformation for PP was significantly reduced for almost all horizontal load combinations examined (by 25%–30%). These results were more or less expected because, as observed previously, the rigidity and bearing capacity of the two new structural systems increased significantly compared to the original and strengthened ones. However, it is worth noting that 3) both new structural systems derived are considered safe because no end of structural element exceeds the “life safety” performance level. The number of ends of columns that enter the plastic zone is reduced (limited to the bottom ends of the ground floor columns). However, the total number of edges of the structural elements that enter the plastic zone does not change substantially. This is due to increase of base shear. Thus, beams without being strengthened further take over larger forces, resulting in plasticized ends. Even so, no beam exceeded the “life safety” performance level.
5.4.3 Ductility Demand of the Columns
The view of the structure where deformation due to torsion is added to the one due to translational motion is called the “flexible view,” while the view on which deformation due to torsion is subtracted due to translational motion is called “rigid view.” It was observed through nonlinear static analyses that increased inelastic deformation is observed for the flexible side and reduced for the rigid in comparison to the corresponding deformation of symmetrical structural systems. Therefore, the unbalanced distribution of the ductility demand to eccentric buildings can lead to failures due to unexpected excitations (Stathopoulos and Anagnostopoulos, 2005; Anagnostopoulos et al., 2015). In this section, the distribution of ductility demand for the design earthquake will be measured for the columns of each floor for all four structural systems. In order to control the distribution of ductility demand, the coefficient of variation (
where
where
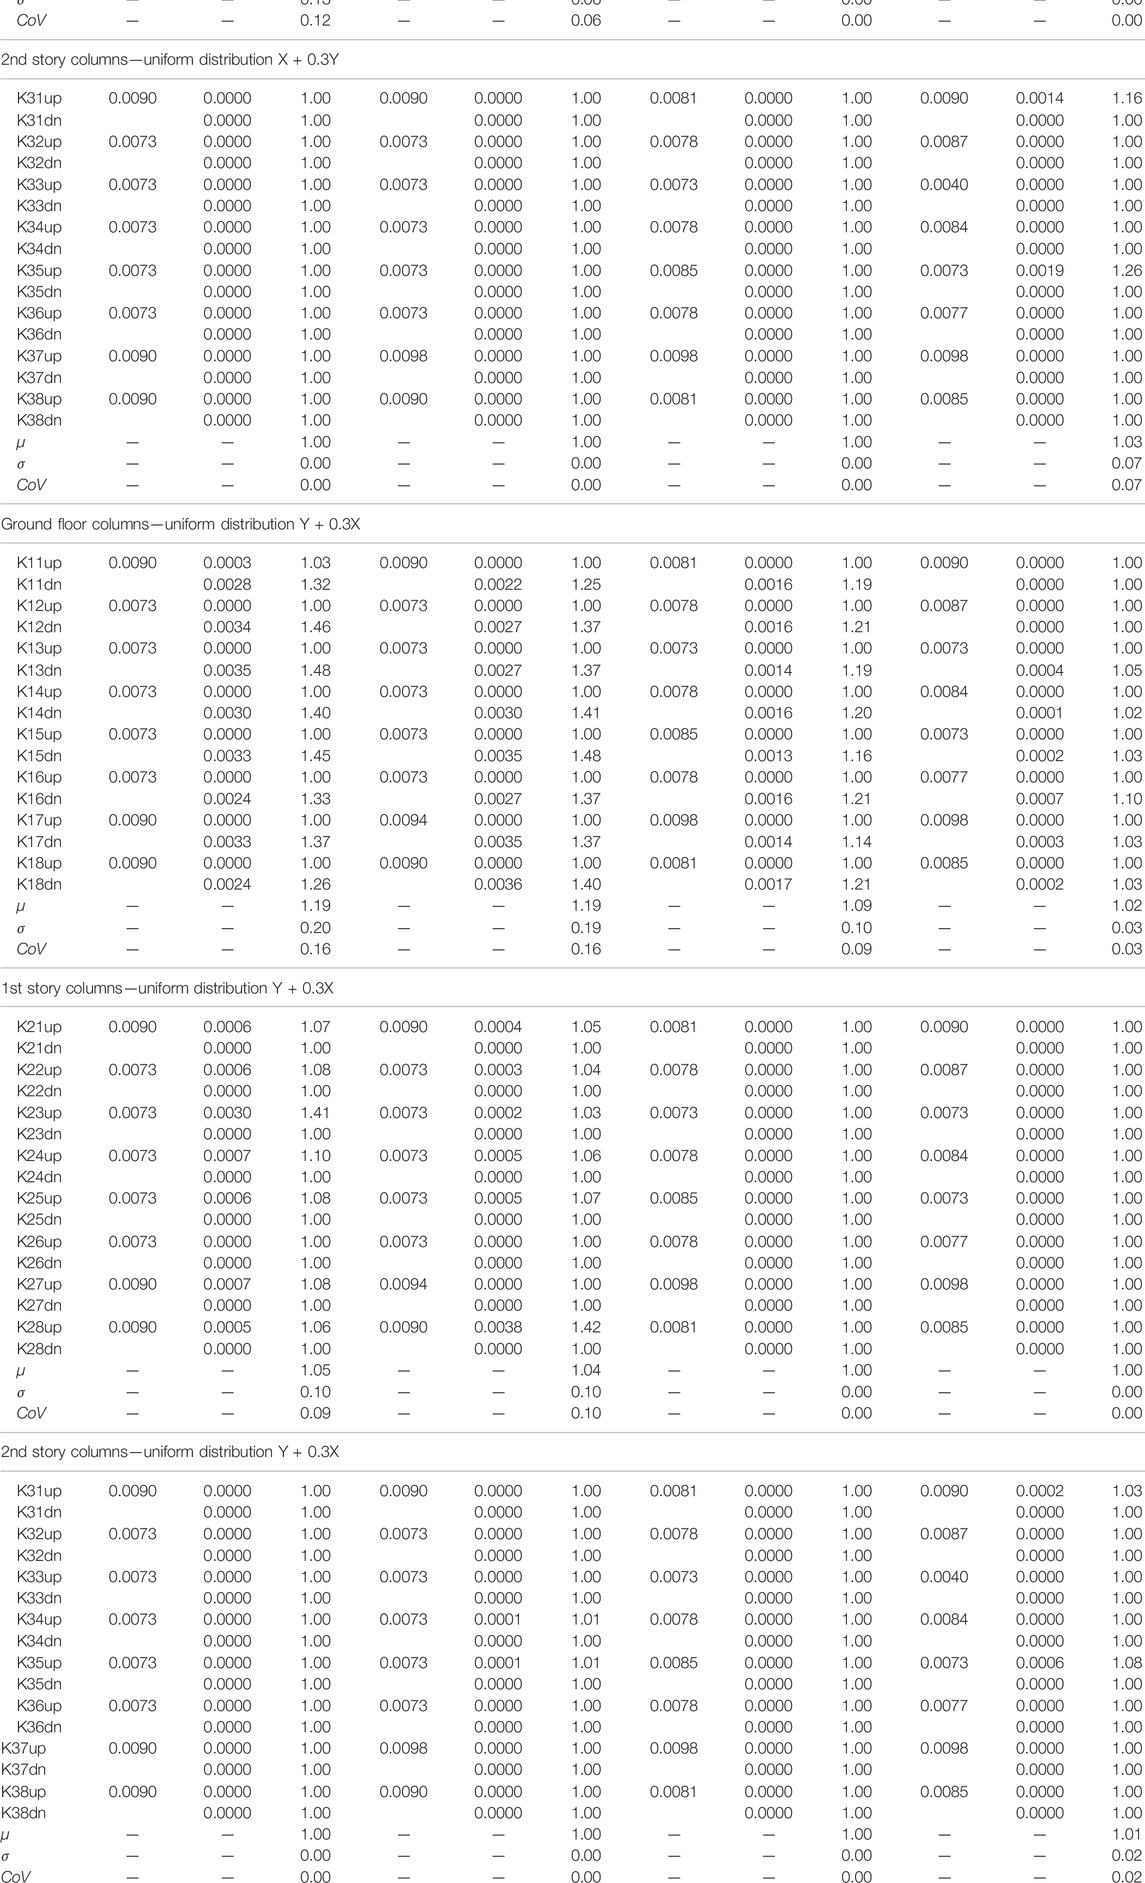
TABLE 9. Required ductility values of the columns for the distributions of the horizontal loads.
The ground floor is a representative story to identify changes in ductility distribution over the columns where plastic hinges are formed at the edges of all columns in each structural system. On the ground floor, it is observed that
6 Conclusion and Discussion
In the present study, the aim was to minimize the torsional response of a multi-story reinforced concrete (RC) building by strengthening its columns. The ultimate goal was to improve its structural behavior through an automized procedure that could be easily utilized in relevant structural analysis and design software. In this direction, design optimization problems were formulated based on the torsional response criterion. Therefore, the problem was mathematically developed with two independent formulations: minimization of the eccentricity between mass and rigidity centers and minimization of the eccentricity between mass and strength centers. The first one was formulated as a discrete structural optimization problem, where the dimensions of the columns' cross sections were the unknowns. In contrast, the second was formulated as a mixed one, where, in addition to the dimensions, the percentage of the reinforcement was the unknowns. The two problems were solved using the evolutionary algorithm called the imperialist competitive algorithm (ICA).
In the first part of the investigation, the case study building was assessed based on nonlinear static analyses aiming to assess its behavior for the case of the design earthquake. The nonlinear static analyses revealed that larger deformations are observed along the X direction. Subsequently, strengthening interventions were to be decided on some of the structural elements aiming to meet the B1 design goal of Kanepe (2017), that is, for the design seismic action, the structural system should not exceed the “life safety” performance level. Given that all structural elements were considered primary ones, none of them should exceed the specified performance level. In order to meet these needs, it was decided to strengthen column K7 using RC jacketing, resulting in the reduction of target deformation demands along the X direction, and no structural element of the structural system developed damage larger than the acceptable one for the design earthquake.
The next step, in terms of strengthening, used the optimization framework developed to minimize stiffness and strength eccentricities. By means of nonlinear static analyses performed for the two new structural systems resulting by solving the two optimization problems, it was found that the bearing capacity and stiffness almost doubled compared to the original and the strengthened ones based on Kanepe (2017), while their ductility was significantly increased. The deformation corresponding to the performance point was significantly reduced for almost all horizontal load combinations examined by 25%–30%. Due to the large increase in the base shear at the performance point, the number of plastic hinges at the ends of the beams was increased since the cross sections of the columns were strengthened. Even so, none beam exceeded the “life safety” performance level. These results were expected due to extensive strengthening of the columns. The main conclusion that emerged is that the distribution of ductility in the columns is more balanced in relation to the original structural system and the one strengthened based on the design goal B1 of Kanepe (2017).
Data Availability Statement
The original contributions presented in the study are included in the article/Supplementary Material, Further inquiries can be directed to the corresponding author.
Author Contributions
All authors have made a substantial, direct, and intellectual contribution to the work and approved it for publication.
Funding
The research was funded by the Hellenic Foundation for Research and Innovation (H.F.R.I.) under the “Second Call for H.F.R.I. Research Projects to support Post-Doctoral Researchers,” IMSFARE project: “Advanced Information Modelling for SAFER Structures against Manmade Hazards” (Project Number: 00356).
Author’s Disclaimer
The content of this paper expresses the views of the authors and not the official position of the Ministry of Maritime Affairs and Insular Policy.
Conflict of Interest
The authors declare that the research was conducted in the absence of any commercial or financial relationships that could be construed as a potential conflict of interest.
Publisher’s Note
All claims expressed in this article are solely those of the authors and do not necessarily represent those of their affiliated organizations or those of the publisher, the editors, and the reviewers. Any product that may be evaluated in this article, or claim that may be made by its manufacturer, is not guaranteed or endorsed by the publisher.
References
Almazán, J. L., and de la Llera, J. C. (2009). Torsional Balance as New Design Criterion for Asymmetric Structures with Energy Dissipation Devices. Earthquake Engng Struct. Dyn. 38 (12), 1421–1440. doi:10.1002/eqe.909
Anagnostopoulos, S. A., Kyrkos, M. T., and Stathopoulos, K. G. (2015). Earthquake Induced Torsion in Buildings: Critical Review and State of the Art. Earthquakes and Structures 8 (2), 305–377. doi:10.12989/eas.2015.8.2.305
Anastassiadis, K., Athanatopoulou, A., and Makarios, T. (1998). Equivalent Static Eccentricities in the Simplified Methods of Seismic Analysis of Buildings. Earthquake Spectra 14 (1), 1–34. doi:10.1193/1.1585986
Applied Technology Council (ATC) (1996). Methodology for Evaluation and Upgrade of Reinforced concrete Buildings, Report N. ATC-40. Sacramento, California: California Seismic Safety Commission.
Atashpaz-Gargari, E., and Lucas, C. (2007). Imperialist Competitive Algorithm: An Algorithm for Optimization Inspired by Imperialistic Competition. IEEE Congress Evol. Comput., 4661–4667. doi:10.1109/CEC.2007.4425083
Bosco, M., Ferrara, G. A. F., Ghersi, A., Marino, E. M., and Rossi, P. P. (2015). Predicting Displacement Demand of Multi-Storey Asymmetric Buildings by Nonlinear Static Analysis and Corrective Eccentricities. Eng. Structures 99, 373–387. doi:10.1016/j.engstruct.2015.05.006
Bosco, M., Ghersi, A., and Marino, E. M. (2012). Corrective Eccentricities for Assessment by the Nonlinear Static Method of 3D Structures Subjected to Bidirectional Ground Motions. Earthquake Engng Struct. Dyn. 41 (13), 1751–1773. doi:10.1002/eqe.2155
Bosco, M., Marino, E. M., and Rossi, P. P. (2013). An Analytical Method for the Evaluation of the In-Plan Irregularity of Non-regularly Asymmetric Buildings. Bull. Earthquake Eng. 11 (5), 1423–1445. doi:10.1007/s10518-013-9438-3
Chandler, A. M., Correnza, J. C., and Hutchinson, G. L. (1995). Influence of Accidental Eccentricity on Inelastic Seismic Torsional Effects in Buildings. Eng. Structures 17 (3), 167–178. doi:10.1016/0141-0296(94)00003-c
Costa, A., Arêde, A., and Varum, H. (2017). Strengthening and Retrofitting of Existing Structures (Building Pathology and Rehabilitation Book 9) Part of: Building Pathology and Rehabilitation (21 Books). Singapore: Springer.
Dang, Y., Zhao, G., Tian, H., and Li, G. (2021). Two-Stage Optimization Method for the Bearing Layout of Isolated Structure. Adv. Civil Eng. 2021, 1–10. art. No. 4895176. doi:10.1155/2021/4895176
De Stefano, M., and Pintucchi, B. (2008). A Review of Research on Seismic Behaviour of Irregular Building Structures since 2002. Bull. Earthquake Eng. 6 (2), 285–308. doi:10.1007/s10518-007-9052-3
Duan, X. N., and Chandler, A. M. (1997). An Optimized Procedure for Seismic Design of Torsionally Unbalanced Structures. Earthquake Engng. Struct. Dyn. 26 (7), 737–757. doi:10.1002/(sici)1096-9845(199707)26:7<737::aid-eqe673>3.0.co;2-s
Etedali, S., and Kareshk, M. K. (2022). Mitigation of Torsional Responses in Asymmetric Base-Isolated Structures Using an Optimal Distribution of Isolators in Base story. Structures 35, 807–817. doi:10.1016/j.istruc.2021.11.053
Eurocode 8 (1994). European Committee for Standardization ENV 1998-1-1:1994. Design of Structures for Earthquake Resistance – Part 1: General Rules, Seismic Actions and Rules for Buildings. Brussels, Belgium.
Eurocode 1 (1995). European Committee for Standardization ENV 1991-1-1:1995. Actions on Structures – Part 1-1: General Actions – Densities, Selfweight, Imposed Loads for Buildings. Brussels, Belgium.
Fajfar, P. (2000). A Nonlinear Analysis Method for Performance-Based Seismic Design. Earthquake Spectra 16 (3), 573–592. doi:10.1193/1.1586128
Fajfar, P., and Fischinger, M. (1988). Discussion of " Evaluation of Building Code Formulas for Earthquake Forces " by Anil K. Chopra and Ernesto F. Cruz (August 1986, Vol. 112, No. 8). J. Struct. Eng. 114 (3), 735–737. doi:10.1061/(asce)0733-9445(1988)114:3(735)
Fajfar, P., and Gašperšič, P. (1996). The N2 Method for the Seismic Damage Analysis of RC Buildings. Earthquake Engng. Struct. Dyn. 25 (1), 31–46. doi:10.1002/(sici)1096-9845(199601)25:1<31::aid-eqe534>3.0.co;2-v
Ganguly, K. K. (2020). Reinforced Concrete Design: Repair/Restoration, Strengthening of RC Structures and Concrete Technology. India: Medtech.
Georgoussis, G. K. (2015). Minimizing the Torsional Response of Inelastic Multistory Buildings with Simple Eccentricity. Can. J. Civ. Eng. 42 (11), 966–969. doi:10.1139/cjce-2015-0091
Goel, R. K., and Chopra, A. K. (1990). Inelastic Seismic Response of One-Storey, Asymmetric-Plan Systems: Effects of Stiffness and Strength Distribution. Earthquake Engng. Struct. Dyn. 19 (7), 949–970. doi:10.1002/eqe.4290190703
Guo, W., and Li, H.-N. (2009). Secondary System’s Optimal Position Analysis Concerning the Lateral-Torsion Coupling Effect. Jisuan Lixue Xuebao/Chinese J. Comput. Mech. 26 (6), 797–803+810. doi:10.1088/0256-307x/26/7/074218
Hejal, R., and Chopra, A. K. (1989). Earthquake Response of Torsionally Coupled, Frame Buildings. J. Struct. Eng. 115, 834. doi:10.1061/(asce)0733-9445(1989)115:4(834)
Humar, J. L. (1984). Design for Seismic Torsional Forces. Can. J. Civ. Eng. 11 (2), 150–163. doi:10.1139/l84-027
Ismail, M. (2015). Elimination of Torsion and Pounding of Isolated Asymmetric Structures under Near-Fault Ground Motions. Struct. Control. Health Monit. 22 (11), 1295–1324. doi:10.1002/stc.1746
Kan, C. L., and Chopra, A. K. (1977). Effects of Torsional Coupling on Earthquake Forces in Buildings. J. Struct. Div. 103 (4), 805–819. doi:10.1061/jsdeag.0004608
Kanepe (2017). Earthquake Planning & Protection Organization (EPPO). Greek Code for Assessment and Retrofitting. 2nd revision(in Greek). Athens, Greece.
Lagaros, N. D., Bakas, N., and Papadrakakis, M. (2009). Optimum Design Approaches for Improving the Seismic Performance of 3D RC Buildings. J. Earthquake Eng. 13 (3), 345–363. doi:10.1080/13632460802598594
Lagaros, N. D., Papadrakakis, M., and Bakas, N. (2006). Automatic Minimization of the Rigidity Eccentricity of 3D Reinforced concrete Buildings. J. Earthquake Eng. 10 (4), 533–564. doi:10.1080/13632460609350609
Lagaros, N. D., Plevris, V., and Kallioras, N. Ath. (2022). The Mosaic of Metaheuristic Algorithms in Structural Optimization. Archives of Computational Methods in Engineering. (to appear).
Li, C.-X., and Han, C.-F. (2003). Optimum Placements of Multiple Tuned Mass Dampers (MTMD) for Suppressing Torsional Vibration of Asymmetric Structures. J. Earthquake Eng. Eng. Vibration 23 (6), 149–155.
Li, C.-X., Qu, Y., Wang, C., and Li, J.-H. (2008a). Characteristics of a Soil-Asymmetric Building-Active Tuned Mass Damper Interaction System. Zhendong yu Chongji/Journal of Vibration and Shock 27 (9), 26–31.
Li, C.-X., Qu, Y., Wang, C., and Li, J.-H. (2008b). Optimum Properties of Soil-Asymmetric Building-Amtmd Interaction System. Zhendong yu Chongji/Journal of Vibration and Shock 27 (10), 10–14.
Li, C.-X., Xu, Z.-M., and Zhang, L.-Q. (2008c). Earthquake Reduction Behaviors of Active Tuned Mass Dampers for an Asymmetric Building. Zhendong yu Chongji/Journal of Vibration and Shock 27 (1), 76–83+88.
Makarios, T., and Anastassiadis, K. (1998). Real and Fictitious Elastic Axes of Multi-Storey Buildings: Theory. Struct. Des. Tall Build. 7 (1), 33–55. doi:10.1002/(sici)1099-1794(199803)7:1<33::aid-tal95>3.0.co;2-d
Maruić, D., and Fajfar, P. (2005). On the Inelastic Seismic Response of Asymmetric Buildings under Bi-axial Excitation. Earthquake Engng Struct. Dyn. 34 (8), 943–963. doi:10.1002/eqe.463
Palermo, M., Silvestri, S., Gasparini, G., and Trombetti, T. (2017). A Comprehensive Study on the Seismic Response of One-Storey Asymmetric Systems. Bull. Earthquake Eng. 15 (4), 1497–1517. doi:10.1007/s10518-016-0030-5
Palermo, M., Silvestri, S., Gasparini, G., and Trombetti, T. (2013). Physically-based Prediction of the Maximum Corner Displacement Magnification of One-Storey Eccentric Systems. Bull. Earthquake Eng. 11 (5), 1467–1491. doi:10.1007/s10518-013-9445-4
Papazachos, B. C., Papaioannou, C. A., Margaris, B. N., and Theodulidis, N. P. (1993). Regionalization of Seismic hazard in Greece Based on Seismic Sources. Nat. Hazards 8 (1), 1–18. doi:10.1007/bf00596232
Paulay, T. (1998). Torsional Mechanisms in Ductile Building Systems. Earthquake Engng. Struct. Dyn. 27, 1101–1121. doi:10.1002/(sici)1096-9845(199810)27:10<1101::aid-eqe773>3.0.co;2-9
Penelis, G., and Penelis, G. (2019). Concrete Buildings in Seismic Regions. United States: CRC Press.
Peruš, I., and Fajfar, P. (2005). On the Inelastic Torsional Response of Single-Storey Structures under Bi-axial Excitation. Earthquake Engng Struct. Dyn. 34 (8), 931–941. doi:10.1002/eqe.462
Reem, H., and Chopra, A. K. (1987). Earthquake Response of Torsionally-Coupled Buildings, Earthquake Engineering Research Center. Berkeley: College of Engineering: University of California at Berkeley.
Şahin, A. (2012). A New Algorithm for Geometrical Design of Asymmetric Tall Buildings against Seismic Torsional Behaviour. Struct. Des. Tall Spec. Build. 21 (9), 642–668. doi:10.1002/tal.634
Stathi, C. G., Bakas, N. P., Lagaros, N. D., and Papadrakakis, M. (2015). Ratio of Torsion (ROT): An index for Assessing the Global Induced Torsion in Plan Irregular Buildings. Earthquakes and Structures 9 (No. 1), 145–171. doi:10.12989/eas.2015.9.1.145
Stathopoulos, K. G., and Anagnostopoulos, S. A. (2005). Inelastic Torsion of Multistorey Buildings under Earthquake Excitations. Earthquake Engng Struct. Dyn. 34, 1449–1465. doi:10.1002/eqe.486
Tassios, T. P. (1982). The Mechanics of Column Repair with a Reinforced concrete Jacket. Athens, Greece: 7th European Conference on Earthquake Engineering ECEE.
Terzi, V. G., and Athanatopoulou, A. (2021). Optimum Torsion axis in Multistory Buildings under Earthquake Excitation: A New Criterion Based on axis of Twist. Eng. Structures 249, 113356. doi:10.1016/j.engstruct.2021.113356
Trombetti, T. L., and Conte, J. P. (2005). New Insight into and Simplified Approach to Seismic Analysis of Torsionally Coupled one-story, Elastic Systems. J. Sound Vibration 286 (1-2), 265–312. doi:10.1016/j.jsv.2004.10.021
Xenidis, H., Makarios, T., and Athanatopoulou, A. (2006). The Properties of the Optimum Torsion axis in Asymmetric Multi-Storey Buildings. Technica Chronica, Sci. J. Tcg, 99–112.
Keywords: strength eccentricity, stiffness eccentricity, metaheuristics, column strengthening, concrete jacketing, optimization
Citation: Mitropoulou CC, Naziris IA, Kallioras NA and Lagaros ND (2022) Optimized Strengthening Based on Concrete Jacketing for Minimum Eccentricity. Front. Built Environ. 8:856380. doi: 10.3389/fbuil.2022.856380
Received: 17 January 2022; Accepted: 09 March 2022;
Published: 14 April 2022.
Edited by:
Vagelis Plevris, Qatar University, QatarReviewed by:
Michele Palermo, University of Bologna, ItalyRajai Zuheir Al Rousan, Jordan University of Science and Technology, Jordan
Sameh Samir F. Mehanny, Cairo University, Egypt
Copyright © 2022 Mitropoulou, Naziris, Kallioras and Lagaros. This is an open-access article distributed under the terms of the Creative Commons Attribution License (CC BY). The use, distribution or reproduction in other forums is permitted, provided the original author(s) and the copyright owner(s) are credited and that the original publication in this journal is cited, in accordance with accepted academic practice. No use, distribution or reproduction is permitted which does not comply with these terms.
*Correspondence: Nikos D. Lagaros, nlagaros@central.ntua.gr