 Paul A. Maier
 Amy G. Vandergast
 Steven M. Ostoja
 Andres Aguilar
 Andrew J. Bohonak1†
- 1Department of Biology, San Diego State University, San Diego, CA, United States
- 2FamilyTreeDNA, Gene by Gene, Houston, TX, United States
- 3U.S. Geological Survey, Western Ecological Research Center, San Diego Field Station, San Diego, CA, United States
- 4U.S. Department of Agriculture (USDA) California Climate Hub, Agricultural Research Service, John Muir Institute of the Environment, University of California, Davis, Davis, CA, United States
- 5Department of Biological Sciences, California State University, Los Angeles, Los Angeles, CA, United States
The Yosemite toad (Anaxyrus [Bufo] canorus) is a federally threatened species of meadow-specializing amphibian endemic to the high-elevation Sierra Nevada Mountains of California. The species is one of the first amphibians to undergo a large demographic collapse that was well-documented, and is reputed to remain in low abundance throughout its range. Recent phylogeographic work has demonstrated that Pleistocene toad lineages diverged and then admixed to differing extents across an elevational gradient. Although lineage divisions may have significant effects on evolutionary trajectories over large spatial and temporal scales, present-day population dynamics must be delineated in order to manage and conserve the species effectively. In this study, we used a double-digest RADseq dataset to address three primary questions: (1) Are single meadows or neighborhoods of nearby meadows most correlated with population boundaries? (2) Does asymmetrical migration occur among neighborhoods of nearby meadows? (3) What topographic or hydrological variables predict such asymmetrical migration in these meadow neighborhoods? Hierarchical STRUCTURE and AMOVA analyses suggested that populations are typically circumscribed by a single meadow, although 84% of meadows exist in neighborhoods of at least two meadows connected by low levels of migration, and over half (53%) of neighborhoods examined display strong asymmetrical migration. Meadow neighborhoods often contain one or more large and flat “hub” meadows that experience net immigration, surrounded by smaller and topographically rugged “satellite” meadows with net emigration. Hubs tend to contain more genetic diversity and could be prioritized for conservation and habitat management and as potential sources for reestablishment efforts.
Introduction
Identifying the unit at which a population is ecologically and evolutionarily independent is important because this forms the basis for many conservation and management actions, and for monitoring species status. Often, two types of conservation units are delineated: Management Units (MUs; Dizon et al., 1992; Moritz, 1994; Palsbøll et al., 2007) and Evolutionarily Significant Units (ESUs; Ryder, 1986; Avise, 1994; Moritz, 1994). Present-day independence is captured by MUs, defined as demographically independent populations with sufficiently high growth rates and low connectivity to neighboring units (Palsbøll et al., 2007). Conceptually, MUs should be panmictic units that can persist in spite of low immigration rates (e.g., m <10%) or genetic migration rates (e.g., Nem <1; Waples and Gaggiotti, 2006). The category of MUs is used to reflect present-day population boundaries, and contrasts with ESUs, which are lineages reflecting long-term or ancient isolation sufficient to create fixed genetic or morphological differences, and perhaps even reproductive isolation. In practice, MUs are delineated based on genetic discontinuity or local adaptation to unique environmental conditions (Dizon et al., 1992). Moritz (1994) defined MUs as having significant nuclear or mitochondrial allele frequency divergence, representing present-day genetic or demographic cohesion. Advances in genomics have allowed an unprecedented level of precision to delimit population boundaries, and manage adaptive evolution (Funk et al., 2012; Shafer et al., 2015; Peters et al., 2016; Hendricks et al., 2018; Waples and Lindley, 2018; Waters et al., 2018).
There are still many technological challenges involved in accurately delineating MU boundaries. For example, it has been acknowledged that different processes underlie demographic and genetic connectivity (Lowe and Allendorf, 2010). The number of migrants (Nem) is solely responsible for genetic connectivity, while demographic connectivity is influenced by m relative to birth and death rates. Additionally, genetic connectivity may be disproportionately impacted by rare and unobservable dispersal events, or historical colonization followed by disequilibrium of drift and gene flow (i.e., Slatkin's Paradox; Slatkin, 1985, 1987; Mallet, 2001; Yu et al., 2010). Extrapolating the number of migrants from estimates of genetic structure using FST≈1/(1+4Nem) is therefore non-trivial, particularly under the strict assumptions of the island model (McCauley and Whitlock, 1999). Despite these caveats, dispersal ability is still highly correlated with genetic structure estimates such as FST (Bohonak et al., 1998; Bohonak, 1999), and population genomic datasets have proven very effective compared with small or single-locus datasets for delineating population structure. For example, population genomic approaches have been successfully used in delineating reproductive isolation amongst salmonids (Waples et al., 2020), tracing complex admixture in gray wolf populations (VonHoldt et al., 2016), and identifying invasive introgression in California tiger salamanders (Fitzpatrick et al., 2010).
The Yosemite toad (Anaxyrus [Bufo] canorus) is a federally threatened species of meadow-specializing amphibian that is in need of MU delineation (U.S. Fish Wildlife Service, 2014; Brown et al., 2015). The species is an endemic to the Sierra Nevada Mountains of California, where it underwent a 10-fold demographic decline at multiple localities during the 1970s−1990s, and remains in low abundance today (Sherman and Morton, 1993; Green and Sherman, 2001). Recent phylogeographic work has demonstrated that Pleistocene toad lineages diverged and then admixed to differing extents across an elevational gradient (Maier et al., 2019); however, present-day population boundaries have only been assessed using several markers (Shaffer et al., 2000), and with limited spatial sampling (Wang, 2012). In this study, we aimed to delineate population boundaries for the Yosemite toad (Anaxyrus canorus) that can be used for management within two national parks (Yosemite and Kings Canyon). We used thousands of targeted nuclear markers generated using double-digest restriction-site associated DNA sequencing (ddRADseq), and a sampling scheme that densely covers all known occupied locations, based on a recent 6-year survey (Lee et al.1).
Given the previously identified pattern of isolation-by-distance (IBD), and the statistical issues caused by stepping-stone migration likely taken by toads between meadows (Meirmans, 2012; Perez et al., 2018), we used a hypothesis-driven approach to identify which biologically plausible unit of population best explains gene pool boundaries. Evidence exists for at least three possible levels of population structure: (1) single meadows (mean radius in Yosemite National Park: 266 m), since on average toads travel short yearly distances (275–279 m), have small home ranges (radius: 92–166 m), and display high rates of philopatry (Sherman, 1980; Martin, 2008; Liang, 2010); (2) neighborhoods of nearby meadows, since previous survey and census efforts have found toad meadows to be spatially aggregated (Brown et al., 2012; Berlow et al., 2013; Matchett et al., 2015); and (3) phylogenetically distinct lineages (Maier, 2018; Maier et al., 2019; Figures 1A,B). We used several tests to determine which hierarchical level best matches the population definition of Waples and Gaggiotti (2006), i.e., panmictic units that are demographically or genetically independent from other populations.
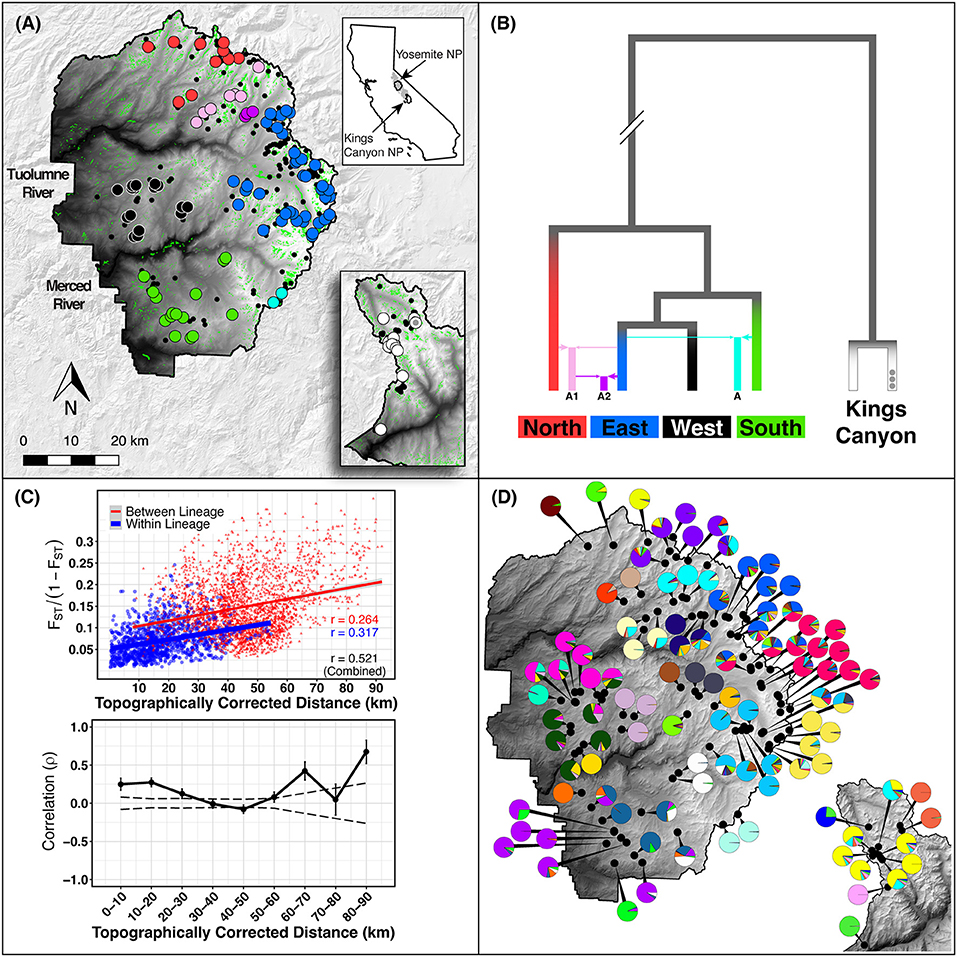
Figure 1. Study area. (A) Study area in Yosemite NP (YOSE) and Kings Canyon NP (KICA), California. Top right inset shows the range of Yosemite toads in gray, and the boundaries of YOSE and KICA in black. Green polygons are all meadows within the parks. Small black circles indicate all known Yosemite toad meadows identified between 1915 and the present. Random noise is added to locations in order to protect the locations of this threatened species. Large circles indicate the meadows with data available in the present study, in YOSE (n = 90) and KICA (n = 12). Colors correspond to phylogenetic lineages, shown in (B), reproduced from Maier et al. (2019). (C) Isolation by distance result based on and topographically corrected distances between meadows. Mantel correlogram shows Mantel correlation coefficients for successive 10 km distance categories. Solid lines are actual correlations, error bars represent bootstrapped confidence intervals, and stippled lines represent permuted confidence intervals (null distribution). (D) Meadow neighborhoods defined by K = 28 (YOSE) and K = 6 (KICA) gene pools from ADMIXTURE cross-validation. Each pie chart represents individual ancestry (i.e., q-values) from each meadow neighborhood, aggregated and displayed at the meadow scale.
Next, we examined potential asymmetrical migration among meadows. Occupancy and breeding frequency of Yosemite toads is known to partly depend on the quality of other meadows in a local neighborhood (Berlow et al., 2013), and a previous microsatellite study attributed 42.6% of genetic structure between meadows to topography and moist climate (Wang, 2012). We therefore hypothesized that neighborhoods of nearby meadows consist of “hubs” with high quality breeding area, minimal topographic complexity, and high site fidelity, resulting in a pattern of net genetic immigration from poor quality “satellite” meadows. We avoid the terminology of “source” and “sink” habitats, because populations may be demographically viable and independent, yet have a net influx of migrants that makes them sinks relative to nearby populations (i.e., “pseudo-sinks;” Watkinson and Sutherland, 1995; Thomas et al., 1996; Kawecki and Holt, 2002). Asymmetrical migration has been detected in many organisms, including fish (Pinhal et al., 2020), wind pollinated trees (Kling and Ackerly, 2021), sea stars (Iguchi et al., 2021), and amphibians (Cortázar-Chinarro et al., 2017; Hantzschmann et al., 2021). Such migrational dynamics may play an important role in population persistence, as it has been shown that demographic stability is influenced by the long-term persistence of hubs, and continued genetic input from satellite populations (Dias, 1996; Gaggiotti and Smouse, 1996).
Our results provide information that can be used to plan and develop effective mitigation for habitat and climate related disturbance. Identifying hub-satellite dynamics may pinpoint hub meadows that will be more robust to ongoing declines, and help inform specific conservation actions, such as relocations.
Materials and Methods
Spatial Extent of Sample Collection
Sites (=meadows) within Yosemite National Park (YOSE) and Kings Canyon National Park (KICA) were chosen to maximize representation across all known breeding locations from a recent 6-year survey effort (Lee et al., see text footnote 1, respectively), and overlap with previous studies (Shaffer et al., 2000; Wang, 2012; Berlow et al., 2013; Maier, 2018; Maier et al., 2019). YOSE includes ~33% of known Yosemite toad meadows, whereas KICA includes the southern-most 4% of toad meadows. Tadpoles were sampled across all available egg clutches, ponds, meadows, and two separate years to maximize inclusion of available genetic diversity and reduce potential bias of oversampling close relatives relative to the total local population. A minimum of five samples was used per meadow if additional meadows were included within 1 km, otherwise 10 samples per meadow were used, unless insufficient samples were available. This scheme maximized intra- and inter-meadow sampling representation across the study area.
We collected tissue samples during the summers of 2011–2013 in YOSE and KICA, and delimited sampling meadows using a park-wide vegetation map with 0.5 ha resolution (Keeler-Wolf et al., 2012; Berlow et al., 2013). Tail tissue was collected from larval toads using a sterilized razor blade.
Molecular Methods, ddRAD Sequencing, and Bioinformatics
We used a ddRADseq haplotype dataset (previously described in Maier, 2018; Maier et al., 2019) for all analyses of genetic differentiation and structure. Details about the library preparation, sequencing, and bioinformatic parameters used to identify variable loci are described therein, and in the Supplementary Materials. Briefly, genomic DNA was extracted using a combination of 96-well glass fiber plate (Ivanova et al., 2006) and DNeasy blood and tissue spin column (Qiagen) protocols. A total of 535 individual Yosemite toad (Anaxyrus canorus) tadpoles sampled from 90 meadows across YOSE, and 109 individual tadpoles sampled from 12 meadows in KICA, were prepared using a double-digest RADseq protocol (Peterson et al., 2012; S1 Protocol), then sequenced using 2 × 100 bp sequencing on an Illumina HiSeq 2500.
Stringent quality thresholds were used in the Stacks v1.19 pipeline (Catchen et al., 2011, 2013) to avoid recovering markers from paralogous sequences. Filtering thresholds were: minimum 10 × locus coverage, 75% complete loci, and minor allele frequency of 0.05. SNPs were called using the multinomial likelihood algorithm of Stacks, which calculates the likelihood of the observed genotypes given the per-base sequencing error rate. Two datasets were generated from a total of 3,261 loci (2,318 YOSE-polymorphic loci, and 1,914 KICA-polymorphic loci): (1) SNPs (one SNP kept per locus), and (2) full RAD-locus haplotypes (concatenated paired-end reads were used where possible, otherwise Read 1 was used). Some analyses required SNP data, whereas others could accommodate the full diversity present among multiple SNPs at a locus due to recombination. Therefore, we used a custom python script previously described in Maier et al. (2019) to output RAD haplotypes in addition to SNPs (fasta2genotype.py; https://github.com/paulmaier/fasta2genotype).
Addressing Potential Sampling Bias
Removing close relatives from population genetic datasets is often a standard practice (Peterman et al., 2016), although it may introduce biases if the original sampling was random. Small and/or inbred populations naturally contain many close relatives, and artificially distorting this composition can bias results toward a pattern of higher genetic diversity (Waples and Anderson, 2017). Removing data inevitably reduces precision and statistical power. Also, kinship estimators such as COLONY (Wang, 2004; Jones and Wang, 2010) and KING (Manichaikul et al., 2010) cannot accurately distinguish between close relatives and unrelated individuals from inbred populations, especially if the markers are low-density, unmapped SNPs (Chen, Personal Communication). To assess the impact of data removal, we used COLONY to estimate full-sib relationships, and calculated pairwise FST with PLINK (Purcell et al., 2007) pre- and post-removal of putative siblings. We used the SNP dataset with YOSE individuals only.
Delineating Population Boundaries
We initially checked all loci for deviations from Hardy-Weinberg expectations at the meadow scale, using the adegenet v2.1.5 package (Jombart, 2008) in R v4.1.2 (R Core Team, 2021). We then used the ade4 v1.7.18 package (Dray and Dufour, 2007) to test for isolation-by-distance (IBD) between meadows with a Mantel test. We used the FST dataset derived from YOSE individual as described above. FST values were linearized into FST/(1−FST) as recommended by Rousset (1997). Since a pattern of IBD or hierarchical structure can confound population delineation algorithms that attempt to assign individuals into a set of clearly differentiated Hardy-Weinberg populations (Meirmans, 2012; Perez et al., 2018), we delineated current population boundaries in three distinct ways.
First, we asked which level of population structure is generally the smallest detectable level: meadows or neighborhoods of nearby meadows. We used a hierarchical STRUCTURE analysis (Vähä et al., 2007), which accounts for IBD by re-running each clustering analysis recursively until no further sub-structure is found. We ran STRUCTURE v2.3.4 (Pritchard et al., 2000) three times for 4.0 × 10⁵ steps and 1.0 ×10⁵ burn-in with K (number of ancestral populations) ranging from 1 to 10. The optimal K was chosen using the ΔK method of Evanno et al. (2005), and individual runs were combined using CLUMPP (Jakobsson and Rosenberg, 2007). This method can only test optimal K values greater than one, so the hypothesis that K = 1 was tested using a paired Wilcoxon test on log-likelihood values (Rosenberg et al., 2001; Emanuelli et al., 2013), to address inherent bias of ΔK toward finding K = 2 when no further substructure exists in reality (Janes et al., 2017). We used the haplotype dataset with YOSE individuals only for this analysis, so as to focus on the general pattern rather than finding every unit.
Second, we estimated which number of ancestral populations most reliably partitions the data. We used ADMIXTURE v1.3.0, which can efficiently apply the STRUCTURE algorithm for multi-locus SNP genotypes at large values of K (Alexander et al., 2009). The cross-validation procedure employed in ADMIXTURE determines which K has the most predictive accuracy, while withholding data points (Alexander and Lange, 2011). We ran ADMIXTURE with 10-fold cross-validation on K ranging from one to the total number of meadows 1–90 (YOSE) or 1–12 (KICA). Whereas, the hierarchical STRUCTURE analysis was used to recursively find the smallest possible unit of population (to account for IBD), this analysis was used to find population units that best describe the entire dataset, and thus, likely an intermediate unit.
Finally, we took a hypothesis-driven approach to population delineation. Given the hierarchical nature of population structure previously described (Shaffer et al., 2000; Wang, 2012), there may be no single “correct” level. Consequently, we hypothesized that one level has a disproportionately large effect on partitioning toads into genetically/demographically independent gene pools. We used a hierarchical analysis of molecular variance (AMOVA) on haplotype data to quantify the relative contribution of meadows, meadow neighborhoods, and lineages to population differentiation. Four distinct phylogenetic lineages with median coalescent ages spanning 296–724 kya, as well as three “fused” lineages formed by inter-lineage hybridization 254–473 kya, were spawned by glacial pulses during the Pleistocene (Figure 1B; Maier et al., 2019). “Meadow neighborhoods” were defined as a group of nearby meadows with >50% assignment to the genetic clusters derived by ADMIXTURE. We used the poppr v2.6.1 function “poppr.amova” with 100 permutations to test for significance. In order to correctly partition the variance components of interest, we included all known levels: individuals, meadows, meadow neighborhoods, lineages, and parks. We compared the ϕ-statistics to values expected under Wright's island model (Wright, 1931), i.e., FST≈1/(1+4Nem), using values of Ne calculated by the single-sample linkage disequilibrium method of NeEstimator v2.01 (Do et al., 2014). We assessed population independence with the 10% migration rate (m) demographic guideline (Hastings, 1993) and one migrant per generation (OMPG; i.e., Nem = 1) genetic guideline (Wright, 1951; Mills and Allendorf, 1996).
Environmental Drivers of Asymmetrical Migration
We hypothesized that meadow neighborhoods (see “Delineating Population Boundaries”) included “hub” meadows that receive and retain the majority of migrants, and lower quality “satellite” meadows with net emigration. We tested this hypothesis by estimating directional migration rates between meadows using the method of Sundqvist et al. (2016). This method calculates geometric means of allele frequencies for a theoretical pool of migrants between each pair of meadows using alleles present in both meadows. Then asymmetrical GST values (Nei and Chesser, 1983) are calculated by comparing each meadow to the migrant pool. Finally, migration rates are estimated from GST values: (Wright, 1931). We extracted pairwise differences between emigration and immigration to yield a unitless measure of net relative migration δM. Relative values are less sensitive to assumptions of the island model, such as drift-migration equilibrium, because they only infer differential migration without explicitly modeling any parameter. For any comparison between two meadows, the meadow with δM < 0 has net immigration, and meadows with δM> 0 have net emigration. For each meadow neighborhood we examined, δM estimates were mapped onto igraph (Csárdi and Nepusz, 2006) objects to display the extent of asymmetrical migration in each neighborhood of meadows.
From previous research, Yosemite toads are most likely to occupy meadows based on a network of environmental attributes at nearby meadows (Berlow et al., 2013). Topographic relief also is known to have a large impact on meadow-to-meadow migration (Wang, 2012). Based on those two likely environmental drivers, we evaluated 10 meadow-scale environmental attributes as potential correlates of hubs and satellites (Table 1). We used ArcGIS 10 to extract four topographic variables derived from the Shuttle Radar Topography Mission (SRTM; Rabus et al., 2003), and five meadow network attributes derived from a LiDAR-based vegetation map from YOSE (Keeler-Wolf et al., 2012). The last variable was a network-boosted probability of toad breeding from previous work (Berlow et al., 2013). Any variables that did not approximate normality were transformed using either logarithmic, exponential, or root transformations. We identified environmental correlates of net migration (δM) individually, using Mantel correlations as implemented by the ncf v1.2.9 package (Bjørnstad, 2019), with 1,000 permutations for significance. We then identified correlations collectively for all variables using a multiple regression on distance matrices (MRDM; Legendre et al., 1994; Lichstein, 2007), using the method of Wang (2013), and 1,000 permutations.
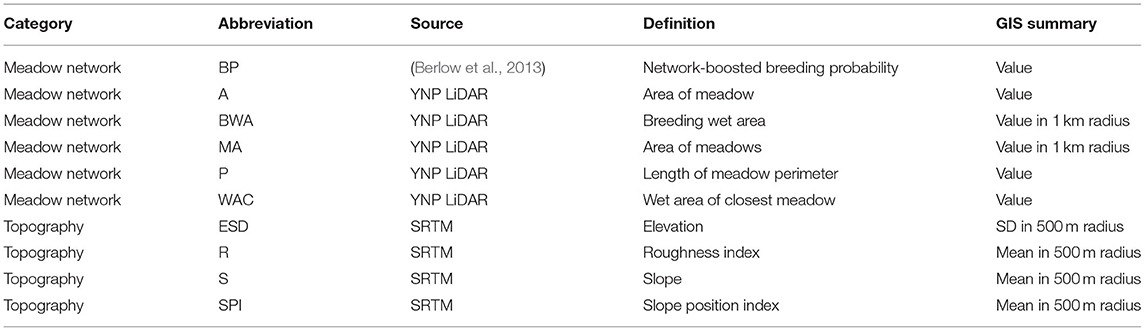
Table 1. Hub-satellite predictive variables.
We also gave “hubs” and “satellites” formal definitions based on extreme values of net migration. Hubs were defined as meadows with average δM that is negative, and at least one standard deviation (SD) less than zero. Satellites were defined as meadows with average δM that is positive, and at least one SD greater than zero. We performed a principal components analysis (PCA) and a linear discriminant analysis (LDA) using the MASS v7.3.54 package (Venables and Ripley, 2002) to identify environmental predictors of the two types. In order to determine the most important discriminatory variables, we performed stepwise variable selection to optimize the accuracy of predictors using the stepclass function of the klaR v0.6.15 package (Weihs et al., 2005). The process uses 10-fold cross-validated accuracy of the LDA to add or remove variables until improvement is <1%.
Results
Addressing Potential Sampling Bias
We found high levels of inbreeding in the final dataset. Using 2,318 un-linked SNP markers variable across YOSE, we estimated that in any given meadow an average of 551 are polymorphic, and an individual is heterozygous for an average of 233 due to meadow-level inbreeding, with average FIS = 0.221. COLONY estimated 173 first-degree relative pairs. Matrices of pairwise FST calculated with and without 173 putative siblings were highly correlated (ρ = 0.948), and therefore, should have little impact on landscape-level results. Based on this result and the fact that close relatives can be overestimated in systems with high inbreeding, we elected to keep all individuals in the dataset to retain a robust sample size for subsequent analyses.
Delineating Population Boundaries
Our suite of analyses supported meadows as the smallest distinguishable genetic and demographic population unit, and that populations were further structured by IBD among meadows. We found significant IBD up to 30 km distances (Figure 1C), suggesting that population structure might be heavily influenced by stepping-stone migration at multiple spatial scales. The hierarchical structure analysis revealed that 63 out of 90 (70.0%) individual meadows in YOSE are the smallest detectable population unit (Figure 2). The remaining units consisted of two meadows (n = 7), three meadows (n = 1), or 10 meadows (n = 1; Tioga). Seven phylogenetic lineages—four pure, three of admixed origin (Maier et al., 2019)—were distinct at high levels in the hierarchy (underlined in Figure 2). The ADMIXTURE analysis delineated units of genetic cohesion intermediate between meadow and lineage (Figure 1D). The lowest ADMIXTURE cross-validation error for YOSE was found at K=28, and for KICA was K=6, although subsequent K values elicited only gradual increases in cross-validation error (Supplementary Figures S1, S2). Most meadows (84.3%) were contained in neighborhoods of two or more meadows, with a mean size of 3.0 meadows, and a maximum of 12 meadows (Tioga). Out of 34 total meadow neighborhoods across both parks, 16 (47.1%) contained only one meadow. In most cases, these singleton “neighborhoods” were in terrain separated by canyons (e.g., Rancheria, Thompson, Wells, Tilden, and Twin Lakes in the Y-North lineage). Names and summary statistics for each neighborhood are in Supplementary Table S1.
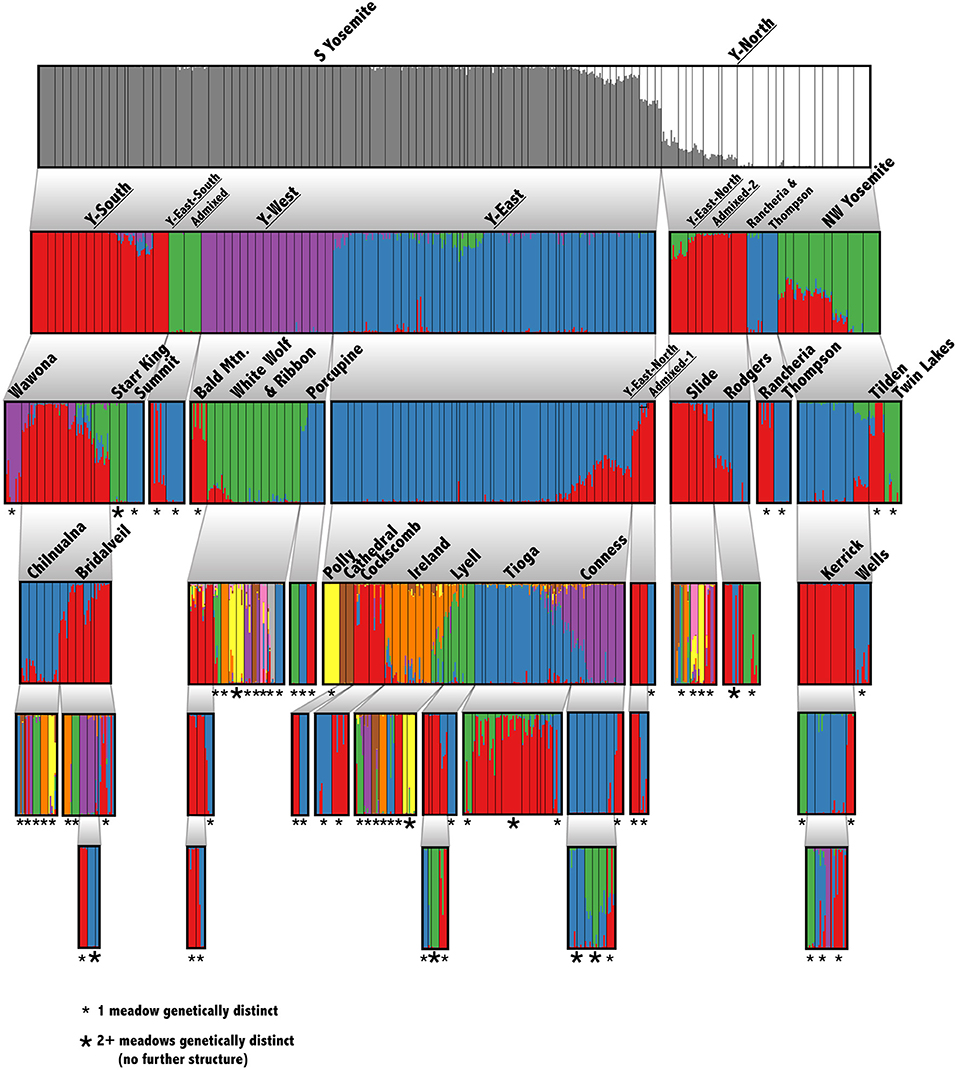
Figure 2. Hierarchical genetic structure in Yosemite NP. Barplots of recursive STRUCTURE analyses down to the smallest detectable unit. Thin, black, vertical bars indicate meadow boundaries. Each analysis considered a range of K from 1 to 10, and the optimal K was chosen following Evanno et al. (2005). The hypothesis that K = 1 was tested using a paired Wilcoxon test. Each cluster was rerun until reaching the meadow level or finding no further structure. The smallest detectable unit is labeled: single meadow (small *) or multiple meadows (large *). Phylogenetic lineages from Maier et al. (2019) are underlined.
The hierarchical AMOVA found a large proportion of total variance between parks (30.46%; ϕPT = 0.305) as expected (Table 2). Meadows within neighborhoods showed the next highest variance (23.54%) and had the highest ϕ-statistic (ϕMN = 0.406), supporting the idea that much more of the genetic variation is partitioned among meadows than meadow neighborhoods (3.71%; ϕNL = 0.06). Mean pairwise ϕMN for meadows within each neighborhood had comparable levels (mean: 0.409; sd: 0.08; Supplementary Table S1). Further, we estimated meadows to be demographically independent (m <10%) based on average observed meadow Ne of 29.13 (Supplementary Table S1), and FST ≥ 0.079 (ϕMN = 0.406). In contrast, we estimated neighborhoods to have average Ne of 23.33 and require FST ≥ 0.097 for demographic independence, a value greater than the observed statistic ϕNL = 0.06. The estimated threshold for genetic independence among either unit regardless of population size (Nem ≤ 1) is FST ≥ 0.2, which is consistent with meadows but not meadow neighborhoods being genetically independent. Patterns of conformity to Hardy Weinberg expectations at the meadow and meadow neighborhood scales further supported meadow distinctiveness, with meadows deviating at 2.48% of genotypes, compared to 4.86% for meadow neighborhoods, a nearly two-fold difference (Supplementary Figure S3).
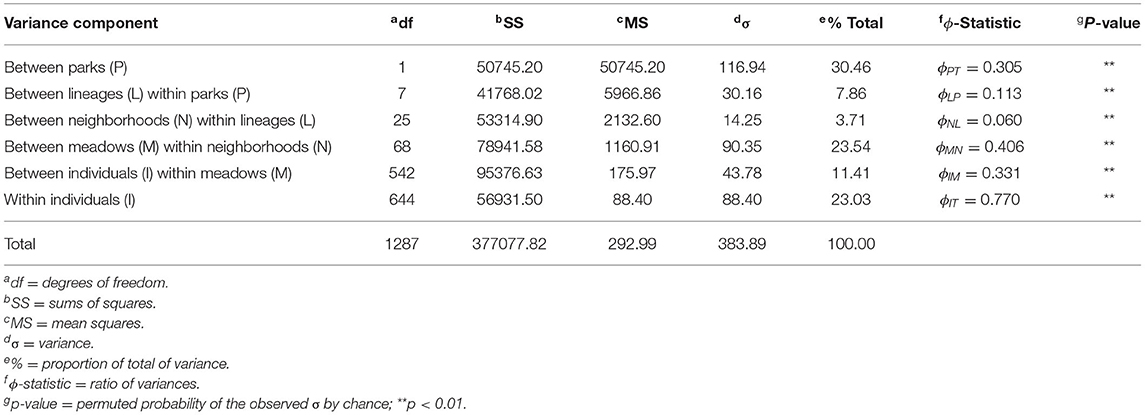
Table 2. Analysis of Molecular Variance (AMOVA) results based on five hierarchical levels: park, lineage, meadow neighborhoods (defined by ADMIXTURE cross-validation), meadows, and individuals. Significance is based on 100 random permutations with one-tailed test.
Environmental Drivers of Asymmetrical Migration
Out of 34 total meadow neighborhoods across both parks, nine contained a moderate sample size (n≥5) of meadows. We found that asymmetrical migration was strong in six (67%) based on the presence of at least one hub or satellite meadow, i.e., with migration greater than one standard deviation from symmetrical (Supplementary Table S2; Figure 3). Hub meadows showed high relative HE (Supplementary Table S1) and much stronger genetic immigration than emigration. Out of these nine neighborhoods initially examined, three had a single hub meadow, and another three had two to three hubs. Distinct satellite meadows were only identified in three (33%) of these neighborhoods. A detailed example is depicted in Supplementary Figure S4.
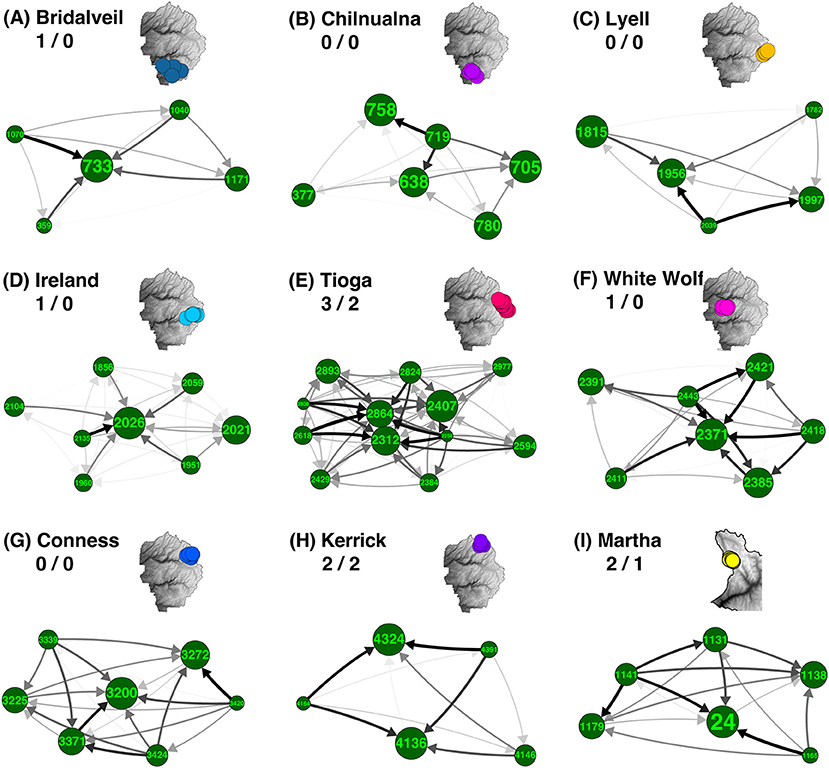
Figure 3. Asymmetrical migration in meadow neighborhoods. Most of the meadow neighborhoods with five or more meadows are groups of closely related meadows with one or a few highly admixed “hubs” surrounded by more genetically distinct “satellites.” For each neighborhood, net asymmetry in migration rates (difference between emigration and immigration) is summarized by direction and shade of arrow. Meadow IDs and associated neighborhood names are labeled for all nine neighborhoods in YOSE and KICA that contain five or more meadows. Meadow node sizes are weighted by expected heterozygosity (HE; see Supplementary Table S1). Inset maps denote location of each meadow neighborhood (A–I) and have identical colors to Figure 1D. Numbers following neighborhood names indicate number of identified hubs/satellites (i.e., δM more than one standard deviation from zero).
We found environmental patterns characteristic of all 18 hubs and satellites more broadly (Figure 4), regardless of meadow count (i.e., n ≥ 2). Generally, we found that hub meadows are significantly larger, and less topographically complex, than satellite meadows (Figures 4A–D). The first two principal components of the PCA accounted for 76.3% of the variance, and this variance was orthogonally split into the two categories of variables: meadow network attributes, and topography (Figure 4E). However, topographic variables had a much smaller boost to discriminatory power compared with meadow network variables. The LDA function based on all 10 variables had a 100.0% predictive accuracy rate, and an 83.5% cross-validated accuracy rate (Figure 4F). The stepwise variable selection for LDA identified four variables that significantly improved discrimination between hubs and satellites: meadow area, breeding wet area, wet area of the closest meadow, and SD of elevation (within 500 m of the sampled location).
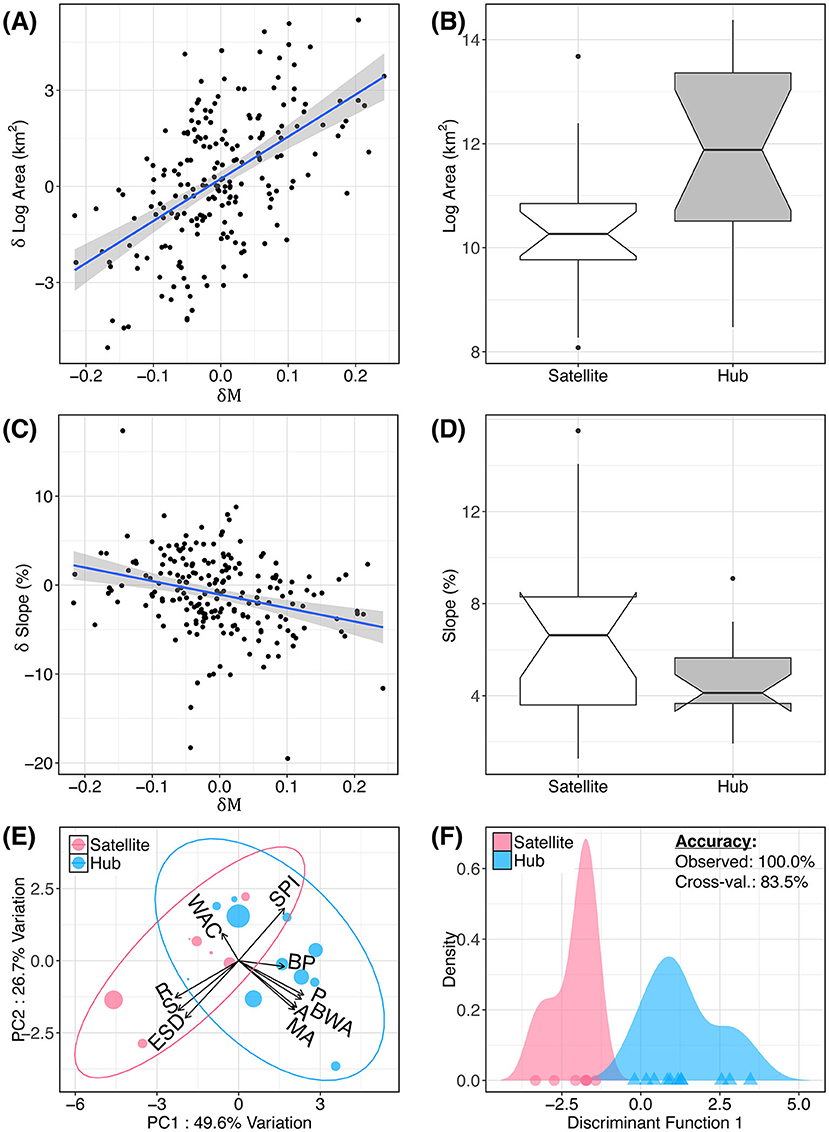
Figure 4. Attributes of hub and satellite meadows. Hub (exceptional immigration rate) and satellite (exceptional emigration rate) meadows from Figure 3 are related to several environmental variables. Relationship between net relative migration (δM) and relative difference in pairwise meadow area (A) and slope (C) are shown. In (B,D), these pairwise differences are aggregated by meadow to show mean meadow area and slope for hubs and satellites (i.e., meadows having δM more than one standard deviation from zero). (E) Principal components analysis (PCA) of meadow environment. Variables are described in Table 1. (F) Linear discriminant analysis (LDA) showing the predictive accuracy of these 10 variables to discriminate between hubs and satellites.
Individual t-tests confirmed that hubs are significantly larger, and less topographically complex, than satellite meadows. Compared with satellites, hub meadows (defined as having δM values ≤ 1 SD below zero) have significantly larger mean areas (t = 3.10, df = 10.1, p = 0.006), perimeters (t = 3.56, df = 11.3, p = 0.002), and breeding wet area within 1 km (t = 2.35, df = 13.1, p = 0.017). Satellites have (within 500 m of the sampled location): higher slope (t = −2.51, df = 8.06, p = 0.081), elevation SD (t = −2.1, df = 7.65, p = 0.035), and roughness index (t = −3.03, df = 10.7, p = 0.006). Hubs also had lower mean slope within 500 m of the sampled location (t = −2.15, df = 9.11, p = 0.03). Interestingly, although hubs had larger areas and larger nearby wet areas, their nearest neighboring meadow had significantly less wet area (t = −2.37, df = 6.01, p = 0.028). All tests remained significant after correcting for multiple comparisons with the FDR method (Benjamini and Hochberg, 1995) with a maximum p-value of 0.035.
We also found significant relationships between pairwise differences in meadow environment (δ environment) and net asymmetrical migration (δM) using an MRDM (Supplementary Table S3; Supplementary Figure S5). For pairwise regression analyses, we considered all meadows in a neighborhood, regardless of whether they were extreme hubs or satellites. The general result can be summarized as follows: for any two meadows in a neighborhood, the meadow with larger area and less topographic ruggedness tends to have net immigration (influx of gene copies). The five significant variables in the model were: meadow area, breeding wet area, wet area of the closest meadow, total area of meadows within 1 km, and percent slope (within 500 m of the sampled location). The MRDM results supported the above pattern of meadow area strongly influencing hub-satellite dynamics, and meadow ruggedness having a small to moderate influence (Figures 4A–D). We found that meadow area explained the largest percentage of the variance (30.0%), followed by wet area of the closest meadow (10.3%), while the remaining variables collectively only accounted for 5.1% of the variance [0.43, F(10, 399) = 31.79, p <0.001].
We performed a post-hoc test of Mantel correlations (with 1,000 permutations) for each variable and found each to be significant after correcting for multiple comparisons with the FDR method. Interestingly, this included a small but significant positive correlation between δM and δ(slope position index) meaning that meadows closer to hilltops have net genetic influx (ρ = 0.11, p = 0.013). We also found a small but significant positive correlation between δM and δ (breeding probability), indicating that meadows with higher probability of breeding have net genetic influx (ρ = 0.14, p = 0.007).
Discussion
Are Meadows a Useful Unit for Population Management?
We found that individual toad meadows are genetically distinguishable in 70% of cases, and that almost half (47.1%; n = 16) of meadow neighborhoods contain one meadow (Figures 1D, 2). Moreover, we found that meadows are the unit contributing most to population subdivision (ϕMN = 0.406) compared with meadow neighborhoods (ϕNL = 0.06) and lineages (ϕLP = 0.113) (Table 2). Our results are broadly consistent with previous findings of significant among-“pond” (=meadow) variation (Shaffer et al., 2000); however, they are informed by substantially expanded sample size (n = 102; n = 28), marker set (n = 3,261; n = 1), and number of hierarchical levels (n = 5; n = 3). Our estimates of average meadow migration rate (m≪10%) and number of migrants (Nem≪1) are based on island model assumptions; however, our result (meadows are the most distinct unit) is robust to those assumptions.
Meadow distinctness makes sense given that toad-occupied meadows in YOSE have a mean radius of 266 m (Keeler-Wolf et al., 2012), and are typically surrounded by more xeric vegetation. Yosemite toads are observed to have small average home range size (radius: 92–166 m) and high rates of philopatry in short-term mark-recapture studies (Sherman, 1980; Martin, 2008; Liang, 2010). A sample of five other Nearctic toads (formerly “Bufo”) have comparable average home ranges, with radius between 15 and 390 m (Denton and Beebee, 1993; Kusano et al., 1995; Muths, 2003; Forester et al., 2006). Yosemite toads may occasionally travel long distances (maximum 1,261 m; Martin, 2008; Liang, 2010), but this may be infrequent enough for most meadows to remain independent population units.
Although most meadows are genetically distinct, 84.3% of meadows are members of multi-meadow neighborhoods, and inter-meadow genetic rescue may be important over longer time scales. Also, several exceptions to this pattern exist: e.g., Tioga, Conness, Ireland, and White Wolf meadow neighborhoods appear undifferentiated, due to high gene flow or recent colonization (Figure 2). Two out of four of these undifferentiated neighborhoods (Tioga and White Wolf) are bisected by a major highway (CA-120), which has been identified as a barrier to connectivity (Maier, 2018). Future work should try to precisely estimate migration relative to demographic stability of these meadows, for example by using parentage analysis, genetic assignment, and simulations (Peery et al., 2008, 2010).
Meadow Attributes Impact Network Connectivity
Despite the distinctness of most meadows, we found low-level migration amongst meadows in neighborhoods. Strong asymmetrical migration was found in over half (53%) of the neighborhoods containing two or more meadows. Our asymmetrical migration analysis found that larger and topographically flatter meadows predictably (with 83.5% cross-validated accuracy) act as regional genetic hubs (Figures 3, 4), and often these meadows are centrally positioned in the spatial arrangement of these meadow neighborhoods (e.g., Supplementary Figure S4). This means that one or several meadows within each neighborhood tend to receive a disproportionately large amount of genetic input and send a disproportionately small amount of genetic output. Hubs tended to be not only bigger and flatter, but have more wet area nearby, and be positioned closer to hilltops than satellites. Aside from large meadow area, the second-best discriminator of hubs was that they neighbored a meadow with minimal wet area. This may underscore the importance of juxtaposing breeding habitat with more xeric upland meadow habitat, which plays a vital role in Yosemite toad foraging and hibernation (Sherman, 1980; Morton, 1981; Martin, 2008). It is important to note that due to collinearity, it is also possible that big, wet meadows necessarily exist adjacent to relatively dry neighbor meadows, but without a larger dataset these two variables are difficult to disentangle.
Contrasting environmental correlates have previously been found for persistent vs. intermittent meadows; proximity to fire perimeters and timber harvest were predictors of intermittently occupied meadows in one study (Liang and Stohlgren, 2011). However, the present study offered the first insight into genetic hub-satellite structure, with 10 m resolution of meadow network attributes that predict hubs and satellites. High hub genetic diversity appears to reflect genetic admixture; multiple satellite meadows surround them and promote the mixing of genetically diverse toads in a central area. The ultimate cause for this is unclear: perhaps temporally fluctuating habitat quality or low carrying capacity in satellite meadows periodically sends migrants seeking refuge in hub meadows (Holt et al., 2004). Our result is consistent with the discovery that toad breeding detection in YOSE has increased at higher quality meadows, between two survey efforts spaced one decade apart (Lee et al., see text footnote 1, respectively). If climate change or other stressors are degrading marginal habitat in satellites, then toads may be consolidating at hubs in response.
By the same token, large hub meadows may act as genetic (pseudo-)sinks because breeding toads show higher rates of philopatry within superior breeding conditions. Populations below carrying capacity may be demographically independent if they do not require immigration to persist (Watkinson and Sutherland, 1995). For example, the pseudo-sink populations of the butterfly Euphydryas editha survived a severe frost in nearby Sequoia National Forest, after which they thrived and became sources (Thomas et al., 1996; Boughton, 1999). Thus, net immigration in hubs could reflect recent environmental disturbance. We also cannot rule out the possibility that hubs are actually source populations, but with excess private alleles. The premise of the private allele method used in this study is that populations with more unique alleles are more isolated. However, hubs may simply be larger and more stable populations that have accumulated more diversity, and the homogeneity of satellite populations may be due to recent founder effects (Sundqvist et al., 2016). This alternative is not easily disentangled using a single genetic dataset and is better tested by tracking studies. Regardless, hub admixture is a common pattern in our study. Since admixture is pervasive on a larger scale (i.e., between lineages; Maier, 2018; Maier et al., 2019; Figures 1A,B), it is unsurprising to find admixture plays an important role at a smaller scale. This result comes with the caveat that many neighborhoods have few meadows ( = 3.0). Therefore, there are also many examples of isolated meadows and meadow pairs existing without a large, admixed meadow nearby.
Conclusions and Conservation Implications
Meadows are the most genetically distinct unit of population for Yosemite toads. However, our fine-scale sampling and environmental analysis showed that this is not the entire story. Most (84.3%) of toad meadows exhibit low levels of gene flow with neighborhood meadows, in many cases displaying hub-satellite structure. Genetic distinctness is consistent with the MU definition; however, recent demographic declines (Sherman and Morton, 1993; Green and Sherman, 2001; Ne estimates in Supplementary Table S1) suggest that present and future population viability of Yosemite toads may depend on connectivity between meadows.
Hub meadows may be robust to climate change and fluctuations, given their pattern of higher immigration and genetic diversity. Therefore, hub meadows may be important refugia for nearby meadows with environmental instability, although this assumes hub meadows are not also in danger of demographic decline. Climate change (Brown et al., 2015; Maier, 2018), disease (Lindauer, 2018; Lindauer and Voyles, 2019), or synergistic effects between the two (Lindauer et al., 2020) may continue to reduce carrying capacity and growth rate, while reducing gene flow from satellites as well as foreign meadow neighborhoods, which could eventually force all meadows toward an extinction vortex.
Mitigation efforts in the short term could take advantage of the higher genetic diversity of hubs for translocation efforts or captive breeding programs. Although hubs are a potentially useful resource for medium to large meadow neighborhoods, many meadows exist in isolation. Out of 102 meadows in our study, 16 were singleton “neighborhoods” and a further eight were neighborhoods of only two. Isolated meadows could also be prioritized for protection efforts due to their potentially unique genotypes, which may play a role in future adaptation to climate change and/or disease.
Future research could investigate the population dynamics of hub and satellite meadows over multiple generations, to determine parameters such as growth rate and net migration rate. We found that hubs are identifiable 100% of the time in our dataset, and with 83.5% cross-validated accuracy, based primarily on meadow size, proximity to upland habitat, and gentle topography, to a lesser extent. Those variables may be useful proxies for genetic hubs in Yosemite toad meadow complexes across the species distribution.
Data Availability Statement
No original genetic data were produced in this study. Demultiplexed fastq files of double-digest RADseq data are available at NCBI GenBank SRA under BioProject PRJNA558546 (https://www.ncbi.nlm.nih.gov/sra/PRJNA558546). Scripts and genotype data used to perform analyses in this study are deposited at Dryad (https://doi.org/10.5061/dryad.xsj3tx99h). The U.S. Geological Survey metadata record associated with this study can be found at the USGS Science Data Catalog (https://doi.org/10.5066/P9KABYPU).
Ethics Statement
This animal study was reviewed and approved by San Diego State University Animal Care and use protocol #13-03-001B.
Author Contributions
PM, SO, AA, AV, and AB designed the study. PM and SO collected tissue samples. PM performed the laboratory work and conducted the analyses, with guidance from AB, AV, and AA. PM wrote the manuscript, with input from AV, AB, SO, and AA. All authors contributed to the article and approved the submitted version.
Funding
This research was supported by U.S. Geological Survey, Ecosystems Mission Area, Natural Resource Preservation Program Research grant awarded to SO, Eric Berlow, and Matthew Brooks. In addition, PM received funding from the Harold & June Memorial, Jordan D. Covin, and ARCS scholarships.
Conflict of Interest
The authors declare that the research was conducted in the absence of any commercial or financial relationships that could be construed as a potential conflict of interest.
Publisher's Note
All claims expressed in this article are solely those of the authors and do not necessarily represent those of their affiliated organizations, or those of the publisher, the editors and the reviewers. Any product that may be evaluated in this article, or claim that may be made by its manufacturer, is not guaranteed or endorsed by the publisher.
Acknowledgments
We thank Michael Hernandez, Johanne Boulat, Alexa Killion, Mara MacKinnon, Alexa Lindauer, Ross Maynard, Nathalie Aall, Corrina Kamoroff, Steven Lee, Amy Patton, Heidi Rodgers, Cameron DeMaranville, Keevan Harding, and Brenna Blessing for assistance with field specimen collection. Jared Grummer provided technical advice that improved library preparation for sequencing. We thank Jonathan Q. Richmond, Brian J. Halstead, Leonard Nunney, and Daniel Shryock for their comments that significantly improved the writing of this manuscript. This research informed a part of Chapter 3 in PM's doctoral dissertation. The UC Merced Sierra Nevada Institute provided housing and accommodations for fieldwork. Any use of trade, product, or firm names is for descriptive purposes only and does not imply endorsement by the U.S. Government.
Supplementary Material
The Supplementary Material for this article can be found online at: https://www.frontiersin.org/articles/10.3389/fcosc.2022.851676/full#supplementary-material
Footnotes
1. ^Lee, S. L., Ostoja, S.M.,Maier, P. A.,Matchett, J. R.,McKenny, H. C., Brooks,M. L., et al. (in preparation). Distribution and spatio-temporal variation of Yosemite toad populations in Sierra Nevada national parks.
References
Alexander, D. H., and Lange, K. (2011). Enhancements to the ADMIXTURE algorithm for individual ancestry estimation. BMC Bioinformatics 12, 1–6. doi: 10.1186/1471-2105-12-246
Alexander, D. H., Novembre, J., and Lange, K. (2009). Fast model-based estimation of ancestry in unrelated individuals. Genome Res. 19, 1655–1664. doi: 10.1101/gr.094052.109
Avise, J. C.. (1994). Molecular Markers, Natural History, and Evolution. New York, NY: Chapman & Hall.
Benjamini, Y., and Hochberg, Y. (1995). Controlling the false discovery rate: a practical and powerful approach to multiple testing. J. R. Stat. Soc. Ser. B 57, 289–300. doi: 10.1111/j.2517-6161.1995.tb02031.x
Berlow, E. L., Knapp, R., Ostoja, S. M., Williams, R. J., McKenny, H., Matchett, J. R., et al. (2013). A network extension of species occupancy models in a patchy environment applied to the Yosemite toad (Anaxyrus canorus). PLoS ONE 8, e72200. doi: 10.1371/journal.pone.0072200
Bjørnstad, O. N.. (2019). Package “ncf”: Spatial Covariance Functions. CRAN. p. 1–44. Available online at: https://CRAN.R-project.org/package=ncf
Bohonak, A.. (1999). Dispersal, gene flow, and population structure. Q. Rev. Biol. 74, 21–45. doi: 10.1086/392950
Bohonak, A. J., Davies, N., Roderick, G. K., and Villablanca, F. X. (1998). Is population genetics mired in the past? Trends Ecol. Evol. 13, 360. doi: 10.1016/S0169-5347(98)01422-0
Boughton, D. A.. (1999). Empirical evidence for complex source-sink dynamics with alternative states in a butterfly metapopulation. Ecology 80, 2727–2739. doi: 10.1890/0012-9658(1999)0802727:EEFCSS2.0.CO;2
Brown, C., Hayes, M. P., Green, G. A., Macfarlane, D. C., and Lind, A. J. (2015). Yosemite Toad Conservation Assessment. Sonora, CA. Available online at: http://herpconbio.org/Volume_7/Issue_2/Brown_etal_2012.pdf
Brown, C., Kiehl, K., and Wilkinson, L. (2012). Advantages of long-term, multi-scale monitoring: assessing the current status of the Yosemite toad (Anaxyrus canorus) in the Sierra Nevada, California. Herpetol. Conserv. Biol. 7, 115–131.
Catchen, J., Hohenlohe, P. A., Bassham, S., Amores, A., and Cresko, W. A. (2013). Stacks: an analysis tool set for population genomics. Mol. Ecol. 22, 3124–3140. doi: 10.1111/mec.12354
Catchen, J. M., Amores, A., Hohenlohe, P., Cresko, W., and Postlethwait, J. H. (2011). Stacks: building and genotyping loci de novo from short-read sequences. G3 Genes Genomes Genetics 1, 171–182. doi: 10.1534/g3.111.000240
Cortázar-Chinarro, M., Lattenkamp, E. Z., Meyer-Lucht, Y., Luquet, E., Laurila, A., and Höglund, J. (2017). Drift, selection, or migration? Processes affecting genetic differentiation and variation along a latitudinal gradient in an amphibian. BMC Evolut. Biol. 17, 1–14. doi: 10.1186/s12862-017-1022-z
Csárdi, G., and Nepusz, T. (2006). The igraph software package for complex network research. InterJournal Complex Syst. 1695, 1–9. Available online at: http://interjournal.org/manuscript_abstract.php?361100992
Denton, J. S., and Beebee, T. J. C. (1993). Density-related features of natterjack toad (Bufo calamita) population in Britain. J. Zool. 229, 105–119. doi: 10.1111/j.1469-7998.1993.tb02624.x
Dias, P. C.. (1996). Sources and sinks in population biology. Trends Ecol. Evol. 11, 326–330. doi: 10.1016/0169-5347(96)10037-9
Dizon, A. E., Lockyer, C., Perrin, W. F., Demaster, D. P., and Sisson, J. (1992). Rethinking the stock concept: a phylogeographic approach. Conserv. Biol. 6, 24–36. doi: 10.1046/j.1523-1739.1992.610024.x
Do, C., Waples, R. S., Peel, D., Macbeth, G. M., Tillett, B. J., and Ovenden, J. R. (2014). NeEstimator v2: re-implementation of software for the estimation of contemporary effective population size (Ne) from genetic data. Mol. Ecol. Resour. 14, 209–214. doi: 10.1111/1755-0998.12157
Dray, S., and Dufour, A. B. (2007). The ade4 package: implementing the duality diagram for ecologists. J. Stat. Softw. 22, 1–20. doi: 10.18637/jss.v022.i04
Emanuelli, F., Lorenzi, S., Grzeskowiak, L., Catalano, V., Stefanini, M., Troggio, M., et al. (2013). Genetic diversity and population structure assessed by SSR and SNP markers in a large germplasm collection of grape. BMC Plant Biol. 13, 1–17. doi: 10.1186/1471-2229-13-39
Evanno, G., Regnaut, S., and Goudet, J. (2005). Detecting the number of clusters of individuals using the software STRUCTURE: a simulation study. Mol. Ecol. 14, 2611–2620. doi: 10.1111/j.1365-294X.2005.02553.x
Fitzpatrick, B. M., Johnson, J. R., Kump, D. K., Smith, J. J., Voss, S. R., and Shaffer, H. B. (2010). Rapid spread of invasive genes into a threatened native species. Proc. Natl. Acad. Sci. USA 107, 3606–3610. doi: 10.1073/pnas.0911802107
Forester, D. C., Snodgrass, J., Marsalek, K., and Lanham, Z. (2006). Post-breeding dispersal and summer home range of female American toads (Bufo americanus). Northeastern Naturalist 13, 59–72. doi: 10.1656/1092-6194(2006)1359:PDASHR2.0.CO;2
Funk, W. C., McKay, J. K., Hohenlohe, P. A., and Allendorf, F. W. (2012). Harnessing genomics for delineating conservation units. Trends Ecol. Evol. 27, 489–496. doi: 10.1016/j.tree.2012.05.012
Gaggiotti, O. E., and Smouse, P. E. (1996). Stochastic migration and maintenance of genetic variation in sink populations. Am. Nat. 147, 919–945. doi: 10.1086/285886
Green, D. E., and Sherman, C. K. (2001). Diagnostic histological findings in Yosemite toads (Bufo canorus) from a die-off in the 1970s. J. Herpetol. 35, 92–103. doi: 10.2307/1566028
Hantzschmann, A. M., Sinsch, U., Göttlicher, C., and Pröhl, H. (2021). Conservation genetics of yellow-bellied toads (Bombina variegata): a matter of geographical scale and isolation. Conserv. Genet. 22, 83–96. doi: 10.1007/s10592-020-01320-3
Hastings, A.. (1993). Complex interactions between dispersal and dynamics: lessons from coupled logistic equations. Ecology 74, 1362–1372. doi: 10.2307/1940066
Hendricks, S., Anderson, E. C., Antao, T., Bernatchez, L., Forester, B. R., Garner, B., et al. (2018). Recent advances in conservation and population genomics data analysis. Evol. Appl. 11, 1197–1211. doi: 10.1111/eva.12659
Holt, R. D., Barfield, M., and Gomulkiewicz, R. (2004). Temporal variation can facilitate niche evoluiton in harsh sink environments. Am. Nat. 164, 187–200. doi: 10.1086/422343
Iguchi, A., Tada, I., Nagano, A. J., and Yasuda, N. (2021). Genetic structure of Pacific crown-of-thorns starfish (Acanthaster cf. solaris) in southern Japan based on genome-wide RADseq analysis. Coral Reefs 40, 1379–1385. doi: 10.1007/s00338-021-02145-3
Ivanova, N. V., Dewaard, J. R., and Hebert, P. (2006). An inexpensive, automation-friendly protocol for recovering high-quality DNA. Mol. Ecol. Notes 6, 998–1002. doi: 10.1111/j.1471-8286.2006.01428.x
Jakobsson, M., and Rosenberg, N. A. (2007). CLUMPP: A cluster matching and permutation program for dealing with label switching and multimodality in analysis of population structure. Bioinformatics 23, 1801–1806. doi: 10.1093/bioinformatics/btm233
Janes, J. K., Miller, J. M., Dupuis, J. R., Malenfant, R. M., Gorrell, J. C., Cullingham, C. I., et al. (2017). The K = 2 conundrum. Mol. Ecol. 26, 3594–3602. doi: 10.1111/mec.14187
Jombart, T.. (2008). adegenet: a R package for the multivariate analysis of genetic markers. Bioinformatics 24, 1403–1405. doi: 10.1093/bioinformatics/btn129
Jones, O. R., and Wang, J. (2010). COLONY: a program for parentage and sibship inference from multilocus genotype data. Mol. Ecol. Resour. 10, 551–555. doi: 10.1111/j.1755-0998.2009.02787.x
Kawecki, T. J., and Holt, R. D. (2002). Evolutionary consequences of asymmetric dispersal rates. Am. Nat. 160, 333. doi: 10.1086/341519
Keeler-Wolf, T., Reyes, E. T., Menke, J. M., and Johnson, D. N. Karavidas D. L. (2012). Yosemite National Park Vegetation Classification and Mapping Project Report. Fort Collins, CO.
Kling, M. M., and Ackerly, D. D. (2021). Global wind patterns shape genetic differentiation, asymmetric gene flow, and genetic diversity in trees. Proc. Natl. Acad. Sci. USA. 118, e2017317118. doi: 10.1073/pnas.2017317118
Kusano, T., Maruyama, K., and Kaneko, S. (1995). Post-breeding dispersal of the Japanese toad, Bufo japonicus. J. Herpetol. 29, 633–638. doi: 10.2307/1564755
Legendre, P., Lapointe, F., and Casgrain, P. (1994). Modeling brain evolution from behavior: a permutational regression approach. Evolution 48, 1487–1499. doi: 10.1111/j.1558-5646.1994.tb02191.x
Liang, C. T.. (2010). Habitat modeling and movements of the Yosemite toad (Anaxyrus (=Bufo) canorus) in the Sierra Nevada, California. [dissertation]. University of California, Davis, Davis, CA, United States.
Liang, C. T., and Stohlgren, T. J. (2011). Habitat suitability of patch types: a case study of the Yosemite toad. Front. Earth Sci. 5, 217–228. doi: 10.1007/s11707-011-0157-2
Lichstein, J. W.. (2007). Multiple regression on distance matrices: a multivariate spatial analysis tool. Plant Ecol. 188, 117–131. doi: 10.1007/s11258-006-9126-3
Lindauer, A.. (2018). The role of hydroperiod and fluctuating temperature on disease dynamics: a disease ecology approach to understanding Yosemite toad declines (Master's thesis). University of Nevada Reno, Reno, NV, United States.
Lindauer, A. L., Maier, P. A., and Voyles, J. (2020). Daily fluctuating temperatures decrease growth and reproduction rate of a lethal amphibian fungal pathogen in culture. BMC Ecol. 20, 1–9. doi: 10.1186/s12898-020-00286-7
Lindauer, A. L., and Voyles, J. (2019). Out of the frying pan, into the fire? Yosemite toad (Anaxyrus canorus) susceptibility to Batrachochytrium dendrobatidis after development under drying conditions. Herpetological Conserv. Biol. 14, 185–198. Available online at: https://www.herpconbio.org/Volume_14/Issue_1/Lindauer_Voyles_2019.pdf
Lowe, W. H., and Allendorf, F. W. (2010). What can genetics tell us about population connectivity? Mol. Ecol. 19, 3038–3051. doi: 10.1111/j.1365-294X.2010.04688.x
Maier, P. A.. (2018). Evolutionary past, present, and future of the Yosemite toad (Anaxyrus canorus): a total evidence approach to delineating conservation units (Dissertation). University of California Riverside, Riverside, CA, United States.
Maier, P. A., Vandergast, A. G., Ostoja, S. M., Aguilar, A., and Bohonak, A. J. (2019). Pleistocene glacial cycles drove lineage diversification and fusion in the Yosemite toad (Anaxyrus canorus). Evolution 73, 2476–2496. doi: 10.1111/evo.13868
Mallet, J.. (2001). “Gene flow,” in Insect Movement: Mechanisms and Consequences, eds I. P. Woiwood, D. R. Reynolds, and C. D. Thomas (London: CAB International), 337–360.
Manichaikul, A., Mychaleckyj, J. C., Rich, S. S., Daly, K., Sale, M., and Chen, W. M. (2010). Robust relationship inference in genome-wide association studies. Bioinformatics 26, 2867–2873. doi: 10.1093/bioinformatics/btq559
Martin, D. L.. (2008). Decline, movement and habitat utilization of the Yosemite toad (Bufo canorus): an endangered anuran endemic to the Sierra Nevada of California (Dissertation). University of California, Santa Barbara, CA, United States.
Matchett, J. R., Stark, P. B., Ostoja, S. M., Knapp, R. A., McKenny, H. C., Brooks, M. L., et al. (2015). Detecting the influence of rare stressors on rare species in Yosemite National Park using a novel stratified permutation test. Sci. Rep. 5, 1–12. doi: 10.1038/srep10702
McCauley, D. E., and Whitlock, M. C. (1999). Indirect measures of gene flow and migration: FST ≠ 1/(4Nm+1). Heredity 82, 117–125. doi: 10.1038/sj.hdy.6884960
Meirmans, P. G.. (2012). The trouble with isolation by distance. Mol. Ecol. 21, 2839–2846. doi: 10.1111/j.1365-294X.2012.05578.x
Mills, L. S., and Allendorf, F. W. (1996). The one migrant per generation rule in conservation and management. Conserv. Biol. 10, 1509–1518. doi: 10.1046/j.1523-1739.1996.10061509.x
Moritz, C.. (1994). Defining “evolutionarily significant units” for conservation. Trends Ecol. Evol. 9, 373–375. doi: 10.1016/0169-5347(94)90057-4
Morton, M.. (1981). Seasonal changes in total body lipid and liver weight in the Yosemite toad. Copeia 1981, 234–238. doi: 10.2307/1444067
Muths, E.. (2003). Home range and movements of boreal toads in undisturbed habitat. Copeia 2003, 160–165. doi: 10.1643/0045-8511(2003)0030160:HRAMOB2.0.CO;2
Nei, M., and Chesser, R. K. (1983). Estimation of fixation indices and gene diversities. Ann. Hum. Genet. 47, 253–259. doi: 10.1111/j.1469-1809.1983.tb00993.x
Palsbøll, P., Berube, M., and Allendorf, F. (2007). Identification of management units using population genetic data. Trends Ecol. Evol. 22, 11–16. doi: 10.1016/j.tree.2006.09.003
Peery, M., Beissinger, S., and House, R. (2008). Characterizing source-sink dynamics with genetic parentage assignments. Ecology 89, 2746–2759. doi: 10.1890/07-2026.1
Peery, M. Z., Hall, L. A., Sellas, A., Beissinger, S. R., Moritz, C., Bérubé, M., et al. (2010). Genetic analyses of historic and modern marbled murrelets suggest decoupling of migration and gene flow after habitat fragmentation. Proc. R. Soc. B Biol. Sci. 277, 697–706. doi: 10.1098/rspb.2009.1666
Perez, M. F., Franco, F. F., Bombonato, J. R., Bonatelli, I. A. S., Khan, G., Romeiro-Brito, M., et al. (2018). Assessing population structure in the face of isolation by distance: Are we neglecting the problem? Diversity Distribut. 24, 1883–1889. doi: 10.1111/ddi.12816
Peterman, W., Brocato, E. R., Semlitsch, R. D., and Eggert, L. S. (2016). Reducing bias in population and landscape genetic inferences: the effects of sampling related individuals and multiple life stages. PeerJ 4, e1813. doi: 10.7717/peerj.1813
Peters, J. L., Lavretsky, P., DaCosta, J. M., Bielefeld, R. R., Feddersen, J. C., and Sorenson, M. D. (2016). Population genomic data delineate conservation units in mottled ducks (Anas fulvigula). Biol. Conserv. 203, 272–281. doi: 10.1016/j.biocon.2016.10.003
Peterson, B. K., Weber, J. N., Kay, E. H., Fisher, H. S., and Hoekstra, H. E. (2012). Double digest RADseq: an inexpensive method for de novo SNP discovery and genotyping in model and non-model species. PLoS ONE 7, e37135. doi: 10.1371/journal.pone.0037135
Pinhal, D., Domingues, R. R., Bruels, C. C., Ferrette, B. L. S., Gadig, O. B. F., Shivji, M. S., et al. (2020). Restricted connectivity and population genetic fragility in a globally endangered Hammerhead Shark. Rev. Fish Biol. Fish 30, 501–517. doi: 10.1007/s11160-020-09607-x
Pritchard, J. K., Stephens, M., and Donnelly, P. (2000). Inference of population structure using multilocus genotype data. Genetics 155, 945–959. doi: 10.1093/genetics/155.2.945
Purcell, S., Neale, B., Todd-Brown, K., Thomas, L., Ferreira, M. A. R., Bender, D., et al. (2007). PLINK: a tool set for whole-genome association and population-based linkage analyses. Am. J. Human Genet. 81, 559–575. doi: 10.1086/519795
R Core Team (2021). R: A Language and Environment for Statistical Computing. Available online at: https://www.r-project.org
Rabus, B., Eineder, M., Roth, A., and Bamler, R. (2003). The shuttle radar topography mission - a new class of digital elevation models acquired by spaceborne radar. ISPRS J. Photogrammetry Remote Sens. 57, 241–262. doi: 10.1016/S0924-2716(02)00124-7
Rosenberg, N. A., Burke, T., Elo, K., Feldman, M. W., Freidlin, P. J., Groenen, M. A. M., et al. (2001). Empirical evaluation of genetic clustering methods using multilocus genotypes from 20 chicken breeds. Genetics 159, 699–713. doi: 10.1093/genetics/159.2.699
Rousset, F.. (1997). Genetic differentiation and estimation of gene flow from F-statistics under isolation by distance. Genetics 145, 1219–1228. doi: 10.1093/genetics/145.4.1219
Ryder, O. A.. (1986). Species conservation and systematics: the dilemma of subspecies. Trends Ecol. Evol. 1, 9–10. doi: 10.1016/0169-5347(86)90059-5
Shafer, A. B. A., Wolf, J. B. W., Alves, P. C., Bergström, L., Bruford, M. W., Brännström, I., et al. (2015). Genomics and the challenging translation into conservation practice. Trends Ecol. Evol. 30, 78–87. doi: 10.1016/j.tree.2014.11.009
Shaffer, H., Fellers, G., Magee, A., and Voss, S. (2000). The genetics of amphibian declines: population substructure and molecular differentiation in the Yosemite toad, Bufo canorus (Anura, Bufonidae) based on single-strand conformation polymorphism analysis (SSCP) and mitochondrial DNA sequence data. Mol. Ecol. 9, 245–257. doi: 10.1046/j.1365-294x.2000.00835.x
Sherman, C. K.. (1980). A comparison of the natural history and mating system of two anurans: Yosemite toads (Bufo canorus) and Black toads (Bufo exsul) (Dissertation). University of Michigan, Ann Arbor, MI, United States.
Sherman, C. K., and Morton, M. L. (1993). Population declines of Yosemite toads in the eastern Sierra Nevada of California. J. Herpetol. 27, 186–198. doi: 10.2307/1564935
Slatkin, M.. (1985). Rare alleles as indicators of gene flow. Evolution 39, 53–65. doi: 10.1111/j.1558-5646.1985.tb04079.x
Slatkin, M.. (1987). Gene flow and the geographic structure of natural populations. Science 236, 787–792. doi: 10.1126/science.3576198
Sundqvist, L., Keenan, K., Zackrisson, M., Prodöhl, P., and Kleinhans, D. (2016). Directional genetic differentiation and relative migration. Ecol. Evol. 6, 3461–3475. doi: 10.1002/ece3.2096
Thomas, C. D., Singer, M. C., and Boughton, D. A. (1996). Catastrophic extinction of population sources in a butterfly metapopulation. Am. Nat. 148, 957–975. doi: 10.1086/285966
U.S. Fish Wildlife Service (2014). Endangered and threatened wildlife and plants; endangered status for the Sierra Nevada yellow-legged frog and the northern distinct population segment of the mountain yellow-legged frog, and threatened status for the Yosemite toad: final rule. Fed. Regist. 24255–24310. Available online at: https://www.federalregister.gov/documents/2014/04/29/2014-09488/endangered-and-threatened-wildlife-and-plants-endangered-species-status-for-sierra-nevada
Vähä, J. P., Erkinaro, J., Niemelä, E., and Primmer, C. R. (2007). Life-history and habitat features influence the within-river genetic structure of Atlantic salmon. Mol. Ecol. 16, 2638–2654. doi: 10.1111/j.1365-294X.2007.03329.x
Venables, W. N., and Ripley, B. D. (2002). Modern Applied Statistics With S. New York, NY: Springer.
VonHoldt, B. M., Cahill, J. A., Fan, Z., Gronau, I., Robinson, J., Pollinger, J. P., et al. (2016). Whole-genome sequence analysis shows that two endemic species of North American wolf are admixtures of the coyote and gray wolf. Sci. Adv. 2, 1–14. doi: 10.1126/sciadv.1501714
Wang, I. J.. (2012). Environmental and topographic variables shape genetic structure and effective population sizes in the endangered Yosemite toad. Diversity Distribut. 18, 1033–1041. doi: 10.1111/j.1472-4642.2012.00897.x
Wang, I. J.. (2013). Examining the full effects of landscape heterogeneity on spatial genetic variation: a multiple matrix regression approach for quantifying geographic and ecological isolation. Evolution 67, 3403–3411. doi: 10.1111/evo.12134
Wang, J.. (2004). Sibship reconstruction from genetic data with typing errors. Genetics 166, 1963–1979. doi: 10.1093/genetics/166.4.1963
Waples, R. S., and Anderson, E. C. (2017). Purging putative siblings from population genetic data sets: a cautionary view. Mol. Ecol. 26, 1211–1224. doi: 10.1111/mec.14022
Waples, R. S., and Gaggiotti, O. (2006). What is a population? An empirical evaluation of some genetic methods for identifying the number of gene pools and their degree of connectivity. Mol. Ecol. 15, 1419–1439. doi: 10.1111/j.1365-294X.2006.02890.x
Waples, R. S., and Lindley, S. T. (2018). Genomics and conservation units: the genetic basis of adult migration timing in Pacific salmonids. Evol. Appl. 11, 1518–1526. doi: 10.1111/eva.12687
Waples, R. S., Naish, K. A., and Primmer, C. R. (2020). Conservation and management of salmon in the age of genomics. Annu. Rev. Anim. Biosci. 8, 117–143. doi: 10.1146/annurev-animal-021419-083617
Waters, C. D., Hard, J. J., Brieuc, M. S. O., Fast, D. E., Warheit, K. I., Knudsen, C. M., et al. (2018). Genomewide association analyses of fitness traits in captive-reared Chinook salmon: applications in evaluating conservation strategies. Evol. Appl. 11, 853–868. doi: 10.1111/eva.12599
Watkinson, A. R., and Sutherland, W. J. (1995). Sources, sinks and pseudo-sinks. J. Anim. Ecol. 64, 126. doi: 10.2307/5833
Weihs, C., Ligges, U., Luebke, K., and Raabe, N. (2005). “klaR analyzing German business cycles,” in Studies in Classification, Data Analysis, and Knowledge Organization, eds D. Baier, R. Decker, and L. Schmidt-Thieme (Heidelberg: Springer), 335–343.
Wright, S.. (1931). Evolution in Mendelian populations. Genetics 16, 97–159. doi: 10.1093/genetics/16.2.97
Wright, S.. (1951). The genetical structure of populations. Ann. Eugen. 15, 323–354. doi: 10.1111/j.1469-1809.1949.tb02451.x
Keywords: population genetics, conservation, asymmetrical migration, source-sink dynamics, isolation-by-distance, amphibian conservation, meadows, RADseq
Citation: Maier PA, Vandergast AG, Ostoja SM, Aguilar A and Bohonak AJ (2022) Gene Pool Boundaries for the Yosemite Toad (Anaxyrus canorus) Reveal Asymmetrical Migration Within Meadow Neighborhoods. Front. Conserv. Sci. 3:851676. doi: 10.3389/fcosc.2022.851676
Received: 10 January 2022; Accepted: 21 February 2022;
Published: 01 April 2022.
Edited by:
Cristiano Vernesi, Fondazione Edmund Mach, ItalyReviewed by:
Jie Gao, Xishuangbanna Tropical Botanical Garden (CAS), ChinaBelma Kalamujic Stroil, University of Sarajevo-Institute for Genetic Engineering and Biotechnology, Bosnia and Herzegovina
Copyright © 2022 Maier, Vandergast, Ostoja, Aguilar and Bohonak. This is an open-access article distributed under the terms of the Creative Commons Attribution License (CC BY). The use, distribution or reproduction in other forums is permitted, provided the original author(s) and the copyright owner(s) are credited and that the original publication in this journal is cited, in accordance with accepted academic practice. No use, distribution or reproduction is permitted which does not comply with these terms.
*Correspondence: Paul A. Maier, paulm@genebygene.com
†ORCID: Paul A. Maier orcid.org/0000-0003-0851-8827
Amy G. Vandergast orcid.org/0000-0002-7835-6571
Steven M. Ostoja orcid.org/0000-0002-9182-4413
Andres Aguilar orcid.org/0000-0002-4409-9597
Andrew J. Bohonak orcid.org/0000-0002-5429-2331