 Clement F. Kent1*
 Alivia Dey1
 Harshilkumar Patel1Nadejda Tsvetkov1Tanushree Tiwari1Victoria J. MacPhail2,3Yann Gobeil4Brock A. Harpur1,5,6James Gurtowski7
 Michael C. Schatz7,8Sheila R. Colla2,3
 Amro Zayed1*
- 1Department of Biology, York University, Toronto, ON, Canada
- 2Wildlife Preservation Canada, Guelp, ON, Canada
- 3Faculty of Environmental Studies, York University, Toronto, ON, Canada
- 4FaunENord, Chibougamau, QC, Canada
- 5Donnelly Centre, University of Toronto, Toronto, ON, Canada
- 6Department of Molecular Genetics, University of Toronto, Toronto, ON, Canada
- 7Simons Center for Quantitative Biology, Cold Spring Harbor Laboratory, Cold Spring Harbor, NY, United States
- 8Departments of Computer Science and Biology, Johns Hopkins University, Baltimore, MD, United States
The yellow-banded bumblebee Bombus terricola was common in North America but has recently declined and is now on the IUCN Red List of threatened species. The causes of B. terricola’s decline are not well understood. Our objectives were to create a partial genome and then use this to estimate population data of conservation interest, and to determine whether genes showing signs of recent selection suggest a specific cause of decline. First, we generated a draft partial genome (contig set) for B. terricola, sequenced using Pacific Biosciences RS II at an average depth of 35×. Second, we sequenced the individual genomes of 22 bumblebee gynes from Ontario and Quebec using Illumina HiSeq 2500, each at an average depth of 20×, which were used to improve the PacBio genome calls and for population genetic analyses. The latter revealed that several samples had long runs of homozygosity, and individuals had high inbreeding coefficient F, consistent with low effective population size. Our data suggest that B. terricola’s effective population size has decreased orders of magnitude from pre-Holocene levels. We carried out tests of selection to identify genes that may have played a role in ameliorating environmental stressors underlying B. terricola’s decline. Several immune-related genes have signatures of recent positive selection, which is consistent with the pathogen-spillover hypothesis for B. terricola’s decline. The new B. terricola contig set can help solve the mystery of bumblebee decline by enabling functional genomics research to directly assess the health of pollinators and identify the stressors causing declines.
Introduction
Pollinators are responsible for or augment the reproduction of 80–95% of all flowering plants (Ollerton et al., 2011), including many agricultural crops (Klein et al., 2007). Bumblebees (Bombus spp.) are important pollinators of many plants, particularly in North America and Europe (Kearns et al., 1998; Berenbaum et al., 2007). Their ability to ‘buzz’ pollinate (Plowright and Laverty, 1987; Dogterom et al., 1998) makes them more suitable than honey bees for pollination of certain plants. However, many species of bumblebees have experienced recent declines (e.g., Williams et al., 2009, 2014; Williams and Osborne, 2009; Cameron et al., 2011). In North America, members of the subgenus Bombus sensu stricto seem to be particularly vulnerable (Grixti et al., 2009; Cameron et al., 2011; Colla et al., 2012; Hatfield et al., 2015). These species share certain ecological characteristics, including having a short tongue length and early spring emergence (Colla, 2016). Several general hypotheses have been proposed to explain bumblebee declines. These include habitat loss, climate change and pathogen spillover – the introduction of novel pathogens from commercial honeybees and bumblebee colonies to native colonies (Grixti et al., 2009; Szabo et al., 2012; Kerr et al., 2015). The specific causes underlying the decline of any given species or population of bumblebees often remain elusive.
The rapid decline of Bombus terricola Kirby 1837, illustrates the difficulties with diagnosing bumblebee declines. B. terricola is a native species in North America inhabiting much of Canada and parts of the United States, from the Eastern Temperate and Boreal forest regions, south along higher elevations of the Appalachians, west through North Dakota and the Canadian Great Plains, to the Tundra and Taiga of Canada and the Mountain West (Williams et al., 2009; Williams et al., 2014). It nests underground and is often found close to or within wooded areas and wetlands (Williams et al., 2009, 2014). This species has been noted to have significantly declined both in relative abundance and distribution throughout its native range and is designated as ‘of conservation concern’ in Canada (Colla and Packer, 2008; Cameron et al., 2011; Hatfield et al., 2015) and is now on the IUCN Red List of threatened species (Hatfield et al., 2015; Spevak et al., 2015; Colla, 2016).
Conservation genomics – the use of high throughput genomics to study species targeted for conservation – is an emerging field that promises to transform conservation biology and pollinator conservation (Lozier and Zayed, 2016). Conservation genomics allows researchers to ask questions about species decline that were previously intractable using traditional (i.e., marker-based) population genetic methods. For example, researchers can directly quantify genetic diversity at phenotypically- and adaptively- relevant loci, and study how at-risk species are able to adapt to environmental stressors. Moreover, genomic tools and methods provide a framework for testing different hypotheses of species decline, by searching for transcriptomic or population genomic signals of response to stress (Lozier and Zayed, 2016).
Our objectives in this study were: to estimate the effective population size of B. terricola and related measures of possible inbreeding; to determine whether there are genes showing signs of recent selection; and, to find whether functional patterns in such genes help to distinguish between hypothesized causes of decline such as habitat loss, pesticides, climate change, and pathogen spillover.
Here we generated and analyzed several genomic datasets for the declining B. terricola, to aid in ongoing conservation efforts. Briefly, first we generated a draft partial genome or contig set, and associated gene predictions, using a long-read sequencing technology [Pacific Biosciences RS II (Rhoads and Au, 2015)]. Illumina HiSeq 2500 reads were used with Pilon (Walker et al., 2014) to iteratively refine the genome calls. In silico predictions of putative genes were then compared to the B. terrestris v1.0, and tools (Simão et al., 2015) were used to determine what proportion of a highly conserved arthropod genes set were in our gene set. We then used Illumina HiSeq 2500 to sequence the individual genomes of 22 further B. terricola samples from Ontario and Québec. Population genomics analyses showed evidence of recent declines in population size, and excess homozygosity across the genome indicative of inbreeding. Forensic-style analyses hinted at the role of pathogens as an important and recent selective pressure, which is consistent with the pathogen spillover hypothesis for B. terricola’s decline (Colla et al., 2006; Otterstatter and Thomson, 2008; Szabo et al., 2012; Graystock et al., 2016). Our sequencing costs and genomic analysis were suitable for conservation research on species without genomes. The genomic resources developed herein will facilitate future functional genomics research on healthy and declining B. terricola populations, to identify causes of their decline and to develop appropriate conservation management strategies for species recovery.
Materials and Methods
Sampling
The B. terricola specimens studied herein were sampled, in the provinces of Ontario and Québec, with a subset of sampled females used for sequencing as described below.
Surveys for B. terricola gynes occurred at over 30 sites within its historical range across Southern Ontario in April and May 2014; B. terricola gynes from 10 sites (Supplementary Table S1) were kept in the lab for behavioral study and prepared for sequencing if they died or at end of study period. Gynes were frozen in a household freezer as soon as they were found dead. In late July 2014, the frozen bees were transferred to a -80°C freezer at York University; 13 were used for genome sequencing and analysis.
Similarly, we also carried out surveys in northern Quebec near the towns of Chapais and Chibougamau in late May and June 2014. Twelve B. terricola gynes were sampled from nine sites (Supplementary Table S1). Gynes were monitored until natural death. While gynes were usually transferred to a -20°C freezer within 24–48 h of dying, some were left in their boxes for several days prior to freezing. Samples were packed in 95% ethanol and shipped to York University in January 2015; 9 were used for sequencing.
Our objective in this study was to limit the impact of our collections on the natural population. The number of gynes produced per colony of B. terricola is quite variable, which is particularly obvious in studies of captive bumblebees, with an average of 11 gynes produced per colony (Plowright, 1966; Plowright and Jay, 1968; Owen et al., 1980). Although any removal of gynes from an area carries the risk of reducing the overall population, the limited numbers collected in this study are unlikely to impact the population in a significant way.
Our goal was to collect bees over a range of natural habitats and latitudes. Bees were collected from a number of sites (Figure 1) in Ontario and Québec, Canada (Supplementary Table S1). On average, Québec sites were approximately 500 km north of Ontario sites and were contained in an estimated area of 12,000 km2. Ontario sites were contained in an estimated area of 77,000 km2. Ontario sites are in the Eastern Great Lakes Lowland forests ecoregion while Québec sites are in the Eastern Canadian Forest-Boreal transition ecoregion (Dinerstein et al., 2017).
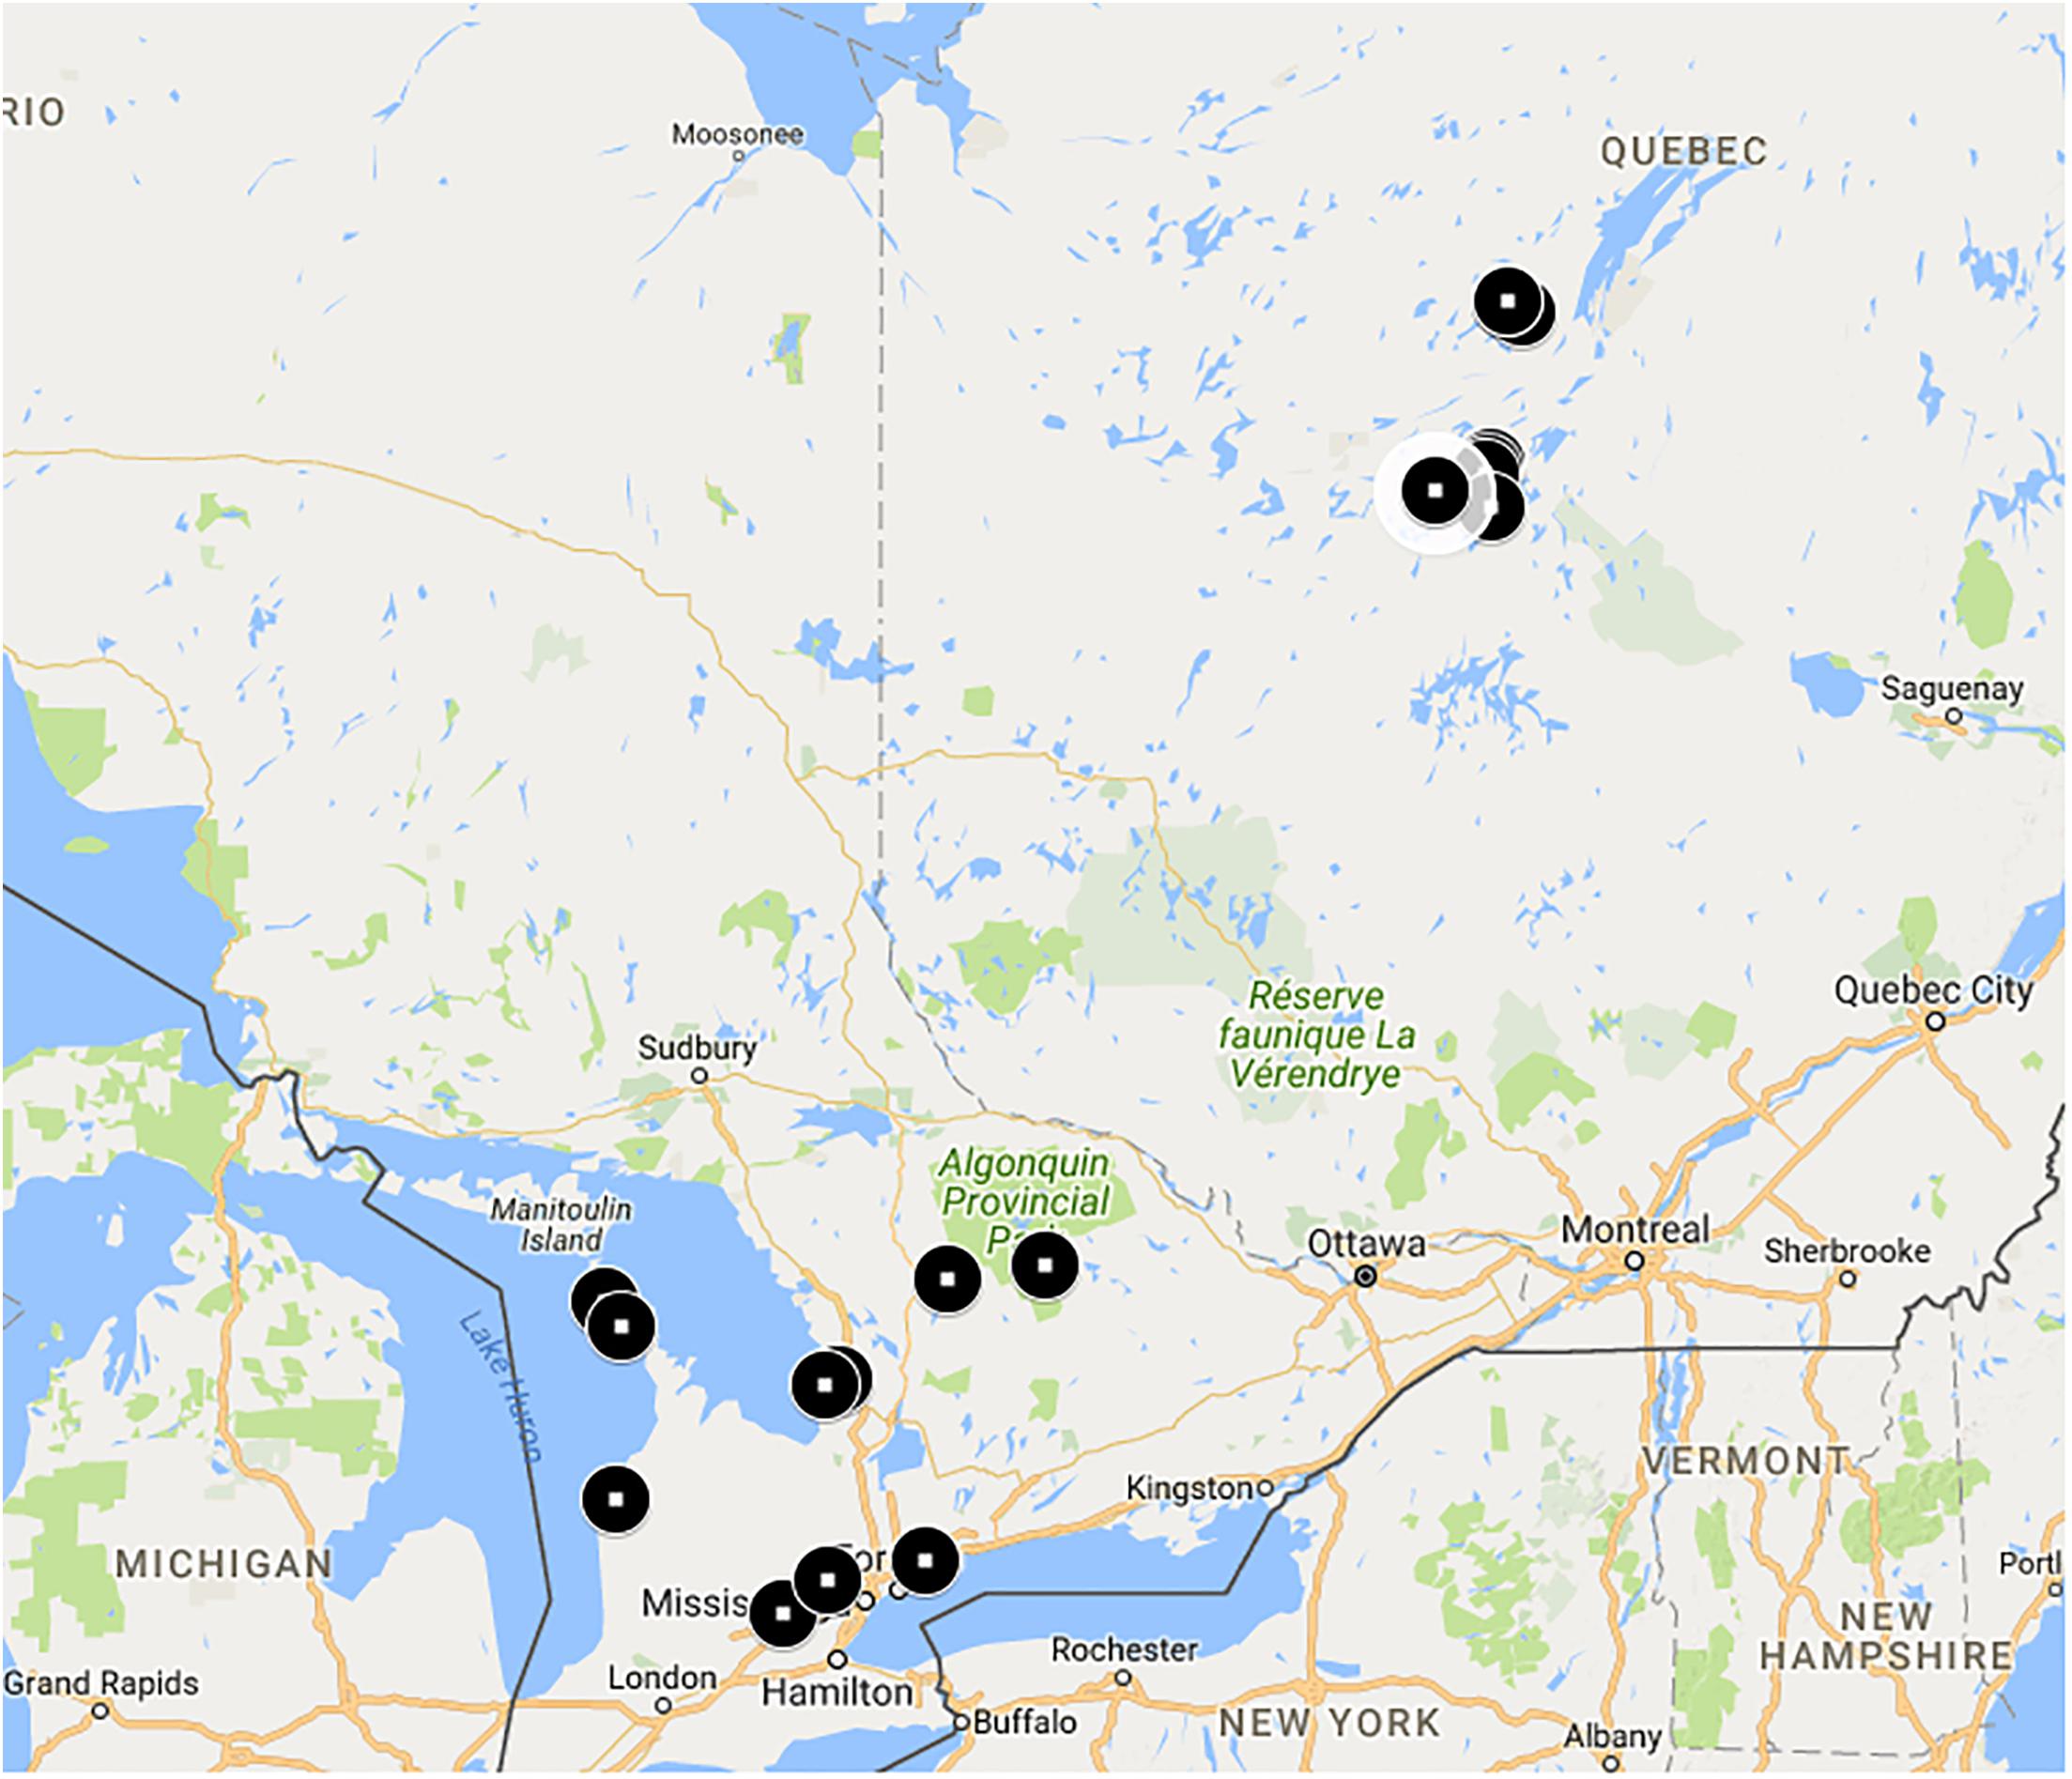
FIGURE 1. Bombus terricola collection sites. See Supplementary Table S1 for details.
DNA Extraction for the Reference Contig Assembly
High quality, high molecular weight genomic DNA was extracted from one B. terricola gyne using Qiagen Genomic-tip protocol and Qiagen Blood and Cell Culture DNA mini kit (Qiagen, Hilden, Germany) using manufacturer’s protocol with modifications in the lysis step. Specifically, 20 mg of bee tissue (comprising thorax and legs) was divided into two parts and lysis was carried out in two tubes of ∼10 mg tissue as starting material. For each part, the tissue was ground using liquid nitrogen, 350 μl CTAB extraction buffer (0.1 M Tris-HCl at ph8.0, 1.4 M NaCl, 0.02 M EDTA, 2% Cetyltrimethyl ammonium bromide) and 2 μl RNAse A added, and incubated at 37°C for 30 min. To this 20 μl Proteinase K and 1 ml Buffer G2 (supplied in the kit) was added and incubated overnight at 50°C. Next morning, the lysates from two tubes were vortexed and added to one Genomic-tip column. The protocol from here onwards was followed as specified in the kit’s manual. The size of the genomic DNA was evaluated on a pulse-field gel electrophoresis. The DNA was further quantified and checked for purity using Nanodrop. The high quality DNA isolated from this B. terricola gyne was sent to Génome Québec Innovation Centre (Montreal, Canada) for generating libraries and sequencing using the Pacific BioSciences RS II long read technology (Pacific Biosciences, Menlo Park, CA, United States). A total of 15 SMRT cells were used for this one sample to generate ∼35× coverage.
DNA Extraction for Population Genomics
For the 22 samples of B. terricola from Ontario and Quebec, DNA was extracted from bee thoraces using Omega Bio-tek Magbind® Blood DNA HDQ 96 kit (Omega Bio-tek Inc., Norcross, GA, United States) using manufacturer’s protocol. DNA quality was checked and quantified by standard agarose gel electrophoresis and Nanodrop. Subsequently DNA samples from these bees were sent to The Centre for Applied Genomics, Toronto, Canada for library preparation (using the Illumina TruSeq DNA PCR-Free kit) and sequencing by Illumina HiSeq 2500 at an average coverage of 20×.
Reference Genome Assembly
The B. terricola contig set was assembled from the PacBio sequencing data of a single gyne using a self-correction and assembly approach derived from the PBcR algorithm (Koren et al., 2013). Briefly, all raw PacBio reads greater than 5 kbp long (max read length: 53,848 bp), representing approximately 35× fold coverage of the genome, were aligned to each other using the DAligner algorithm (Myers, 2014) using the parameters “–l2000 –M35.” After aligning the reads, the raw reads were error corrected by computing the consensus of how the reads aligned to a given read using the Dazcon algorithm with the parameters: “-xo -l 1000 -j 5 -c 4 -t 4 -m 450.” We used Daligner and Dazcon instead of the default PBcR components to accommodate the larger genome size as recommended by PacBio. The source code for these modules is available from the Pacific Biosciences Github repository: https://github.com/PacificBiosciences/pbdagcon.git, commit id: c2776be553e0408f77f1389e5ecddbc8a12fd619.
After error correction, the reads were assembled using the Celera Assembler 8.3rc2, which has been optimized for long read assembly (Koren et al., 2013). The Celera Assembler uses a string graph approach (Myers, 2005), where the long reads are overlapped to each other to form the initial graph, after which the graph was transformed and simplified to form the final contigs using the bogart unitigging algorithm (Koren et al., 2013). We used revision 4650 of the source code available from sourceforge here: svn: //svn.code.sf.net/p/wgs-assembler/svn/trunk/src. Based on the read length and coverage available after error correction, we used the following parameters for the assembly: frgMinLen = 3000, ovlMinLen = 200, ovlMerSize = 21, ovlErrorRate = 0.03, utgGraphErrorRate = 0.03, utgGenomeSize = 250000000, unitigger = bogart.
The resulting assembly consisted of 26,131 contigs ranging from 7,676 bp to 2,171,155 bp long. The NG50 size, meaning that half of the genome was assembled into contigs this size or larger, was 359 kbp assuming a genome size of 250 Mbp. However, the total span of the assembly was 566 Mbp, most likely because of the heterozygosity present in the sequencing data lead to a partially phased assembly (Chin et al., 2016). Indeed, using the GenomeScope algorithm (Vurture et al., 2017) with the available Illumina sequencing data, we estimate the genome size to be 248 Mbp (Figure 2).
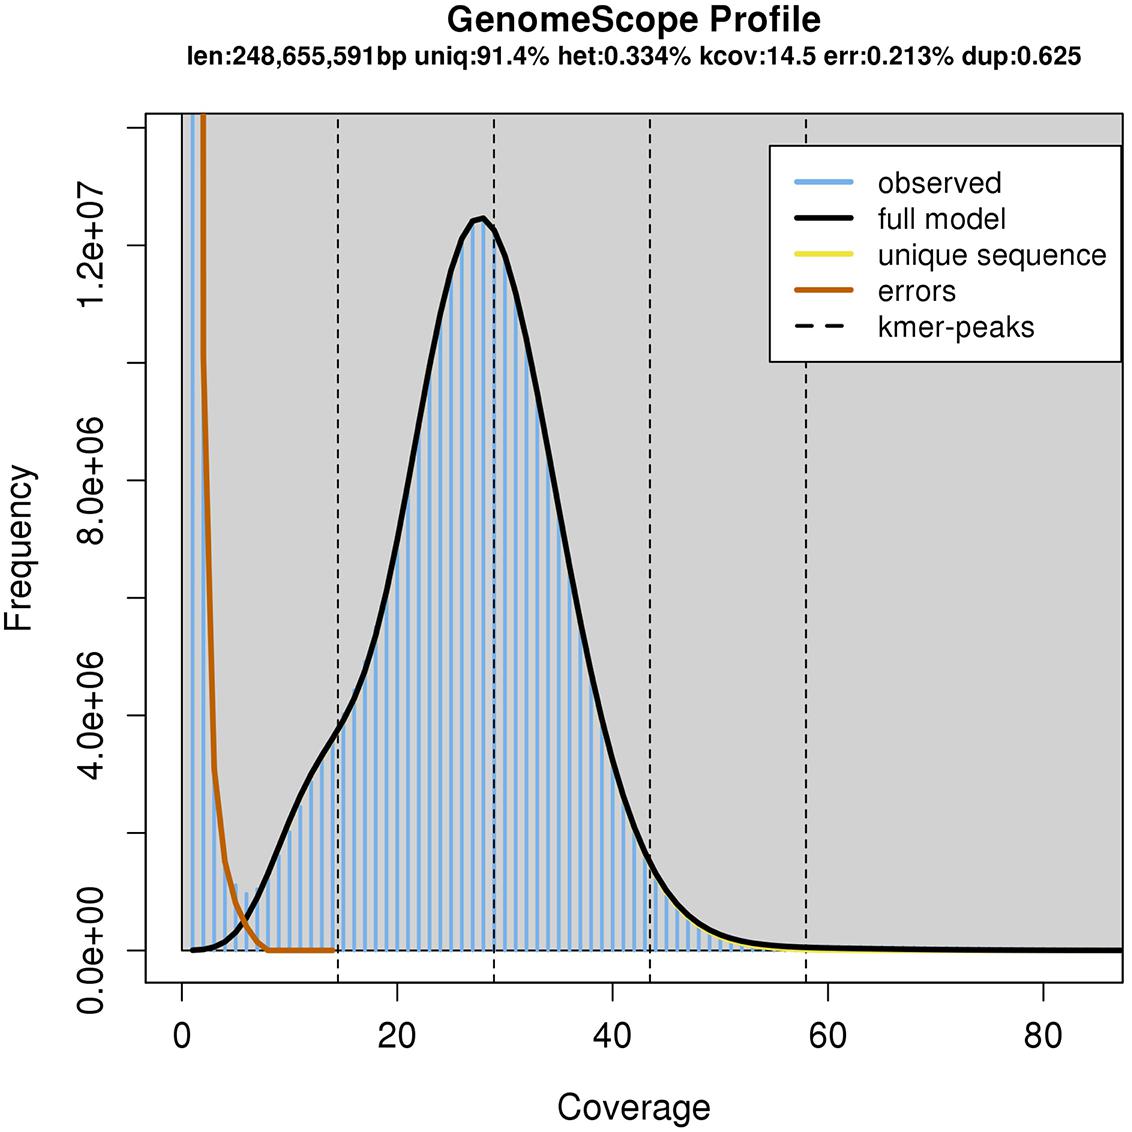
FIGURE 2. GenomeScope Analysis of the 23-mers in the Illumina sequencing data.
We further improved the PacBio assembly based on Illumina sequencing derived from the same gyne (B28). Illumina reads from the same gyne were aligned to the PacBio-based assembly using NextGenMap (NGM) (Sedlazeck et al., 2013). Coverage levels for each contig were calculated; mean coverage was bimodal. A subset of contigs with coverage above a cutoff was chosen, and B28 Illumina reads were realigned to this high coverage subset. The resulting bam files and the subset of high coverage contigs were used to improve genome calls using Pilon in its diploid genome mode (Walker et al., 2014). B28 Illumina reads were realigned to the Pilon-revised genome and Pilon was called iteratively until relatively few changes were made in the second last iteration. In the final iteration the bam file produced by NGM was realigned using the GATK realignment pipeline (Auwera et al., 2013) before running Pilon. The Pilon-revised genome from the last iteration is version 1.0 of the contig set.
Gene Prediction
Once a reference set of contigs had been prepared, our next goal was to call genes. We applied Augustus’s gene prediction algorithm (Stanke and Waack, 2003; Keller et al., 2011), using the B. terrestris training set (Sadd and Barribeau, 2015) to predict genes in B. terricola’s version 1.0 contig set. BUSCO (Simão et al., 2015) with the Arthropoda data set and with the B. terrestris training set (Sadd and Barribeau, 2015) was used to assess the completeness of contig assembly against a set of 2,675 conserved arthropod genes. Results from reciprocal Blastp best match (BBM) to B. terrestris, B. impatiens (Sadd and Barribeau, 2015), and Apis mellifera Official Gene Sets 1.0 (Weinstock et al., 2006) and 3.2 (Elsik et al., 2014) as well as additional genes found via proteomic analysis (McAfee et al., 2015) were used to provide a preliminary annotation of genes.
Variant Discovery
After determining a set of genes, the next phase in the analysis was to find variation in those genes for population genomic analyses. Nine females from Québec and 13 females from Ontario were sequenced with Illumina, for a total of 22 diploid genomes at average coverage of 20×. We used GATK version 3 (McKenna et al., 2010) to call variants. All elements of the GATK best practices pipeline (Auwera et al., 2013) not requiring pre-existing validated SNP sets were used. We used GATK Haplotype Caller followed by GenotypeGVCF to jointly call variants. Single Nucleotide Polymorphisms (SNPs) within 10 bp of indels were removed from the variant set.
Population Genomic Analyses
We used Admixture 1.3.0 (Alexander et al., 2009) with a set of variants chosen every 10,000 SNPs to avoid linkage disequilibrium. Cross-validation error Q-values from runs with from 1 to 5 populations were collated. The K-value with smallest Q is taken to be the best population number.
Given a set of variants in and near genes, we next performed population genetic analyses to determine characteristics of these variants. We analyzed variants using VCFtools (Danecek et al., 2011) to measure the individual inbreeding coefficient F, long runs of homozygosity LROH, Tajima’s D, nucleotide diversity π within each region, and the fixation index FST between Québec and Ontario bees. Synonymous and non-synonymous sites in predicted genes were called by SnpEFF (Cingolani et al., 2012).
Several population genomic methods look at regions larger than a gene to detect signs of selection, of which we used two, Identity By Descent (IBD) (Browning and Browning, 2013), and Haplotype differentiation. Chromosome regions Identical by Descent were identified after compensating for sequencing error using IBDseq (Browning and Browning, 2013). Using hapFLK 1.3 (Fariello et al., 2013) to compare haplotype differentiation with Québec and Ontario bees, we defined 702 contiguous regions with p < 0.01 at the center and for which all other SNPs in the region had p < 0.015 (hereafter called high-differentiation regions). We characterized genes in the lowest decile of D within these HapFlk regions as genes which vary between regions and which may be under directional selection (D < -1).
Strong recent selection produces linkage disequilibrium in the region under selection. We calculated linkage disequilibrium (r2) between SNPs using Plink 0.67 (Purcell et al., 2007) for non-inbred bees (N = 16) with minor allele frequency > 0.04, and corrected for sample size using Weir and Hill’s formula (Weir and Hill, 1980) and mutation rate using the method of Ohta and Kimura (1971) as modified in (Saura et al., 2015), using the value of alpha = 2 which includes mutation (Saura et al., 2015). We excluded inbred bees with F > 0.1 because inbreeding increases Linkage Disequilibrium (LD) without selection.
Effective population size Ne is an important measure in conservation genetics. Ne can be estimated in several ways (Saura et al., 2015; Waples et al., 2016). Recent Ne is best estimated using the temporal method (Saarinen et al., 2010), but our samples were collected during a single generation. Methods based on LD at various separations between SNPs give some insight into historical Ne – with closely separated SNPs providing information about the distant past – 10,000 to 1,000,000 years ago (Saura et al., 2015). We used NeEstimator v. 2.01 (Do et al., 2014) to estimate effective population size Ne in the past century. Both approaches are only accurate when LD is not relatively high, hence we excluded SNPs less than 10 bp apart. As noted in a recent study of using whole-genome SNP data for Ne estimation (Waples et al., 2016), using thousands of SNPs may not increase precision of estimates. We therefore prepared four independent, non-overlapping datasets: two SNP datasets (1st: 359 SNPs at least 10 Kbp apart, 2nd: 239 snps at least 15 Kbp apart) and two datasets with 110 and 429 widely spaced microsatellite sites. Microsats were included as there is an ongoing debate in the literature about whether SNP or microsat data is best used for estimating Ne in smaller population datasets (Morin et al., 2012), and we found NeEstimator produced finite upper CI estimates for the microsat data, but not the SNP data. NeEstimator was run with minimum Minor Allele Frequency (MAF) cutoffs of 0.05, 0.075, and 0.1. The values reported are for MAF = 0.075; the values found at MAF 0.05 and 0.10 are within the error bars for MAF 0.075. We used the LDNe method with the monogamous mating model, which is approximately correct for bumblebees (Duchateau et al., 1994). We also ran the heterozygote excess and molecular coancestry methods within NeEstimator to estimate very recent Ne. The heterozygote excess method failed to converge and is not reported here. In the absence of a direct estimate of genome-wide recombination rate for B. terricola, we used the estimate of 4.4 cM/Mb found for B. terrestris (Stolle et al., 2011).
When a group of genes under selection share similar functions, this can hint at the type of selective pressures in action. Functional analysis of gene sets under selection was performed by mapping best matches of B. terricola genes to Drosophila melanogaster genes using blastp (reciprocal blast best match method) and OrthoDB v.9 (Kriventseva et al., 2015), which were then submitted to DAVID v. 6.7 (Huang et al., 2009). Genes under potential directional selection were determined by choosing genes overlapping windows in the lowest 5% of a weighted combination of D and log10(π), as shown in Supplementary Figure S1 (red points). This selects for a large set of genes with Tajima’s D less than -2 and π less than the genome average, and a smaller set of genes with D < 0 and with π in the lowest 2% of the genome distribution. DAVID Functional Annotation Clustering was used with Biological Process, Level 5 annotations. A background list of all orthologous genes between B. terricola and D. melanogaster was used. Only clusters with an Enrichment Score greater than 2 are considered significant.
Results
Genome Size and Characteristics
The B. terricola contig set, constructed using Pacbio and Illumina sequencing, contains 238.9 million base pairs distributed over 1,448 contigs with an N50 of 341,136 bp (Table 1). The N50 contig size (341 Kb) of B. terricola’s genome is much larger than B. terrestris (76.0 Kb) and B. impatiens (57.1 Kb) recently sequenced using Roche 454 and Illumina technology (Sadd and Barribeau, 2015). Genome GC content (37.5%) is unimodal and not strongly skewed (Supplementary Figure S2), and similar to GC content of B. impatiens (37.9%) and B. terrestris (38.1%) (Sadd et al., 2015). We used an in silico algorithm Augustus (Stanke and Waack, 2003; Keller et al., 2011) to predict 15,100 putative genes in the B. terricola genome (see NCBI BioProject PRJNA399520 and linked genome files). We used local tblastn (Camacho et al., 2009) to compare the protein sequences called to the B. terrestris v1.0 genome. Median percent identity was 91.8% (1st quartile 83.0%, 3rd quartile 97.5%). We ran BUSCO (Simão et al., 2015) to determine how many of 2,675 highly conserved arthropod genomes were in our gene set; 94% of conserved genes were present, 1.5% were fragmented, and 4.3% were missing.
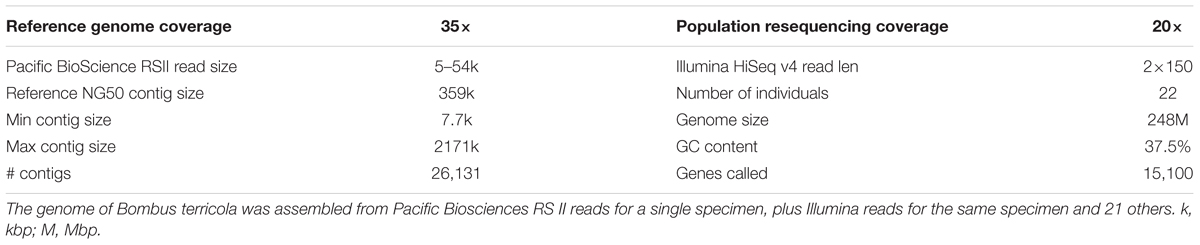
TABLE 1. Genome assembly statistics.
Population Genomics
Low Population Structure but Typical Levels of Genetic Diversity
Because our Ontario and Québec sampling sites were far apart and in largely different ecozones, we needed to determine whether they represented a single population. Bayesian analysis of population structure using Admixture (Alexander et al., 2009) revealed that B. terricola gynes from Québec and Ontario most likely belonged to the same population (K = 1) (Supplementary Figure S3). The average population differentiation as measured by Wright’s FST in 5 Kbp windows was also low at 0.008, so below we report whole-dataset statistics combining Québec and Ontario bees, unless noted otherwise. Nucleotide diversity as measured by π (Nei and Li, 1979) is 0.0024 (no minor allele frequency cutoff) to 0.0019 (using MAF = 0.09), similar to values found for π in B. impatiens (0.0024–0.0027) and B. pensylvanicus (0.0026–0.0029) (Lozier, 2014).
Several B. terricola Samples Show Signs of Inbreeding
Inbreeding is a major threat to bee populations because of the peculiarities of the Complementary Sex Determination (Csd) system (Zayed, 2004; Zayed et al., 2004; Zayed and Packer, 2005). Accordingly we calculated several statistics that measure inbreeding. The Québec population had 4/9 individuals (44%) with Wright’s inbreeding coefficient F (Wright, 1965) greater than 0.1, while the Ontario population had only 1/13 (7.7%). This difference was not significant by Fisher’s Exact test (odds ratio = 8.56, p = 0.116). Over the whole dataset, F had median 0.013, mean 0.036, 3rd quartile 0.077, and maximum 0.217.
The distribution of Long Runs of Homozygosity (LROH) is affected by inbreeding, and the inbreeding coefficient in individuals is highly correlated with their log-transformed total base pairs in LROH (Spearman’s r = 0.76, df = 20, p = 0.00005; Supplementary Figure S4). One inbred bee had two LROH segments each 1.3 Mbp in length.
The Effective Population Size for B. terricola Is Declining
To estimate ancient Ne, we used three methods based on LD between SNPs (Methods). Each estimates Ne at a different time in the past, giving the three time points shown in Figure 3. We ran each method on multiple datasets of SNPs (Methods) to provide the 2 standard error bars in the figure. The analysis shows a large decline in effective population size that likely occurred within the past 100 years, consistent with ecological evidence of decline for this species.
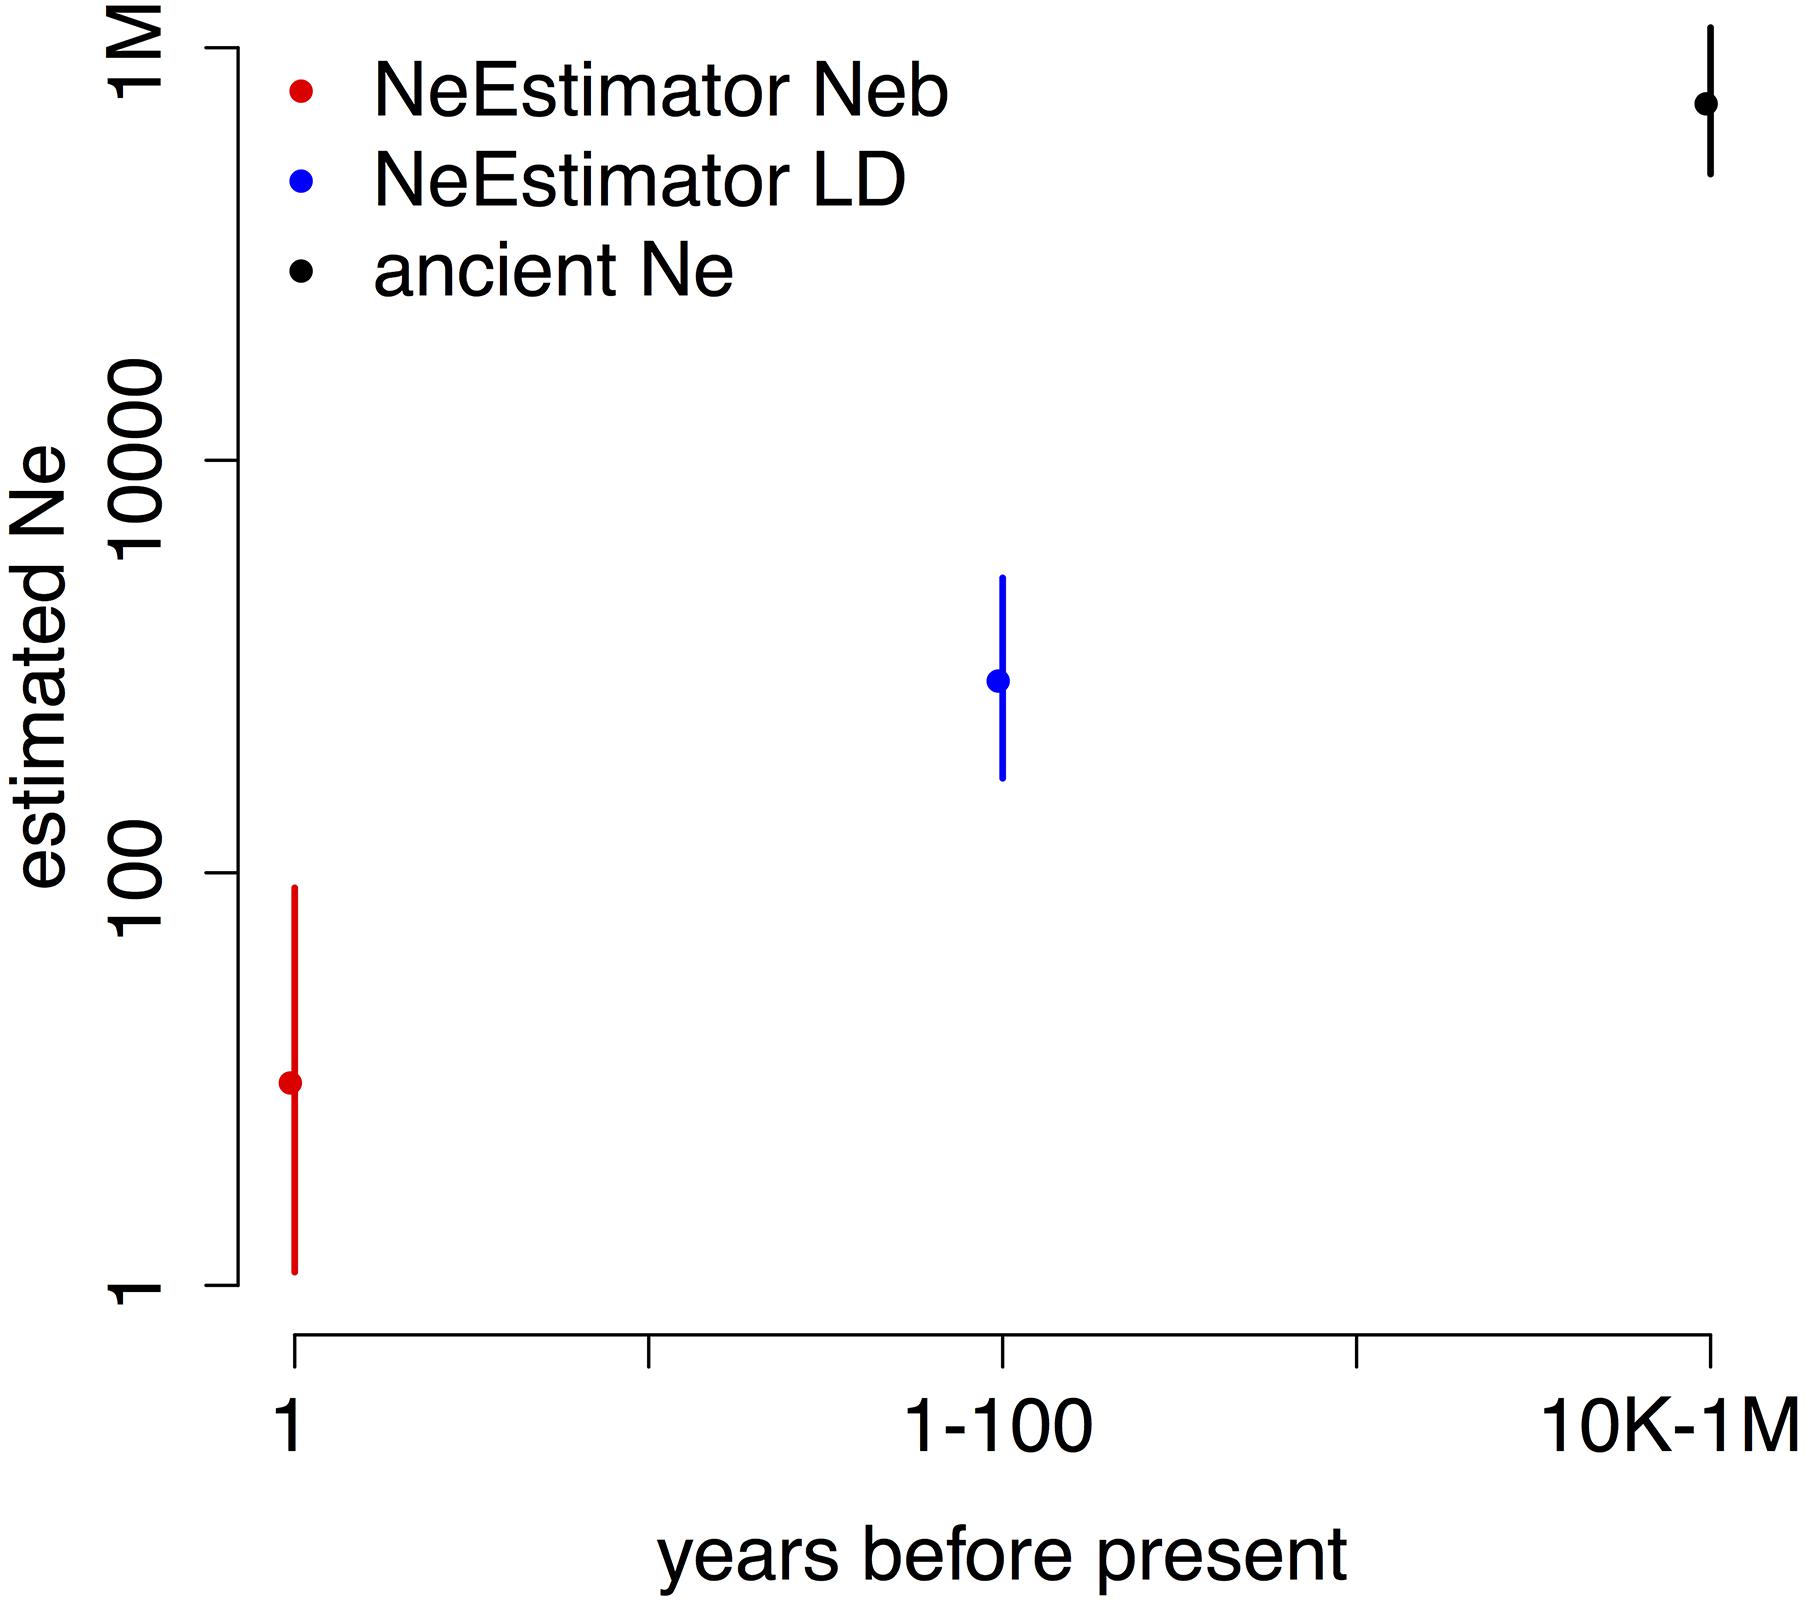
FIGURE 3. Estimated Neb (breeding Ne, red), recent Ne (blue), and ancient Ne (black) show orders of magnitude declines from ancient to recent to previous generation timescales. Note the logarithmic scale on both axes. Shown are means ± 2 SD; the error bars for ancient Ne lie within the point.
Loci With Signs of Selection Highlight Possible Adaptive Responses to Stressors
Stressors underlying B. terricola’s decline may have led to recent adaptive changes that can be revealed through population genomic analysis. We quantified four population genetic statistics: genetic diversity π, Tajima’s D, linkage disequilibrium (LD), and regions of Identity By Descent (IBD). Positive selection is expected to reduce π and D while increasing LD and IBD around selected loci. We first report the whole-genome functional classification of genes with low π and D, then provide additional evidence of positive selection on a targeted immune gene set using LD and IBD data.
Genes in the lowest portion 5% of the joint distribution of D and π (Methods) had 10 significantly enriched Functional Biological Process categories (Supplementary Table S2). Among these, cluster 2 contains GO term “MAPK cascade,” cluster 4 has “cellular macromolecule catabolic process,” and cluster 7 includes “regulation of innate immune response.” The latter cluster was intriguing given that pathogen spillover is one hypothesized cause of B. terricola’s decline (Colla et al., 2006; Otterstatter and Thomson, 2008; Sachman-Ruiz et al., 2015). Standing variation in genes giving resistance to pathogens may be quickly selected under such conditions (Przeworski et al., 2005; Reid et al., 2016). We thus restricted our search to a candidate gene set – those involved in immunity in honey bees (Ryabov et al., 2014), supplemented by homologs from D. melanogaster genes annotated as associated with Gene Ontology Biological Process term “Immune System Process,” GO: 0002376 (Supplementary Table S3).
Innate immune genes with two or more population genetic statistics consistent with directional selection are listed in Table 2. We found one region of shared IBD, high LD and low Tajima’s D and π contains the genes hopscotch and Dicer-1 (Figure 4). This region contains above average LD, low π and Tajima’s D. The distribution of lengths of IBD regions is shown in Supplementary Figure S5.
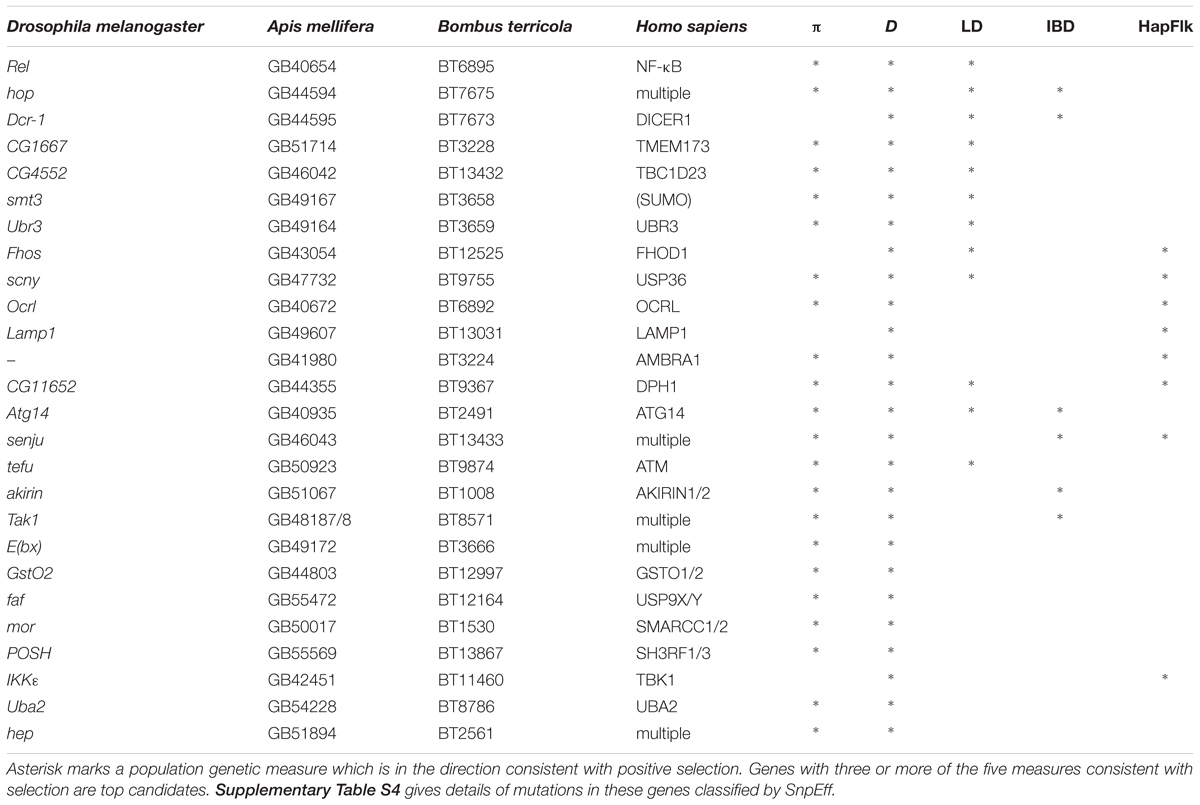
TABLE 2. Immune-related genes with signs of selection.
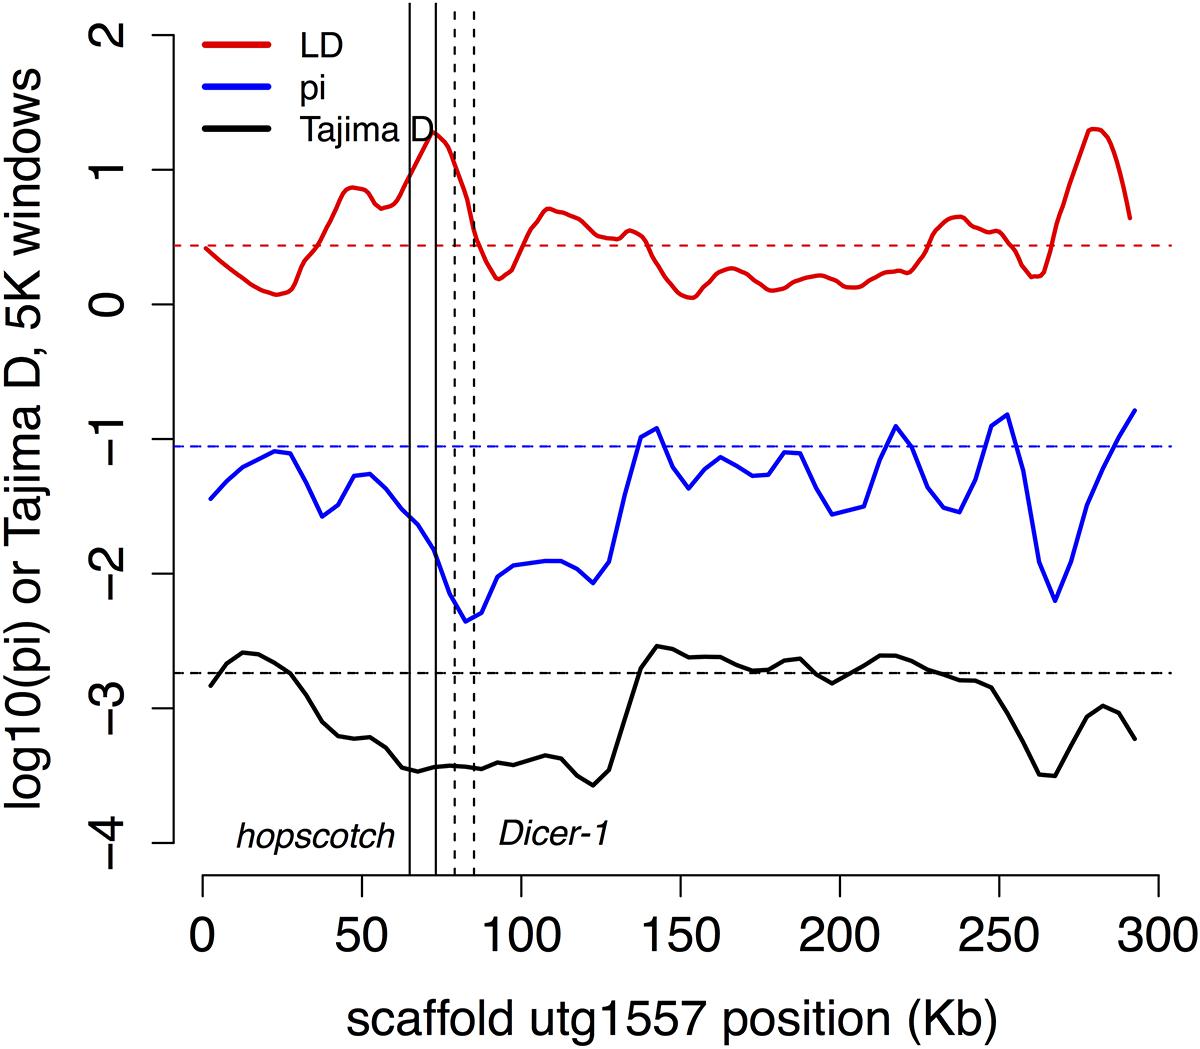
FIGURE 4. Possible selection on two immune genes. The region of high LD and low π and Tajima’s D contains the two immune genes Dicer-1 (solid lines) and hopscotch/JAK (dashed lines), which are also found in shared regions of IBD. In this and subsequent figures we plot Tajima’s D in 5 Kb windows (black), –log10(π) in 5 Kb windows (blue), and a 2 Kb window estimate of LD (red; as expected r2 at 20 bp; see Methods), with dashed horizontal lines in each color marking the local genome average for the measure.
We found a partial sweep (region of low genetic diversity π, low Tajima’s D, and high linkage disequilibrium) in the vicinity of two genes involved in post-translational modification, an important regulator of insect immune systems, that are adjacent to each other on scaffold 464 (Figure 5) for genes BT3658 (Amel GB49167, Dmel smt3, a.k.a. SUMO) and gene BT3659 (GB49164, Dmel Ubr3, e3 ubiquitin-protein ligase UBR3-like).
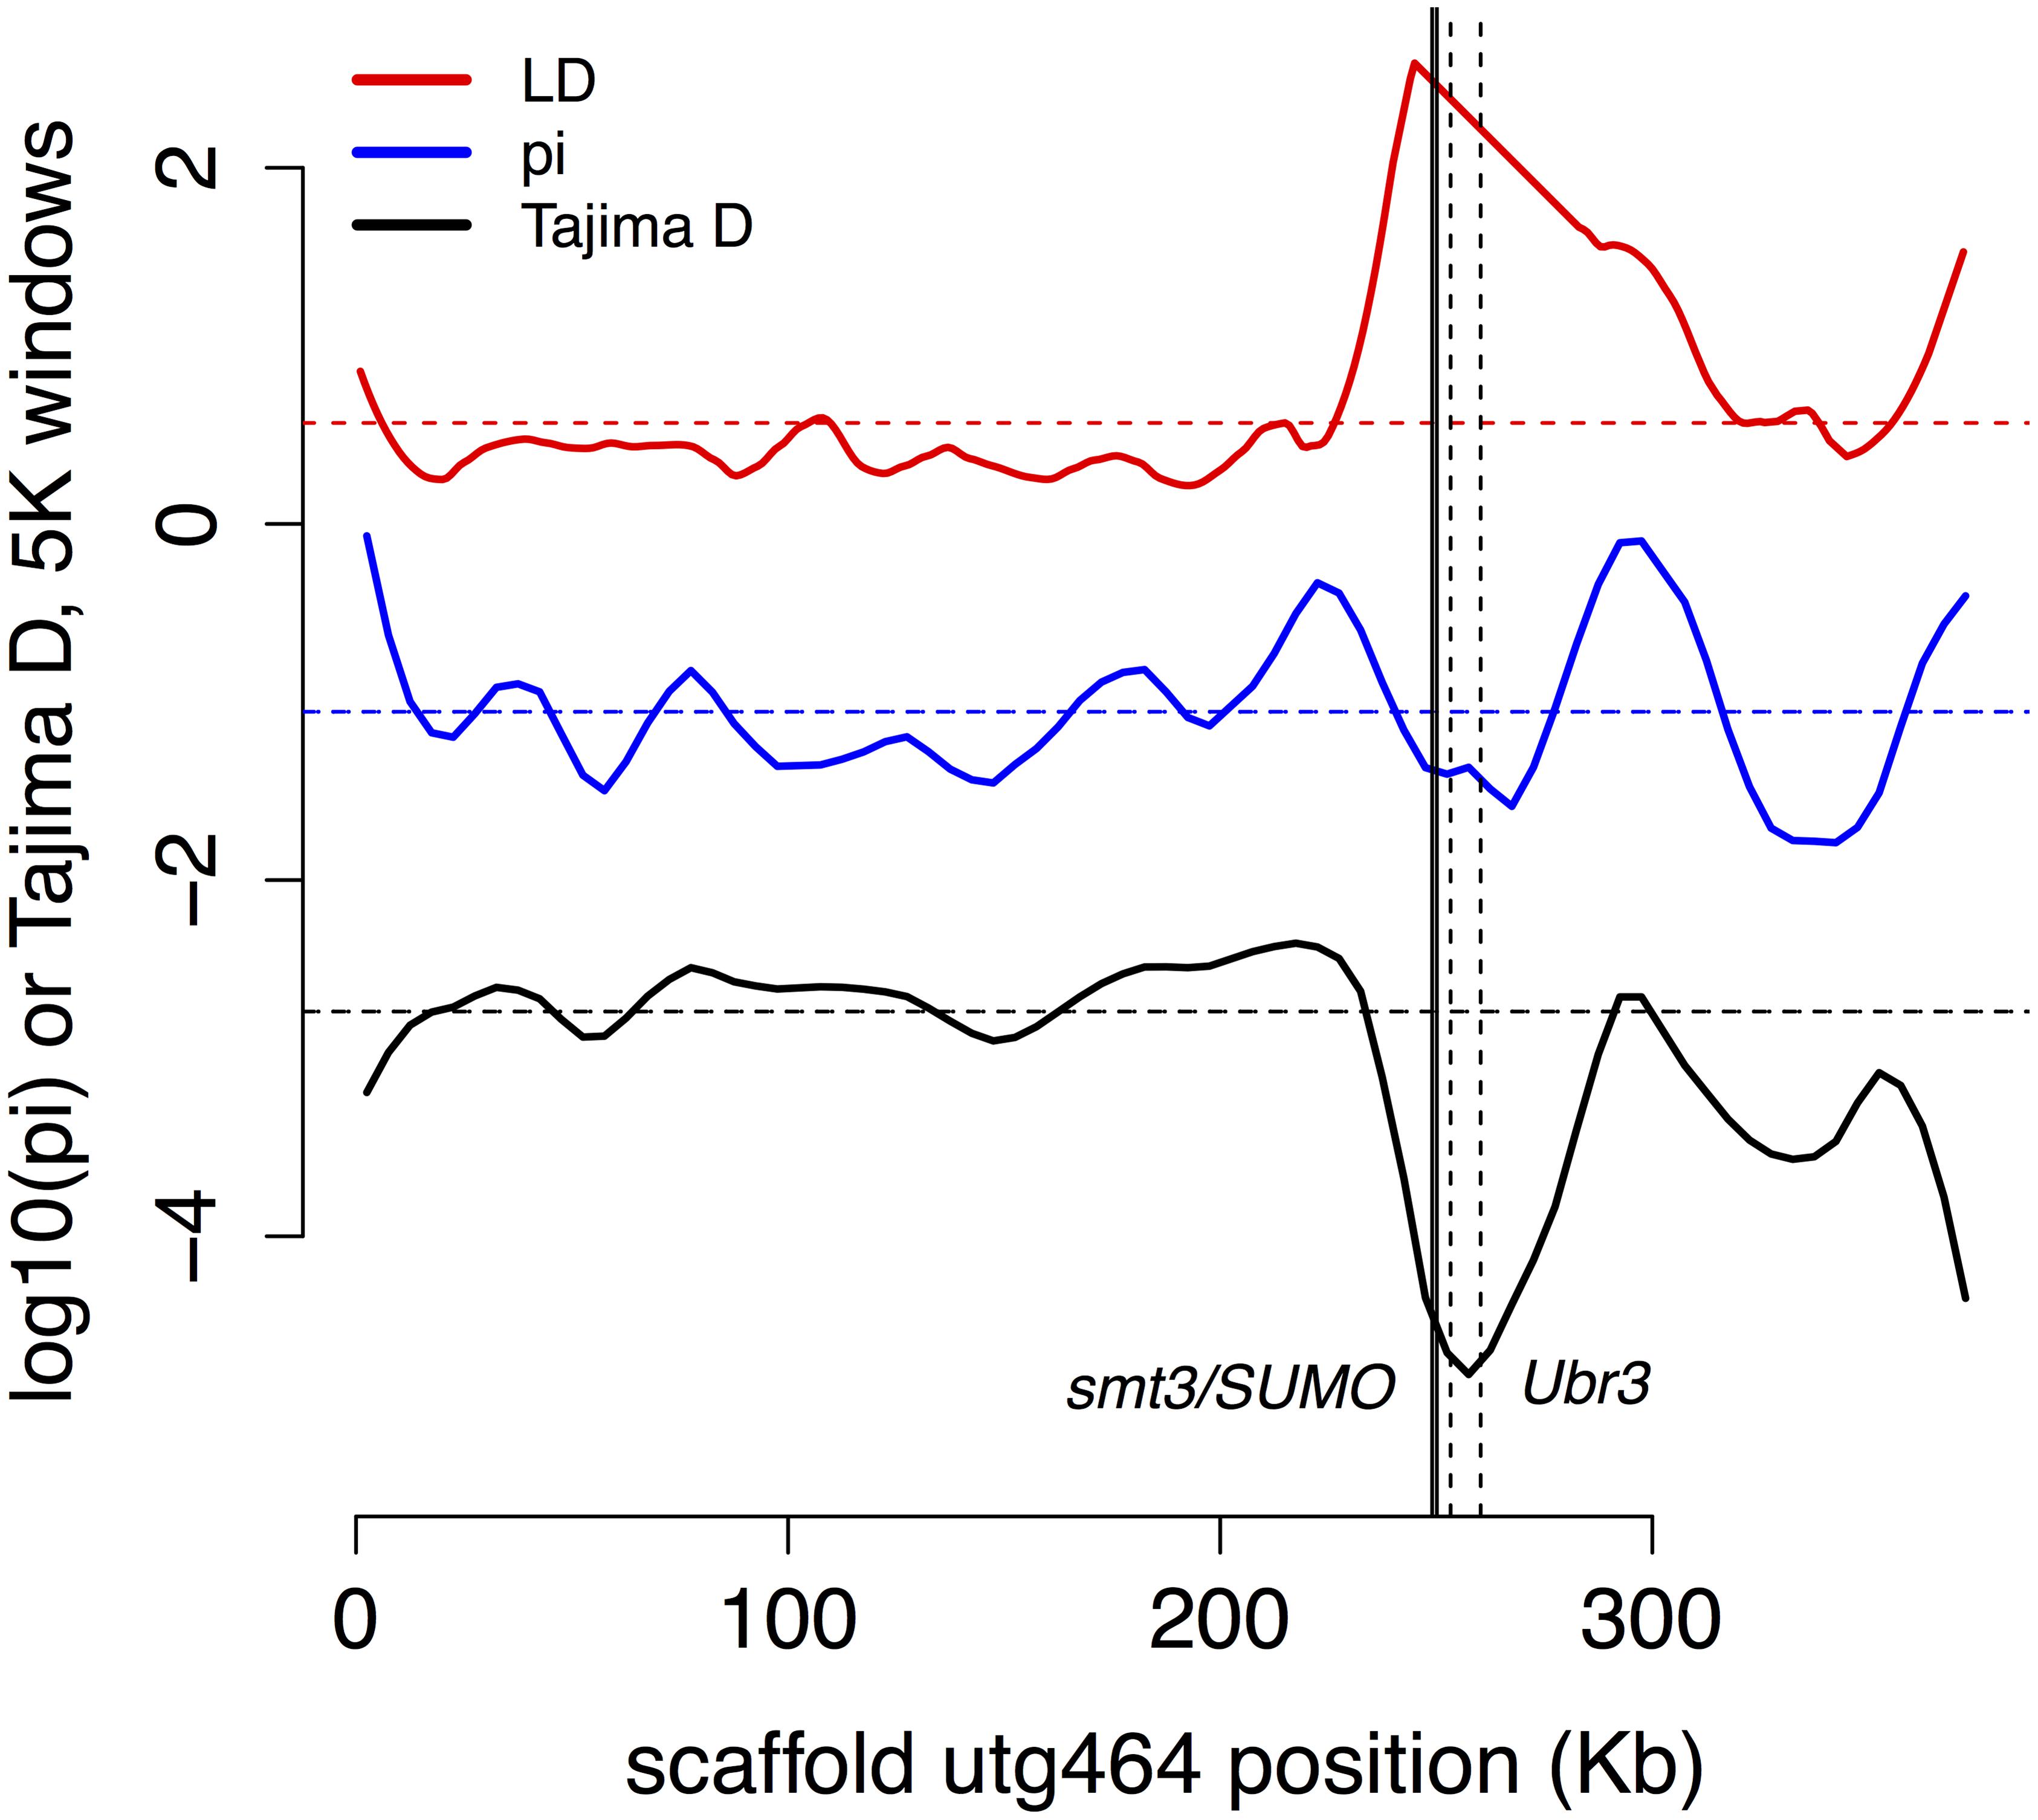
FIGURE 5. Partial sweep. Two genes (smt3/SUMO, solid lines, and Ubr3, dashed lines) involved in post-translational modification of immune genes show signs of recent selection.
Several core immune genes have the high LD and low π and Tajima’s D consistent with recent positive selection. Below, we plot these measures (Figure 6): for (a) Relish/NF-κB, (b) STING/TMEM173, and (c) TBC1D23.
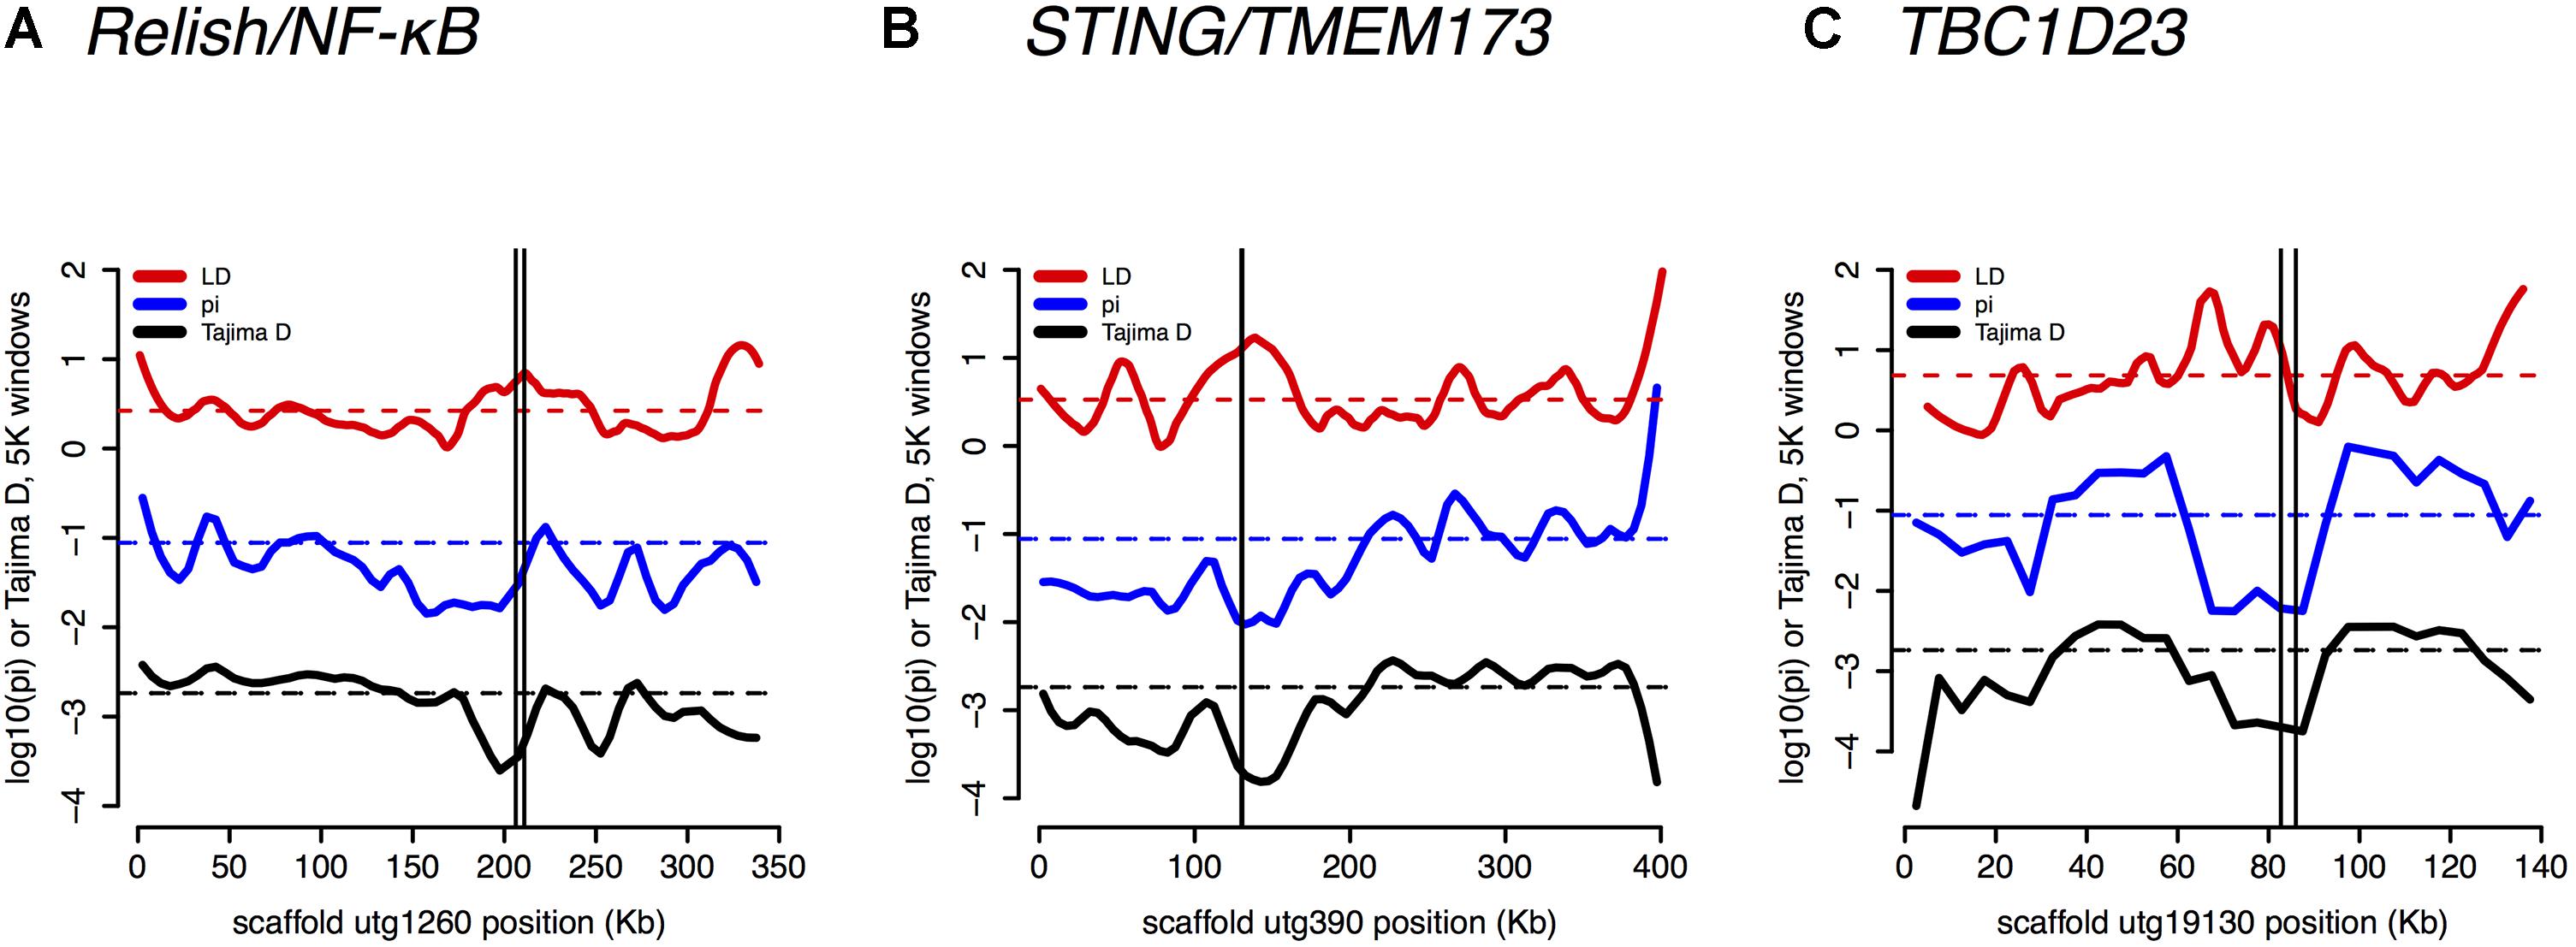
FIGURE 6. Linkage Disequilibrium (LD), π, and Tajima’s D are plotted for (A) Relish/NF-κB – a core immune signal transducer; (B) STING/TMEM173 – a transducer of viral RNA signal; and for (C) TBC1D23 – a negative regulator of Toll signaling.
Population Genomic Analysis of Local Adaptation
Some stressors, such as climate change, exposure to agrochemicals, and proximity to vegetable greenhouses that use commercial bumblebees for pollination, have a spatial component and are not expected to influence B. terricola across all of its native range. Climate change, for example, has different effects on bumblebee populations at the southern and northern ends of their ranges (Kerr et al., 2015), and our Québec sites are farther from greenhouses than Ontario sites. We thus queried our population genomic dataset to find genomic regions with signs of local adaptation – evidenced by extreme levels of haplotype differentiation (Albrechtsen et al., 2010) between Ontario and Québec. Using hapFLK 1.3 (Fariello et al., 2013) we defined 702 contiguous regions with p < 0.01 at the center and for which all other SNPs in the region had p < 0.015 (hereafter called high-differentiation regions). These high-differentiation regions covered 0.64% of the B. terricola genome. The median length of a region was 1098 bp (interquartile range 341-2379). Maximum Fst within these high-differentiation regions was in the upper 97.7% of the distribution of Fst, and mean Fst over the regions was in the upper 96.2% of the distribution of Fst. 259 genes (1.7% of all genes) overlapped these regions. Functional annotation of these genes produced 9 enrichment clusters with developmental, cell signaling, or neural functions. However, of the 24 immune genes in Table 2 with at least two other signs of selection, 6 (25%) overlapped with HapFlk high differentiation regions. This odds ratio (25%/1.7%) is highly significant (χ2 = 75.5, df = 1, p = 3.7 × 10⁻¹⁸). Thus, immune genes with other signs of selection are significantly more likely than other genes to overlap regions of high differentiation between Ontario and Québec.
Discussion
Bombus terricola was once common over much of Canada and the United States, but has been greatly reduced or extirpated throughout much of its historical range (Hatfield et al., 2015). We have assembled the draft B. terricola contig set and sequenced 22 bees from Ontario and Québec, Canada in an effort to develop resources and knowledge to help in the conservation management of this and other important pollinators.
The use of long-read sequencing technology allowed us to assemble a draft contig set for B. terricola, derived from a single gyne from Ontario. The genome size of B. terricola is similar to two other sequenced bumble bees (Sadd and Barribeau, 2015), but the PacBio assembly for the B. terricola genome is much improved over the older approaches [N50 contig size 341 Kb compared to B. terrestris (76.0 Kb) and B. impatiens (57.1 Kb)] (Sadd and Barribeau, 2015). We used in silico approaches to predict and annotate 15,100 genes in B. terricola, which is similar to the number of genes predicted in honey bees [N = 15,314 (Elsik et al., 2014)], and other bumblebees [11,669 (Sadd and Barribeau, 2015)]. B. terricola’s gene set included 94% of a set of highly conserved arthropod genes. While the quality of gene predictions for the B. terricola genome will surely benefit from RNA sequencing work under way, the current gene and contig set immediately enables researchers to carry out gene-centric evolutionary and conservation research.
In addition to generating genomic resources for B. terricola, we carried out a population genomic analysis to estimate classical conservation parameters (e.g., effective population size, prevalence of inbreeding and genetic differentiation) (Zayed, 2009). We found that, in the sampled areas, B. terricola is showing signs of inbreeding. This is of concern because complementary sex determination increases extinction risk of bees due to the diploid male vortex (Zayed and Packer, 2005). Increased probabilities of identity by descent within a population increase frequencies of diploid male production over those expected from random mating (Packer and Owen, 2001) because of the increased chances of a mating pair sharing a sex-determining allele in common. Inbred bee populations produce higher numbers of infertile diploid males instead of workers and gynes (Duchateau et al., 1994). At the mean F-value we measured, results from Packer and Owen (2001) suggest that up to 15% of gynes may be mating with males with a matching sex determination allele, resulting in a 50% loss of workers and probable failure or major size reduction of the resulting colonies (Duchateau et al., 1994; Darvill et al., 2006). At the highest values of F observed, up to 40% of gynes are mating with a male sharing a sex allele in common. Based on our analysis, we expect high levels of diploid male production in B. terricola populations – a prediction that can be validated by genotyping males collected during the early stages of the colony cycles – a time where only workers are typically produced.
Effective population size, Ne, is an important parameter in conservation genetics, and conservation efforts strive to increase Ne. Using LD at closely spaced variants, we were able to estimate the ancestral long-term harmonic mean Ne (Figure 3) in the period before the Holocene warming to be in the range of 400,000–600,000. Several methods which estimate recent Ne from recent times gave results orders of magnitude below pre-Holocene levels: around Ne = 950 for the LDNe method (last 100 generations) and Neb = 10.2 for the molecular coancestry method (last generation) (Do et al., 2014). These dramatically smaller estimates suggest a recent major reduction in effective population size in B. terricola.
This potential recent drop in Ne must be considered in conjunction with other Quaternary-Holocene changes to explain the distribution of other population genetic statistics. For example, Tajima’s D normally shows a positive bias after a major population bottleneck (Tajima, 1989), but we observe mean D = -1.06. However, the current distribution of B. terricola is restricted to northern parts of the continent, suggesting that a bottleneck during the glaciations may have been followed by a rapid expansion during the post-glacial period. This would have produced a bias to negative values of D (Tajima, 1989; Wall and Przeworski, 2000). D changes on the timescale of 3Ne generations in haplo-diploid bees (Tajima, 1989; Wall and Przeworski, 2000) so our results may be due to a composite of post-glacial expansion and recent decline.
We used population genomic analysis to provide clues and insights into the environmental stressors that caused B. terricola’s decline. We hypothesized that environmental stressors leading to B. terricola’s decline may have imposed a selective pressure that, in turn, led to adaptive evolution at specific loci that ameliorated the negative effects of such stressors. As such, knowledge of the loci with signs of positive selection may hint at the causes of B. terricola’s decline. We note, however, that environmental stressors may not always lead to a quantifiable adaptive change in a genome; for example, there may have been no heritable differences in susceptibility to a stressor to fuel adaptive change within a population. Nevertheless, we think the approach is still valuable in highlighting genomic regions of adaptive significance to help generate and/or corroborate hypotheses for decline.
Ecological studies have highlighted stressors including habitat loss, climate change, pesticides, and pathogen spillover (Grixti et al., 2009; Szabo et al., 2012; Kerr et al., 2015) as likely causes for B. terricola’s decline. Gene ontology analysis highlighted innate immunity as an important biological process that is enriched among genes with recent signs of positive selection in B. terricola. These genes included regulators of immune signaling Relish/NF-κB, hopscotch/JAK, TBC1D23, smt3/SUMO, and Ubr3, anti-viral defense genes Dicer-1 and STING/TMEM173. Several genes found in regions of high differentiation between Québec and Ontario bees which also have low Tajima’s D have been associated with defense responses in fruit flies. It is possible that some pathogens differ between the two regions, as our Québec sampling sites are distant from greenhouse sites where introduced European pathogens were accidentally released.
We suggest that these signatures of selection may indicate that pathogen spillover is playing a role in B. terricola range reduction. We note, however, that positive selection on innate immune genes may not be unique to B. terricola. A recent study of several bee species found evidence of positive selection on two of the above mentioned genes: hopscotch/JAK, and Relish/NF-κB (Barribeau et al., 2015). Thus, some of our putative targets of recent selection may have also been under selection before the range decline.
Conclusion
We show that assembly of a draft contig set and gene set combined with population genomics permits conclusions about a species at risk, at modest cost. Our results suggest that B. terricola populations in eastern Canada are experiencing inbreeding and declines in effective population size which may lead to colony losses via diploid male production. Signs of recent positive selection on a number of core and auxiliary immune genes suggest these bees may be experiencing novel pathogen pressures. Future areas of study of importance to conservation include completing a recombination map and chromosome assemblies to facilitate estimation of Ne, direct sampling of pathogens in wild-caught bees, and population genetic sampling in northern areas more remote from greenhouse tomato and pepper operations. Moreover, transcriptomic studies of key tissues responsible for innate immune and detoxification across stable and declining B. terricola populations will be very helpful in ascertaining the stressors underlying declines of this species.
Ethics Statement
Our study conforms to York University and Canadian guidelines on research involving lower animals.
Data Accessibility
DNA data: NCBI Bioproject ID PRJNA399520 and linked genome, SRA entries.
Author Contributions
VMP and YG collected samples. AD extracted DNA and performed initial diversity analyses with BAH. JG and MS assembled scaffolds from PacBio data. TT aligned Illumina samples and called SNPs. HP and NT assembled reference immune and detoxification gene sets and calculated population statistics on these genes. CK refined contigs, called gene sets, calculated genomic statistics, analyzed the data, and wrote the paper. VMP designed and supervised sampling plans with guidance by SC. AZ designed and supervised genomics work. SC, CK, and AZ edited the paper.
Funding
We thank Wildlife Preservation Canada (with funding from Schad Foundation, W. Garfield Weston Foundation, and Rogers Foundation) and NSERC for funding. MS and JG were supported, in part, by the National Science Foundation (DBI-1350041). We thank Joel Shore for his help with pulse-field gel electrophoresis.
Conflict of Interest Statement
The authors declare that the research was conducted in the absence of any commercial or financial relationships that could be construed as a potential conflict of interest.
Supplementary Material
The Supplementary Material for this article can be found online at: https://www.frontiersin.org/articles/10.3389/fgene.2018.00316/full#supplementary-material
References
Albrechtsen, A., Moltke, I., and Nielsen, R. (2010). Natural selection and the distribution of identity-by-descent in the human genome. Genetics 186, 295–308. doi: 10.1534/genetics.110.113977
Alexander, D. H., Novembre, J., and Lange, K. (2009). Fast model-based estimation of ancestry in unrelated individuals. Genome Res. 19, 1655–1664. doi: 10.1101/gr.094052.109
Auwera, G. A., Carneiro, M. O., Hartl, C., Poplin, R., del Angel, G., Levy-Moonshine, A., et al. (2013). From FastQ data to high-confidence variant calls: the genome analysis toolkit best practices pipeline. Curr. Protoc. Bioinformatics 43, 11.10.1–11.10.33.
Barribeau, S., Sadd, B., du Plessis, L., Brown, M., Buechel, S., Cappelle, K., et al. (2015). A depauperate immune repertoire precedes evolution of sociality in bees. Genome Biol. 16:83. doi: 10.1186/s13059-015-0628-y
Berenbaum, M. R., Bernhardt, P., Buchmann, S., Calderone, N., Goldstein, P., Inouye, D. W., et al. (2007). Status of Pollinators in North America. Washington, DC: National Academies Press.
Browning, B. L., and Browning, S. R. (2013). Detecting identity by descent and estimating genotype error rates in sequence data. Am. J. Hum. Genet. 93, 840–851. doi: 10.1016/j.ajhg.2013.09.014
Camacho, C., Coulouris, G., Avagyan, V., Ma, N., Papadopoulos, J., Bealer, K., et al. (2009). BLAST+: architecture and applications. BMC Bioinformatics 10:421. doi: 10.1186/1471-2105-10-421
Cameron, S. A., Lozier, J. D., Strange, J. P., Koch, J. B., Cordes, N., Solter, L. F., et al. (2011). Patterns of widespread decline in North American bumble bees. Proc. Natl. Acad. Sci. U.S.A. 108, 662–667. doi: 10.1073/pnas.1014743108
Chin, C.-S., Peluso, P., Sedlazeck, F. J., Nattestad, M., Concepcion, G. T., Clum, A., et al. (2016). Phased diploid genome assembly with single-molecule real-time sequencing. Nat. Methods 13, 1050–1054. doi: 10.1038/nmeth.4035
Cingolani, P., Platts, A., Wang, L. L., Coon, M., Nguyen, T., Wang, L., et al. (2012). A program for annotating and predicting the effects of single nucleotide polymorphisms, SnpEff: SNPs in the genome of Drosophila melanogaster strain w1118; iso-2; iso-3. Fly 6, 80–92. doi: 10.4161/fly.19695
Colla, S. R. (2016). Status, threats and conservation recommendations for wild bumble bees (Bombus spp.) in Ontario, Canada: a review for policymakers and practitioners. Nat. Areas J. 36, 412–426. doi: 10.3375/043.036.0408
Colla, S. R., Gadallah, F., Richardson, L., Wagner, D., and Gall, L. (2012). Assessing declines of North American bumble bees (Bombus spp.) using museum specimens. Biodivers. Conserv. 21, 3585–3595. doi: 10.1007/s10531-012-0383-2
Colla, S. R., Otterstatter, M. C., Gegear, R. J., and Thomson, J. D. (2006). Plight of the bumble bee: Pathogen spillover from commercial to wild populations. Biol. Conserv. 129, 461–467. doi: 10.1016/j.biocon.2005.11.013
Colla, S. R., and Packer, L. (2008). Evidence for decline in eastern North American bumblebees (Hymenoptera: Apidae), with special focus on Bombus affinis Cresson. Biodivers. Conserv. 17:1379. doi: 10.1007/s10531-008-9340-5
Danecek, P., Auton, A., Abecasis, G., Albers, C. A., Banks, E., DePristo, M. A., et al. (2011). The variant call format and VCFtools. Bioinformatics 27, 2156–2158. doi: 10.1093/bioinformatics/btr330
Darvill, B., Ellis, J. S., Lye, G. C., and Goulson, D. (2006). Population structure and inbreeding in a rare and declining bumblebee, Bombus muscorum (Hymenoptera: Apidae). Mol. Ecol. 15, 601–611. doi: 10.1111/j.1365-294X.2006.02797.x
Dinerstein, E., Olson, D., Joshi, A., Vynne, C., Burgess, N. D., Wikramanayake, E., et al. (2017). An ecoregion-based approach to protecting half the terrestrial realm. BioScience 67, 534–545. doi: 10.1093/biosci/bix014
Do, C., Waples, R. S., Peel, D., Macbeth, G., Tillett, B. J., and Ovenden, J. R. (2014). NeEstimator v2: re-implementation of software for the estimation of contemporary effective population size (Ne) from genetic data. Mol. Ecol. Resour. 14, 209–214. doi: 10.1111/1755-0998.12157
Dogterom, M., Matteoni, J., and Plowright, R. (1998). Pollination of greenhouse tomatoes by the North American Bombus vosnesenskii (Hymenoptera: Apidae). J. Econ. Entomol. 91, 71–75. doi: 10.1093/jee/91.1.71
Duchateau, M., Hoshiba, H., and Velthuis, H. (1994). Diploid males in the bumble bee Bombus terrestris. Entomol. Exp. Appl. 71, 263–269. doi: 10.1111/j.1570-7458.1994.tb01793.x
Elsik, C. G., Worley, K. C., Bennett, A. K., Beye, M., Camara, F., Childers, C. P., et al. (2014). Finding the missing honey bee genes: lessons learned from a genome upgrade. BMC Genomics 15:86. doi: 10.1186/1471-2164-15-86
Fariello, M. I., Boitard, S., Naya, H., SanCristobal, M., and Servin, B. (2013). Detecting signatures of selection through haplotype differentiation among hierarchically structured populations. Genetics 193, 929–941. doi: 10.1534/genetics.112.147231
Graystock, P., Blane, E. J., McFrederick, Q. S., Goulson, D., and Hughes, W. O. (2016). Do managed bees drive parasite spread and emergence in wild bees? Int. J. Parasitol. 5, 64–75. doi: 10.1016/j.ijppaw.2015.10.001
Grixti, J. C., Wong, L. T., Cameron, S. A., and Favret, C. (2009). Decline of bumble bees (Bombus) in the North American Midwest. Biol. Conserv. 142, 75–84. doi: 10.1016/j.biocon.2008.09.027
Hatfield, R., Jepsen, S., Thorp, R., Richardson, L., and Colla, S. R. (2015). “Bombus terricola. The IUCN Red List of Threatened Species 2015”. Available at: http://dx.doi.org/10.2305/IUCN.UK.2015-2.RLTS.T44937505A46440206.en
Huang, D. W., Sherman, B. T., and Lempicki, R. A. (2009). Systematic and integrative analysis of large gene lists using DAVID bioinformatics resources. Nat. Protoc. 4, 44–57. doi: 10.1038/nprot.2008.211
Kearns, C. A., Inouye, D. W., and Waser, N. M. (1998). Endangered mutualisms: the conservation of plant-pollinator interactions. Annu. Rev. Ecol. Syst. 29, 83–112. doi: 10.1146/annurev.ecolsys.29.1.83
Keller, O., Kollmar, M., Stanke, M., and Waack, S. (2011). A novel hybrid gene prediction method employing protein multiple sequence alignments. Bioinformatics 27, 757–763. doi: 10.1093/bioinformatics/btr010
Kerr, J. T., Pindar, A., Galpern, P., Packer, L., Potts, S. G., Roberts, S. M., et al. (2015). Climate change impacts on bumblebees converge across continents. Science 349, 177–180. doi: 10.1126/science.aaa7031
Klein, A.-M., Vaissiere, B. E., Cane, J. H., Steffan-Dewenter, I., Cunningham, S. A., Kremen, C., et al. (2007). Importance of pollinators in changing landscapes for world crops. Proc. R. Soc. Lond. B Biol. Sci. 274, 303–313. doi: 10.1098/rspb.2006.3721
Koren, S., Harhay, G. P., Smith, T. P., Bono, J. L., Harhay, D. M., Mcvey, S. D., et al. (2013). Reducing assembly complexity of microbial genomes with single-molecule sequencing. Genome Biol. 14:R101. doi: 10.1186/gb-2013-14-9-r101
Kriventseva, E. V., Tegenfeldt, F., Petty, T. J., Waterhouse, R. M., Pozdnyakov, I. A., Ioannidis, P., et al. (2015). OrthoDB v8 : update of the hierarchical catalog of orthologs and the underlying free software. Nucleic Acids Res. 43, D250–D256. doi: 10.1093/nar/gku1220
Lozier, J. D. (2014). Revisiting comparisons of genetic diversity in stable and declining species: assessing genome-wide polymorphism in North American bumble bees using RAD sequencing. Mol. Ecol. 23, 788–801. doi: 10.1111/mec.12636
Lozier, J. D., and Zayed, A. (2016). Bee conservation in the age of genomics. Conserv. Genet. 18, 713–729. doi: 10.1007/s10592-016-0893-7
McAfee, A., Harpur, B. A., Michaud, S., Beavis, R. C., Kent, C., Zayed, A., et al. (2015). Towards an upgraded honey bee (Apis mellifera L.) genome annotation using proteogenomics. J. Proteome Res. 15, 411–421. doi: 10.1021/acs.jproteome.5b00589
McKenna, A., Hanna, M., Banks, E., Sivachenko, A., Cibulskis, K., Kernytsky, A., et al. (2010). The Genome analysis toolkit: a MapReduce framework for analyzing next-generation DNA sequencing data. Genome Res. 20, 1297–1303. doi: 10.1101/gr.107524.110
Morin, P. A., Archer, F. I., Pease, V. L., Hancock-Hanser, B. L., Robertson, K. M., Huebinger, R. M., et al. (2012). An empirical comparison of SNPs and microsatellites for population structure, assignment, and demographic analyses of bowhead whale populations. Endangered Species Res. 19, 1–27. doi: 10.3354/esr00459
Myers, E. W. (2005). The fragment assembly string graph. Bioinformatics 21(Suppl. 2), ii79–ii85. doi: 10.1093/bioinformatics/bti1114
Myers, G. (2014). “Efficient local alignment discovery amongst noisy long reads,” in International Workshop on Algorithms in Bioinformatics, eds D. Brown, and B. Morgenstern(Berlin: Springer), 52–67. doi: 10.1007/978-3-662-44753-6_5
Nei, M., and Li, W. H. (1979). Mathematical model for studying genetic variation in terms of restriction endonucleases. Proc. Natl. Acad. Sci. U.S.A. 76, 5269–5273. doi: 10.1073/pnas.76.10.5269
Ohta, T., and Kimura, M. (1971). Linkage disequilibrium between two segregating nucleotide sites under the steady flux of mutations in a finite population. Genetics 68, 571–580.
Ollerton, J., Winfree, R., and Tarrant, S. (2011). How many flowering plants are pollinated by animals? Oikos 120, 321–326. doi: 10.1111/j.1600-0706.2010.18644.x
Otterstatter, M. C., and Thomson, J. D. (2008). Does pathogen spillover from commercially reared bumble bees threaten wild pollinators? PLoS One 3:e2771. doi: 10.1371/journal.pone.0002771
Owen, R. E., Rodd, F., and Plowright, R. (1980). Sex ratios in bumble bee colonies: complications due to orphaning? Behav. Ecol. Sociobiol. 7, 287–291. doi: 10.1007/BF00300669
Packer, L., and Owen, R. (2001). Population genetic aspects of pollinator decline. Conserv. Ecol. 5:4. doi: 10.5751/ES-00267-050104
Plowright, R., and Jay, S. (1968). Caste differentiation in bumblebees (Bombus Latr.: Hym.) I.—The determination of female size. Insect. Soc. 15, 171–192. doi: 10.1007/BF02223465
Plowright, R., and Laverty, T. (1987). Bumblebees and crop pollination in Ontario. Proc. Entomol. Soc. Ontario 118, 155–160.
Plowright, R. C. (1966). Domestication and Caste Differentiation in Bumblebees. Ph.D. thesis, University of Manitoba, Winnipeg.
Przeworski, M., Coop, G., Wall, J. D., and Nachman, M. (2005). The signature of positive selection on standing genetic variation. Evolution 59, 2312–2323. doi: 10.1554/05-273.1
Purcell, S., Neale, B., Todd-Brown, K., Thomas, L., Ferreira, M. A., Bender, D., et al. (2007). PLINK: a tool set for whole-genome association and population-based linkage analyses. Am. J. Hum. Genet. 81, 559–575. doi: 10.1086/519795
Reid, N. M., Proestou, D. A., Clark, B. W., Warren, W. C., Colbourne, J. K., Shaw, J. R., et al. (2016). The genomic landscape of rapid repeated evolutionary adaptation to toxic pollution in wild fish. Science 354, 1305–1308. doi: 10.1126/science.aah4993
Rhoads, A., and Au, K. F. (2015). PacBio sequencing and its applications. Genomics Proteomics Bioinformatics 13, 278–289. doi: 10.1016/j.gpb.2015.08.002
Ryabov, E. V., Wood, G. R., Fannon, J. M., Moore, J. D., Bull, J. C., Chandler, D., et al. (2014). A virulent strain of deformed wing virus (DWV) of honeybees (Apis mellifera) prevails after Varroa destructor-mediated, or in vitro, transmission. PLoS Pathog. 10:e1004230. doi: 10.1371/journal.ppat.1004230
Saarinen, E. V., Austin, J. D., and Daniels, J. C. (2010). Genetic estimates of contemporary effective population size in an endangered butterfly indicate a possible role for genetic compensation. Evol. Appl. 3, 28–39. doi: 10.1111/j.1752-4571.2009.00096.x
Sachman-Ruiz, B., Narváez-Padilla, V., and Reynaud, E. (2015). Commercial Bombus impatiens as reservoirs of emerging infectious diseases in central México. Biol. Invasions 17, 2043–2053. doi: 10.1007/s10530-015-0859-6
Sadd, B., and Barribeau, S. (2015). The genomes of two key bumblebee species with primitive eusocial organization. Genome Biol. 16:76. doi: 10.1186/s13059-015-0623-3
Sadd, B. M., Barribeau, S. M., Bloch, G., De Graaf, D. C., Dearden, P., Elsik, C. G., et al. (2015). The genomes of two key bumblebee species with primitive eusocial organization. Genome Biol. 16:76. doi: 10.1186/s13059-015-0623-3
Saura, M., Tenesa, A., Woolliams, J. A., Fernández, A., and Villanueva, B. (2015). Evaluation of the linkage-disequilibrium method for the estimation of effective population size when generations overlap: an empirical case. BMC Genomics 16:922. doi: 10.1186/s12864-015-2167-z
Sedlazeck, F. J., Rescheneder, P., and von Haeseler, A. (2013). NextGenMap: fast and accurate read mapping in highly polymorphic genomes. Bioinformatics 29, 2790–2791. doi: 10.1093/bioinformatics/btt468
Simão, F. A., Waterhouse, R. M., Ioannidis, P., Kriventseva, E. V., and Zdobnov, E. M. (2015). BUSCO: assessing genome assembly and annotation completeness with single-copy orthologs. Bioinformatics 31, 3210–3212. doi: 10.1093/bioinformatics/btv351
Spevak, E., Jepson, S., and Williams, P. (2015). “Bumblebee conservation worldwide within the IUCN framework,” in Pollination Services to Agriculture: Sustaining and Enhancing a Key Ecosystem Service, ed. B. Gemmill-Herren (Abingdon: FAO), 180–199.
Stanke, M., and Waack, S. (2003). Gene prediction with a hidden Markov model and a new intron submodel. Bioinformatics 19(Suppl. 2), ii215–ii225. doi: 10.1093/bioinformatics/btg1080
Stolle, E., Wilfert, L., Schmid-Hempel, R., Schmid-Hempel, P., Kube, M., Reinhardt, R., et al. (2011). A second generation genetic map of the bumblebee Bombus terrestris (Linnaeus, 1758) reveals slow genome and chromosome evolution in the Apidae. BMC Genomics 12:48. doi: 10.1186/1471-2164-12-48
Szabo, N. D., Colla, S. R., Wagner, D. L., Gall, L. F., and Kerr, J. T. (2012). Do pathogen spillover, pesticide use, or habitat loss explain recent North American bumblebee declines? Conserv. Lett. 5, 232–239. doi: 10.1111/j.1755-263X.2012.00234.x
Tajima, F. (1989). The effect of change in population size on DNA polymorphism. Genetics 123, 597–601.
Vurture, G. W., Sedlazeck, F. J., Nattestad, M., Underwood, C. J., Fang, H., Gurtowski, J., et al. (2017). GenomeScope: fast reference-free genome profiling from short reads. Bioinformatics 33, 2202–2204. doi: 10.1093/bioinformatics/btx153
Walker, B. J., Abeel, T., Shea, T., Priest, M., Abouelliel, A., Sakthikumar, S., et al. (2014). Pilon: an integrated tool for comprehensive microbial variant detection and genome assembly improvement. PLoS One 9:e112963. doi: 10.1371/journal.pone.0112963
Wall, J. D., and Przeworski, M. (2000). When did the human population size start increasing? Genetics 155, 1865–1874.
Waples, R. K., Larson, W. A., and Waples, R. S. (2016). Estimating contemporary effective population size in non-model species using linkage disequilibrium across thousands of loci. Heredity 117, 233–240. doi: 10.1038/hdy.2016.60
Weinstock, G. M., Robinson, G. E., Gibbs, R. A., Worley, K. C., Evans, J. D., Maleszka, R., et al. (2006). Insights into social insects from the genome of the honeybee Apis mellifera. Nature 443, 931–949. doi: 10.1038/nature05260
Weir, B. S., and Hill, W. G. (1980). Effect of mating structure on variation in linkage disequilibrium. Genetics 95, 477–488.
Williams, P., Colla, S., and Xie, Z. (2009). Bumblebee vulnerability: common correlates of winners and losers across three continents. Conserv. Biol. 23, 931–940. doi: 10.1111/j.1523-1739.2009.01176.x
Williams, P. H., and Osborne, J. L. (2009). Bumblebee vulnerability and conservation world-wide. Apidologie 40, 367–387. doi: 10.1051/apido/2009025
Williams, P. H., Thorp, R. W., Richardson, L. L., and Colla, S. R. (2014). Bumble Bees of North America: An Identification Guide. Princeton, NJ: Princeton University Press.
Wright, S. (1965). The interpretation of population structure by F-statistics with special regard to systems of mating. Evolution 19, 395–420. doi: 10.2307/2406450
Zayed, A. (2004). Effective population size in Hymenoptera with complementary sex determination. Heredity 93, 627–630. doi: 10.1038/sj.hdy.6800588
Zayed, A., and Packer, L. (2005). Complementary sex determination substantially increases extinction proneness of haplodiploid populations. Proc. Natl. Acad. Sci. U.S.A. 102, 10742–10746. doi: 10.1073/pnas.0502271102
Keywords: Bombus, bumblebee, conservation, inbreeding, pathogen, genomics, population genetics
Citation: Kent CF, Dey A, Patel H, Tsvetkov N, Tiwari T, MacPhail VJ, Gobeil Y, Harpur BA, Gurtowski J, Schatz MC, Colla SR and Zayed A (2018) Conservation Genomics of the Declining North American Bumblebee Bombus terricola Reveals Inbreeding and Selection on Immune Genes. Front. Genet. 9:316. doi: 10.3389/fgene.2018.00316
Received: 23 April 2018; Accepted: 24 July 2018;
Published: 10 August 2018.
Edited by:
Badri Padhukasahasram, Illumina, United StatesReviewed by:
Sofia G. Seabra, Universidade de Lisboa, PortugalLifeng Zhu, Nanjing Normal University, China
Copyright © 2018 Kent, Dey, Patel, Tsvetkov, Tiwari, MacPhail, Gobeil, Harpur, Gurtowski, Schatz, Colla and Zayed. This is an open-access article distributed under the terms of the Creative Commons Attribution License (CC BY). The use, distribution or reproduction in other forums is permitted, provided the original author(s) and the copyright owner(s) are credited and that the original publication in this journal is cited, in accordance with accepted academic practice. No use, distribution or reproduction is permitted which does not comply with these terms.
*Correspondence: Clement F. Kent, clementfkent@gmail.com Amro Zayed, zayed@yorku.ca