 Omid Jafari1,2*
 Jorge Manuel de Oliveira Fernandes2*
 Ali-Akbar Hedayati1
 Ali Shabany1Maryam Nasrolahpourmoghadam2,3
- 1Department of Fisheries, Faculty of Fisheries and Environmental Sciences, Gorgan University of Agricultural Sciences and Natural Resources, Gorgan, Iran
- 2Faculty of Biosciences and Aquaculture, Nord University, Bodø, Norway
- 3Department of Fisheries Sciences, Faculty of Natural Resources, University of Tehran, Karaj, Iran
Genetic diversity studies are essential in characterization of populations and species conservation. Alosa braschnikowi is a commercially valuable species native to the Caspian Sea. It is thought to have eight to nine subspecies, but the genetics of these populations remains to be investigated. The present study was performed to evaluate the genetic population structures of Caspian marine shad (Alosa braschnikowi) in the southern coast of the Caspian Sea using six pairs of SSR markers. A total of Alosa braschnikowi 140 specimens through five locations across the southern coast of the Caspian Sea were genotyped and 130 alleles were identified. The overall mean values of Ho and He were 0.58 and 0.87, respectively, with the highest and minimum value of Ho observed in Sari (0.67 ± 0.08) and Miankaleh (0.50 ± 0.04), respectively. The overall mean value of allelic richness was 12.6. The data suggest that there was a high rate of migration between populations of Alosa braschnikowi (overall mean of Nm = 13.57), with the highest value (19.07) between Gomishan and Mahmodabad locations. AMOVA results showed that 96% of variation was related to within populations and only 4% belonged to between populations. The mean Fst value of 0.019 indicates a low level of population differentiation. Our data suggest that there may be two genetically separate populations of Alosa braschnikowi across the southern coast of the Caspian Sea and a high rate of migration is likely to limit genetic diversity between them.
Introduction
Genetic diversity is one of the basic prerequisites for the preservation and survival of a species and its adaptation to habitats subjected to different environmental pressures. It is thought that high genetic diversity improves the competence of individuals and increases the probability of species survival (Zoller et al., 1999; Hinten et al., 2003; Diz and Presa, 2009). Genetic diversity, namely, the difference in the number and type of alleles in the chromosomal loci, is crucial in stock assessment plans (Waldman and Yammarino, 1999). There are several markers that have been used to assess the genetic structure of populations and among them microsatellites or simple sequence repeats (SSRs) are one of the most commonly used markers (Crooijmans et al., 1997; Li et al., 2007). In recent years, several species and populations have been endangered as a result of overfishing and loss of nursery grounds in the Caspian Sea (Kiabi et al., 1999). These factors have a significant effect on genetic diversity reduction and homogenization of populations (McQuown et al., 2000).
Clupeidae is one of the most important fish family widely distributed in the Caspian Sea (Patimar et al., 2011). In the southern Caspian Sea, this family includes two genera: Clupeonella and Alosa. The latter consists of four species (Mousavi-Sabet et al., 2016), namely, A. braschnikowi (Borodin, 1904), A. caspia caspia (Eichwald, 1838), A. kessleri (Grimm, 1887), and A. saposchnikowii (Grimm, 1887). Alosa braschnikowi and A. caspia are thought to be native to the Caspian Sea and are more distributed in its southern areas. A. braschnikowi has a herring-like body shape, typically reaching 30 to 50 cm, and it usually feeds on small fishes [e.g., Clupeonella engrauliformis and gobies (Neogobius)] and also crustaceans (Coad, 2013). This species migrates within the Caspian Sea but never enters its tributary rivers. The high number of reported subspecies (up to nine) of A. braschnikowi may be an indication of population diversity, but this is likely affected by hybridization events between A. braschnikowi and other Alosa species and also between the various subspecies. In spite of the high frequency of this species in the Caspian Sea, there is a lack of molecular data and a modern revision is required to characterize its populations and ascertain their conservation status. It is well documented that for a successful conservation and effective management of a species, like designing a strategy of maintaining genetic diversity, it is highly essential to determine both genetic population structure and genetic variation within among populations (Sun et al., 2011). Hence, the present study was performed to determine the genetic population structure of A. braschnikowi across the southern regions of the Caspian Sea.
Materials and Methods
Sampling and DNA Extraction
In December 2013, a total of 140 specimens of A. braschnikowi (28 individuals per location) were sampled in five locations across the southern Caspian Sea including Anzali (E: 49°26’, N: 37°25’), Gomishan (E: 54°04’, N: 37°04’), Mahmood-Abad (E: 52°15’, N: 36°37’), Miankaleh (E: 53°35’, N: 36°48’), and Sari (E: 53°03’, N: 36°33’) (Figure 1), and sacrificed with an overdose of tricaine methanesulfonate (Pharmaq Ltd., UK) at 300 mg/L for 5 min. The dorsal fin of each fish was then clipped and stored in absolute ethanol until DNA extraction. DNA extraction was performed using DNeasy Blood & Tissue Kit (Qiagen, Valencia, CA, USA) following the manufacturer’s protocol. DNA integrity was checked by electrophoresis on a 1% (w/v) agarose gel and its concentration was determined using the NanoDrop (ND™-1000, Thermo Fisher Scientific, USA).
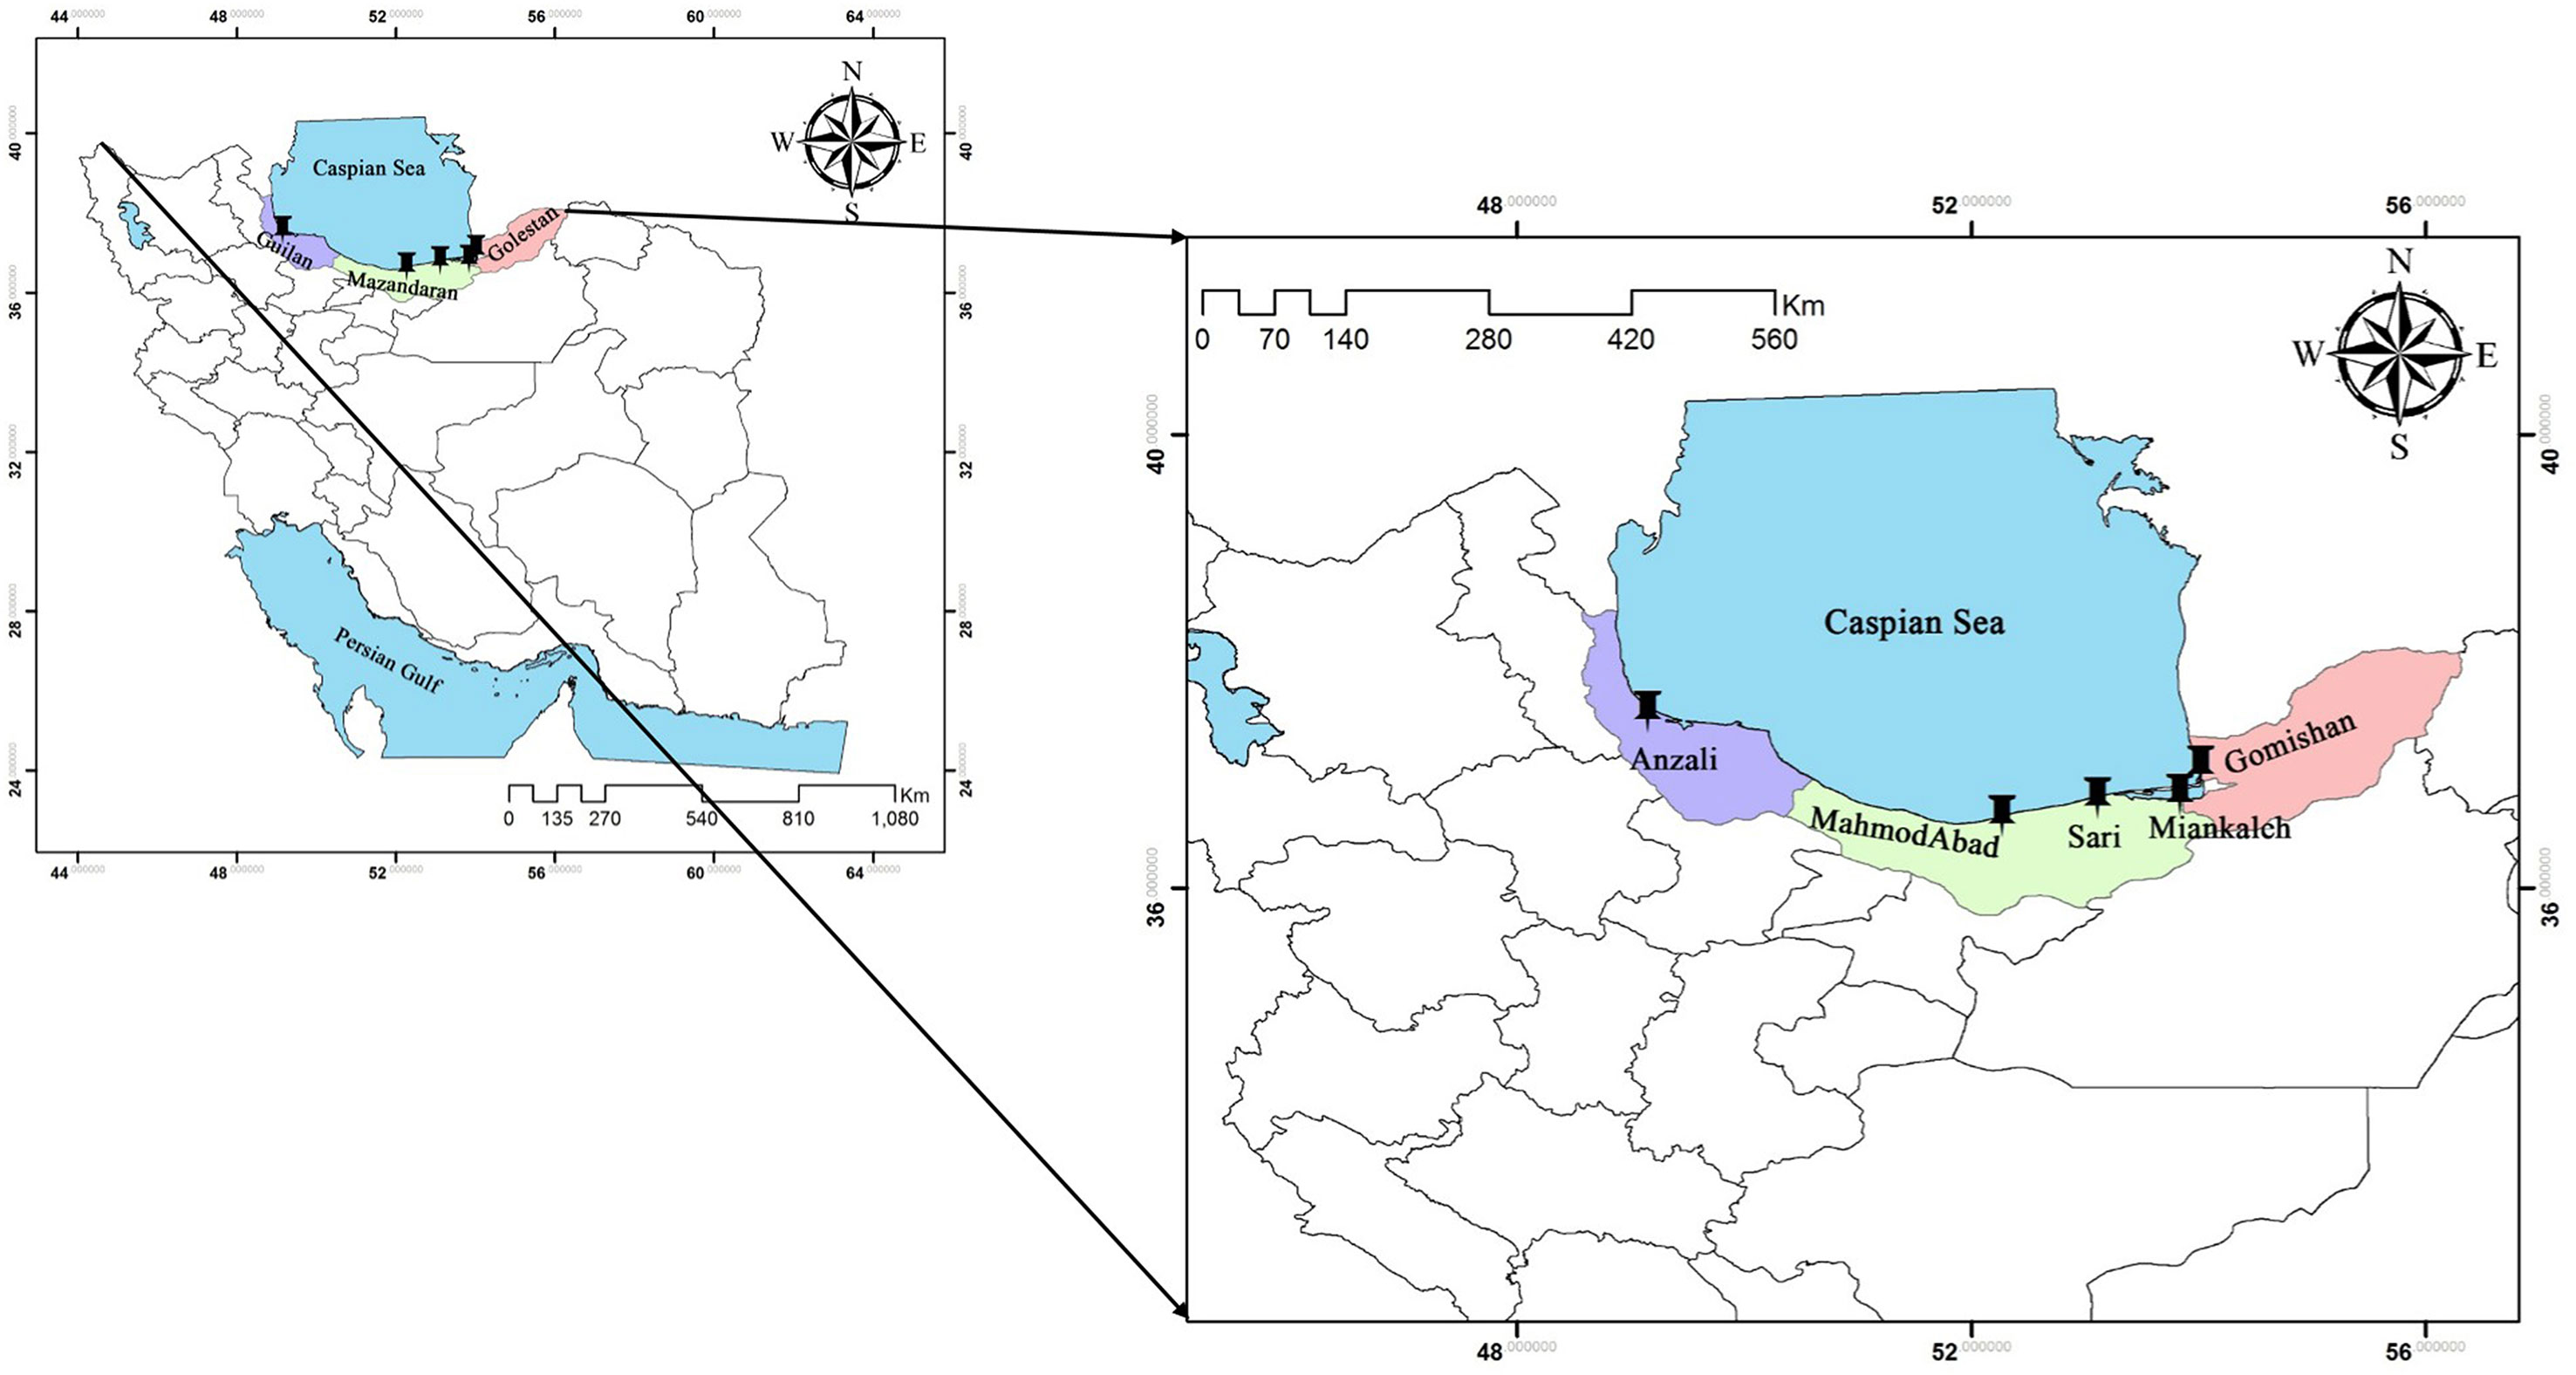
Figure 1 Sampling locations of A. braschnikowi across the southern coast of the Caspian Sea in this study.
Amplification of Microsatellites
Six pairs of microsatellite markers (AsaD030, AsaD042, AsaC051, AsaC059, AsaD312, and AsaD392) with high allele count and polymorphism were selected from data on Alosa sapidissima (Julian and Bartron, 2007) (Table 1). Polymerase chain reaction was performed in an MJ Mini Thermal Cycler (Bio-Rad, USA) with 25 μl PCR-specific microtubes containing 30 ng DNA (2 μl), 0.5 μl of each primer (10 pmol/μl), 1 μl of 10 mM dNTPs, 0.2 μl of Taq DNA polymerase (Fermentas, Thermo Fisher, Lithuania), 2.25 μl of 10× PCR buffer (Fermentas, Thermo Fisher, Lithuania), 1 μl of 50 mM MgCl2, and sterile distilled water. The amplification steps were as follows: In the first step, denaturation at 94°C for 5 min, followed by 35 cycles of 45 s at 94°C, annealing at the selected temperature (Table 1) for 30 s and extension at 72°C for 45 s, with a final extension for 5 min at 72°C. The PCR products were then visualized by electrophoresis on a 6% (w/v) acrylamide gel. A 50-bp DNA ladder (Fermentas) was used as a benchmark for determining the size of the alleles. The gels were stained using the silver-nitrate method (Bassam et al., 1991) and the Gel Pro analyzer package 3.9 (Gene, USA) was used to calculate the SSR lengths.
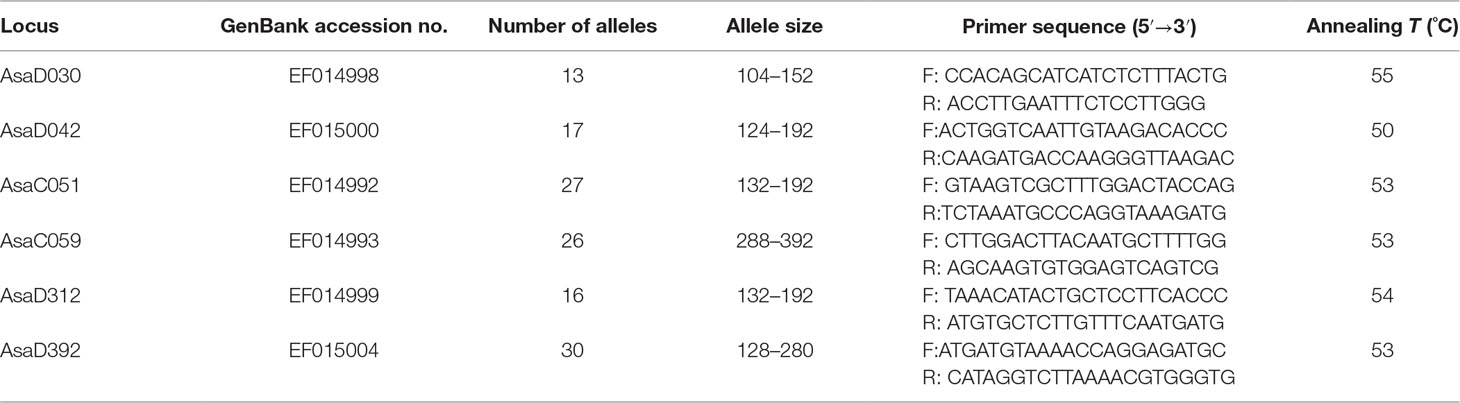
Table 1 SSR loci used on A. braschnikowi and their features. Primer sequences and annealing temperatures are also indicated.
Statistical Analysis
Observed heterozygosity (Ho), expected heterozygosity (He), and deviation from Hardy–Weinberg equilibrium (HWE) were determined using GenAlex 6.5 (Peakall and Smouse, 2006). Errors in allele scoring, large allele dropout, and null alleles were investigated with Micro-checker 2.2.1 (Van Oosterhout et al., 2004). A non-parametric Wilcoxon test (Zar, 1999) in SPSS software Ver 20 was used to determine the level of difference between Ho and He values. Using FSTAT software (ver 2.9.3), values of allele richness and Fis were determined (Goudet, 2002). Among and between populations, genetic diversity and separation values between locations based on Fst index were obtained by AMOVA using GenAlex 6.41 (Peakall and Smouse, 2006).
A linkage disequilibrium test between pairs of genetic sites was done using the GENEPOP 4.0.10 software (Rousset, 2008). Unbiased genetic distances (D) and genetic identities (I) according to Nei (Nei, 1978) were calculated in Popgene 1.0. A Bayesian approach in STRUCTURE v.2.3.4 was used to deduce the population structure of A. braschnikowi and to make an estimation of genetically detached populations (Pritchard et al., 2000). The number of populations (K) was estimated considering 10,000 as length of burn-in period and 100,000 of MCMC reps after burn-in, with an assumption of K = 1–5 and 100 iterations. The best K was decided based on the Delta K method suggested by Evanno et al (2005). The Bottleneck software 1.2.02 was used to determine the probability of recent bottleneck events with 1,000 iterations based on either heterozygosity excess or deficiency (Cornuet and Luikart, 1996).
Results
Allele Identification
All SSR markers used in this study showed a high level of polymorphism in A. braschnikowi (Table 1). A total of 1,680 fragments were amplified from five populations of A. braschnikowi using six SSR markers ranging from 104 to 392 nt in length. The 130 alleles identified were distributed in the range 13–30 per SSR locus. In all populations, there were 16 alleles through all loci that were unique or private alleles (Supplementary Table S1). Total average of observed alleles through all loci was 12.6; its range was 7–20 alleles, belonging to Sari and Miankaleh locations, respectively (Table 2).

Table 2 Polymorphic information at six SSR loci of five wild populations of A. braschnikowi.
Linkage Analysis and Population Genetic Variation
The Genepop genotypic linkage disequilibrium analysis at each locus in each population revealed that there were no loci out of equilibrium in all populations (P > 0.05).
The average number of effective alleles in Anazali, Gomishan, Mahmodabad, Miankaleh, and Sari were 8.2, 8.65, 8.82, 7.56, and 9.07, respectively. Microchecker did not show any evidence of large allele dropout and scoring error but there was a probability of 0.24 by null alleles. The highest (0.89) and lowest (0.21) values of Ho were found at loci AsaD392 (Sari location) and AsaC059 (Gomishan area), respectively (Table 2). After Bonferroni correction, there was a high rate of deviation from HWE. The total mean of observed heterozygosity was 0.58 with maximum and minimum values of 0.67 and 0.50 in Sari and Miankaleh, respectively (Table 3). Also, the overall mean value of He was 0.87. The total mean value of inbreeding coefficient (Fis) at loci was 0.34, with maximum and minimum values of 0.43 and 0.26 in Miankaleh and Sari, respectively (Table 3). The maximum value (0.94) of polymorphic information content (PIC) was observed at loci AsaD392 and AsaC051, while the minimum value was obtained for AsaD030 (0.85). The PIC values for the all investigated loci are available in Table 4.
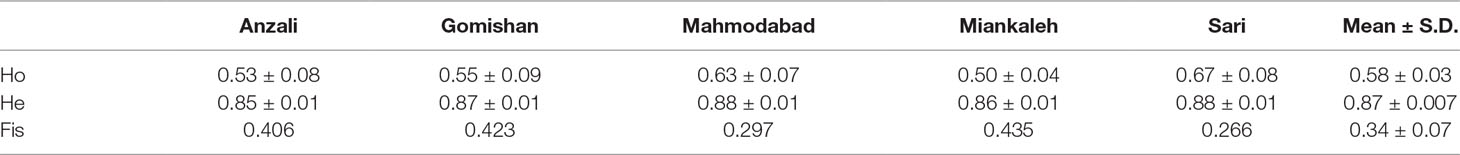
Table 3 Observed and expected values of heterozygosity and Fis index at different locations of A. braschnikowi. Mean values are also indicated.

Table 4 Polymorphism information content (PIC) values of the SSR markers examined in A. braschnikowi.
Population Genetic Differentiation and Cluster Analysis
The total mean value of Fst was 0.019 and the AMOVA results revealed that it was mostly related to within population variation (96%) rather than variation among populations (4%). Average gene flow (Nm) was calculated as 13.57 and the highest rate of Nm (19.07) was observed between Gomishan and Mahmodabad (Table 5). All Fst values between populations are also presented in Table 5, with the highest value observed between Anzali and Miankaleh locations (Fst = 0.025). Genetic identity and genetic distance parameters based on Nei index are shown on Table 6. The maximum and minimum genetic distances were observed between Anzali and Miankaleh (0.273) and Gomishan and Mahmodabad (0.07) locations, respectively. The Mantel test also revealed that there was no significant correlation between genetic and geographical distances (R2 = 0.25, P = 0.12). SSR cluster analysis revealed that the best K fitting to the data was 2, indicating genetically segregate populations [Mean LnP(K) = −4,116.400000, Stdev LnP(K) = 2.722132, Delta K = 11.417523] (Figure 2). The Bayesian tree based on allele frequency divergence (net nucleotide distance) comprised two main clades: i) Anzali and Sari, and ii) Gomishan, Mahmodabad, and Miankaleh (Figure 3). The net nucleotide distances between locations are provided in Supplementary Table S2. Also, results from Bottleneck analysis did not show any evidence for genetic bottleneck in any A. braschnikowi population (p of H excess or deficiency = 0.11).
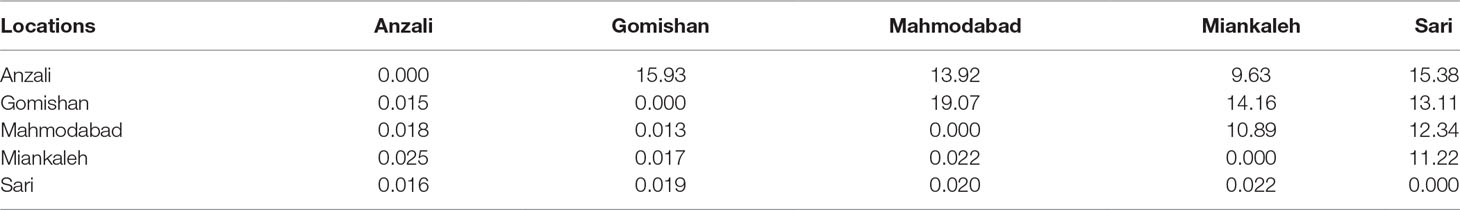
Table 5 Fst (below diagonal) and Nm (above diagonal) values between A. braschnikowi from different locations.
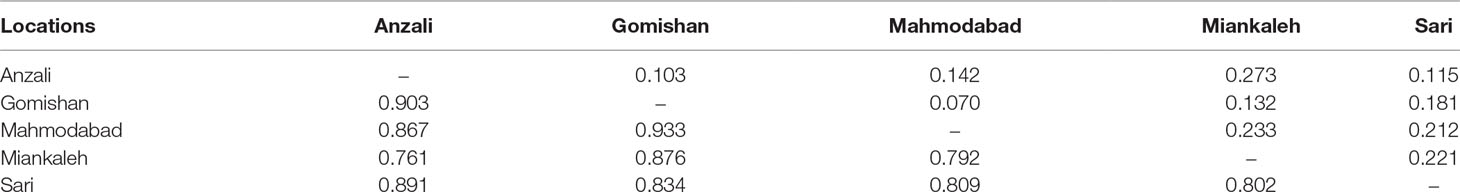
Table 6 Matrix of genetic distances (above diagonal) and identities (below diagonal) between different locations of A. braschnikowi.
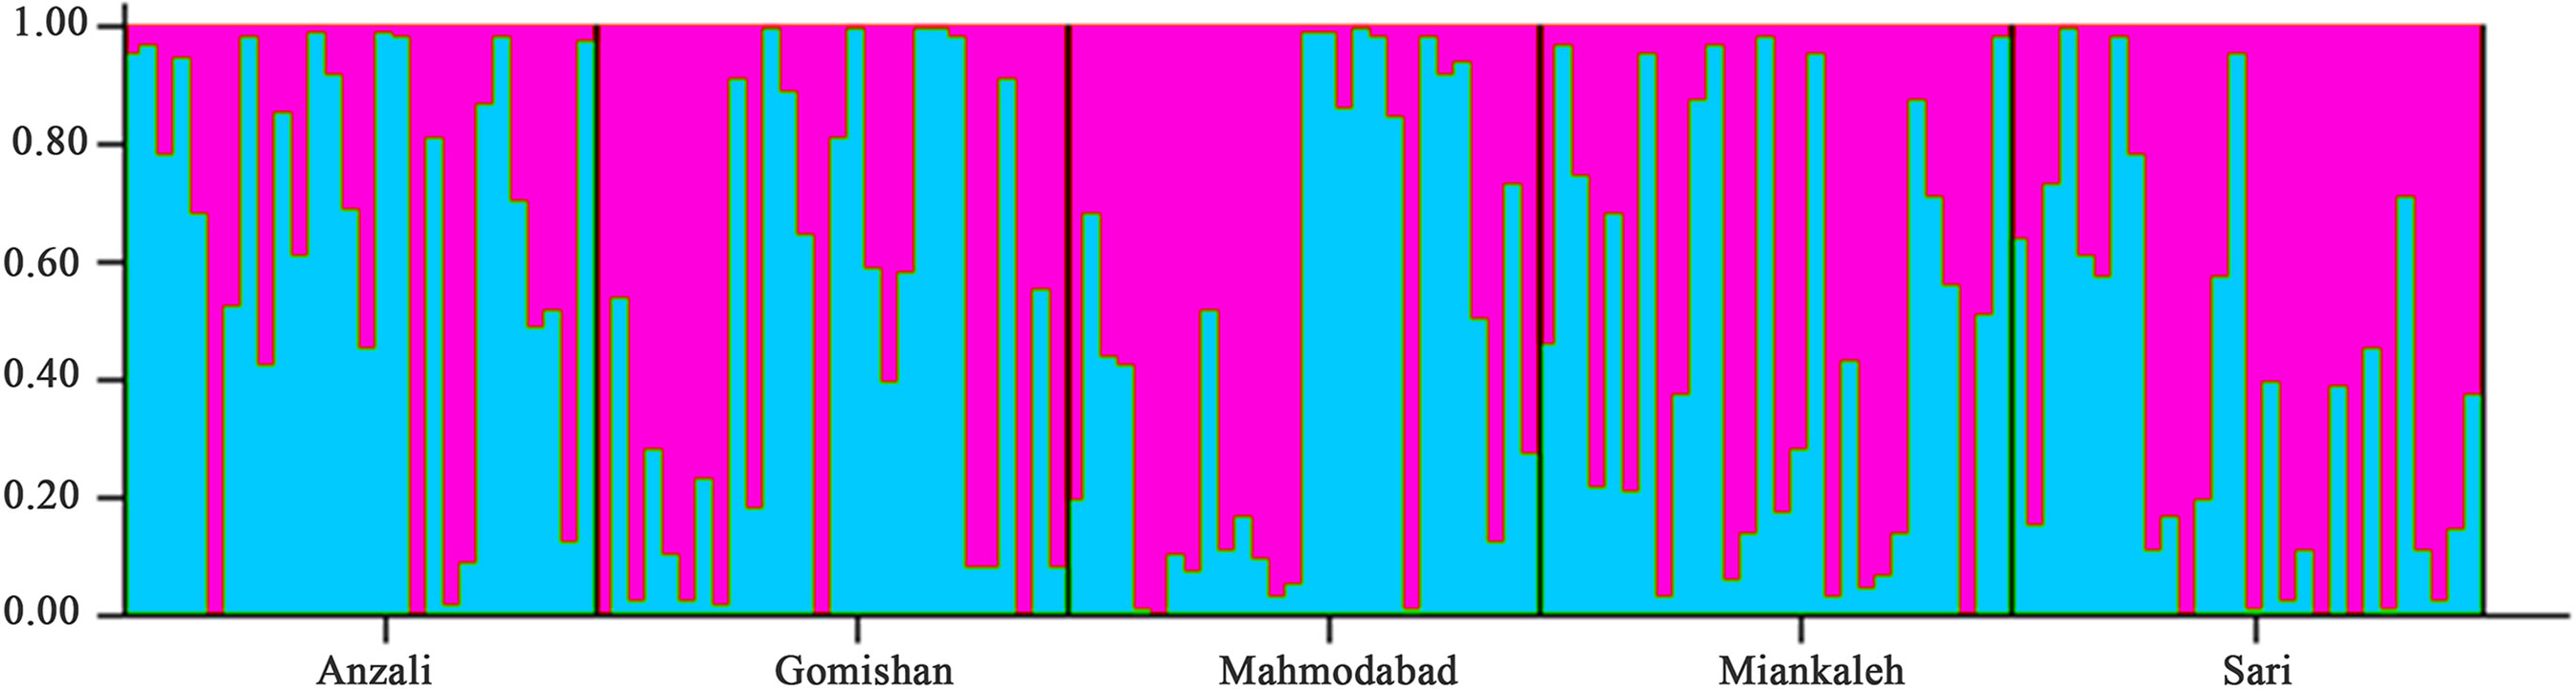
Figure 2 Admixture analysis of A. braschnikowi at K = 2; each bar represents an individual and the Y axis shows the probability of individuals belonging to the identified populations. For each individual, the different colors are related to the number of markers shared with the other cluster.
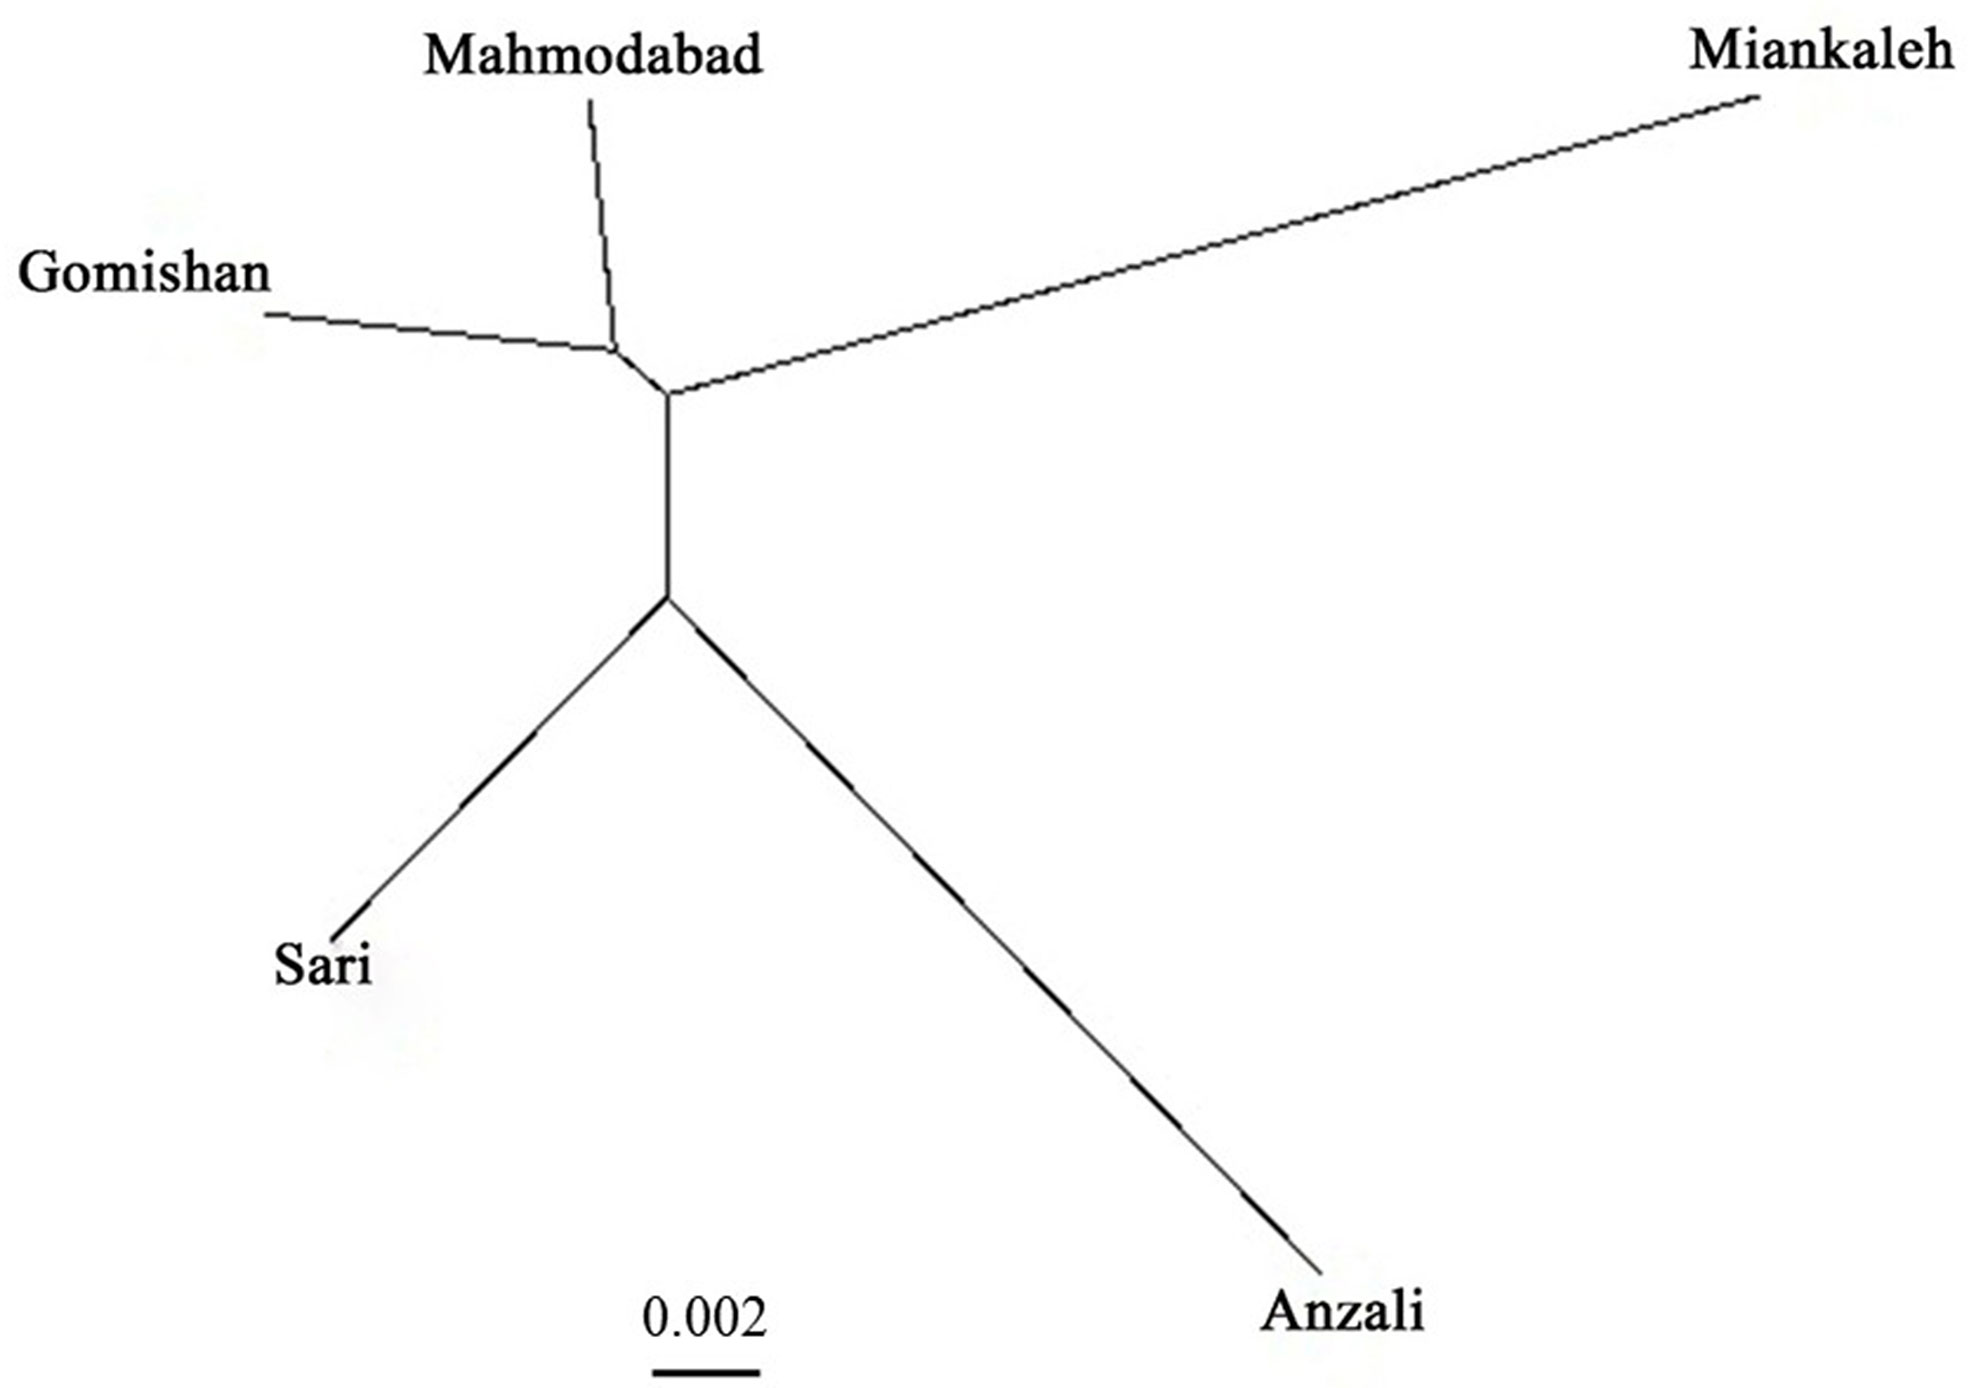
Figure 3 Bayesian tree of A. braschnikowi populations from five locations in the Caspian Sea. The length of the branches reflects the net nucleotide distance between groups.
Discussion
Genetic diversity in the structure of populations is one of the most important and essential principles for the survival and development of organisms (Diz and Presa, 2009). Overfishing (Bergh and Getz, 1989) and some other environmental stressors such as pollution and loss of habitat (Dudgeon et al., 2006) decrease the ability of a population to maintain its genetic diversity by reducing the effective population size. In genetic population studies, various parameters such as heterozygosity and the number of alleles (factual and effective) are used. At present, there are no specific SSR markers for the Alosa genus in the Caspian Sea. The usefulness of SSR markers depends on their polymorphism information content, which reflects the ability of a marker to detect a polymorphism in a given population (Dudu et al., 2015). We have demonstrated that the six SSRs found in American shad (Alosa sapidissima) (Julian and Bartron, 2007) show a high rate of polymorphism (PIC = 0.90) in A. braschnikowi as well. Heterozygosity as an index of genetic diversity shows the proportion of heterozygous loci in a given population (García‐Navas et al., 2014). The overall mean of observed heterozygosity at the population level was 0.58, which is higher than the reported value for freshwater fish (0.54 ± 0.25). Rare alleles have a low abundance (less than 0.01); thus, they have a minor contribution to heterozygosity and their removal does not have much effect on the observed heterozygosity. Because of this, in genetic population studies, this parameter (heterozygosity) alone cannot provide reliable results, which are mostly based on random variation in allele frequency (Kitada et al., 2009). Also, allelic variation of heterozygosity is more important in population genetic studies, and its increase or decrease can reflect the changes in the effective population size. Allelic richness is a more useful parameter in genetic population studies rather than heterozygosity (Li et al., 2009). Effective allele is a very important indicator in population studies and its increase or decrease can reflect the increase or decrease of the effective size of the population (Diz and Presa, 2009; Li et al., 2009). In the present study, based on the results from allelic richness analysis, the overall mean value of 12.61 alleles was obtained at the population level, which is also more than the reference value for freshwater fish (9.1 ± 6.1); also, all loci examined in this study showed values close to or higher than those reported for freshwater fish (AsaD030 = 9.0, AsaD042 = 10.8, AsaC051 = 16.0, AsaC059 = 13.8, AsaD312 = 11.2, AsaD392 = 15.8) (DeWoody and Avise, 2000). Unfortunately, there are no reports in Iranian Alosa sp. to enable a direct comparison. Nevertheless, the genetic diversity indices (Na = 15.4 and Ho = 0.81) in A. sapidissima (Julian and Bartron, 2007) are higher compared to the A. braschnikowi in this study, which may be related to the different number of specimens and markers used. In another study using eight pairs of dinucleotide microsatellite markers on Alosa fallax and A. alosa, the mean alleles per locus were 4.50 and 4.88, respectively (Faria et al., 2004). The level of heterozygosity in A. fallax and A. alosa species was 0.560 and 0.444, respectively. Differences in species type, primers, and sample size restrict direct comparisons, but our results suggest a relatively higher genetic variation of the A. braschnikowi compared to A. fallax and A. alosa.
The observed heterozygosity is significantly less than the expected value in A. braschnikowi (P < 0.05). There are several reasons that can explain this significant reduction in Ho compared with He, namely, high rate of migration, errors in reading alleles, and inbreeding (Skaala et al., 2004; Li et al., 2009). The obtained results of inbreeding coefficient showed a significant heterozygosity deficit through the loci (P = 0.0016). Also, there was a high rate of deviation from HWE (26 out of 30), which can be because of mixing between populations (natural migration) with different allele frequencies (Wahlund effect) (Karlsson and Mork, 2005). Based on the obtained Fst values, it can be concluded that the rate of differentiation between populations is low but significant (mean overall Fst value = 0.019, P = 0.01) (Balloux and Lugon-Moulin, 2002) and a high rate of migration can be the main factor underlying this low differentiation. Moreover, the patterns of genetic variation among A. braschnikowi populations suggest at least a historical connectivity between these now geographically distant populations, similarly to what has been observed in empire gudgeon, Hypseleotris compressa (McGlashan and Hughes, 2001). Another possible reason for low differentiation is the high rate of genetic diversity within each population, as we observed that 96% of variation is related to the within-population diversity. The gene flow between populations and individuals with very different allele frequencies increases the genetic variation within a population but tends to make different populations genetically similar to each other. A bottleneck analysis revealed that the A. braschnikowi populations studied do show signs of genetic bottlenecks. Hence, the more likely explanations for the limited differentiation observed among these Caspian A. braschnikowi populations are i) gene flow and/or ii) the lack of isolation for enough time to enable genetic drift and selection to cause a noticeable differentiation.
A. braschnikowi is known to exhibit migratory behavior through the Caspian Sea but there is a basic need to closely monitor them to avoid the loss of Alosa stocks in Iran. Also, it seems that there are at least two genetically different stocks of A. braschnikowi in the southern coast of the Caspian Sea: one clade including fish from Anzali and Sari locations (South to Southwest), and the second one comprising Gomishan, Mahmodabad and Miankaleh locations (South to Southeast). Based on Thorpe (1982), populations belonging to same species and same genus have genetic identity in the range 0.80 to 0.97 and 0.35 to 0.85, respectively. The genetic identity within A. braschnikowi in the present study was 0.76 to 0.93, indicating that all populations studied indeed belong to same species. The lower observed values of genetic identity may be due to a lower gene flow between some locations like Miankaleh and Anzali, suggesting that they may be different subspecies. A. brascnikowi subspecies have been recently classified based on phenotypic traits, such as the number of gill rakers and diet (Coad, 2013). Integrating morphologic and genetic data will be an effective way to improve the classification of A. braschnikowi subspecies and also to determine if the populations examined in the present study correspond to any of the subspecies already identified using phenotypic characters.
To the best of our knowledge, this is the first molecular population study performed on A. braschnikowi from the southern Caspian Sea. Our data indicated that there are at least two genetically distinct subpopulations of A. braschnikowi in this area. It seems that A. braschnikowi harbor high genetic diversity in both terms of observed heterozygosity and allelic richness across the southern coast of the Caspian Sea. The obtained results of this study accompanied by some other biological data like morphology and mtDNA analysis can aid in the conservation of this species, since its current status is undetermined because of data deficiency (Di Dario, 2017).
Data Availability
All datasets generated for this study are included in the manuscript and the supplementary files.
Ethics Statement
This study was carried out in accordance with the recommendations of the Canadian Council on Animal Care, as implemented by the ethics committee of Gorgan University of Agricultural Sciences and Natural Resources (Iran). The protocol was approved by the ethics committee of Gorgan university of Agricultural Sciences and Natural Resources.
Author Contributions
OJ designed and performed the experiments, analyzed the data, and wrote the manuscript. JF contributed to data analysis and reviewed the manuscript. MP assisted in sampling and laboratory experiments. A-AH contributed to writing the manuscript, and AS supervised the work and provided the required laboratory infrastructure.
Funding
The authors are grateful to Gorgan University of Agricultural Sciences and Natural Resources (Iran) for providing the required financial, technical and administrative support, and to Nord University (Norway) for covering the open access publication fee.
Conflict of Interest Statement
The authors declare that the research was conducted in the absence of any commercial or financial relationships that could be construed as a potential conflict of interest.
Acknowledgments
The authors are grateful to Gorgan University of Agricultural Sciences and Natural Resources (Iran) for providing the required financial, technical, and administrative support, and to Nord University (Norway) for covering the open access publication fee.
Supplementary Material
The Supplementary Material for this article can be found online at: https://www.frontiersin.org/articles/10.3389/fgene.2019.00760/full#supplementary-material
References
Balloux, F., Lugon-Moulin, N. (2002). The estimation of population differentiation with microsatellite markers. Mol. Ecol. 11 (2), 155–165. doi: 10.1046/j.0962-1083.2001.01436.x
Bassam, B. J., Caetano-Anollés, G., Gresshoff, P. M. (1991). Fast and sensitive silver staining of DNA in polyacrylamide gels. Anal. Biochem. 196 (1), 80–83. doi: 10.1016/0003-2697(91)90120-I
Bergh, M. O., Getz, W. M. (1989). Stability and harvesting of competing populations with genetic variation in life history strategy. Theor. Popul. Biol. 36 (1), 77–124. doi: 10.1016/0040-5809(89)90024-5
Coad, B. (2013). Fresh water fishes of Iran. Retrieved from http://www.briancoad.com/contents.htm. On: 10 April 2019.
Cornuet, J. M., Luikart, G. (1996). Description and power analysis of two tests for detecting recent population bottlenecks from allele frequency data. Genetics. 144 (4), 2001–2014.
Crooijmans, R., Van der Poel, J., Groenen, M., Bierbooms, V., Komen, J. (1997). Microsatellite markers in common carp (Cyprinus carpio L). Anim. Genet. 28 (2), 129–134. doi: 10.1111/j.1365-2052.1997.00097.x
DeWoody, J., Avise, J. (2000). Microsatellite variation in marine, freshwater and anadromous fishes compared with other animals. J. Fish Biol. 56 (3), 461–473. doi: 10.1111/j.1095-8649.2000.tb00748.x
Di Dario, F. (2017). Alosa braschnikowi. The IUCN Red List of Threatened Species 2017. e.T98468449A98844981. Downloaded on 20 April 2019. doi: 10.2305/IUCN.UK.2017-3.RLTS.T98468449A98844981.en
Diz, A. P., Presa, P. (2009). The genetic diversity pattern of Mytilus galloprovincialis in Galician Rias (NW Iberian estuaries). Aquaculture 287 (3–4), 278–285. doi: 10.1016/j.aquaculture.2008.10.029
Dudgeon, D., Arthington, A. H., Gessner, M. O., Kawabata, Z.-I., Knowler, D. J., Lévêque, C., et al. (2006). Freshwater biodiversity: importance, threats, status and conservation challenges. Biol. Rev. 81 (2), 163–182. doi: 10.1017/S1464793105006950
Dudu, A., Georgescu, S. E., Costache, M. (2015). “Evaluation of genetic diversity in fish using molecular markers,” in Molecular Approaches to Genetic Diversity (London, UK: IntechOpen), 163–193. doi: 10.5772/60423
Evanno, G., Regnaut, S., Goudet, J. (2005). Detecting the number of clusters of individuals using the software STRUCTURE: a simulation study. Mol. Ecol. 14 (8), 2611–2620. doi: 10.1111/j.1365-294X.2005.02553.x
Faria, R., Wallner, B., Weiss, S., Alexandrino, P. (2004). Isolation and characterization of eight dinucleotide microsatellite loci from two closely related clupeid species (Alosa alosa and A. fallax). Mol. Ecol. Resour. 4 (4), 586–588. doi: 10.1111/j.1471-8286.2004.00745.x
García-Navas, V., Cáliz-Campal, C., Ferrer, E. S., Sanz, J. J., Ortego, J. (2014). Heterozygosity at a single locus explains a large proportion of variation in two fitness-related traits in great tits: a general or a local effect? J. Evol. Biol. 27 (12), 2807–2819. doi: 10.1111/jeb.12539
Goudet, J. (2002). FSTAT, a program to estimate and test gene diversities and fixation indices, version 2.9. 3. http://www2.unil.ch/popgen/softwares/fstat.htm.
Hinten, G., Harriss, F., Rossetto, M., Braverstock, P. (2003). Genetic variation and island biogreography: microsatellite and mitochondrial DNA variation in island populations of the Australian bush rat, Rattus fuscipes greyii. Conserv. Genet. 4 (6), 759–778. doi: 10.1023/B:COGE.0000006113.58749.ac
Julian, S. E., Bartron, M. L. (2007). Microsatellite DNA markers for American shad (Alosa sapidissima) and cross-species amplification within the family Clupeidae. Mol. Ecol. Resour. 7 (5), 805–807. doi: 10.1111/j.1471-8286.2007.01710.x
Karlsson, S., Mork, J. (2005). Deviation from Hardy–Weinberg equilibrium, and temporal instability in allele frequencies at microsatellite loci in a local population of Atlantic cod. ICES J. Mar. Sci. 62 (8), 1588–1596. doi: 10.1016/j.icesjms.2005.05.009
Kiabi, B. H., Abdoli, A., Naderi, M. (1999). Status of the fish fauna in the South Caspian Basin of Iran. Zool. Middle East 18 (1), 57–65. doi: 10.1080/09397140.1999.10637782
Kitada, S., Shishidou, H., Sugaya, T., Kitakado, T., Hamasaki, K., Kishino, H. (2009). Genetic effects of long-term stock enhancement programs. Aquaculture 290 (1–2), 69–79. doi: 10.1016/j.aquaculture.2009.02.011
Li, D., Kang, D., Yin, Q., Sun, X., Liang, L. (2007). Microsatellite DNA marker analysis of genetic diversity in wild common carp (Cyprinus carpio L). populations. J. Genet. Genomics. 34 (11), 984–993. doi: 10.1016/S1673-8527(07)60111-8
Li, J., Wang, G., Bai, Z. (2009). Genetic variability in four wild and two farmed stocks of the Chinese freshwater pearl mussel (Hyriopsis cumingii) estimated by microsatellite DNA markers. Aquaculture 287 (3–4), 286–291. doi: 10.1016/j.aquaculture.2008.10.032
McGlashan, D. J., Hughes, J. M. (2001). Low levels of genetic differentiation among populations of the freshwater fish Hypseleotris compressa (Gobiidae: Eleotridinae): implications for its biology, population connectivity and history. Heredity 86 (2), 222–233. doi: 10.1046/j.1365-2540.2001.00824.x
McQuown, E. C., Sloss, B. L., Sheehan, R. J., Rodzen, J., Tranah, G. J., May, B. (2000). Microsatellite analysis of genetic variation in sturgeon: new primer sequences for Scaphirhynchus and Acipenser. Trans. Am. Fish. Soc. 129 (6), 1380–1388. doi: 10.1577/1548-8659(2000)129<1380:MAOGVI>2.0.CO;2
Mousavi-Sabet, H., Heidari, A., Paknejad, S. (2016). Length–weight and length–length relationships of the genus Alosa (Clupeoidei: Clupeiformes: Clupeidae) along the southern Caspian Sea coast. J. Appl. Ichthyol. 32 (1), 129–130. doi: 10.1111/jai.12908
Nei, M. (1978). Estimation of average heterozygosity and genetic distance from a small number of individuals. Genetics. 89 (3), 583–590.
Patimar, R., Habibi, S., Jafari, F. (2011). A study on the growth parameters of Alosa caspia caspia eichwald, 1838 in the southern Caspian coast. IR. J. Fish. 64 (1), 15–26.
Peakall, R., Smouse, P. E. (2006). GENALEX 6: genetic analysis in Excel. Population genetic software for teaching and research. Mol. Ecol. Resour. 6 (1), 288–295. doi: 10.1111/j.1471-8286.2005.01155.x
Pritchard, J. K., Stephens, M., Donnelly, P. (2000). Inference of population structure using multilocus genotype data. Genetics. 155 (2), 945–959.
Rousset, F. (2008). genepop’007: a complete re-implementation of the genepop software for Windows and Linux. Mol. Ecol. Resour. 8 (1), 103–106. doi: 10.1111/j.1471-8286.2007.01931.x
Skaala, Ø., Høyheim, B., Glover, K., Dahle, G. (2004). Microsatellite analysis in domesticated and wild Atlantic salmon (Salmo salar L.): allelic diversity and identification of individuals. Aquaculture 240 (1–4), 131–143. doi: 10.1016/j.aquaculture.2004.07.009
Sun, D.-Q., Shi, G., Liu, X.-Z., Wang, R.-X., Xu, T.-J. (2011). Genetic diversity and population structure of the marbled rockfish, Sebastiscus marmoratus, revealed by SSR markers. J. Genet. 90, 21–24. doi: 10.1007/s12041-011-0022-9
Thorpe, J. P. (1982). The molecular clock hypothesis: biochemical evolution, genetic differentiation and systematics. Annu. Rev. Ecol. Syst. 13 (1), 139–168. doi: 10.1146/annurev.es.13.110182.001035
Van Oosterhout, C., Hutchinson, W. F., Wills, D. P., Shipley, P. (2004). Micro-Checker: software for identifying and correcting genotyping errors in microsatellite data. Mol. Ecol. Resour. 4 (3), 535–538. doi: 10.1111/j.1471-8286.2004.00684.x
Waldman, D. A., Yammarino, F. J. (1999). CEO charismatic leadership: levels-of-management and levels-of-analysis effects. Acad. Manage. Rev. 24 (2), 266–285. doi: 10.5465/amr.1999.1893936
Zar, J. H. (1999). Biostatistical analysis Vol. 12. New Jersey, Cap: Upper Saddle River. Prentice Hall, 231–272.
Keywords: allelic richness, Alosa braschnikowi, genetic diversity, population structure, SSR markers
Citation: Jafari O, Fernandes JMdO, Hedayati A-A, Shabany A and Nasrolahpourmoghadam M (2019) Microsatellite Analysis of Five Populations of Alosa braschnikowi (Borodin, 1904) Across the Southern Coast of the Caspian Sea. Front. Genet. 10:760. doi: 10.3389/fgene.2019.00760
Received: 22 April 2019; Accepted: 17 July 2019;
Published: 23 August 2019.
Edited by:
Tian Tang, Sun Yat-sen University, ChinaReviewed by:
Joana Isabel Robalo, University Institute of Psychological, Social and Life Sciences, PortugalLiping Zeng, University of California, United States
Copyright © 2019 Jafari, Fernandes, Hedayati, Shabany and Nasrolahpourmoghadam. This is an open-access article distributed under the terms of the Creative Commons Attribution License (CC BY). The use, distribution or reproduction in other forums is permitted, provided the original author(s) and the copyright owner(s) are credited and that the original publication in this journal is cited, in accordance with accepted academic practice. No use, distribution or reproduction is permitted which does not comply with these terms.
*Correspondence: Omid Jafari, jaafari.omid@yahoo.com; Jorge Manuel de Oliveira Fernandes, jorge.m.fernandes@nord.no