 Zhenhua Zhu
 Zheng Jin
 Haibo Zhang3
 Dahui Sun
- 1Department of Orthopaedic Trauma, The First Hospital of Jilin University, Changchun, China
- 2Department of Immunology, College of Basic Medical Sciences, Jilin University, Changchun, China
- 3College of Chemistry, Jilin University, Changchun, China
Background: Soft tissue sarcomas (STSs) are heterogeneous at the clinical and molecular level and need to be further sub-clustered for treatment and prognosis.
Materials And Methods: STSs were sub-clustered based on RNAseq and miRNAseq data extracted from The Cancer Genome Atlas (TCGA) through the combined process of similarity network fusion (SNF) and consensus clustering (CC). The expression and clinical characteristics of each sub-cluster were analyzed. The genes differentially expressed (lncRNAs, miRNAs, and mRNAs) between the poor prognosis and good prognosis clusters were used to construct a competing endogenous RNA (ceRNA) network. Functional enrichment analysis was conducted and a hub network was extracted from the constructed ceRNA network.
Results: A total of 247 STSs were classified into three optimal sub-clusters, and patients in cluster 2 (C2) had a significantly lower rate of survival. A ceRNA network with 91 nodes and 167 edges was constructed according to the hypothesis of ceRNA. Functional enrichment analysis revealed that the network was mainly associated with organism development functions. Moreover, LncRNA (KCNQ1OT1)-miRNA (has-miR-29c-3p)–mRNA (JARID2, CDK8, DNMT3A, TET1)-competing endogenous gene pairs were identified as hub networks of the ceRNA network, in which each component showed survival significance.
Conclusion: Integrative clustering analysis revealed that the STSs could be clustered into three sub-clusters. The ceRNA network, especially the subnetwork LncRNA (KCNQ1OT1)-miRNA (has-miR-29c-3p)-mRNA (JARID2, CDK8, DNMT3A, TET1) was a promising therapeutic target for the STS sub-cluster associated with a poor prognosis.
Introduction
Soft tissue sarcomas (STSs) are a set of malignancies that account for 1% of adult cancers (Linch et al., 2014). Approximately 50 STS histological subtypes show heterogeneity in clinical manifestations, histopathological features, and molecular signature (Casali et al., 2018). Despite major breakthroughs in therapies for STSs, standard treatment modalities combined with chemotherapy, radiotherapy, and surgery have failed to improve the overall survival. Although STSs have some common morphologic features and are traditionally aggregated in clinical trials, it is apparent that there are important differences in tumor biology and genetics among these tumors from different anatomic sites (Casali et al., 2018). Consequently, molecular alterations in these heterogeneous tumors should be further explored and new classification systems should be established for the development of more rational, specific, and effective treatments.
Accumulated evidence has shown that transcriptional regulation plays an important role in STS development and progression (Kehlen et al., 2014; Li et al., 2016). The components of the transcriptome, including miRNAs, mRNAs, and lncRNAs, work together and define the biological functions of the tumors. Consensus clustering (CC) (Monti et al., 2003), as an unsupervised subtype discovery method, has been frequently used in many genomic studies (Verhaak et al., 2010; Lehmann et al., 2011). Similarity network fusion (SNF) (Wang et al., 2014) is a computational method that fuses similarity networks for aggregating multi-omics data. The combination of SNF and CC to identify cancer subtypes has achieved more stable and smoother cluster results (Xu et al., 2017).
Competing endogenous RNAs (ceRNAs) are RNAs that indirectly regulate other transcripts by competing for shared miRNAs. Although merely a fraction of the long non-coding RNAs has been functionally characterized, increasing evidence has shown that lncRNAs harboring multiple miRNA response elements (MREs) can act as ceRNAs to sequester miRNA activity and thereby, reduce the inhibition of miRNA on its targets (Salmena et al., 2011). Deregulation of the ceRNA network may lead to human diseases (Barretina et al., 2010). However, to date, little research has been conducted on ceRNA-related lncRNAs associated with the regulatory mechanisms in STS.
The present study aimed to explore the classification of STSs and determine the possible mechanism behind different clusters. The mRNA, lncRNA, and miRNA data of The Cancer Genome Atlas (TCGA) SARC project was used to perform the CC and determine the sub-clusters of STSs. Based on differentially expressed mRNAs, lncRNAs, and miRNAs, a ceRNA network was constructed. The present results demonstrated heterogeneity at the transcriptomic level among STSs. Hence, STSs should be further classified into sub-clusters with biological significance.
Materials and Methods
Data Collection
The TCGA database was manually searched and the data transfer tool (provided by GDC Apps) was used to download the level 3 RNASeq, miRNAseq, and somatic mutation data of the specimens, as well as the clinical information of STS patients (https://tcga-data.nci.nih.gov/).
Consensus Cluster Analysis
The RNAseq (including mRNA and lncRNA) and miRNAseq count data were normalized using the voom function of the limma package (Ritchie et al., 2015). The most variant-expressed 5,000 mRNAs or lncRNAs, defined by median absolute deviation (MAD), and all miRNAs were used for CC. The samples were clustered through the “ExecuteSNF.CC” function of the R package “Cancer Subtypes” (Xu et al., 2017). This function is a combined process of SNF (Wang et al., 2014) and CC (Gaujoux and Seoighe, 2010) for cancer subtype identification. First, the SNF separately calculates the similarity between patients using RNAseq data and miRNA data. Then, the similarities between patients from these two data types are integrated by a cross-network diffusion process to construct a fusion patient similarity matrix that is used as the sample distance for CC. After the samples are allocated into clusters, the silhouette width (Rousseeuw, 1987) is determined to evaluate the clustering results. This combines the factors of cohesion and separation.
Cluster Characteristic Identification
To compare our sub-clusters with histological subtypes, the distribution of the histological subtypes in each cluster was determined. An overall survival analysis was also conducted within the three clusters using the R package survminer. The mutation rates of tumor protein p53 (TP53) and RB transcriptional corepressor 1 (RB1), which are the two most mutated tumor suppressor genes in STS (Barretina et al., 2010), were also measured and compared between the clusters using chi-squared tests. The sub-cluster specific genes were screened by a two-step method. In the first step, the differential genes of one sub-cluster and the other two sub-clusters were calculated using the limma package (Smyth, 2005), with a threshold of |log2 (fold-change [FC])| > 2.0 and a P-value < 0.01. The second step was to take the intersection of the two parts of the differential genes. These were the sub-cluster specific genes.
CeRNA Network Construction
In this study, sub-clusters were identified by the expression of lncRNAs, miRNAs, and mRNAs and their internal regulatory relationships were observed between the genes according to the hypothesis of ceRNA. R package GDCRNATools (Xu et al., 2017), which utilized the target information of miRNA–mRNA and miRNA–mRNA of Starbase V2.0 (Li et al., 2014), was utilized to construct the ceRNA network. The target information in Starbase 2.0 was predicted by the miRanda prediction program (Betel et al., 2008) and validated in the CLIP-seq data of the AGO protein (a major member of the RISC complex). Specifically, the “gdcCEAnalysis” function of GDCRNATools was used to identify the competing lncRNA–mRNA pairs: (a) a lncRNA–mRNA pair should have an overlap of miRNA targets (based on the Starbase lncrna–mirna and mrna–mirna prediction data), (b) the significant positive correlation between lncRNA and mRNA expression data should be verified by Pearson’s correlation (cutoff P-value < 0.05), and (c) the expression of both lncRNA and mRNA showed be negatively correlated with the expression of shared miRNAs (cutoff P-value < 0.05). In the above process, competing gene pairs are connected through miRNAs, forming a ceRNA regulatory network. To obtain insight into the function of the ceRNA network, gene ontology (GO) enrichment analysis was conducted using the STRING database (v11.0) (Szklarczyk et al., 2019).
Identification and Survival Analysis of the Subnetwork
Cox regulation analysis and KM plot analysis were conducted on each node of the network. Moreover, if all the components of a competing gene pair (lncRNA–miRNA–mRNA) showed survival significance (Cox P-value < 0.05 and logRank P-value < 0.05), the pair was selected as part of the hub ceRNA network.
For KM survival analysis of the subnetwork, the samples were divided into two groups according to the median expression level of the nodes. For all the mRNAs of the subnetwork, the samples were divided according to the first principal of the principal components analysis (PCA) of all the mRNAs. To explore the survival significance of the whole subnetwork (Wang et al., 2019), a Cox regulation model was utilized using all the nodes of the subnetwork as variables and the risk score of each sample was calculated. Then, the samples were divided into two groups by the median risk score.
Results
Clinical Details of Samples
The TCGA-SARC project contained the RNAseq, miRNAseq, and clinical information of 247 soft sarcoma specimens. These specimens were obtained from 113 males and 134 female patients with a median age of 61 years (range: 21 – 90 years old). The histologic subtypes included 99 leiomyosarcomas (LMSs), 56 dedifferentiated liposarcomas, 28 pleomorphic malignant fibrous histiocytomas (MFHs), 22 myxofibrosarcomas, 20 undifferentiated pleomorphic sarcomas (UPSs), and 22 other types of STSs. The detailed histological subgroup distribution is presented in Table 1.
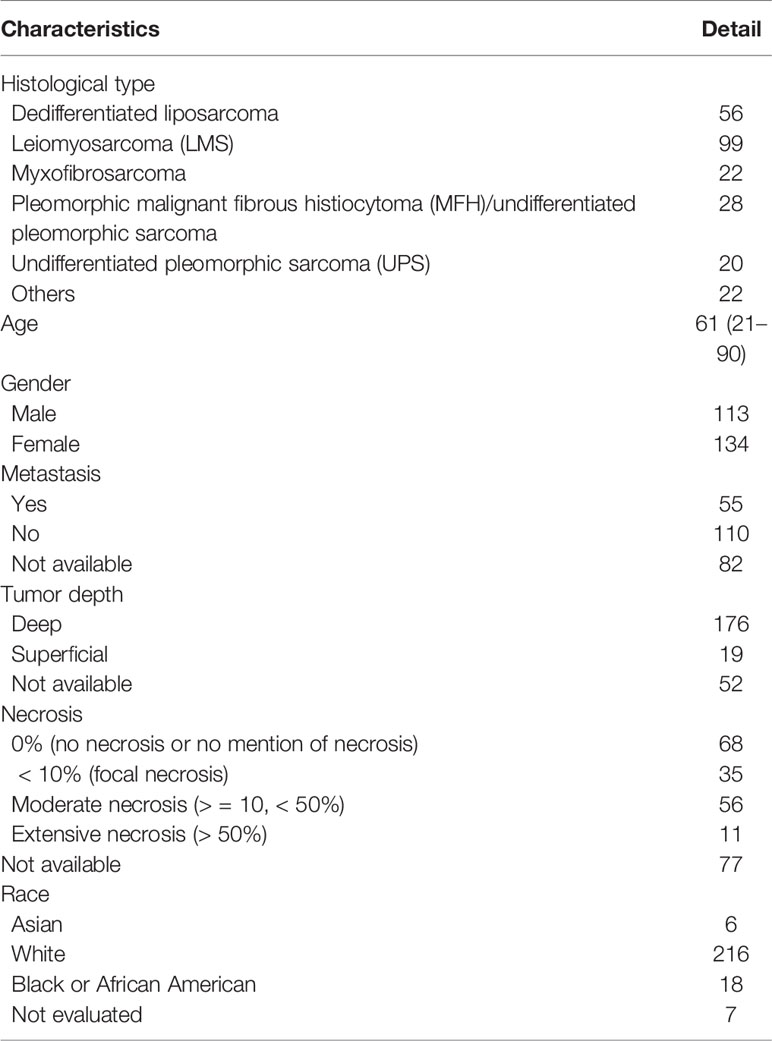
Table 1 Clinical statistical information of patients in the training group.
STSs Could Be Classed Into Three Optimal Sub-Clusters
The optimal number of clusters was estimated by calculating the relative change in the area under the empirical cumulative distribution (CDF) curve, which reflected the consensus distribution (Monti et al., 2003). The biggest change was observed when the cluster number (k) was set to 3 (Figure 1A), so the STSs were sub-clustered into three clusters. As for the silhouette width, the silhouette width values vary between −1 and 1. The more it approaches 1, the better the cohesion and separation degree becomes. The average silhouette width of all points is the total silhouette width of the clustering results. This technique provides a succinct graphical representation of how well each object lies within its cluster. In this study, the width of each cluster and the total width were close to 1, indicating a higher similarity among the members within the cluster compared to the members in different clusters (Figure 1B). The sample distance was visualized in heatmap and showed that the samples within the cluster were close to each other, whereas the samples between the clusters were far from each other (Figure 1C).
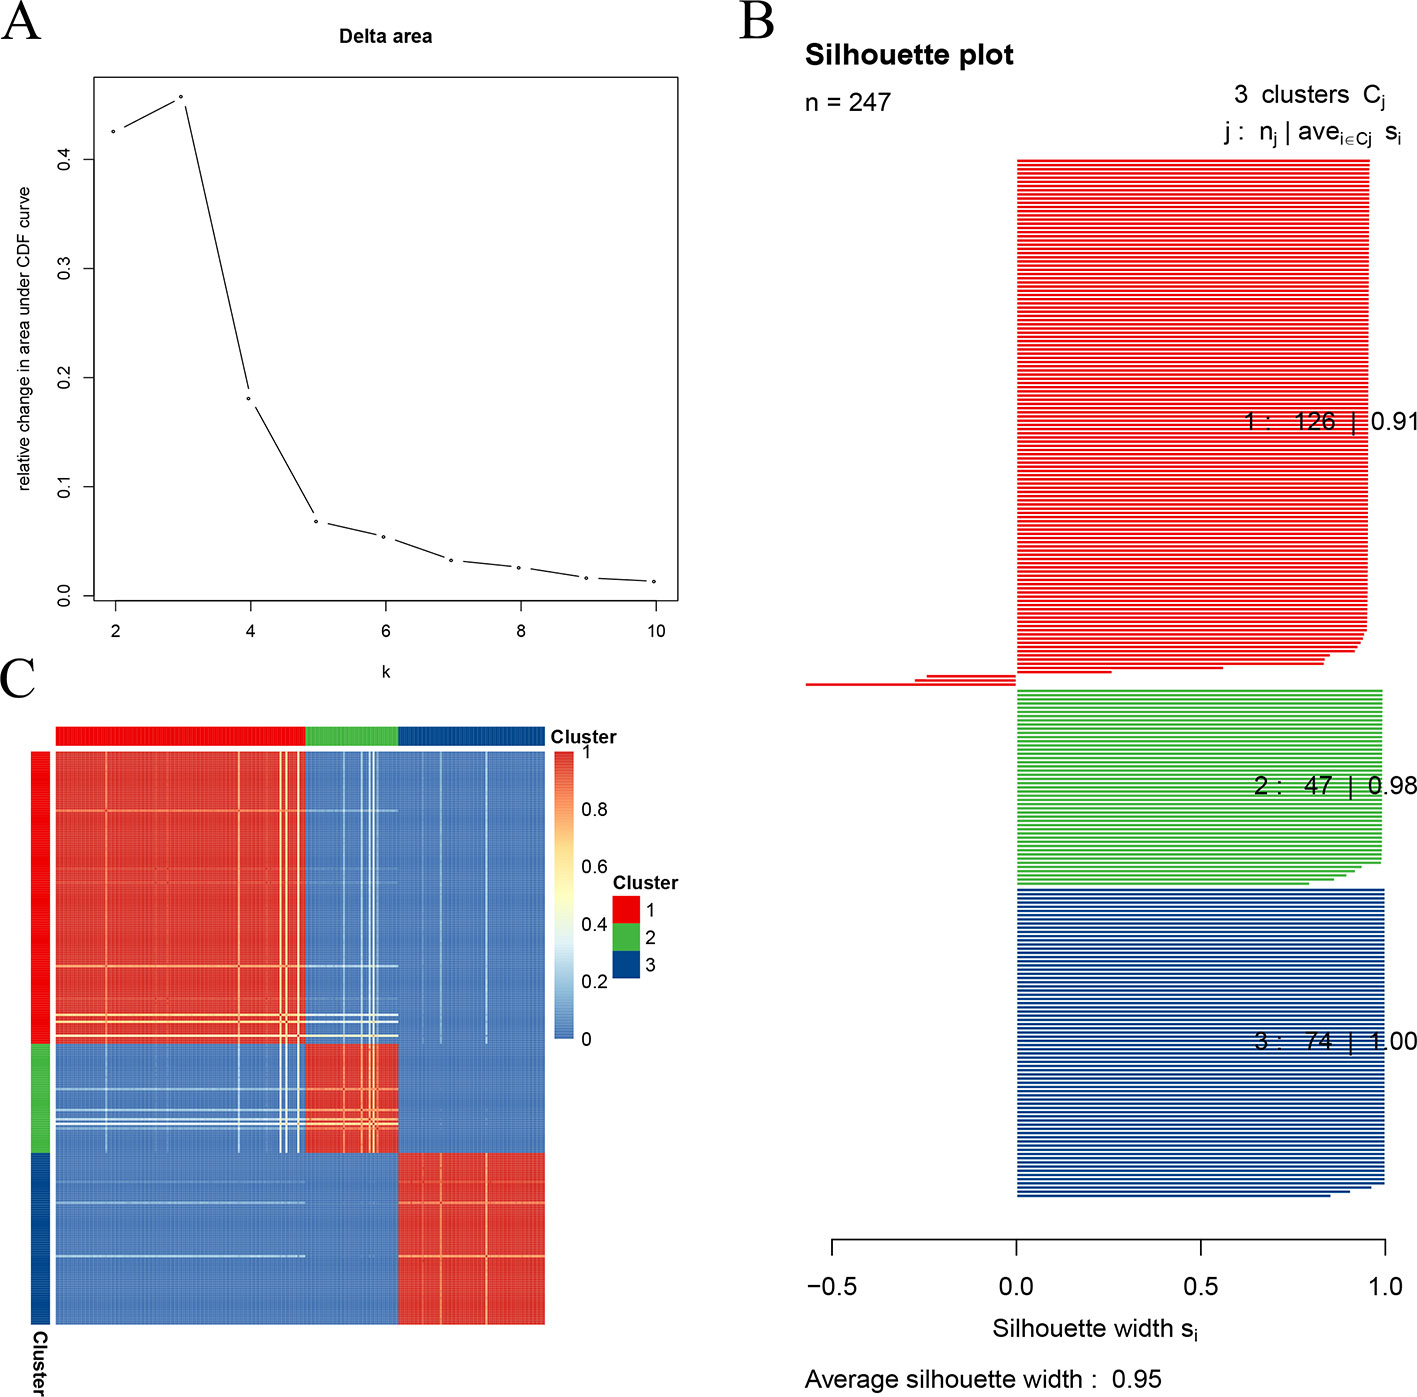
Figure 1 Clustering soft tissue sarcomas (STSs) in the training test dataset. (A) Relative change in the area under the empirical cumulative distribution (CDF) curve. (B) The specimens in the subgroup are well-allocated to their group, rather than to the other groups (average silhouette width: 0.95). (C) Sample distance in the training set. The darker the color, the closer the samples became, and the more similar the samples were.
Characteristics of the Sub-Clusters
The STSs were clustered into three sub-clusters through CC. The distribution of the patients in each cluster is presented in Figure 2A. C1 contains various histological types; C2 mainly contains two types of histological types, dedifferentiated liposarcoma and LMS (74%); and C3 mainly contains LMS (99%). Dedifferentiated liposarcoma comprised a high proportion of both the C1 and C2 clusters. LMS was mainly present in C3 and had a certain distribution in C1 and C2. Myxofibrosarcoma, pleomorphic MFH/UPS, and UPS were mainly present in C1. The survival analysis revealed that patients in cluster 2 (C2) had a significantly lower rate of survival (P = 0.02) compared to those in cluster 1 (C1) and cluster 3 (C3) (Figure 2B). Because the main histological type in C3 was LMS, to verify that the difference in survival was caused by molecular sub-clusters rather than histological types, survival analysis for the LMSs in the C2 and C3 clusters was conducted. The overall survival rate of LMS patients in C2 was significantly (P = 0.0015) lower than that in the patients in C3 (Figure 2C). The sub-cluster information for each sample is provided in Supplementary Table 1.
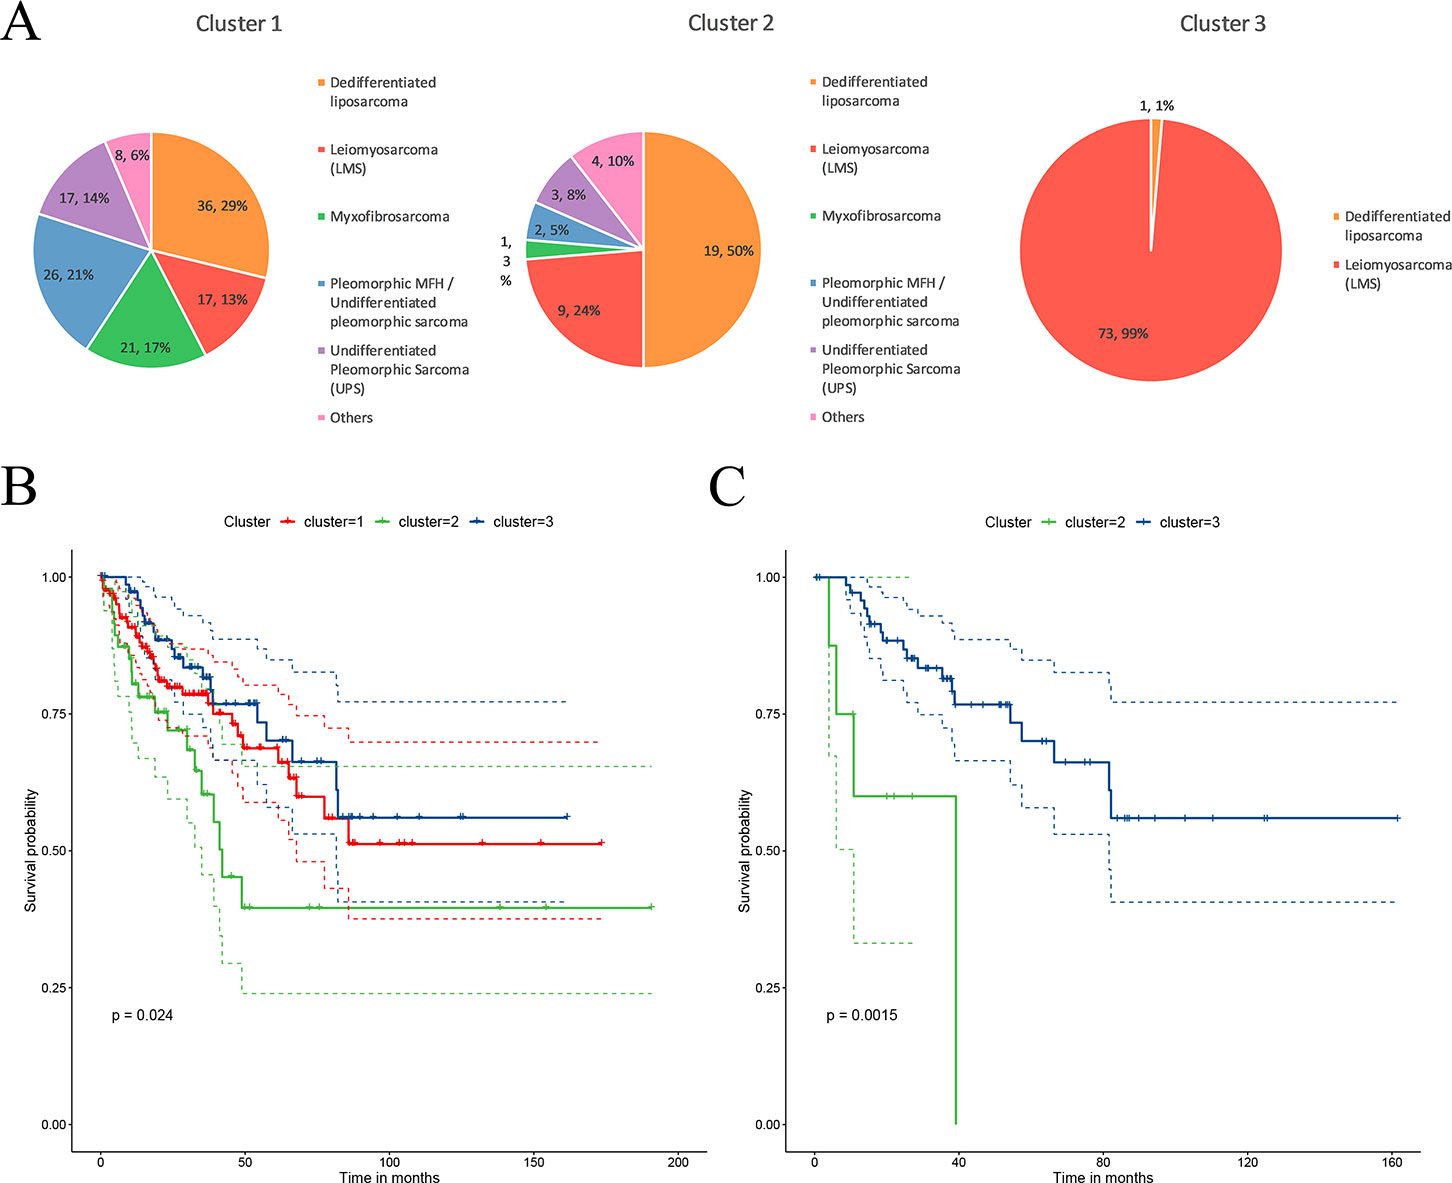
Figure 2 Characteristics of the sub-clusters. (A) The distribution of tumor histological types in each sub-cluster. (B) Patients in the three sub-clusters had significant differences in survival. (C) The leiomyosarcoma (LMS) patients in C2 had a significantly lower overall survival.
For each cluster, a differential analysis was conducted twice for the other two clusters. Genes with significantly high expression in both differential analyses were defined as sub-cluster-specific genes. The genes with the greatest sum of FCs were defined as marker genes of the sub-clusters, as shown on the heatmap (Figure 3). As for marker genes, LncRNA LINC01133, mRNA dickkopf WNT signaling pathway inhibitor 1 (DKK1), and miRNA has-miR-511-5p were the marker genes of C1; LncRNA maternally expressed 3 (MEG3), mRNA bone morphogenetic protein 7 (BMP7), and miRNA has-miR-483-3p were the marker genes of C2; and LncRNA HAND2-AS1, mRNA myosin heavy chain 11 (MYH11), and miRNA has-miR-133a-3p were the marker genes of C3. As the most commonly mutated genes in the STSs, TP53 and RB1 had significantly (P < 0.05) higher mutation rates in the C1 (TP53: 17.0%, RB1: 4.0%) and C3 clusters (TP53: 15.0%, RB1: 6.9%) than in the C2 cluster (TP53: 2.0%, RB1: 0.0%) (Figure 3). The mutation rate of the genes for each sub-cluster is provided in Supplementary Table 2.
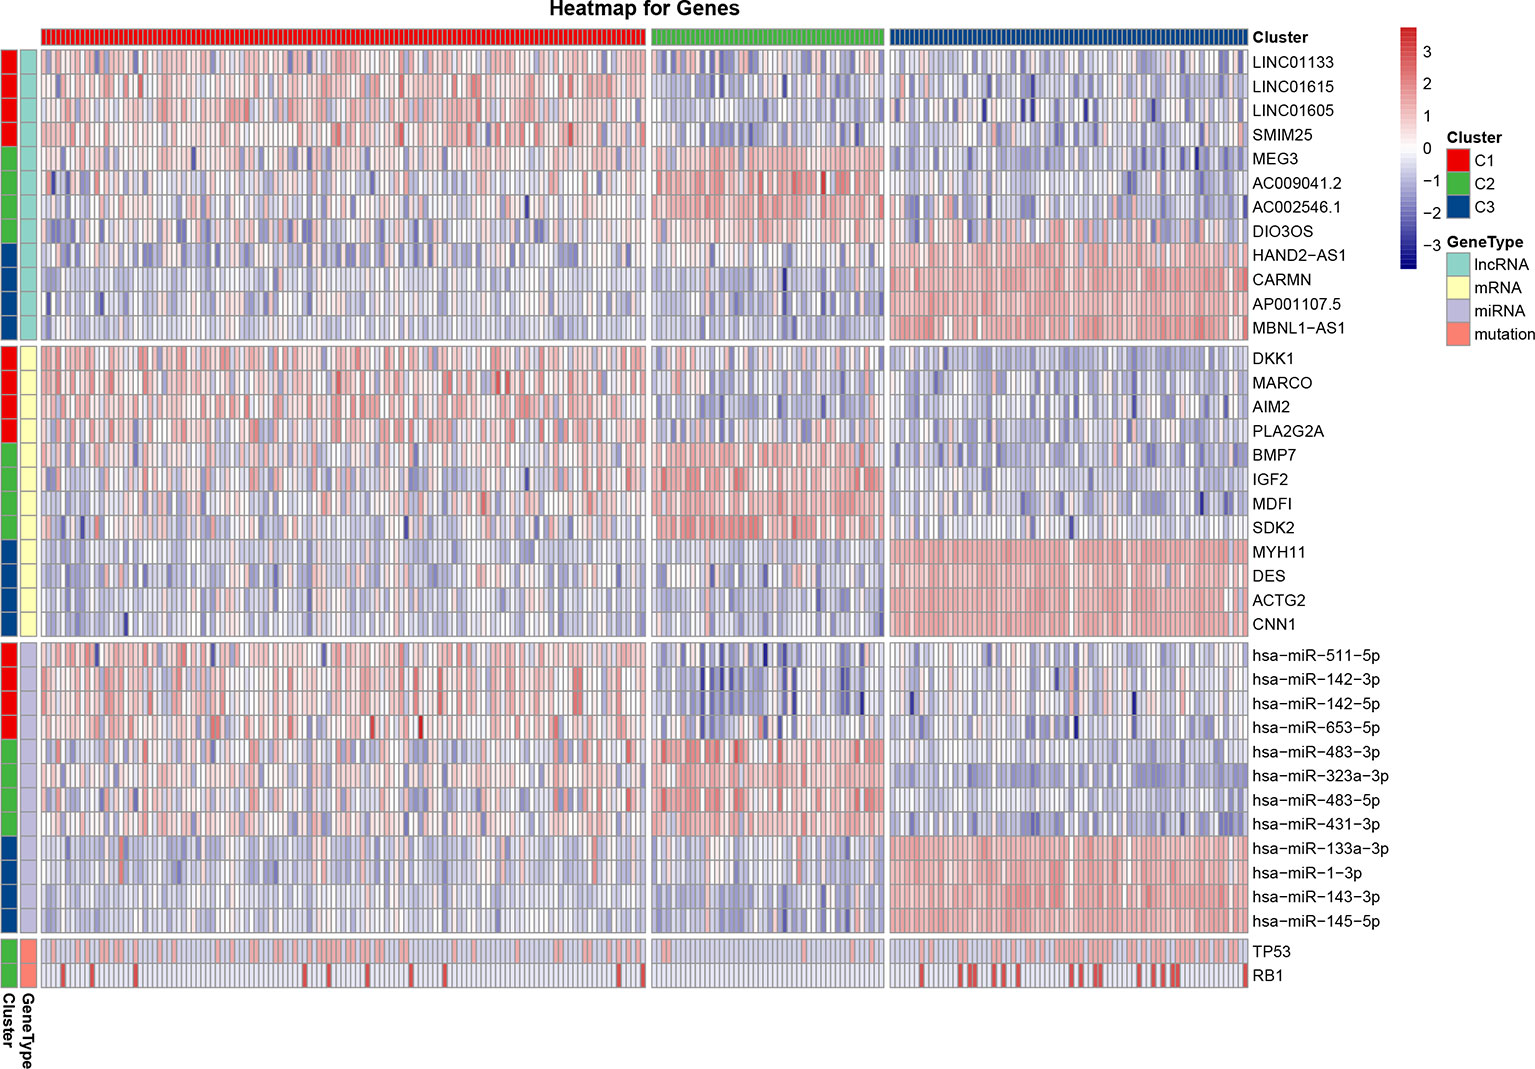
Figure 3 Heatmap of the most differentially expressed lncRNAs, mRNAs, miRNAs, and variant mutation genes of each sub-cluster. The expression Z-score data were normalized. The red color indicates high expression, the blue color indicates low expression, and a darker color indicates a greater difference from the mean.
The Components of the CeRNA Network and Functional Enrichment Results
Patients in the C2 cluster showed significantly worse prognoses that were not driven by mutations of the tumor suppressor genes TP53 and RB1. A ceRNA network constructed based on the differentially expressed genes (lncRNAs, miRNAs, and mRNAs) between C2 and C1&C3, may help us understand the biological characteristics of C2. In the differential analysis of C2 and C1&C3, 100 differentially expressed LncRNAs, 152 differentially expressed miRNAs, and 1,663 differentially expressed mRNAs were identified. Under the ceRNA hypothesis, a ceRNA network with 91 nodes (4 lncRNAs, 8 miRNAs, and 79 mRNAs, Supplementary Table 3) and 167 edges was Figure 4. In the network, the expression of miRNAs was negatively correlated with the expression of their lncRNA and mRNA targets, whereas and the expression of lncRNAs and mRNAs was positively correlated. Competing gene pairs were connected by shared miRNAs, forming a single network. Functional enrichment analysis indicated that ceRNA mainly functioned in development and cellular processes (Figure 5, Supplementary Table 4).
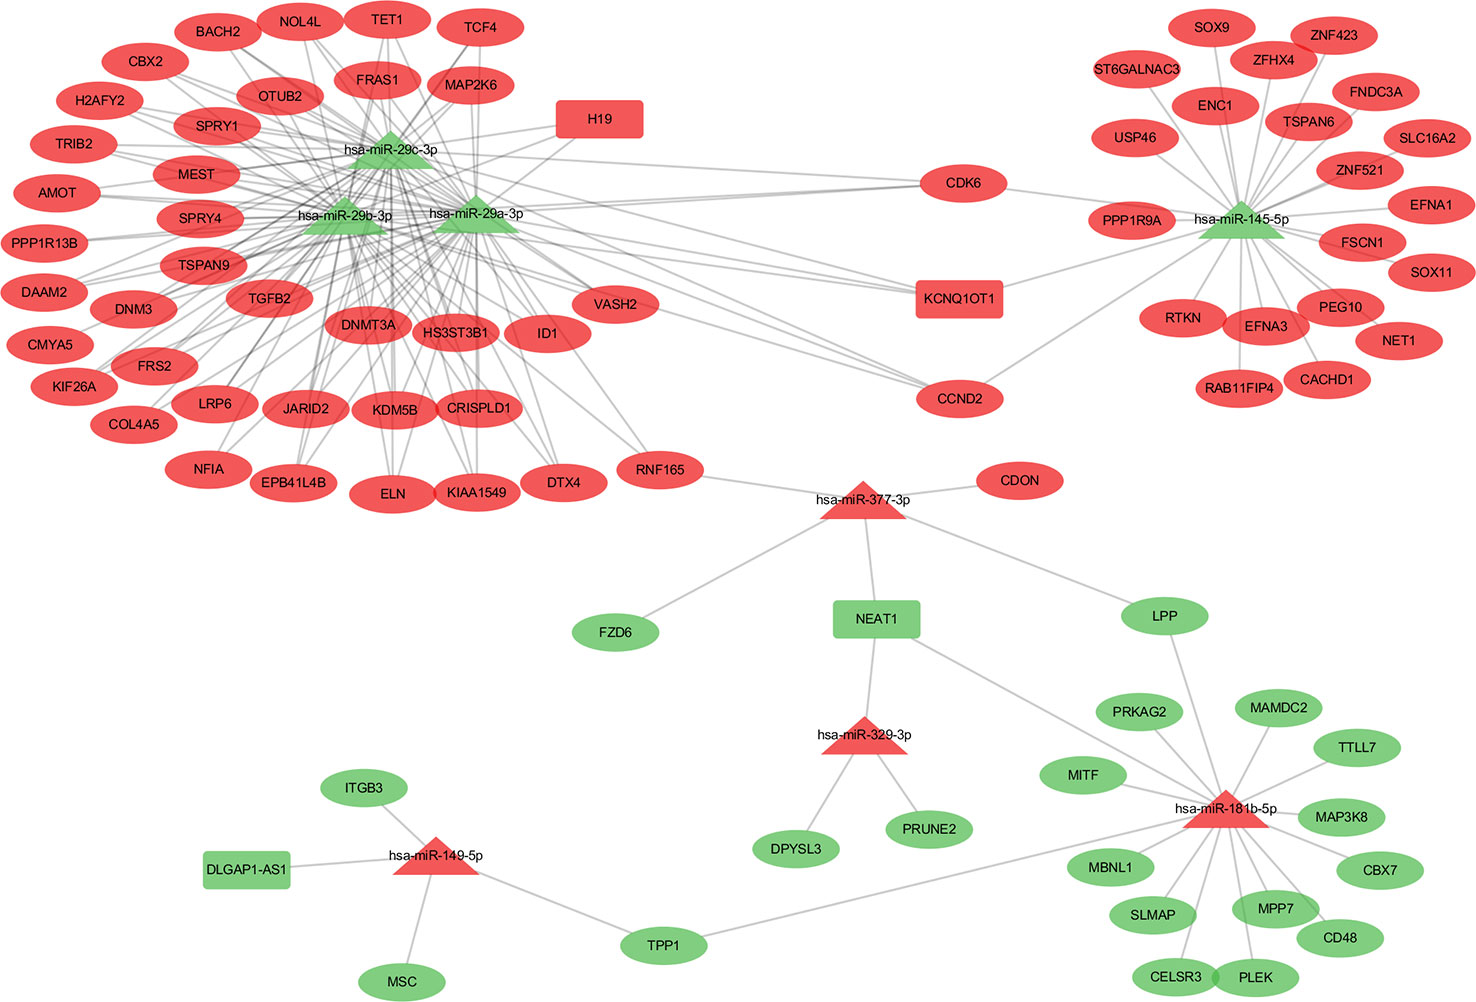
Figure 4 The competing endogenous RNA (ceRNA) network constructed from differentially expressed genes. The different shapes represent different gene types: the rectangle is lncRNA, the triangle is miRNA, and the ellipse is mRNA. Red color indicates a high expression in C2 and green indicates a low expression compared to the C1&C3 clusters.
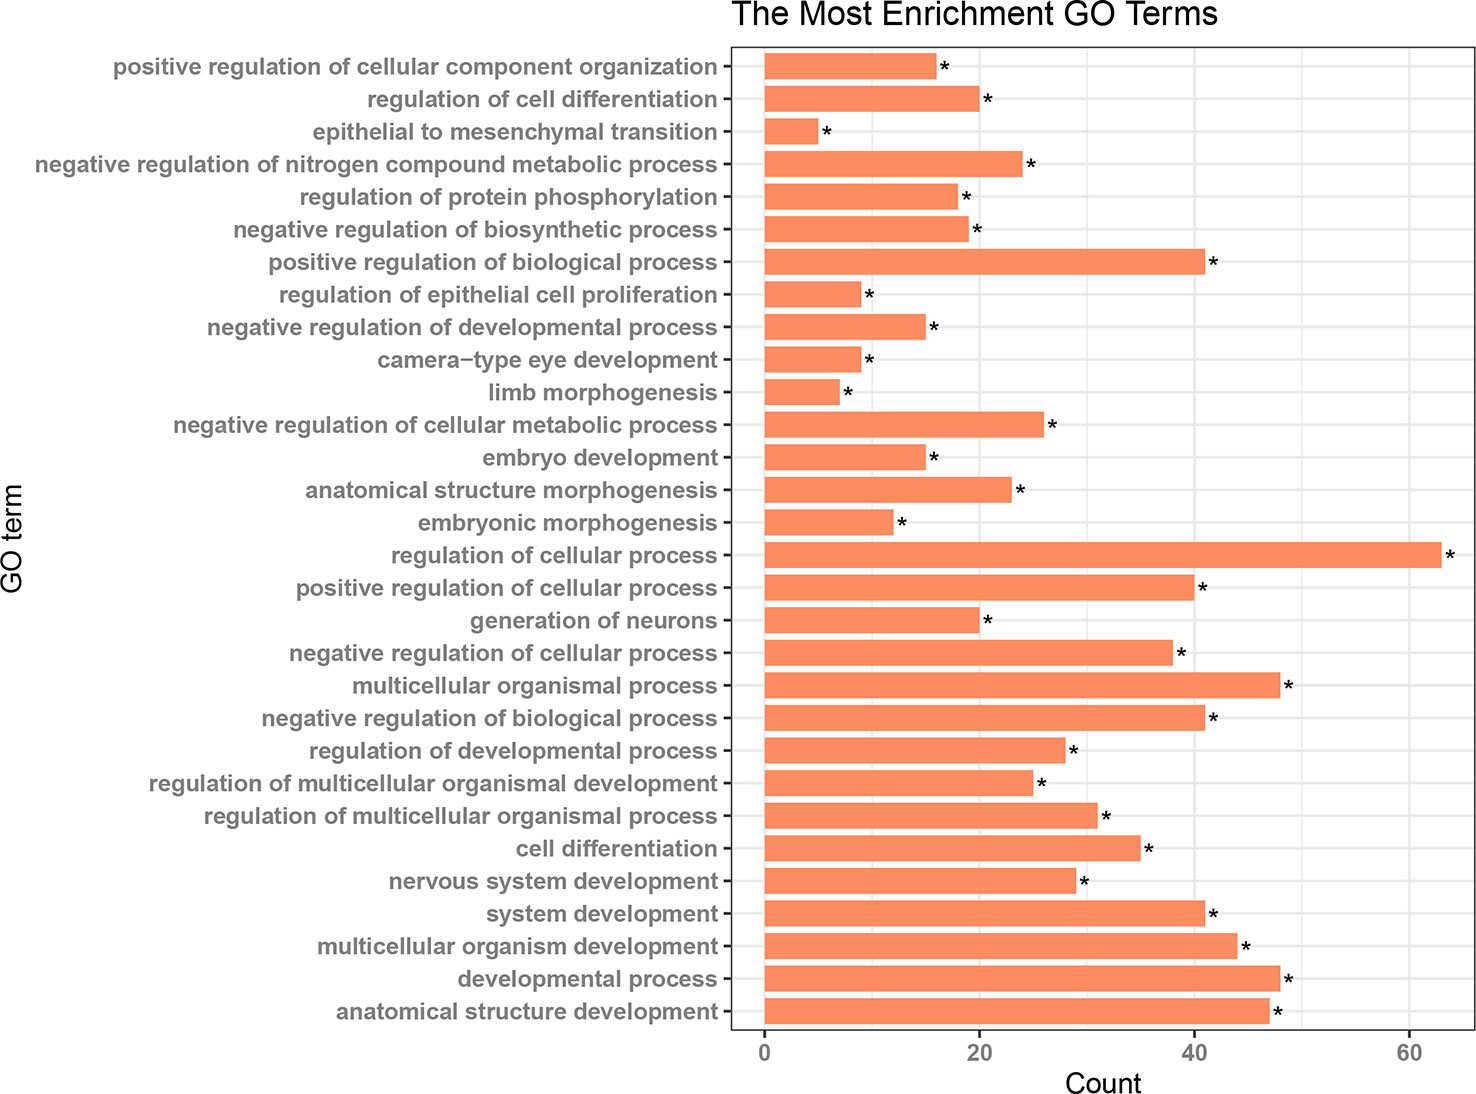
Figure 5 Results of functional enrichment analysis for the nodes in the ceRNA network *p < 0.05.
Hsa-miR-29c-3p Centered Sub-ceRNA Network Showed Survival Significance
The hub network was identified by the extracted competing gene pairs, each component of which showed survival significance (Supplementary Table 3). In the subnetwork, LncRNA KCNQ1OT1 (KCNQ1 opposite strand/antisense transcript 1) and JARID2 (jumonji and AT-rich interaction domain containing 2), CDK6 (cyclin-dependent kinase 6), DNMT3A (DNA methyltransferase 3 alpha), and TET1 (tet methylcytosine dioxygenase 1) competitively bound hsa-miR-29c-3p (Figure 6). KCNQ1OT1 and mRNAs showed significantly higher expression levels in the C2 cluster compared to the C1&C3 clusters (Figure 7A). KCNQ1OT1 was negatively correlated with the expression of has-miR-29c-3p and positively correlated the expression of mRNAs. All the mRNAs were negatively correlated with the expression of hsa-miR-29c-3p (Figure 7B). As for survival significance, high expression of KCNQ1OT1 and mRNAs was associated with worse patient prognosis, whereas high expression of hsa-miR-39c-3p indicated a better prognosis. As a representative of all the mRNAs, higher expression of the first principle of mRNAs indicated a poor prognosis. The risk score calculated from Cox regulation was used to evaluate the survival significance of the whole network. A higher risk score indicated a poorer overall survival (Figure 7C).
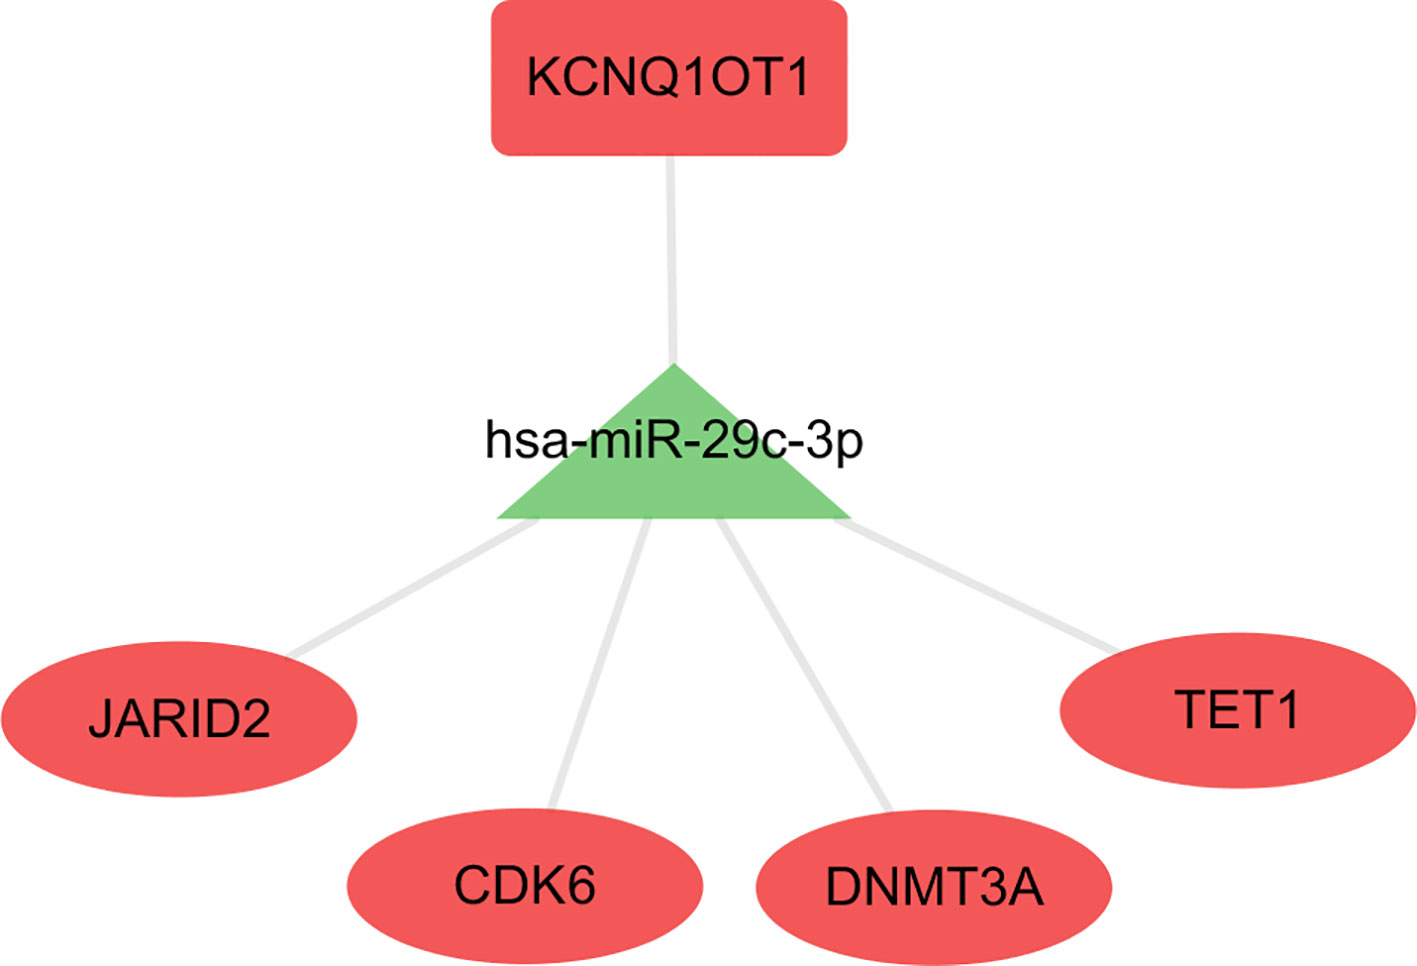
Figure 6 The sub-ceRNA network, in which each node showed survival significance.
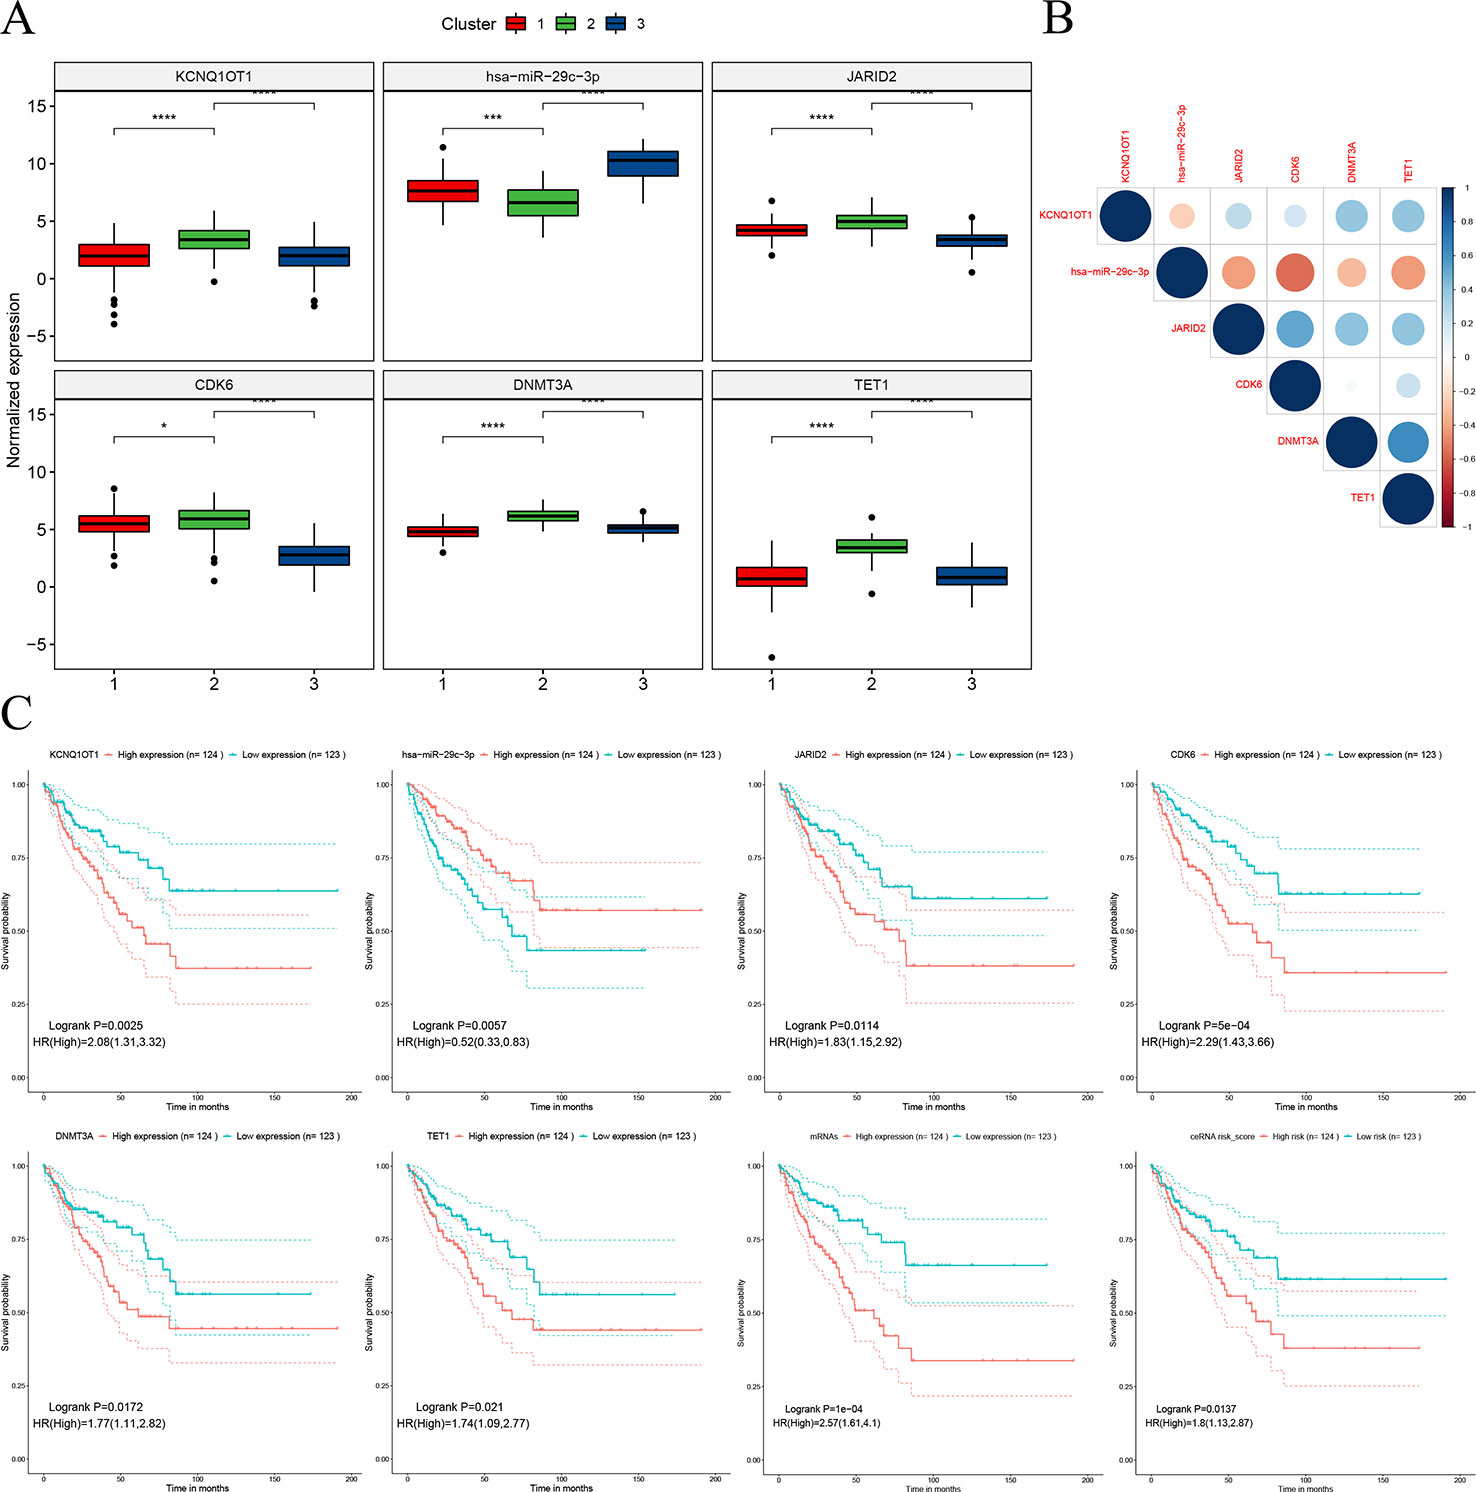
Figure 7 Characteristics of the sub-ceRNA network. (A) Expression of nodes in the sub-clusters. (B) Expression correlation between the nodes. (C) Survival significance of the nodes and the sub-ceRNA network *p < 0.05; ***p < 0.001; ****p < 0.0001.
Discussion
STSs form a rare group of malignancies differing in biology, behavior, and sensitivity to treatment (Sleijfer and Gelderblom, 2014). Although there are up to 50 histological subtypes, treatment for each subtype remains similar. For in situ STSs, surgical resection is the main method, supplemented with radiotherapy (Mehren et al., 2018). For most metastatic STSs, doxorubicin ± ifosfamide is the standard first-line therapy (Ratan and Patel, 2016; Mehren et al., 2018). Unfortunately, patients have a 10%–30% recurrence rate and a 30%–40% distant metastasis rate, even after initial treatment (Frezza et al., 2017). Molecular targeted therapy, targeting tumor-specific genomic changes, can achieve maximum efficacy while minimizing side effects, bringing options to the treatment of STSs. Currently, several drugs targeting vascular endothelial growth factor (VEGF) for STS have entered the clinical trial stage and some of them have shown good clinical effects (Kuenen et al., 2003; Suttle et al., 2004; D’Adamo et al., 2005; Dalal et al., 2005). This is a good start, but because STSs are rare and there are too many histological subtypes, clinical research for STSs is challenging. Most clinical studies are based on one or several specific histological types, so clinical trials are progressing slowly due to the limited number of patients (Sleijfer and Gelderblom, 2014). Genotyping methods based on genomics can classify tumors with similar genomic characteristics into the same category, thus facilitating the screening of molecular targets and the conduct of clinical trials.
Transcriptome regulation is important in the performance of cellular biological functions. CC analysis based on transcriptome data clearly divided the STSs into three sub-clusters, suggesting that the STSs had similar characteristics within the clusters and different characteristics between the clusters at the transcriptome level. Moreover, significant differences in survival were found between the clusters. The prognosis of patients in the C2 cluster was worse and based on a separate survival analysis of the LMS samples in C2 and C3 clusters. We believe that the differences are due to molecular subtypes rather than histological types Supplementary Figure 1. This has also been verified in previous studies on LMS. LMS is significantly different at the genetic level and can be classified into subgroups (Beck et al., 2010; Guo et al., 2015), showing different responses to treatment (Guo et al., 2015).
Tumor-suppressor gene mutation is an important pathogenic mode of tumors. TP53 and RB1 are the most common tumor suppressor gene mutations in STS and both of these mutations cause abnormalities in the cell cycle that lead to cancer (Brohl et al., 2015). In the poor prognosis cluster C2, a significantly lower mutation rate in TP53 and RB1 was observed compared to the C1&C3 clusters. Koehler et al. (2016) reported that TP53 mutations indicated a better response to the VEGF target drug pazopanib and better PFS. The possible mechanism is that wild-type TP53 suppresses angiogenesis by the transcriptional suppression of VEGF expression. The loss of function of TP53 produced significantly more VEGF (Zhang et al., 2000). Moreover, the TP53-VEGF signaling pathway seems to be dependent on the function of RB1 (Farhang Ghahremani et al., 2013). Thus, a loss of function mutation in either TP53 or RB1 will directly contribute to tumor angiogenesis and the potential sensitivity to anti-angiogenic therapy (Koehler et al., 2016). Based on these studies, we hypothesized that anti-angiogenic drugs used in patients in the C1&C3 group might achieve better efficacy than in the C2 group.
CeRNA is a kind of post-transcriptional regulation whereby transcriptions cross-regulate each other by competing for shared miRNAs (Salmena et al., 2011). It may explain disease processes and present opportunities for new therapies (Salmena et al., 2011). In this study, we used the hypothesis of ceRNA to construct a ceRNA network based on the differential genes between C2 and C1&C3, hoping to partially explain the biological characteristics of C2 and provide some potential therapeutic targets for C2. The results of the enrichment analysis of the network nodes indicated that this ceRNA was mainly related to organism development functions. Differences in the tumor tissue progression direction may contribute to differences in overall survival and need to be further analyzed. Moreover, more attention showed to be focused on the sub-networks KCNQ1OT1/hsa-miR-29c-3p/JARID2, CDK6, DNMT3A, and TET1 extracted from the whole network, where each node showed survival significance. The KCNQ1OT1 transcript is the antisense to the KCNQ1 gene and is an unspliced long non-coding RNA. It interacts with chromatin and regulates the transcription of multiple target genes through epigenetic modifications. It was reported to have a role in the regulation of proliferation and cisplatin in tongue cancer (Zhang et al., 2018) and colorectal carcinogenesis (Zhang et al., 2019). Furthermore, the knockdown of KCNQ1OT1 depressed chemoresistance to paclitaxel in lung adenocarcinoma (Ren et al., 2017). Hsa-miR-29c-3p is known as a tumor suppressor gene. The overexpression of hsa-miR-29c-3p reduced cell proliferation and migration in colorectal cancer (Zhang et al., 2017), increased the chemosensitivity of pancreatic cancer cells (Huang et al., 2018), and reduced the cisplatin resistance of non-small cell lung cancer cells (Sun et al., 2018). JARID2 encodes a Jumonji and AT-rich interaction domain (ARID)-domain-containing protein. The encoded protein is a DNA-binding protein that functions as a transcriptional repressor. It was reported to promote the invasion and metastasis of hepatocellular carcinoma by facilitating epithelial-mesenchymal transition through the PTEN/AKT signaling pathways (Lei et al., 2016) and is essential for the maintenance of tumor-initiating cells in bladder cancer (Zhu et al., 2017). The protein encoded by CDK6 is a member of the CMGC family of serine/threonine protein kinases. This kinase is a catalytic subunit of the protein kinase complex that is important for cell cycle G1 phase progression and G1/S transition. CDK6 serves as the target of multiple miRNAs and had demonstrated important roles in tumor growth (Agirre et al., 2009; Lu et al., 2017; Yuan et al., 2017). DNMT3A encodes a DNA methyltransferase that is thought to function in de novo methylation, rather than maintenance methylation, which impacts the expression of p21 and plays a role in determining doxorubicin-induced senescence and apoptosis in HCT116 colorectal cancer cells (Zhang et al., 2011). TET1 encodes a demethylase that belongs to the TET (ten-eleven translocation) family. Members of the TET protein family play a role in the DNA methylation process and gene activation. High expression of TET1 indicates a poor prognosis in cytogenetically normal acute myeloid leukemia (Wang et al., 2018) and promotes cisplatin-resistance in ovarian cancer (Han et al., 2017). As for the competing pairs, miR-29b/c was shown to suppress the downstream gene DNMT3A, and in turn, miR-29b/c was suppressed by DNMT3A in a DNA methylation-dependent manner in gastric cancer (He et al., 2015). In our study, based on the ceRNA hypothesis, tumor-promoting genes, including KCNQ1OT1, JARID2, CDK6, DNMT3A, and TET1, competitively bound the tumor suppressor gene hsa-29c-3p. In that case, targeting nodes of the sub-ceRNA network may also affect the other nodes in the sub-network, inducing corresponding changes in the biological processes. Therefore, this sub-ceRNA network can provide new ideas for C2 treatment.
In conclusion, integrative clustering analysis revealed that STSs could be clustered into three sub-clusters. The ceRNA network, especially the subnetwork LncRNA (KCNQ1OT1)-miRNA (has-miR-29c-3p)–mRNA (JARID2, CDK8, DNMT3A, TET1) represents a promising therapeutic target for treating the STS sub-cluster of patients with a poor prognosis.
Data Availability Statement
All datasets generated for this study are included in the article/Supplementary Material.
Author Contributions
ZZ and DS designed the study. ZZ and ZJ performed the data collection. HZ performed the data analysis. ZZ and MZ drafted the manuscript. All authors read and approved the final version of the manuscript.
Funding
This study was supported by the Special Projects of Health in Jilin Province (3D5148273428) and the Key R&D Program of Guangdong Province (2018B090906001).
Conflict of Interest
The authors declare that the research was conducted in the absence of any commercial or financial relationships that could be construed as a potential conflict of interest.
Supplementary Material
The Supplementary Material for this article can be found online at: https://www.frontiersin.org/articles/10.3389/fgene.2020.00069/full#supplementary-material
Supplementary Figure 1 | The overall survival analysis of different histological types of STSs in the training dataset.
References
Agirre, X., Vilas-Zornoza, A., Jimenez-Velasco, A., Martin-Subero, J. I., Cordeu, L., Garate, L., et al. (2009). Epigenetic silencing of the tumor suppressor microRNA Hsa-miR-124a regulates CDK6 expression and confers a poor prognosis in acute lymphoblastic leukemia. Cancer Res. 69 (10), 4443–4453. doi: 10.1158/0008-5472.CAN-08-4025
Barretina, J., Taylor, B. S., Banerji, S., Ramos, A. H., Lagos-Quintana, M., Decarolis, P. L., et al. (2010). Subtype-specific genomic alterations define new targets for soft-tissue sarcoma therapy. Nat. Genet. 42 (8), 715–721. doi: 10.1038/ng.619
Beck, A. H., Lee, C. H., Witten, D. M., Gleason, B. C., Edris, B., Espinosa, I., et al. (2010). Discovery of molecular subtypes in leiomyosarcoma through integrative molecular profiling. Oncogene 29 (6), 845–854. doi: 10.1038/onc.2009.381
Betel, D., Wilson, M., Gabow, A., Marks, D. S., Sander, C. (2008). The microRNA.org resource: targets and expression. Nucleic Acids Res. 36 (Database issue), D149–D153. doi: 10.1093/nar/gkm995
Brohl, A. S., Shah, H. R., Wang, Y. C., Kasarskis, A., Maki, R. G. (2015). The somatic mutational landscape in soft tissue sarcoma: Early results from TCGA data. J. Clin. Oncol. 33 (15), 10508. doi: 10.1200/jco.2015.33.15_suppl.10508
Casali, P. G., Abecassis, N., Aro, H. T., Bauer, S., Biagini, R., Bielack, S., et al. (2018). Soft tissue and visceral sarcomas: ESMO-EURACAN clinical practice guidelines for diagnosis, treatment and follow-up. Ann. Oncol. 29 (Suppl 4), iv268–iv269. doi: 10.1093/annonc/mdy321
D’Adamo, D. R., Anderson, S. E., Albritton, K., Yamada, J., Riedel, E., Scheu, K., et al. (2005). Phase II study of doxorubicin and bevacizumab for patients with metastatic soft-tissue sarcomas. J. Clin. Oncol. 23 (28), 7135–7142. doi: 10.1200/JCO.2005.16.139
Dalal, S., Berry, A. M., Cullinane, C. J., Mangham, D. C., Grimer, R., Lewis, I. J., et al. (2005). Vascular endothelial growth factor: a therapeutic target for tumors of the Ewing’s sarcoma family. Clin. Cancer Res. 11 (6), 2364–2378. doi: 10.1158/1078-0432.CCR-04-1201
Farhang Ghahremani, M., Goossens, S., Nittner, D., Bisteau, X., Bartunkova, S., Zwolinska, A., et al. (2013). p53 promotes VEGF expression and angiogenesis in the absence of an intact p21-Rb pathway. Cell Death Differ. 20 (7), 888–897. doi: 10.1038/cdd.2013.12
Frezza, A. M., Stacchiotti, S., Gronchi, A. (2017). Systemic treatment in advanced soft tissue sarcoma: what is standard, what is new. BMC Med. 15 (1), 109. doi: 10.1186/s12916-017-0872-y
Gaujoux, R., Seoighe, C. (2010). A flexible R package for nonnegative matrix factorization. BMC Bioinf. 11, 367. doi: 10.1186/1471-2105-11-367
Guo, X., Jo, V. Y., Mills, A. M., Zhu, S. X., Lee, C. H., Espinosa, I., et al. (2015). Clinically relevant molecular subtypes in Leiomyosarcoma. Clin. Cancer Res. 21 (15), 3501–3511. doi: 10.1158/1078-0432.CCR-14-3141
Han, X., Zhou, Y., You, Y., Lu, J., Wang, L., Hou, H., et al. (2017). TET1 promotes cisplatin-resistance via demethylating the vimentin promoter in ovarian cancer. Cell Biol. Int. 41 (4), 405–414. doi: 10.1002/cbin.10734
He, C., Ling, W., Pihai, G., Chengcheng, Z., Shaodan, Z., Kun, Z., et al. (2015). Deregulation between miR-29b/c and DNMT3A is associated with epigenetic silencing of the CDH1 Gene, affecting cell migration and invasion in gastric cancer. PloS One 10 (4), e0123926. doi: 10.1371/journal.pone.0123926
Huang, L., Hu, C., Cao, H., Wu, X., Wang, R., Lu, H., et al. (2018). MicroRNA-29c increases the chemosensitivity of pancreatic cancer cells by inhibiting USP22 mediated autophagy. Cell. Physiol. Biochem. 47 (2), 747–758. doi: 10.1159/000490027
Kehlen, A., Greither, T., Wach, S., Nolte, E., Kappler, M., Bache, M., et al. (2014). High coexpression of CCL2 and CX3CL1 is gender-specifically associated with good prognosis in soft tissue sarcoma patients. Int. J. Cancer 135 (9), 2096–2106. doi: 10.1002/ijc.28867
Koehler, K., Liebner, D., Chen, J. L. (2016). TP53 mutational status is predictive of pazopanib response in advanced sarcomas. Ann. Oncol. 27 (3), 539–543. doi: 10.1093/annonc/mdv598
Kuenen, B. C., Tabernero, J., Baselga, J., Cavalli, F., Pfanner, E., Conte, P. F., et al. (2003). Efficacy and toxicity of the angiogenesis inhibitor SU5416 as a single agent in patients with advanced renal cell carcinoma, melanoma, and soft tissue sarcoma. Clin. Cancer Res. 9 (5), 1648–1655. doi: 10.1093/carcin/bgg047
Lehmann, B. D., Bauer, J. A., Chen, X., Sanders, M. E., Chakravarthy, A. B., Shyr, Y., et al. (2011). Identification of human triple-negative breast cancer subtypes and preclinical models for selection of targeted therapies. J. Clin. Invest. 121 (7), 2750–2767. doi: 10.1172/JCI45014
Lei, X., Xu, J. F., Chang, R. M., Fang, F., Zuo, C. H., Yang, L. Y. (2016). JARID2 promotes invasion and metastasis of hepatocellular carcinoma by facilitating epithelial-mesenchymal transition through PTEN/AKT signaling. Oncotarget 7 (26), 40266–40284. doi: 10.18632/oncotarget.9733
Li, J. H., Liu, S., Zhou, H., Qu, L. H., Yang, J. H. (2014). starBase v2.0: decoding miRNA-ceRNA, miRNA-ncRNA and protein-RNA interaction networks from large-scale CLIP-Seq data. Nucleic Acids Res. 42 (Database issue), D92–D97. doi: 10.1093/nar/gkt1248
Li, Y., Zhang, W., Li, S., Tu, C. (2016). Prognosis value of Hypoxia-inducible factor-1alpha expression in patients with bone and soft tissue sarcoma: a meta-analysis. Springerplus 5 (1), 1370. doi: 10.1186/s40064-016-3064-x
Linch, M., Miah, A. B., Thway, K., Judson, I. R., Benson, C. (2014). Systemic treatment of soft-tissue sarcoma-gold standard and novel therapies. Nat. Rev. Clin. Oncol. 11 (4), 187–202. doi: 10.1038/nrclinonc.2014.26
Lu, S., Wang, M. S., Chen, P. J., Ren, Q., Bai, P. (2017). miRNA-186 inhibits prostate cancer cell proliferation and tumor growth by targeting YY1 and CDK6. Exp. Ther. Med. 13 (6), 3309–3314. doi: 10.3892/etm.2017.4387
Mehren, M. V., Randall, R. L., Benjamin, R. S., Boles, S., Scavone, J. L. (2018). Soft tissue sarcoma, Version 2.2018, NCCN clinical practice guidelines in oncology. J. Natl. Compr. Cancer Netw. Jnccn 16 (5), 536–563. doi: 10.6004/jnccn.2018.0025
Monti, S., Tamayo, P., Mesirov, J., Golub, T. (2003). Consensus clustering: a resampling-based method for class discovery and visualization of gene expression microarray data. Mach. Learn. 52 (1-2), 91–118. doi: 10.1023/A:1023949509487
Ratan, R., Patel, S. R. (2016). Chemotherapy for soft tissue sarcoma. Cancer 122 (19), 2952–2960. doi: 10.1002/cncr.30191
Ren, K., Xu, R., Huang, J., Zhao, J., Shi, W. (2017). Knockdown of long non-coding RNA KCNQ1OT1 depressed chemoresistance to paclitaxel in lung adenocarcinoma. Cancer Chemother. Pharmacol. 80 (2), 243–250. doi: 10.1007/s00280-017-3356-z
Ritchie, M. E., Phipson, B., Wu, D., Hu, Y., Law, C. W., Shi, W., et al. (2015). limma powers differential expression analyses for RNA-sequencing and microarray studies. Nucleic Acids Res. 43 (7), e47. doi: 10.1093/nar/gkv007
Rousseeuw, P. J. (1987). Silhouettes: a graphical aid to the interpretation and validation of cluster analysis. JCoAM. 20, 53–65. doi: 10.1016/0377-0427(87)90125-7
Salmena, L., Poliseno, L., Tay, Y., Kats, L., Pandolfi, P. P. (2011). A ceRNA hypothesis: the Rosetta Stone of a hidden RNA language? Cell 146 (3), 353–358. doi: 10.1016/j.cell.2011.07.014
Sleijfer, S., Gelderblom, H. (2014). Current clinical trials for advanced osteosarcoma and soft tissue sarcoma. Curr. Opin. Oncol. 26 (4), 434–439. doi: 10.1097/CCO.0000000000000093
Smyth, G. K. (2005). “Limma: linear models for microarray data,” in Bioinformatics and computational biology solutions using R and Bioconductor, vol. 397-420. (New York: Springer). doi: 10.1007/0-387-29362-0_23
Sun, D. M., Tang, B. F., Li, Z. X., Guo, H. B., Cheng, J. L., Song, P. P., et al. (2018). MiR-29c reduces the cisplatin resistance of non-small cell lung cancer cells by negatively regulating the PI3K/Akt pathway. Sci. Rep. 8 (1), 8007. doi: 10.1038/s41598-018-26381-w
Suttle, A. B., Hurwitz, H., Dowlati, A., Fernando, N., Savage, S., Coviello, K., et al. (2004). Pharmacokinetics (PK) and tolerability of GW786034, a VEGFR tyrosine kinase inhibitor, after daily oral administration to patients with solid tumors. J. Clin. Oncol. 22 (14), 208s–208s. doi: 10.1200/jco.2004.22.90140.3054
Szklarczyk, D., Gable, A. L., Lyon, D., Junge, A., Wyder, S., Huerta-Cepas, J., et al. (2019). STRING v11: protein-protein association networks with increased coverage, supporting functional discovery in genome-wide experimental datasets. Nucleic Acids Res. 47 (D1), D607–D613. doi: 10.1093/nar/gky1131
Verhaak, R. G., Hoadley, K. A., Purdom, E., Wang, V., Qi, Y., Wilkerson, M. D., et al. (2010). Integrated genomic analysis identifies clinically relevant subtypes of glioblastoma characterized by abnormalities in PDGFRA, IDH1, EGFR, and NF1. Cancer Cell 17 (1), 98–110. doi: 10.1016/j.ccr.2009.12.020
Wang, B., Mezlini, A. M., Demir, F., Fiume, M., Tu, Z., Brudno, M., et al. (2014). Similarity network fusion for aggregating data types on a genomic scale. Nat. Methods 11 (3), 333–337. doi: 10.1038/nmeth.2810
Wang, J., Li, F., Ma, Z., Yu, M., Guo, Q., Huang, J., et al. (2018). High expression of TET1 predicts poor survival in cytogenetically normal acute myeloid leukemia from two cohorts. EBioMedicine 28 (C), 90–96. doi: 10.1016/j.ebiom.2018.01.031
Wang, P., Li, X., Gao, Y., Guo, Q., Ning, S., Zhang, Y., et al. (2019). LnCeVar: a comprehensive database of genomic variations that disturb ceRNA network regulation. Nucleic Acids Res. 48 (D1), D111–D117. doi: 10.1093/nar/gkz887
Xu, T., Le, T. D., Liu, L., Su, N., Wang, R., Sun, B., et al. (2017). CancerSubtypes: an R/Bioconductor package for molecular cancer subtype identification, validation and visualization. Bioinformatics 33 (19), 3131–3133. doi: 10.1093/bioinformatics/btx378
Yuan, W., Wang, D., Liu, Y., Tian, D., Wang, Y., Zhang, R., et al. (2017). miR494 inhibits cell proliferation and metastasis via targeting of CDK6 in osteosarcoma. Mol. Med. Rep. 16 (6), 8627–8634. doi: 10.3892/mmr.2017.7709
Zhang, L., Yu, D., Hu, M., Xiong, S., Lang, A., Ellis, L. M., et al. (2000). Wild-type p53 suppresses angiogenesis in human leiomyosarcoma and synovial sarcoma by transcriptional suppression of vascular endothelial growth factor expression. Cancer Res. 60 (13), 3655–3661. doi: 10.1046/j.1523-5394.2000.84005.x
Zhang, Y., Gao, Y. Y., Zhang, G. P., Huang, S. Y., Dong, Z. X., Kong, C. F., et al. (2011). DNMT3a plays a role in switches between doxorubicin-induced senescence and apoptosis of colorectal cancer cells. Int. J. Cancer 128 (3), 551–561. doi: 10.1002/ijc.25365
Zhang, S., Jin, J., Tian, X., Wu, L. (2017). hsa-miR-29c-3p regulates biological function of colorectal cancer by targeting SPARC. Oncotarget 8 (61), 104508–104524. doi: 10.18632/oncotarget.22356
Zhang, S., Ma, H., Zhang, D., Xie, S., Wang, W., Li, Q., et al. (2018). LncRNA KCNQ1OT1 regulates proliferation and cisplatin resistance in tongue cancer via miR-211-5p mediated Ezrin/Fak/Src signaling. Cell Death Dis. 9 (7), 742. doi: 10.1038/s41419-018-0793-5
Zhang, K., Yan, J., Yi, B., Rui, Y., Hu, H. (2019). High KCNQ1OT1 expression might independently predict shorter survival of colon adenocarcinoma. Future Oncol. 15 (10), 1085–1095. doi: 10.2217/fon-2018-0499
Keywords: soft tissue sarcoma, integration, subtype, consensus clustering, prognosis
Citation: Zhu Z, Jin Z, Zhang H, Zhang M and Sun D (2020) Integrative Clustering Reveals a Novel Subtype of Soft Tissue Sarcoma With Poor Prognosis. Front. Genet. 11:69. doi: 10.3389/fgene.2020.00069
Received: 19 September 2019; Accepted: 21 January 2020;
Published: 17 February 2020.
Edited by:
Alfredo Pulvirenti, University of Catania, ItalyReviewed by:
Shaoli Das, National Institutes of Health (NIH), United StatesSuman Ghosal, National Institutes of Health (NIH), United States
Copyright © 2020 Zhu, Jin, Zhang, Zhang and Sun. This is an open-access article distributed under the terms of the Creative Commons Attribution License (CC BY). The use, distribution or reproduction in other forums is permitted, provided the original author(s) and the copyright owner(s) are credited and that the original publication in this journal is cited, in accordance with accepted academic practice. No use, distribution or reproduction is permitted which does not comply with these terms.
*Correspondence: Mei Zhang, zhangmei@jlu.edu.cn; Dahui Sun, sundahui1971@sina.com