 Mohammad Ali Nazari1
 Navid Ghavi Hossein-Zadeh
- 1Department of Animal Science, Faculty of Agricultural Sciences, University of Guilan, Rasht, Iran
- 2Animal Breeding Center and Promotion of Animal Products, Karaj, Iran
This study aimed to estimate heritabilities and genetic trends for different persistency measures for milk fat yield and their genetic correlations with 270-day milk yield in Iranian buffaloes. The records of test-day milk fat yield belonging to the first three lactations of buffaloes within 523 herds consisting of 43,818 records were got from the Animal Breeding Center and Promotion of Animal Products of Iran from 1996 to 2012. To fit the lactation curves based on a random regression test-day model, different orders of Legendre polynomial (LP) functions were selected. Three persistency measures were altered according to the specific condition of the lactation curve in buffaloes: (1) The average of estimated breeding values (EBVs) for test day fat yield from day 226 to day 270 as a deviation from the average of EBVs from day 44 to day 62 (PM1), (2) A summation of contribution for each day from day 53 to day 247 as a deviation from day 248 (PM2), and (3) The difference between EBVs for day 257 and day 80 (PM3). The estimates of heritability for PM1, PM2, and PM3 ranged from 0.20 to 0.48, from 0.36 to 0.47, and from 0.19 to 0.35 over the first three lactations, respectively. The estimate of genetic trends for different persistency measures of milk fat yield was not significant over the lactations (P > 0.05). Genetic correlation estimates between various measures of persistency were generally high over the first three lactations. Also, genetic correlations estimates between persistency measures and 270-day milk yield were mostly low and varied from 0.00 to 0.24 (between PM1 and 270-day milk yield), from −0.19 to 0.13 (between PM2 and 270-day milk yield), and from −0.02 to 0.00 (between PM1 and 270-day milk yield) over the first three lactations, respectively. Persistency measures that showed low genetic correlations with milk fat yield were considered the most suitable measures in selection schemes. Besides, medium to high heritability estimates for different persistency measures for milk fat yield indicated that relevant genetic variations detected for these characters could be regarded in outlining later genetic improvement programs of Iranian buffaloes.
Introduction
One important step for reaching self-sufficiency in any country is to identify the productive potential of native breeds of animals. The great adaptability of native animals to harsh conditions such as high environmental humidity and temperature, irregular rainfall, the incidence of different diseases, weak management practices, and low quality of feeds causes native buffaloes of Iran to play an important role in supplying milk and meat as major protein sources. Currently, many Asian countries depend mainly on buffalo as a source of milk and dairy products, especially in rural areas (Safari et al., 2018).
One of the main factors in determining the total milk production over a lactation period is persistency (Muir, 2004). Persistency is defined as the potential of an animal to maintain milk yield at a high extent after reaching the peak of production. The other definition of persistency is the gradual decrease of daily milk production after reaching the peak of the lactation curve (Togashi and Lin, 2004). The major cause for the worth of buffaloes with more persistent curves is that they can relatively satisfy most parts of their nutrient requirements from roughages (Sölkner and Fuchs, 1987). Therefore, not only metabolic problems, reproduction disorders, and diseases are lower in cows with more persistent lactations, but also production costs would be lower (Dekkers et al., 1998). Determining the method of measuring persistency is a critical point in estimating genetic progress for this trait. However, no general agreement is existent on the most appropriate method to describe the persistency of lactation (Cole and VanRaden, 2006). Various measures were suggested for calculating persistency (Gengler, 1996): measures based on the functions describing persistency; measures based on a fraction of total yield, peak yield, or parts of lactation; and those based on the breeding value of animals derived from analyzing random regression models.
The method used for defining persistency measures would determine the genetic parameter estimates for these measures and their genetic relationship with milk production (Swalve and Gengler, 1999; Jakobsen et al., 2002; Khorshidie et al., 2012). A measure of persistency must have two characteristics: association with lactation curve flatness, and independent explanation from production level. The latter item implies that the genetic correlation between milk yield and persistency measures to be decreased because milk production explains some genetic variance of persistency measures under study (Muir, 2004; Cole and VanRaden, 2006; Khorshidie et al., 2012). The independence of these two traits causes genetic selection for persistency of lactation and total yield to avoid unfavorable consequences of peak yield stress in high-yielding cows. Also, the incidence of metabolic diseases and reproductive disorders would be minimized while high milk production is maintained (Elmaghraby, 2012; Ghavi Hossein-Zadeh et al., 2017).
Previous studies carried out on dairy cattle indicated that lactation persistency positively correlated with favorable reproductive performance and health status (Jakobsen et al., 2002; Muir, 2004). Such favorable correlations along with the positive economic value for persistency would support including lactation persistency in the genetic improvement programs of cattle and buffalo (Dekkers et al., 1998; Khorshidie et al., 2012; Ghavi Hossein-Zadeh et al., 2017).
The random regression models enable fitting random genetic and environmental effects at different stages of lactation, which results in higher accuracy of estimated breeding values (EBVs) compared with other statistical models (Li et al., 2020). These models provide insights about the temporal variation of biological processes and physiological implications underlying the studied traits. Therefore, random regression models generate relevant information to be exploited in breeding programs (Oliveira et al., 2019). The functions generally used to model the lactation curve include Wood’s model (Wood, 1967), Wilmink’s function (Wilmink, 1987), spline function (White et al., 1999), and Legendre polynomial (LP) function (Kirkpatrick et al., 1990). Because of variations in production environments and management systems, optimal functions for test-day models in various countries may be different (Mrode et al., 2003). But several studies have indicated that LPs performed well in random regression test-day models (Li et al., 2020).
Milk constituents can be used as a simple indicator of the nutritional status of the lactating animals. Because of the dilution effect, milk fat percentage shows the opposite direction of the lactation curve for milk yield (Eicher, 2004; Ghavi Hossein-Zadeh, 2016), but fat yield follows a variation trend similar to milk yield over the lactation. When trying to apply milk composition as a nutritional evaluation tool, these fluctuations should be noticed. Although several researchers have studied the genetic analysis of the persistency for milk yield and components in dairy cattle (Cole and Null, 2009; Khorshidie et al., 2012; Canaza-Cayo et al., 2015), limited studies have been performed to estimate genetic parameters of persistency for milk production traits in buffaloes (Ghavi Hossein-Zadeh et al., 2017). Therefore, the objective of the present study was to estimate the heritability and genetic trend of distinct persistency measures for milk fat yield and their genetic correlations with 270-day milk yield in Iranian buffaloes using random regression test-day models.
Materials and Methods
Data
Records of test-day milk fat yield belonging to the first three lactations of Iranian native buffaloes in 523 herds consisting of 43,818 records were provided by the Animal Breeding Center and Promotion of Animal Products of Iran during 1996–2012. According to climatic conditions, Iranian native buffaloes can be grouped into three main classes: Azari ecotype, Kuhzestani ecotype, and Mazandarani or North ecotype (Ghavi Hossein-Zadeh et al., 2012). Borghese (2005) and Ghavi Hossein-Zadeh (2015a, b) described the overall management practices and population structure of buffaloes in Iran. Outliers that appeared to deviate markedly from other observations in the original data set were discarded. Therefore, the subsequent analyses included only production records corresponding to the first three lactations in which days in milk (DIM) were between 5 and 270. Calving ages ranged between 24–60, 39–76, and 54–100 months for the first, second, and third lactations, respectively. The total number of test-day records per animal was from 4 to 9. Summary statistics of the edited data set are presented in Table 1. The number of animals, sires, and dams in the pedigree of Iranian buffaloes was 42,285, 549, and 6,376, respectively.
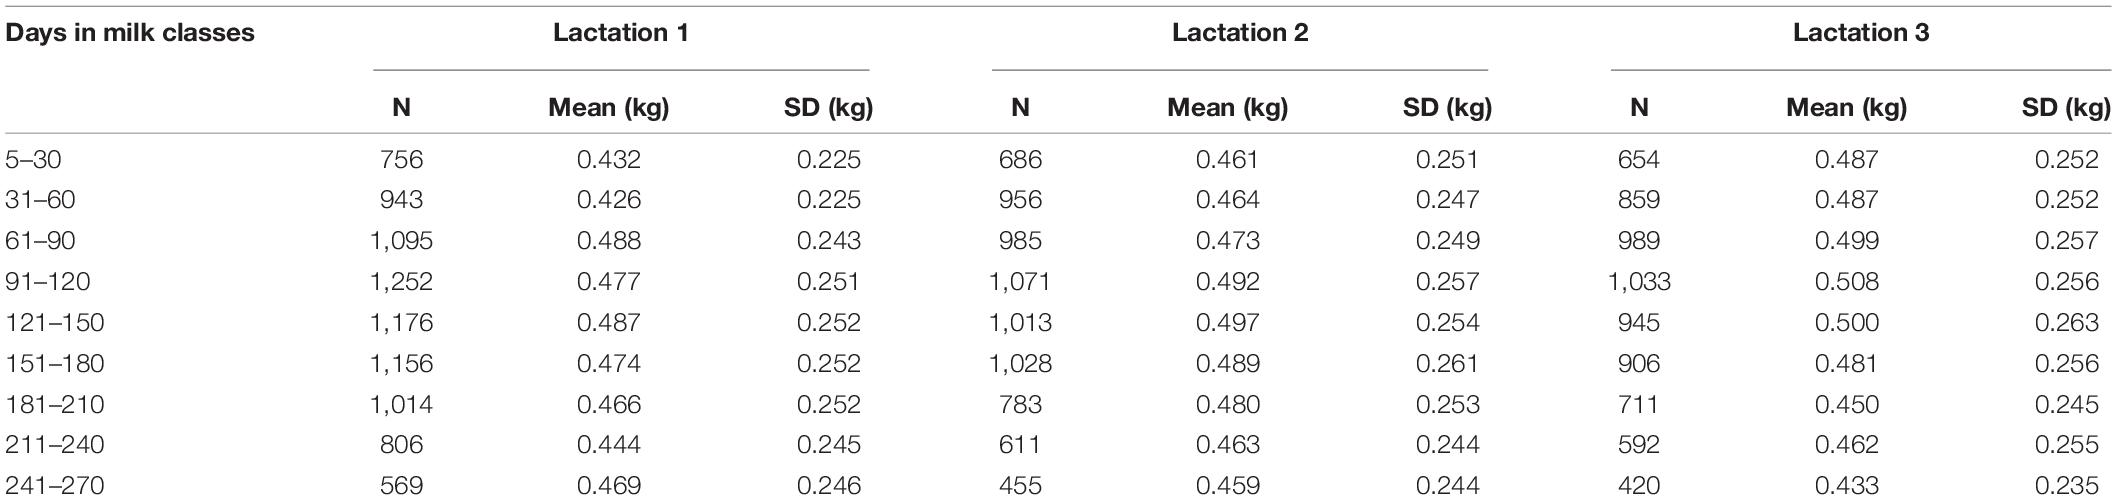
Table 1. Summary statistics of edited milk fat yield data used in this study.
Statistical and Genetic Analysis
Legendre polynomial functions were chosen to fit the lactation curves in the framework of a random regression test-day model for estimating (co)variance components. Model specification and the choice of fixed effects to be included in the model were based on the backward elimination method and variables which were significant at P < 0.05 were considered in the model. To obtain the appropriate random regression test-day model for the genetic analysis of test day fat yield, with the minimum number of parameters, different orders of fit for random regression coefficients of additive genetic and permanent environmental effects were evaluated. Also, the optimum set of polynomials was selected according to the logarithm of the likelihood function at the point of conversion and the total number of parameters to be estimated. The difference of these models was based on the LPs applied to fit the covariance functions for additive genetic and permanent environmental effects. The maximum logarithm likelihood of the models was compared and models with the lowest values of this criterion were selected for further analysis. Test day records were analyzed using the following random regression model:
Where,
Yijmnptv : test day record i obtained at DIM t of cow p calved at the nth age in herd-test date m,
Gi : fixed effect of ith breed or ecotype,
YSj : fixed effect of jth calving year-season,
HTDm: fixed effect of mth herd-test date,
cf: the fth fixed regression coefficient for calving age,
agen: the nth calving age,
k: the order of fit for fixed regression coefficients (k = 2),
βr: the rth fixed regression coefficient,
ka: the order of fit for additive genetic random regression coefficients,
kp: the order of fit for permanent environmental random regression coefficients,
αpr: the rth random regression coefficient of additive genetic value for pth cow,
γpr: the rth random regression coefficient of permanent environmental effect for pth cow,
∅r(dimt): the rth coefficient of LPs evaluated at days in milk t,
eijmnptv: the random residual error.
All random regression analyses were conducted using the Average Information Restricted Maximum Likelihood (AIREML) algorithm of the WOMBAT program (Meyer, 2006).
Lactation Persistency Measures
The following measures were used to describe lactation persistency in this study. These measures were modified based on the lactation curve conditions of buffaloes and adapted for 270 days lactation period:
1. The average of EBVs for test day fat yield from day 226 to day 270 as a deviation from the average of EBVs from day 44 to day 62 [adapted from Kistemaker (2003)]:
2. A summation of contribution for each day from day 53 to day 247 as a deviation from day 248 [adapted from Cobuci et al. (2007) and Jakobsen et al. (2002)]:
3. The difference between EBVs for day 257 and day 80 [adapted from Cobuci et al. (2004, 2007)]:
Small absolute values of the abovementioned measures indicate a high lactation persistency. If was a (ka×1) vector of the estimates of additive genetic random regression coefficients specific to the animal i, and Zt was a (ka×1) vector of LP coefficients evaluated at day t, the EBV of animal i for day t was calculated as follows:
Therefore, the EBV of animal i for 270-day production was obtained by summing the EBVs from day 5 to day 270:
Where, Zc270 is a vector of the summations of LPs corresponding to total lactation yield. In addition to the 270-day yield, we could estimate a Z_c corresponding to each persistency measures used in the current study as follows:
For the first lactation fat yield:
For second lactation fat yield:
For third lactation fat yield:
Estimation of Genetic Parameters and Genetic Trends
The following formulas were applied to estimate additive genetic, permanent environmental and residual variances and heritabilities for different measures of persistency for fat yield and 270-day milk yield:
Where, Ka and Kpe are matrices of direct additive genetic and permanent environmental (co)variances of random regression coefficients, , , , and are the additive genetic, permanent environmental, phenotypic variances, and heritability estimate for ith persistency measure and , , , and are the additive genetic, permanent environmental, phenotypic variances, and heritability estimate for 270-day milk yield, respectively. is a constant residual variance estimated for each day of lactation and , , , and are residual variances for persistency measures PM1, PM2, PM3, and 270-day milk yield, respectively. Also, phenotypic variances were obtained by summing the genetic, permanent environmental, and residual variances for different persistency measures and milk yield. Estimates of genetic correlations among persistency measures and with 270-day milk yield were obtained as follows:
Where, σa(pi,pj), σa (pi,EBV270MY), Ra(pi,pj), and Ra(pi,EBV270MY) are genetic covariances and correlations between persistency measures and 270-day milk yield, respectively. Estimates of genetic trends for persistency measures were obtained by regressing the average EBVs on the calving year of animals.
Results
The orders of fit for different random regression test-day models of milk fat production are given in Table 2. The maximum log-likelihood values of test-day models 1, 10, and 10 differed significantly (P < 0.05) from the other models for fat yield in the first three lactations, respectively. Thus, models 1, 10, and 10 were chosen to fit the additive genetic and permanent environmental effects for the analysis of fat production in the first three lactations of buffaloes, respectively.
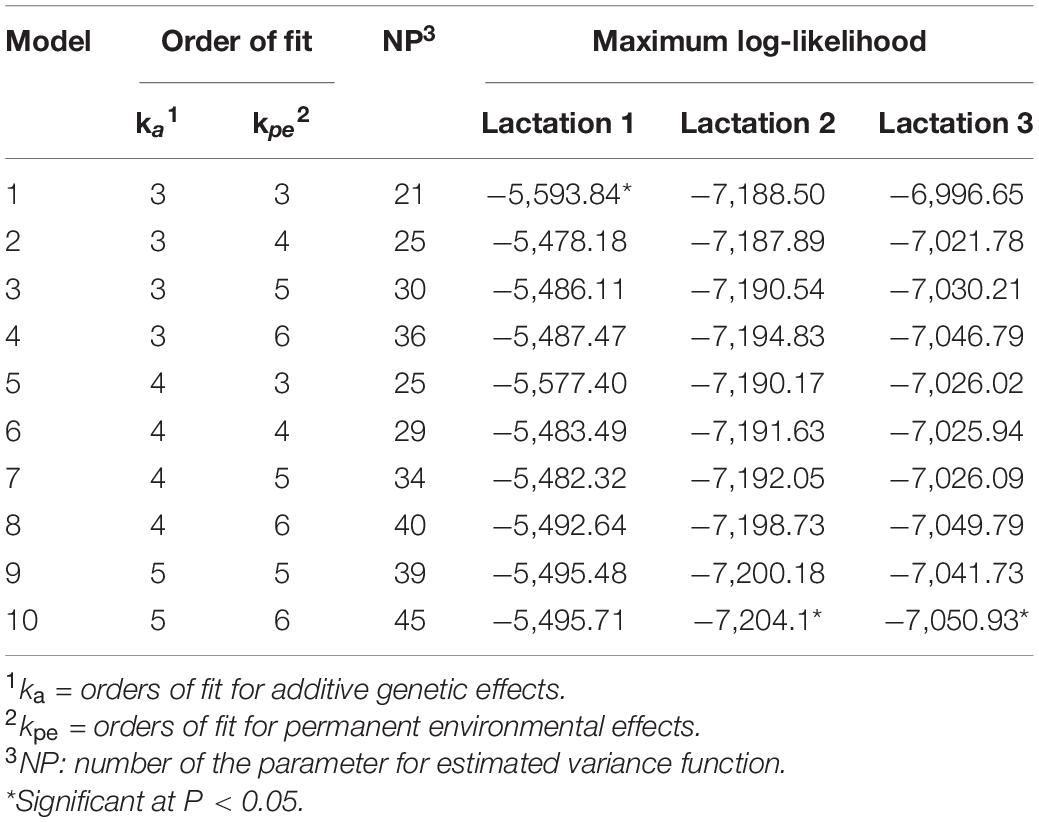
Table 2. Orders of fit for different random regression test-day models of milk fat yield evaluated in this study.
Heritability estimates of persistency measures for fat production and estimates of genetic correlation among distinct fat yield persistency measures with each other and with 270-day milk production in Iranian buffaloes are presented in Table 3. Heritability estimates for PM1, PM2, and PM3 ranged between 0.20–0.48, 0.36–0.47, and 0.19–0.35 for the first, second, and third lactations, respectively. In general, heritability estimates fluctuated largely among lactations and persistency measures. The highest estimate of heritability was observed for PM1 in the third lactation (0.48), while the lowest one was recorded for PM3 also in the third lactation.

Table 3. Heritability estimates of different persistency measures for milk fat yield and genetic correlations among distinct fat yield persistency measures with each other and with 270-day milk production in Iranian buffaloes.
Genetic correlation estimates among various measures of persistency were generally high and ranged from 0.98 to 0.99 (between PM1 and PM2), from −0.98 to −0.87 (between PM1 and PM3), and from −0.99 to −0.95 (between PM2 and PM3) over the first three lactations, respectively. Also, genetic correlation estimates between persistency measures and milk yield were mostly low and varied from 0.00 to 0.24 (between PM1 and 270-day milk yield), from −0.19 to 0.13 (between PM2 and 270-day milk yield), and from −0.02 to 0.00 (between PM3 and 270-day milk yield) across the first three lactations, respectively (Table 3).
Variation of milk yield and milk fat yield across the first three lactations of Iranian buffaloes are depicted in Figures 1, 2. The trend of observed milk yield and milk fat yield for all lactations increased from day 5 of lactation to a peak several weeks later, declining thereafter until day 270. Genetic trends of persistency measures for milk fat yield are illustrated in Table 4. In general, all estimates are very low and not significant (P > 0.05). Therefore, they would not be considered different from zero. Changes in EBVs of buffaloes for three persistency measures of milk fat yield according to calving year and lactations are illustrated in Figures 3–5. In general, irregular fluctuations were observed in the annual mean predicted breeding values of animals for different persistency measures across the first three lactations.
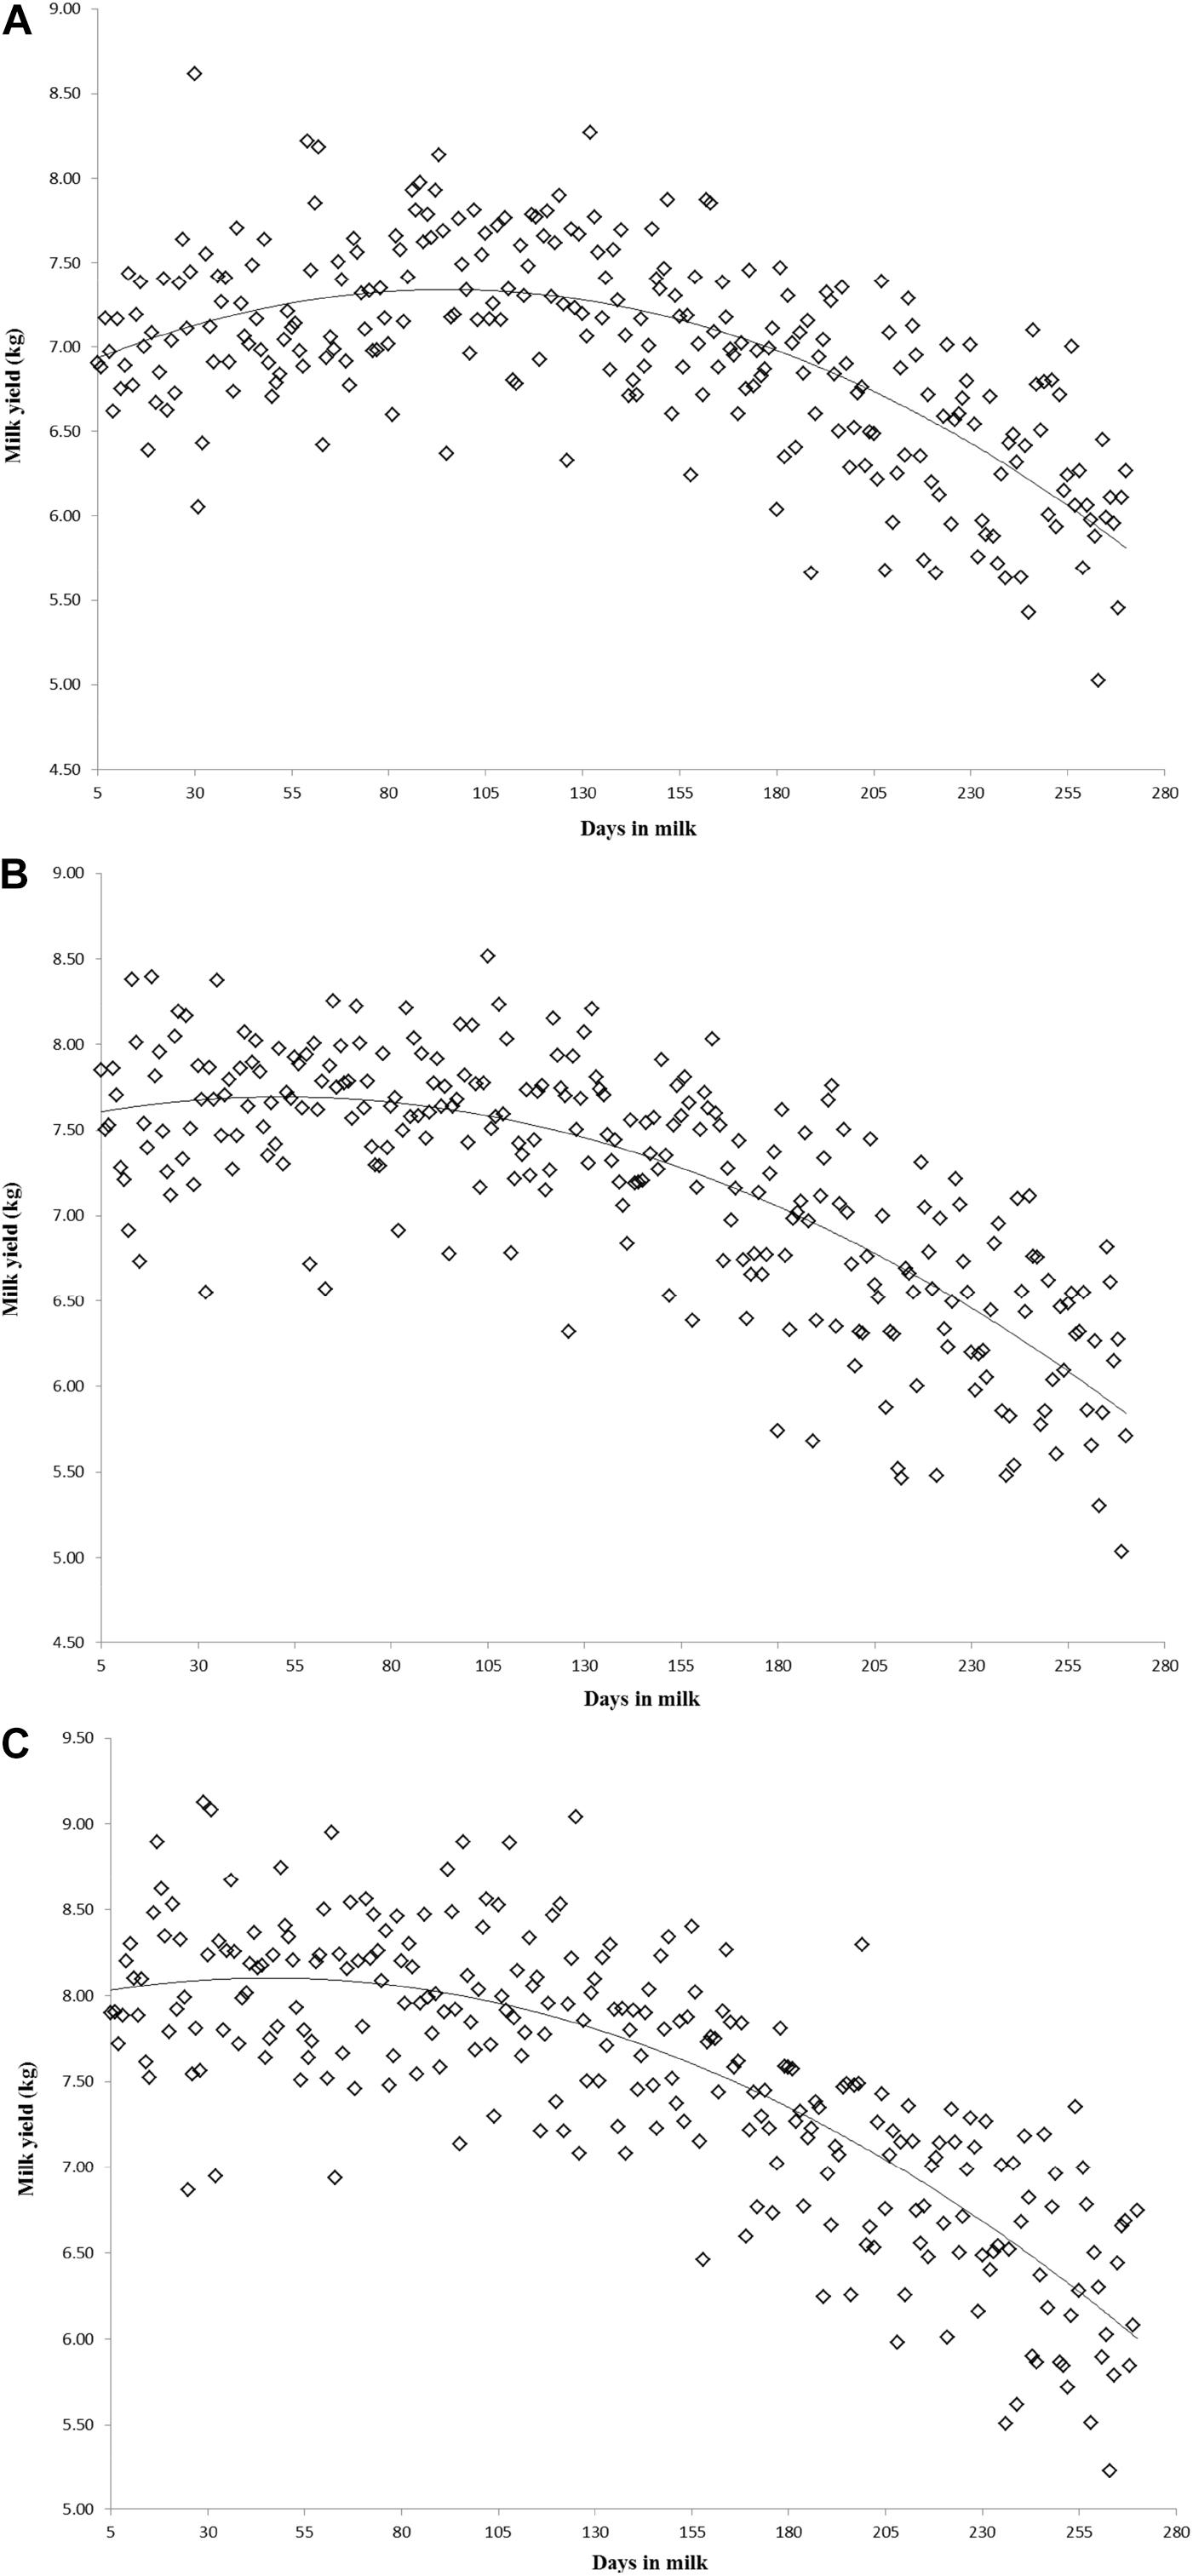
Figure 1. Variation of milk yield across the first (A), second (B), and third (C) lactations in Iranian buffaloes.
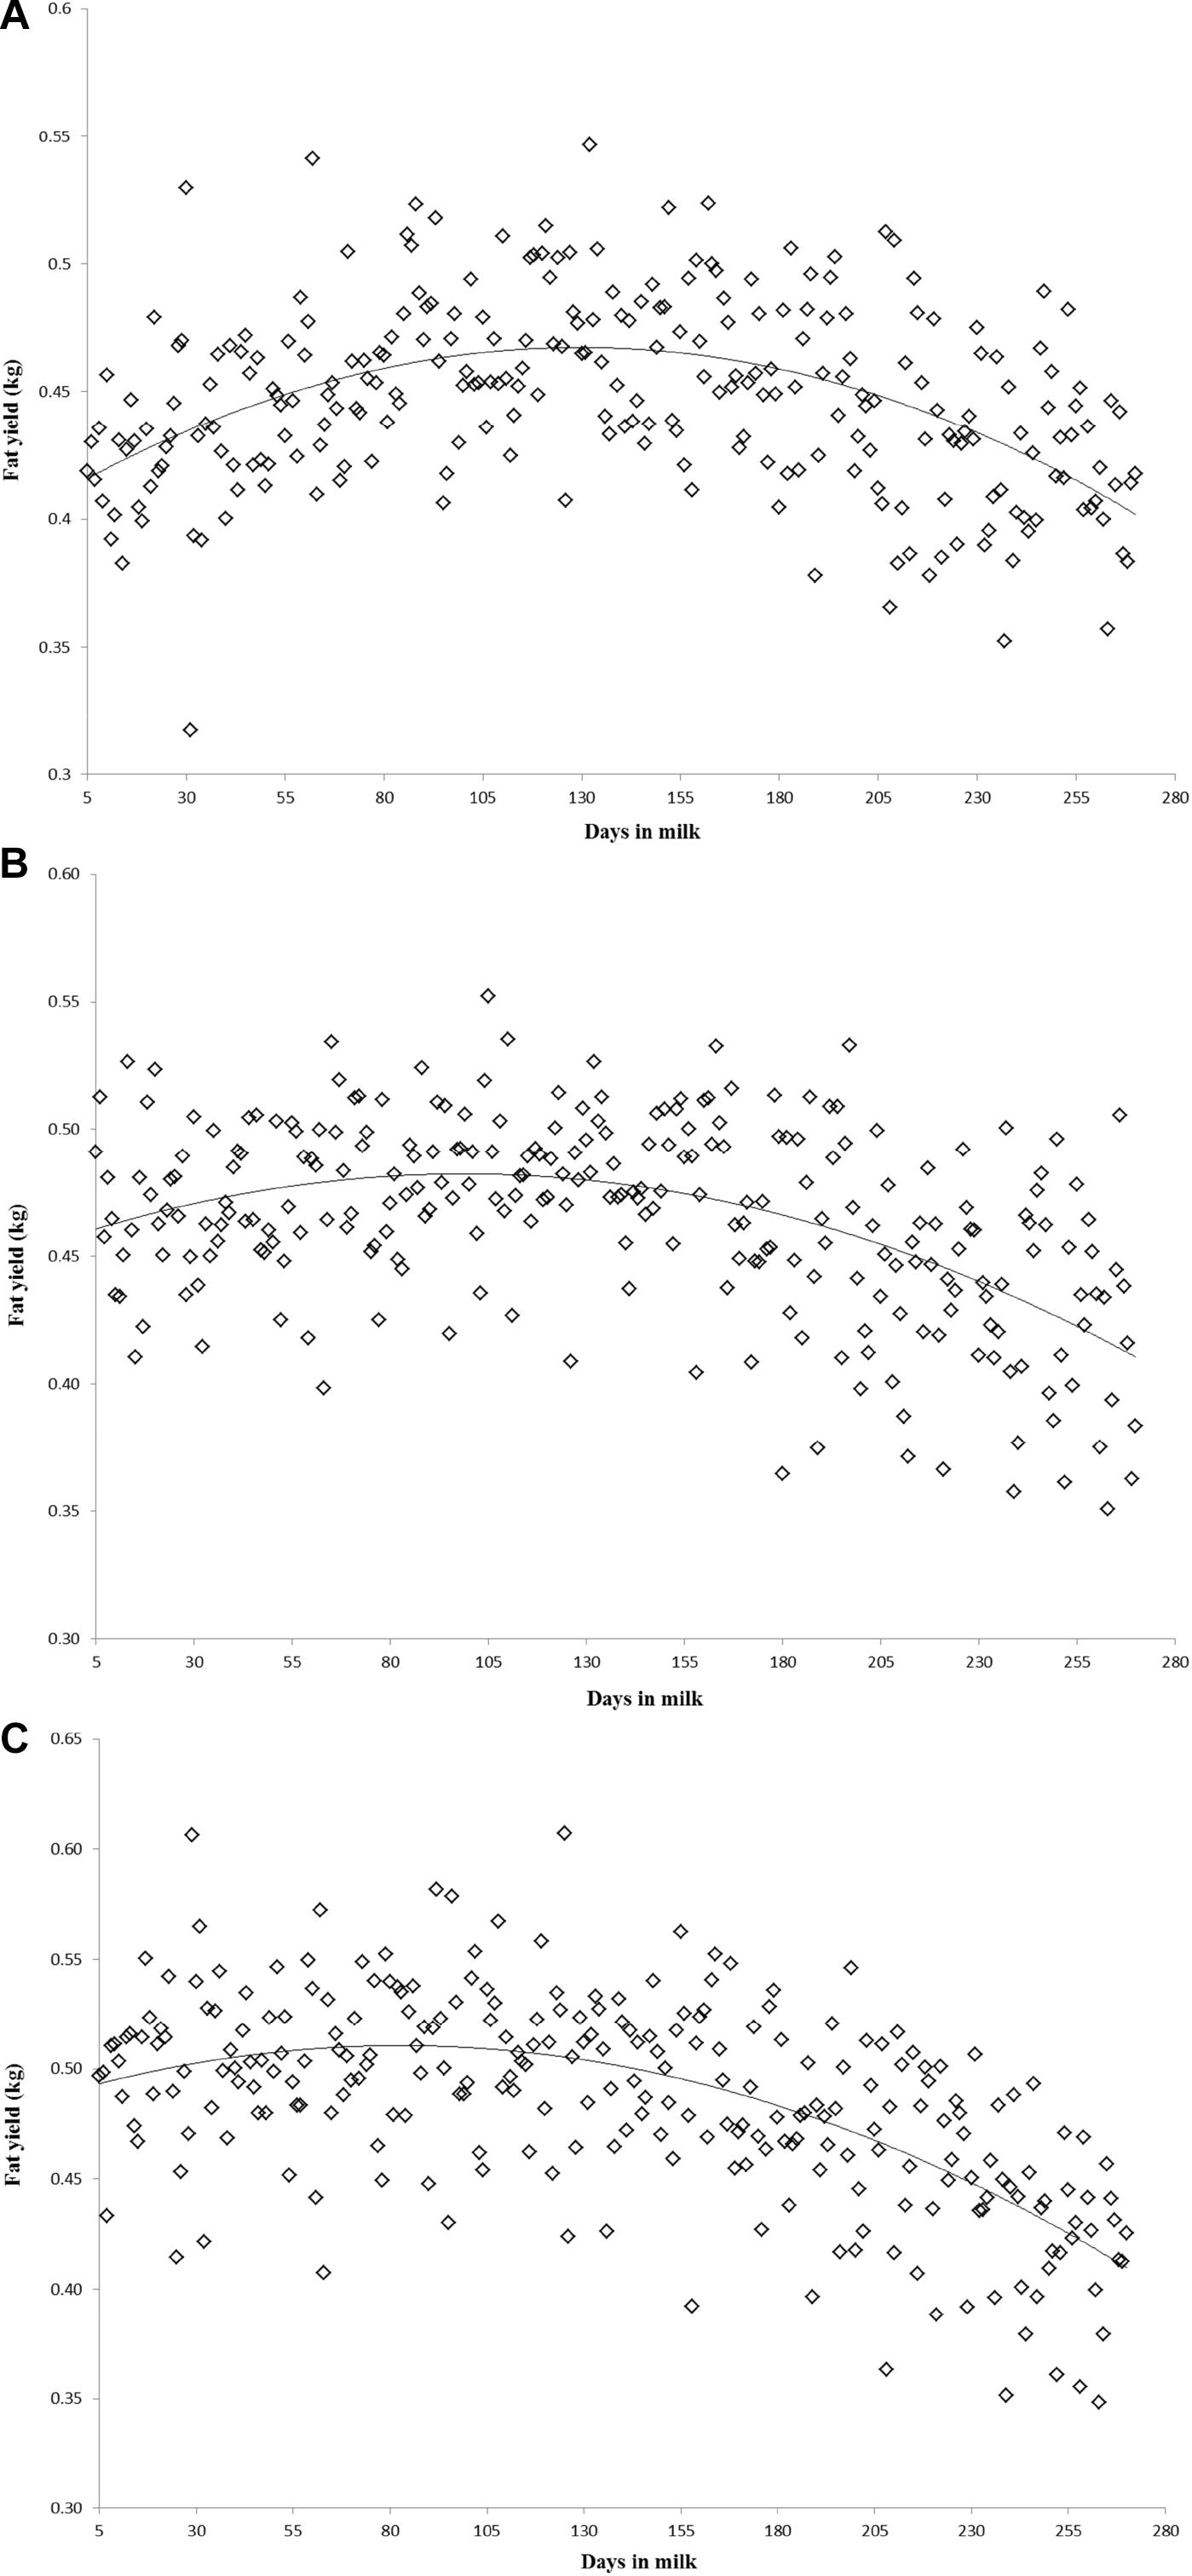
Figure 2. Variation of milk fat yield across the first (A), second (B), and third (C) lactations in Iranian buffaloes.
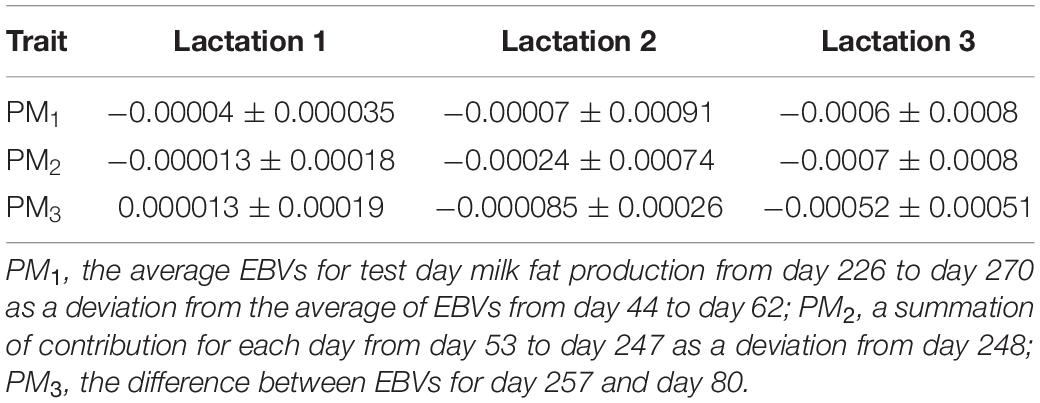
Table 4. Estimates of genetic trends for various persistency measures of fat production in buffaloes.
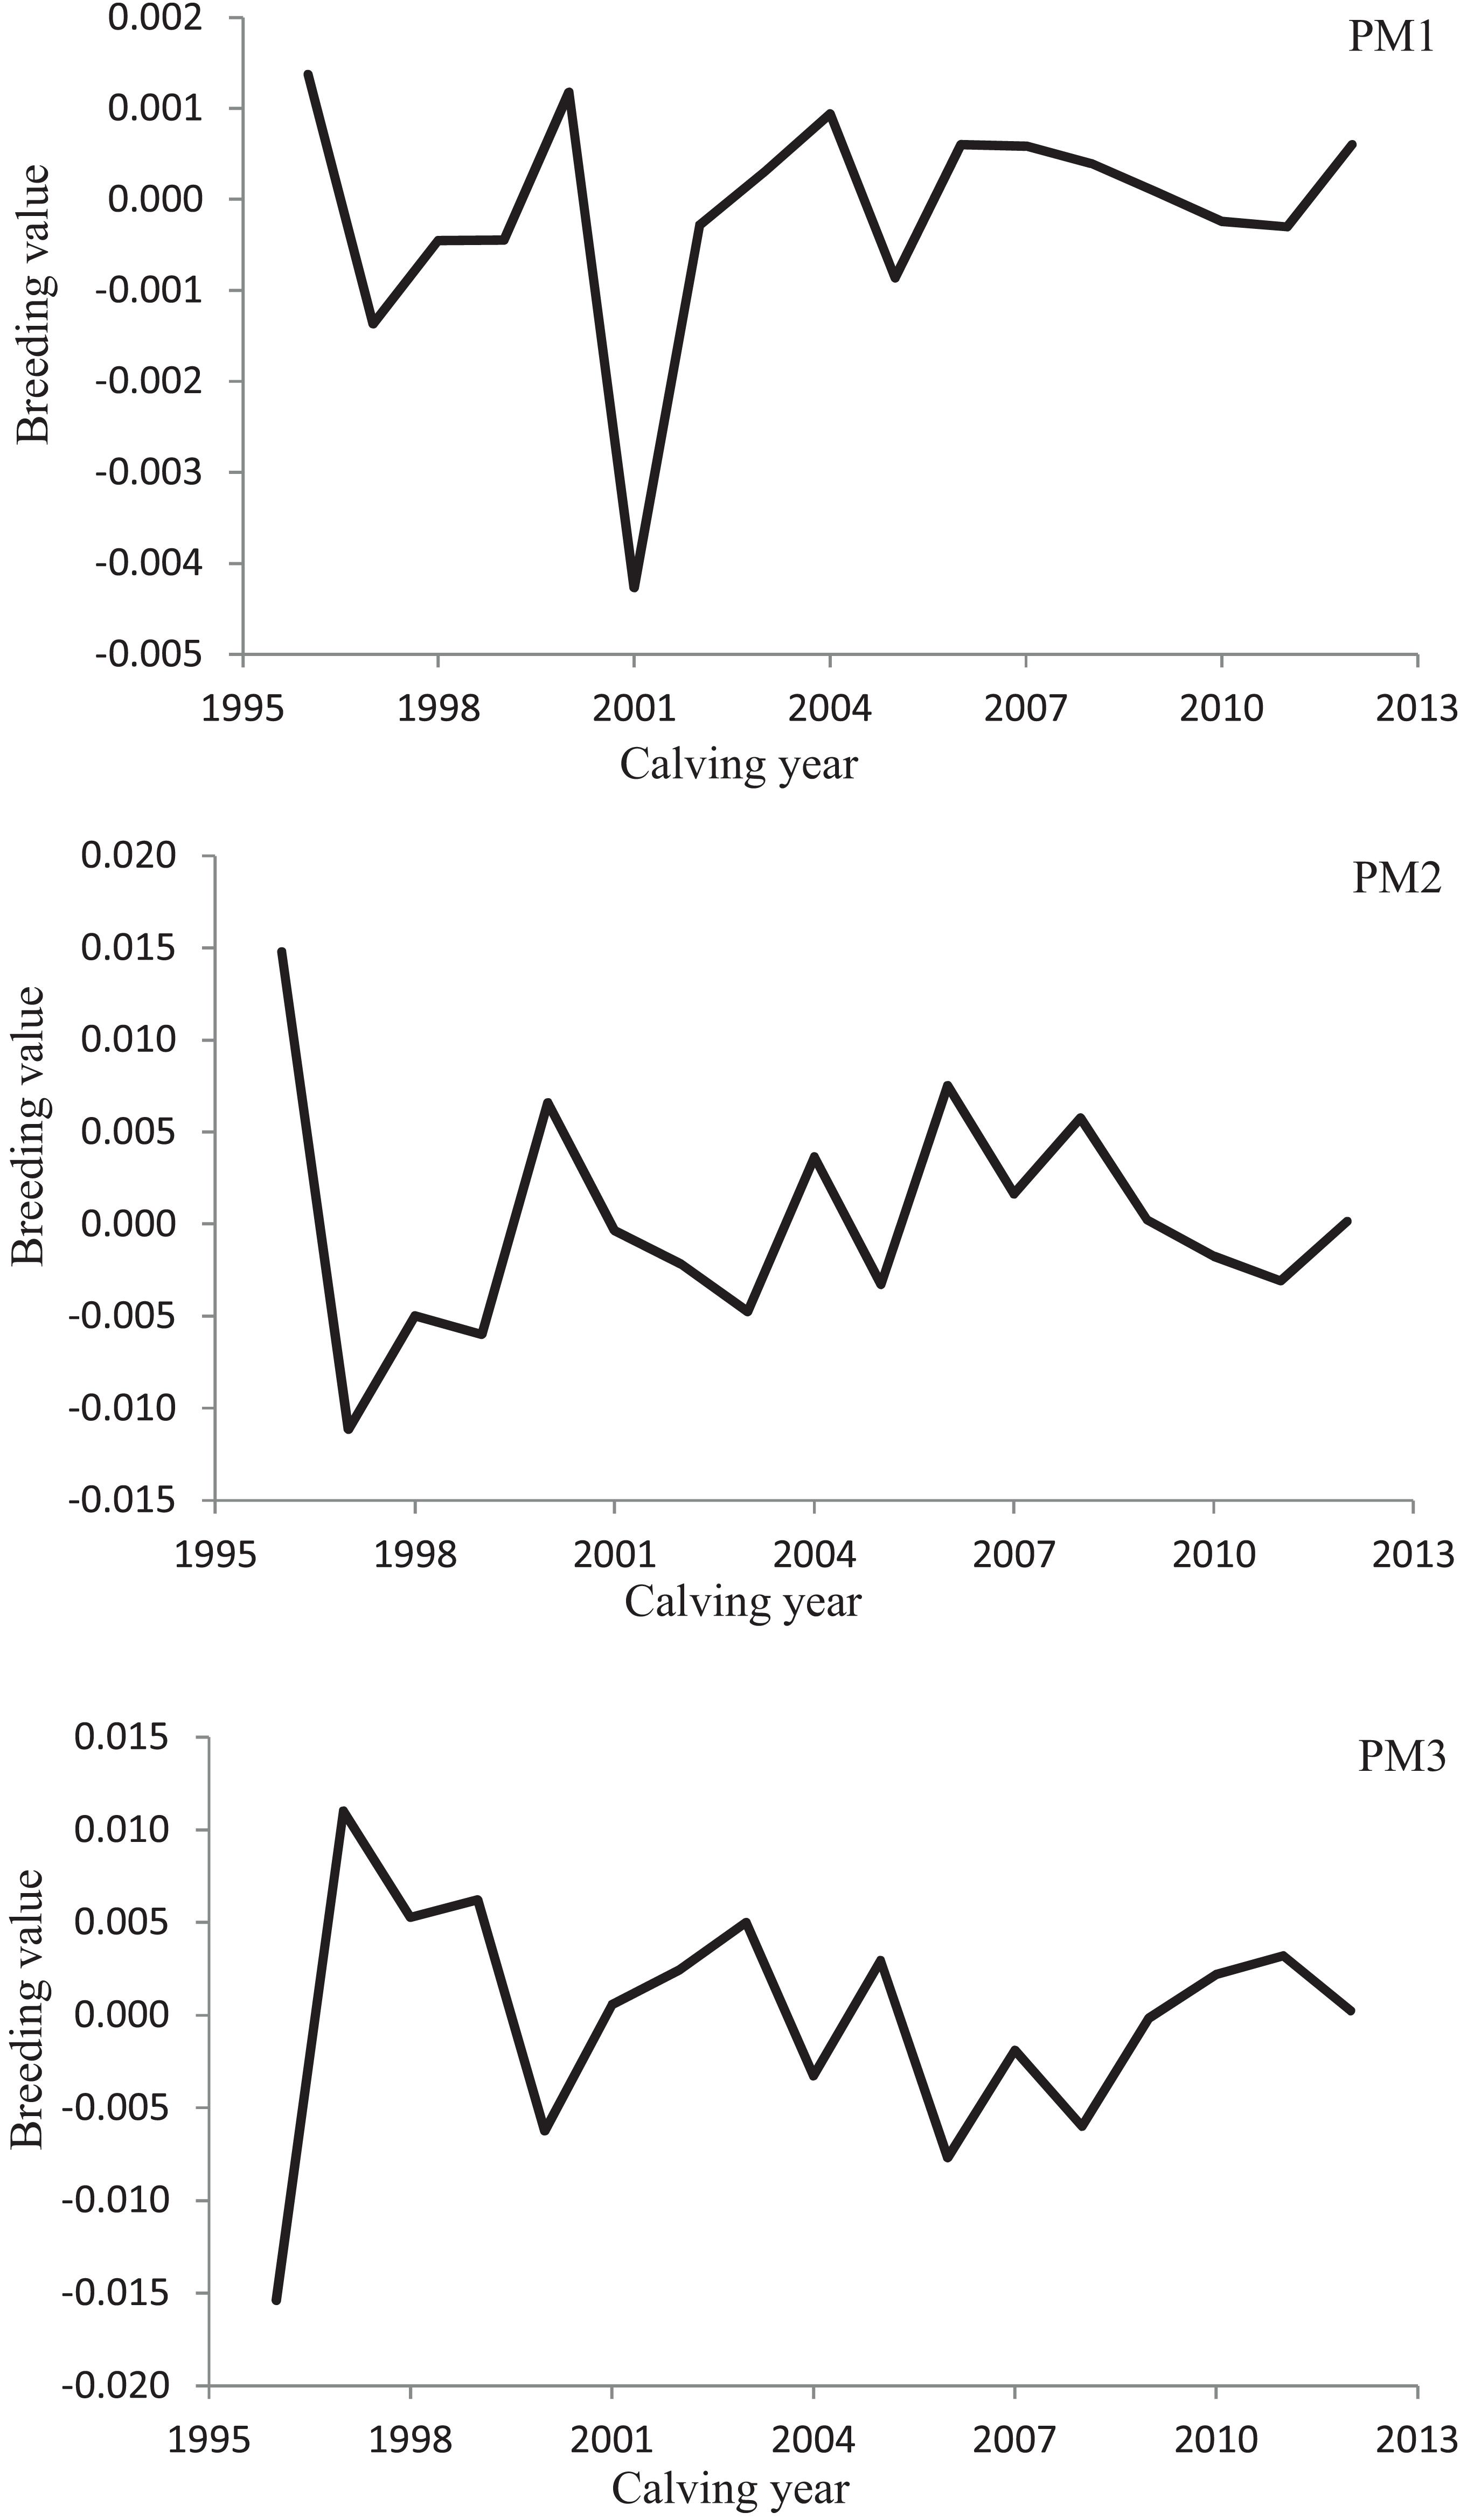
Figure 3. Variation in estimated breeding values of animals for persistency measures of milk fat yield according to calving year in the first lactation.
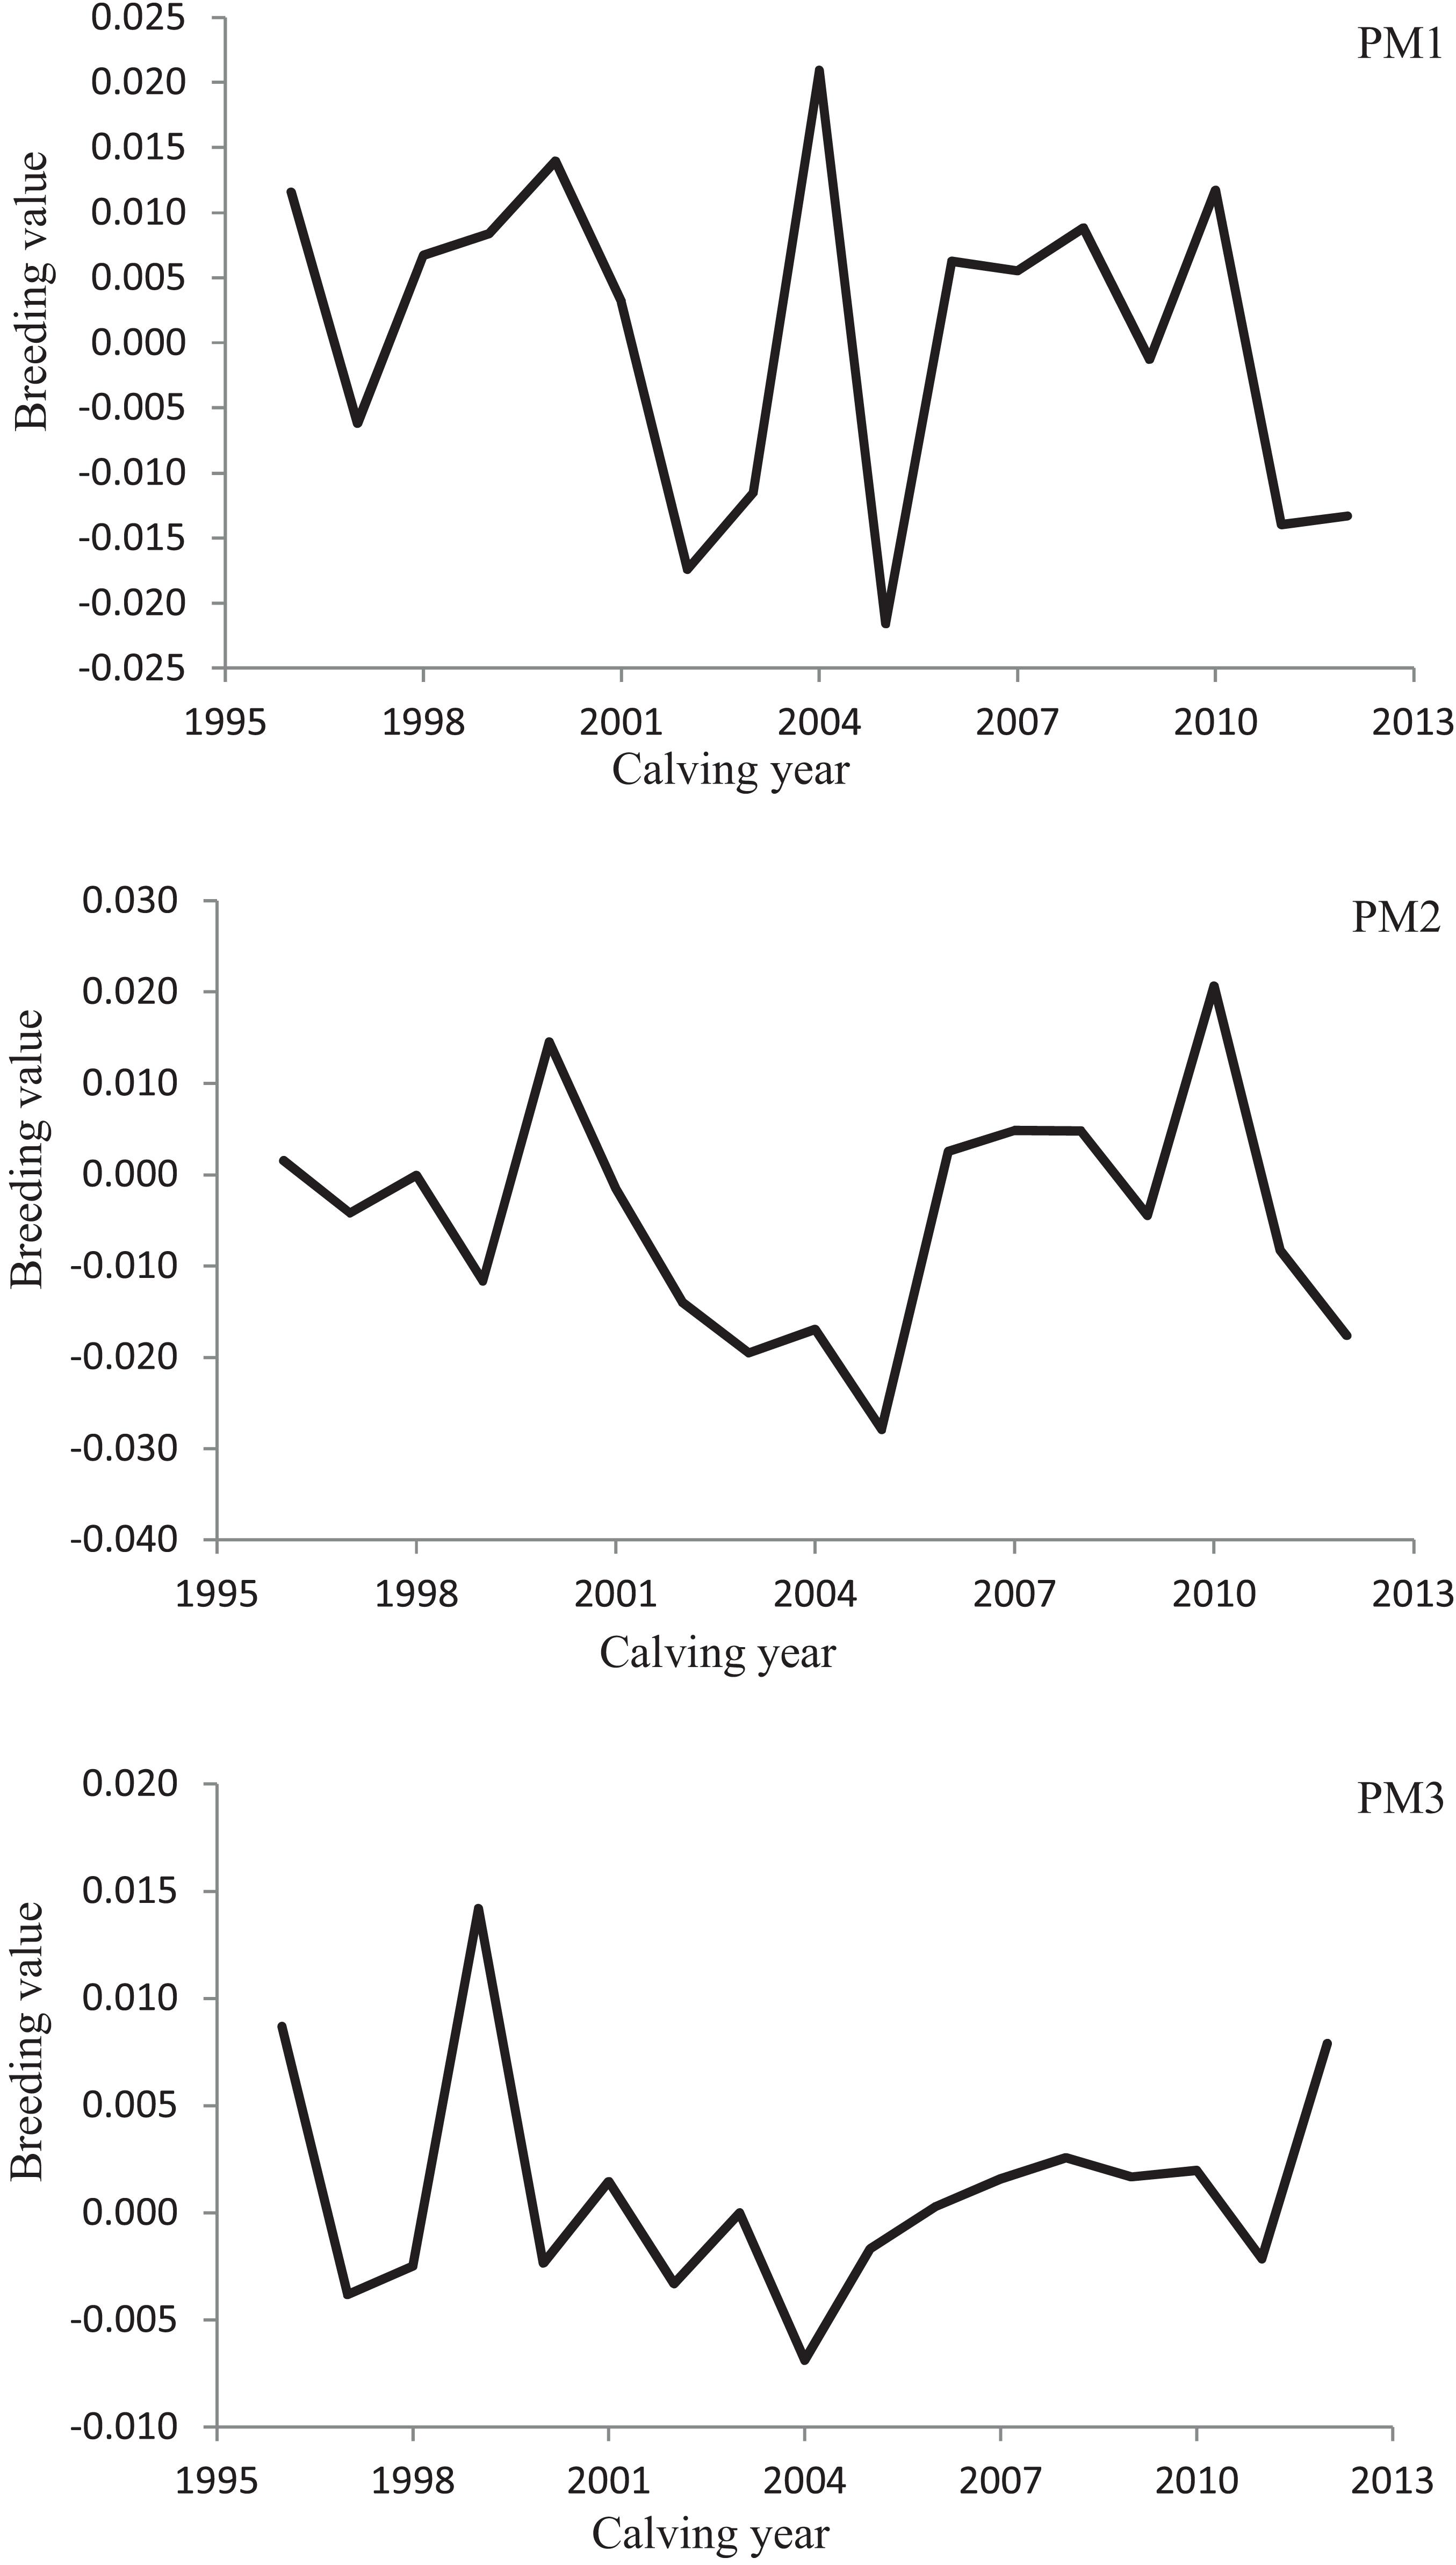
Figure 4. Variation in estimated breeding values of animals for persistency measures of milk fat yield according to calving year in the second lactation.
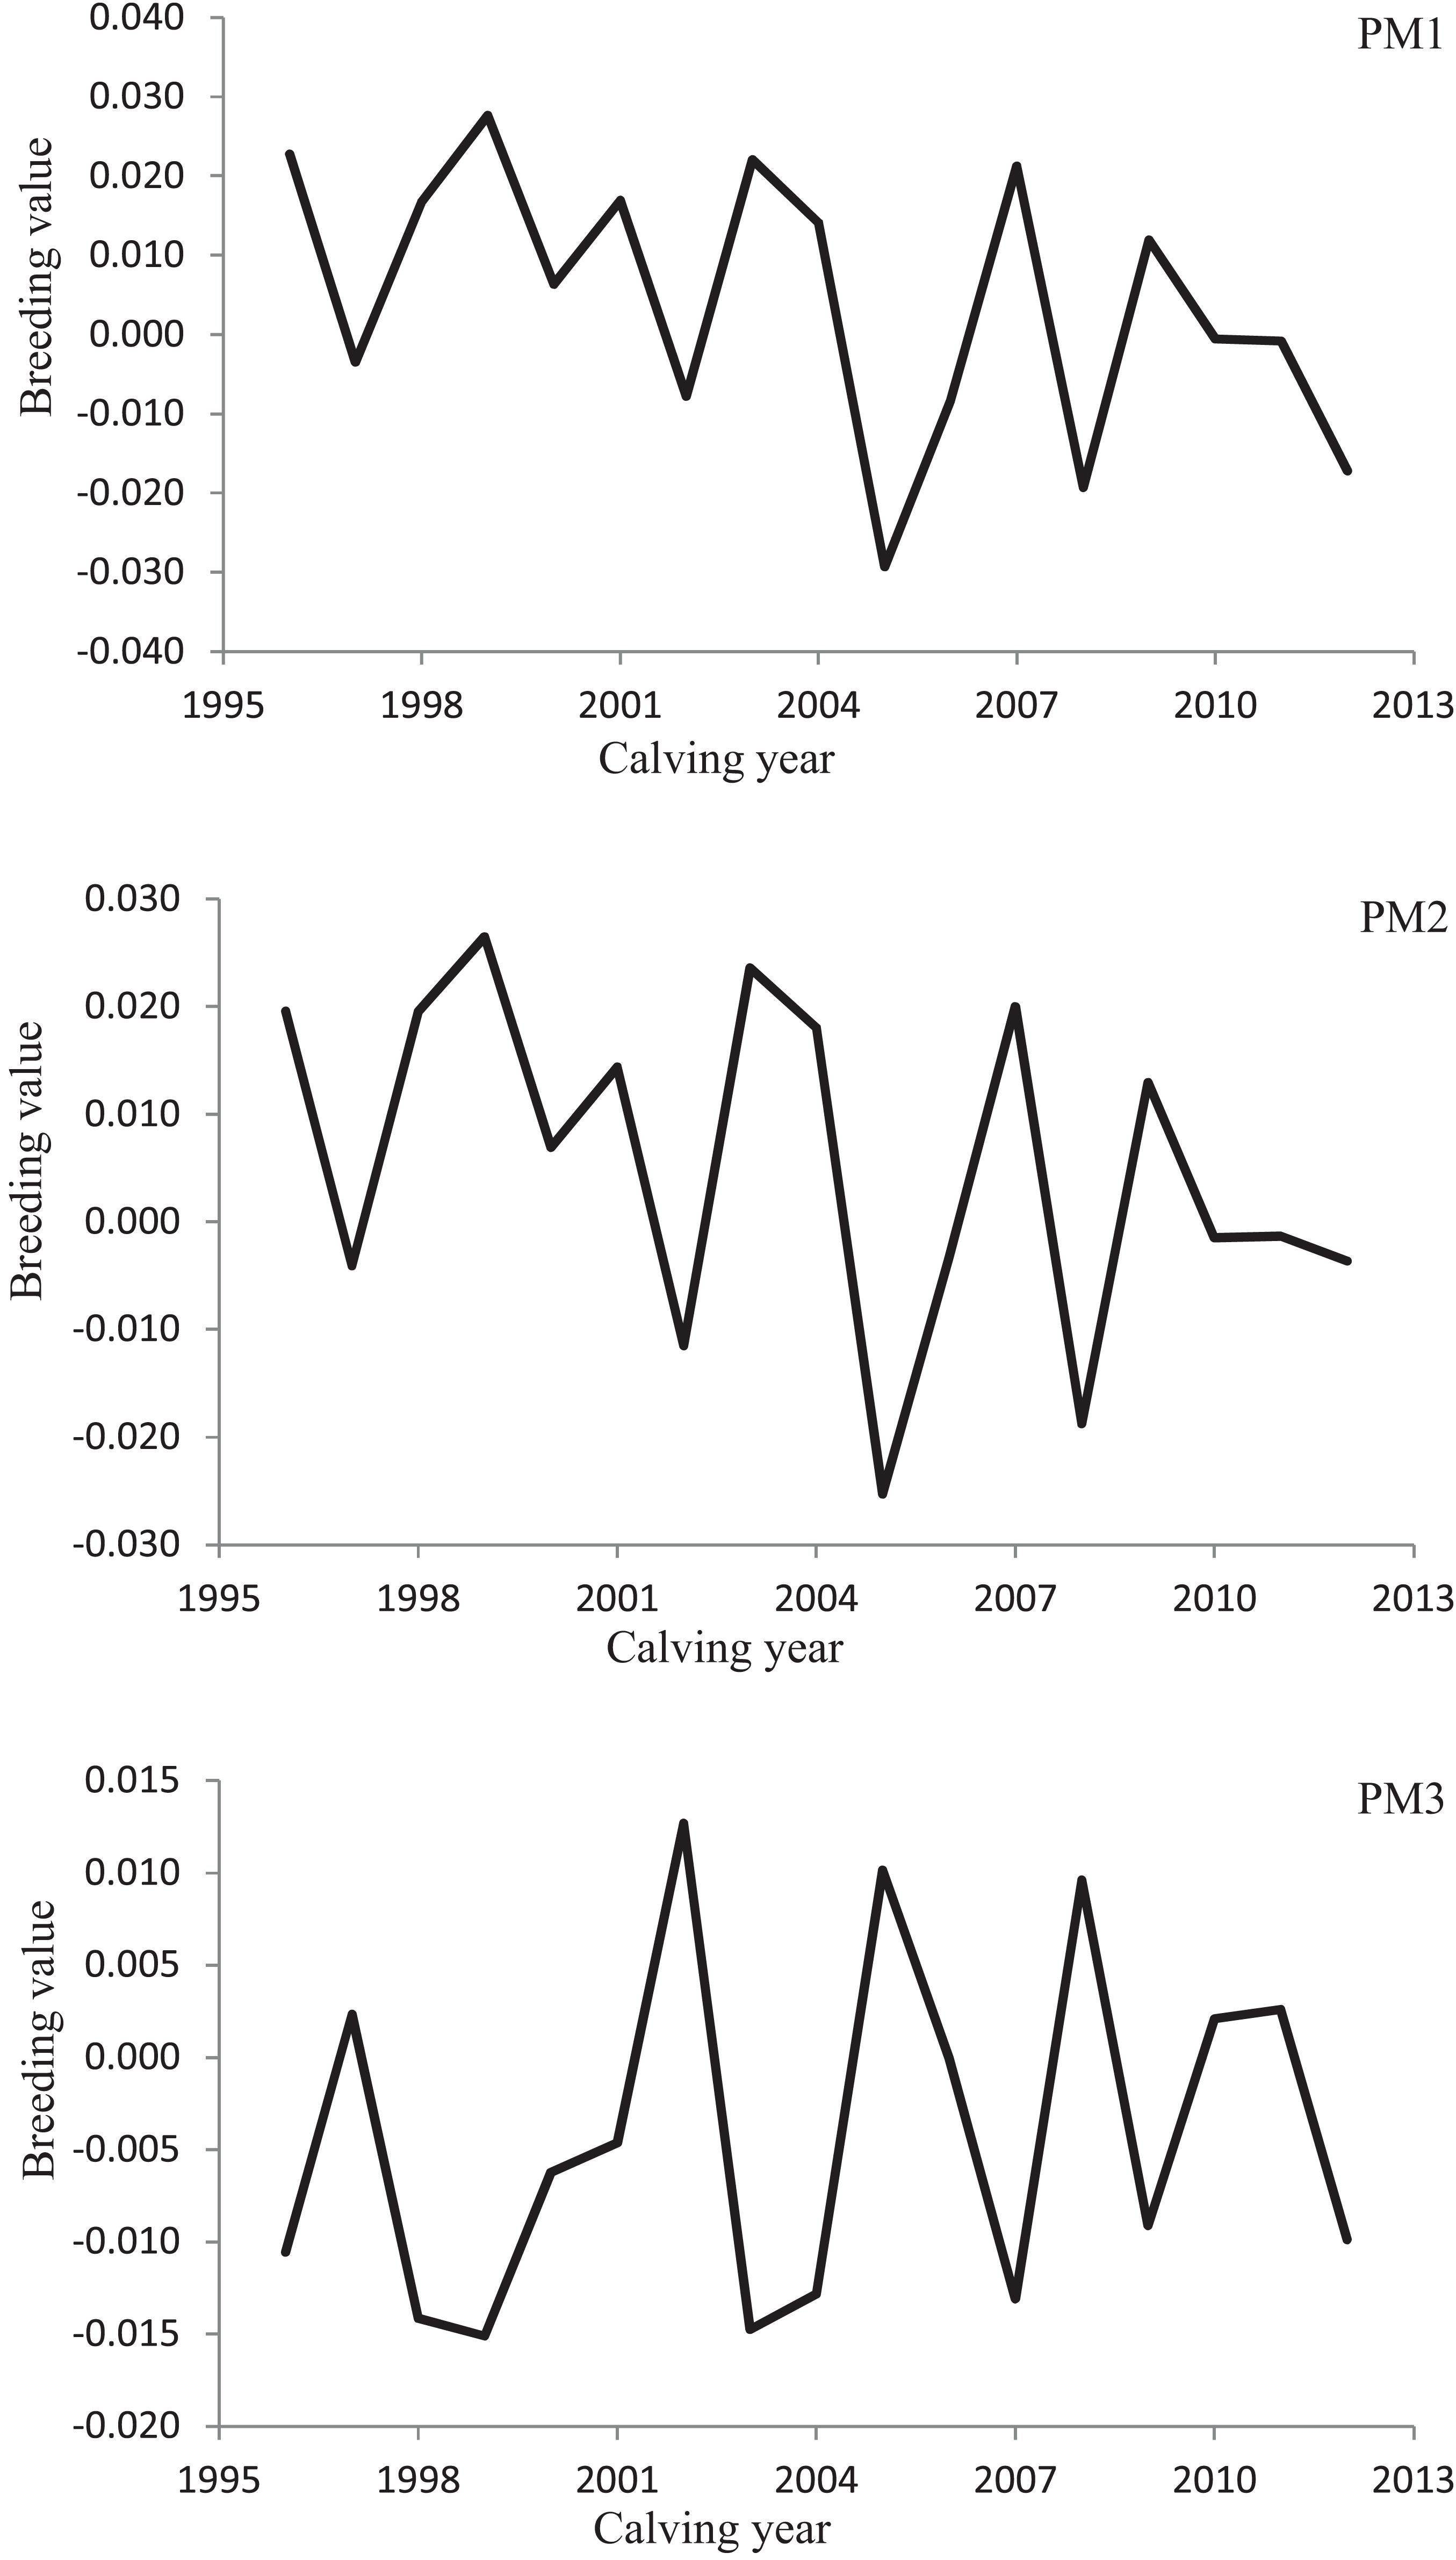
Figure 5. Variation in estimated breeding values of animals for persistency measures of milk fat yield according to calving year in the third lactation.
Discussion
For many years, the breeding objectives of dairy animals emphasized increased milk yield. But negative genetic associations were observed between numerous functional characters with production traits, and decreases in genetic excellence for fitness and health have been detected in dairy farms (Egger-Danner et al., 2015). The management practices must be directed toward the compensation of these effects and to equalize reproduction performance, metabolic diseases, and udder health vs. enhanced production to maximize profit without any negative impact on animal welfare. Because concerns on animal welfare and consumers’ appeal for natural and health products are increasing, the functional traits have received greater importance in animal breeding programs (Egger-Danner et al., 2015). In this regard, it is required to have valid genetic parameter estimates for outstanding traits related to the farm profit, including functional traits, in the animal breeding programs (Fleming et al., 2018). Interest to include new traits in the current animal breeding programs is extending to improve simultaneously the production and reproduction performance along with animal health and well-being in dairy farms. Although, for the inclusion of a specific trait into a genetic selection program, it would be inheritable, profitable, quantifiable, and changeable (Wood et al., 2003). Although, there were some reports on the genetic analysis of persistency measures for milk components in dairy cows (Cole and Null, 2009; de Oliveira Biassus et al., 2010), to the knowledge of authors, this is the first report on the genetic analysis of fat production persistency measures in buffaloes.
In general, medium to high heritability estimates for three milk fat persistency measures in this study could be due to the reasonable additive genetic variations for these traits indicating that improvement in these traits could be attained by genetic selection. Regardless of the simpler estimation of PM3 in contrast to other measures of persistency, the estimate of heritability for this measure was between the estimates of heritability for PM1 and PM2 measures for fat yield in the first lactation and had the smallest estimate in second and third parities. If a measure of persistency had higher heritability compared with other measures, this measure would be an appropriate measure to be considered in the selection objective (Ghavi Hossein-Zadeh et al., 2017). Respecting this explanation, the PM2 measure would be regarded as the selection criterion in the first lactation, but the measure of PM1 would be included as a selection objective in the second-, and third parities. Although there is no report of genetic parameters for persistency measures of fat yield in buffaloes, Cole and Null (2009) reported the estimates of heritability for fat production persistency measure varied from 0.07 to 0.12 in five breeds of dairy cows. Also, de Oliveira Biassus et al. (2010) reported the heritability estimates for fat yield persistency measures ranged from 0.00 to 0.23 in primiparous Holstein cows. Besides, Gengler (1995) estimated the heritability for fat yield persistency measure would be equal to 0.06 in dairy cows. In general, several factors could influence the variation in heritability estimates for milk fat yield persistency obtained in different studies, including the breed of the animal, within-population genetic diversity, management procedures, environmental conditions, and methods used for estimating genetic parameters. According to de Oliveira Biassus et al. (2010), different factors would influence the variations of heritability estimates for persistency measures among studies: the definition of persistency measure as absolute or relative terms, the statistical adequacy of the specific measure of persistency for under study population, the lactation period used to calculate the measure of persistency, and the method or model used to calculate a specific persistency measure. Compared with the first and third lactations, less variation in heritability estimates between the three persistency measures in the second lactation would be due to the differences in lactation curves, yield persistencies, and variation of records across the first three lactations.
The production difference in two different parts of the lactation would be evaluated by the PM1 and PM3 persistency measures (Ghavi Hossein-Zadeh et al., 2017). Compared with PM1 and PM3 measures, the PM2 measure displayed a domain below the lactation curve at a definite time that has been adjusted for yield at the end section of that period (Khorshidie et al., 2012). The procedure for defining the PM2 and PM3 persistency measures resulted in a high and negative genetic association between them. The positive genetic correlations between PM1 and PM2 are proof for the same genetic and physiological systems managing these persistency measures and would cause the same ranking of buffaloes according to these criteria in breeding and genetic schemes (Ghavi Hossein-Zadeh et al., 2017). Contrarily, high negative genetic correlations between PM3 with two other persistency measures implied the existence of various mechanisms to govern them. In general, low genetic correlations between different persistency measures for fat yield with milk production point out that selection for a persistency measure for milk fat yield would slightly affect milk yield. In a selection program, it would be favorable to have persistency measures that had low genetic correlations with milk yield (Dekkers et al., 1998; Ghavi Hossein-Zadeh et al., 2017). According to this explanation and regarding the low genetic correlations of persistency measures for fat yield with milk production in the present study, all three measures would be considered as selection criteria that were relatively independent of production level in buffaloes. This finding indicates that a buffalo cow with the highest EBV for 270-day milk yield does not necessarily has the highest EBV for fat yield persistency and vice versa. In the other words, low estimates of genetic association between fat yield persistency measures with milk production signified that buffaloes with the identical quantity of 270-day milk yield could have a distinct extent of persistency across the lactation period (Jamrozik et al., 1998; Cobuci et al., 2007; Ghavi Hossein-Zadeh et al., 2017). The appropriateness of genetic correlation between a specific persistency measure for milk fat yield and milk production depends on the positive or negative mean of the persistency measure in the population under study (Khorshidie et al., 2012). Generally similar to the results of the present study, Cole and Null (2009) observed the estimates of genetic associations between persistency measure of fat yield with 305-day milk production varied from 0.07 to 0.29 in five breeds of dairy cows.
Predicting accurately the animals’ breeding value is an appropriate way to increase the genetic gain in a specific breeding scheme (Ghavi Hossein-Zadeh, 2012). The successfulness of a selection scheme would be assessed by testing the actual alteration in breeding value indicated as a fraction of the expected theoretical modification in the average breeding value of the character under study (Jurado et al., 1994; Ghavi Hossein-Zadeh, 2012). Non-significant genetic progress estimated for all fat production persistency measures in the present study and irregular changes in average EBVs of animals over the years demonstrated the non-presence of a clear breeding design for making better the lactation persistency for fat yield in Iranian buffaloes until now. A possible reason for the non-significant genetic trends of milk fat persistency measures would be the low and close to zero estimates of genetic correlation between fat yield persistency measures and 270-day milk yield in the population under study.
Conclusion
The persistency measures of fat yield proposed in the present study had favorable low genetic correlations with 270-day milk production. These low correlations would be a benefit in designing a selection program to enhance the milk yield in Iranian buffaloes because buffaloes with the identical quantity of 270-day milk yield could have a distinct extent of persistency across the lactation period. The PM2 measure had the highest heritability estimate for the first lactation buffaloes, but the PM1 measure had the highest estimate in the second- and -third lactations. Therefore, the PM2 measure would be regarded as the selection criterion in the first lactation, but the measure of PM1 could be suggested as a selection objective in the second- and third parities. Based on the results of this study, it would be necessary to consider the persistency of fat yield in the selection objective of buffaloes in Iran together with main characters such as production and reproduction traits, and persistency for milk production.
Data Availability Statement
The data analyzed in this study is subject to the following licenses/restrictions: The data analyzed in this study was obtained from the Animal Breeding Center and Promotion of Animal Products of Iran. Requests to access these datasets should be directed to http://abc.org.ir.
Ethics Statement
Ethical review and approval was not required for the animal study because datasets used in this study were obtained from pre-existing databases based on routine animal recording procedures.
Author Contributions
MN participated in the acquisition of data, statistical, and genetic analyses of data. NH-Z designed and conceived this study and contributed to the statistical and genetic analyses of data, and prepared the manuscript. AS contributed to the conception of the study and assisted with the interpretation of the outputs. DK assisted with the interpretation of data. All authors read and approved the final manuscript.
Conflict of Interest
The authors declare that the research was conducted in the absence of any commercial or financial relationships that could be construed as a potential conflict of interest.
Acknowledgments
The authors acknowledge the Animal Breeding Center and Promotion of Animal Products of Iran for providing the data used in this study.
References
Borghese, A. (2005). Buffalo Production and Research.’ (FAO Regional Office for Europe Inter-Regional Cooperative Research Network on Buffalo (ESCORENA: Rome, Italy). Available online at http://www.fao.org/3/ah847e/ah847e.pdf (accessed November 23, 2020).
Canaza-Cayo, A. W., Sávio Lopes, P., da Silva, M. V. G. B., de Almeida Torres, R., Fonseca Martins, M., Arbex, W. A., et al. (2015). Genetic parameters for milk yield and lactation persistency using random regression models in Girolando cattle. Asian Australas. J. Anim. Sci. 28, 1407–1418. doi: 10.5713/ajas.14.0620
Cobuci, J. A., Euclydes, R. F., Costa, C. N., Lopes, P. S., Torres, R. A., and Perreira, C. S. (2004). Analysis of persistency in the lactation of Holstein cows using test-day yield and random regression model. Revis. Brasil Zootec. 33, 546–554.
Cobuci, J. A., Euclydes, R. F., Costa, C. N., Torres, R. A., Lopes, P. S., and Perreira, C. S. (2007). Genetic evaluation for persistency of lactation in Holstein cows using a random regression model. Genet. Mol. Biol. 30, 349–355.
Cole, J. B., and Null, D. J. (2009). Genetic evaluation of lactation persistency for five breeds of dairy cattle. J. Dairy Sci. 92, 2248–2258. doi: 10.3168/jds.2008-1825
Cole, J. B., and VanRaden, P. M. (2006). Genetic evaluation and best prediction of lactation persistency. J. Dairy Sci. 89, 2722–2728. doi: 10.3168/jds.S0022-0302(06)72348-7
de Oliveira Biassus, I., Cobuci, J. A., Costa, C. N., Rorato, P. R. N., Neto, J. B., and Cardoso, L. L. (2010). Persistence in milk, fat and protein production of primiparous Holstein cows by random regression models. R. Bras. Zootec. 39, 2617–2624. doi: 10.1590/S1516-35982010001200009
Dekkers, J. C. M., ten Hag, J. H., and Weersink, A. (1998). Economic aspects of persistency of lactation in dairy cattle. Livest. Prod. Sci. 53, 237–252. doi: 10.1016/S0301-6226(97)00124-3
Egger-Danner, C., Cole, J. B., Pryce, J. E., Gengler, N., Heringstad, B., Bradley, A., et al. (2015). Invited review: overview of new traits and phenotyping strategies in dairy cattle with a focus on functional traits. Animal 9, 191–207. doi: 10.1017/S1751731114002614
Eicher, R. (2004). Evaluation of the metabolic and nutritional situation in dairy herds: diagnostic use of milk components. Med. Vet. du Quebec. 34, 36–38.
Elmaghraby, M. (2012). Lactation persistency and prediction of total milk yield from monthly yields in Egyptian buffaloes. Lucrãri ?tiin?ifice 53, 130–137.
Fleming, A., Schenkel, F. S., Malchiodi, F., Ali, R. A., Mallard, B., Sargolzaei, M., et al. (2018). Genetic correlations of mid-infrared-predicted milk fatty acid groups with milk production traits. J. Dairy Sci. 101, 4295–4306. doi: 10.3168/jds.2017-14089
Gengler, N. (1995). Multiple-trait genetic evaluations for milk, fat, and protein yields and persistency. Interbull Bull. 11, 1–6.
Ghavi Hossein-Zadeh, N. (2012). Bayesian estimates of genetic changes for body weight traits of Moghani sheep using Gibbs sampling. Trop. Anim. Health Prod. 44, 531–536. doi: 10.1007/s11250-011-9930-1
Ghavi Hossein-Zadeh, N. (2015b). Bayesian analysis of direct and maternal effects for birthweight in Iranian buffaloes using Gibbs sampling. Anim. Prod. Sci. 56, 859–865. doi: 10.1071/AN14564
Ghavi Hossein-Zadeh, N. (2015a). Analysis of population structure and genetic variability in Iranian buffaloes (Bubalus bubalis) using pedigree information. Anim. Prod. Sci. 56, 1130–1135. doi: 10.1071/AN14738
Ghavi Hossein-Zadeh, N. (2016). Modelling lactation curve for milk fat to protein ratio in Iranian buffaloes (Bubalus bubalis) using non-linear mixed models. J. Dairy Res. 83, 334–340. doi: 10.1017/S0022029916000340
Ghavi Hossein-Zadeh, N., Madad, M., Shadparvar, A. A., and Kianzad, D. (2012). An observational analysis of secondary sex ratio, stillbirth and birth weight in Iranian buffaloes (Bubalus bubalis). J. Agric. Sci. Technol. 14, 1477–1484.
Ghavi Hossein-Zadeh, N., Nazari, M. A., and Shadparvar, A. A. (2017). Genetic perspective of milk yield persistency in the first three lactations of Iranian buffaloes (Bubalus bubalis). J. Dairy Res. 84, 434–439. doi: 10.1017/S0022029917000498
Jakobsen, J. H., Madsen, P., Jensen, J., Pedersen, J., Christensen, L. G., and Sorensen, D. A. (2002). Genetic parameters for milk production and persistency for Danish Holsteins estimated in random regression models using REML. J. Dairy Sci. 85, 1607–1616. doi: 10.3168/jds.S0022-0302(02)74231-8
Jamrozik, J., Jansen, G., Schaeffer, L. R., and Liu, Z. (1998). Analysis of persistency of lactation calculated from a random regression test day model. Interbull Bull. 17, 64–69.
Jurado, J. J., Alonso, A., and Alenda, R. (1994). Selection response for growth in Spanish Merino flock. J. Anim. Sci. 72, 1433–1440. doi: 10.2527/1994.7261433x
Khorshidie, R., Shadparvar, A. A., Ghavi Hossein-Zadeh, N., and Joezy Shakalgurabi, S. (2012). Genetic trends for 305-day milk yield and persistency in Iranian Holsteins. Livest. Sci. 144, 211–217. doi: 10.1016/j.livsci.2011.11.016
Kirkpatrick, M., Lofsvold, D., and Bulmer, M. (1990). Analysis of the inheritance, selection and evolution of growth trajectories. Genetics 124, 979–993. doi: 10.1093/genetics/124.4.979
Kistemaker, G. J. (2003). Comparison of persistency definitions in random regression test day models. Interbull Bull. 30, 96–98.
Li, J., Gao, H., Madsen, P., Li, R., Liu, W., Bao, P., et al. (2020). Impact of the order of Legendre polynomials in random regression model on genetic evaluation for milk yield in dairy cattle population. Front. Genet. 11:586155. doi: 10.3389/fgene.2020.586155
Meyer, K. (2006). WOMBAT – A Program for Mixed Model Analyses by Restricted Maximum Likelihood. User Notes. Armidale: Animal Genetics and Breeding Unit, University of New England.
Mrode, R. A., Swanson, G. J. T., and Paget, M. F. (2003). “Implementation of a test day model for production traits in the UK,” in Proceedings of the Interbull Meeting, (Cambridge: Cambridge University Press), 193–196.
Muir, B. L. (2004). Genetics of Lactation Persistency and Relationships with Reproductive Performance in Holsteins. Ph.D. Dissertation, University of Guelph, Guelph, ON.
Oliveira, H. R., Brito, L. F., Lourenco, D. A. L., Silva, F. F., Jamrozik, J., Schaeffer, L. R., et al. (2019). Invited review: advances and applications of random regression models: from quantitative genetics to genomics. J. Dairy Sci. 102, 7664–7683. doi: 10.3168/jds.2019-16265
Safari, A., Ghavi Hossein-Zadeh, N., Shadparvar, A. A., and Abdollahi Arpanahi, R. (2018). A review on breeding and genetic strategies in Iranian buffaloes (Bubalus bubalis). Trop. Anim. Health Prod. 50, 707–714. doi: 10.1007/s11250-018-1563-1
Sölkner, J., and Fuchs, W. (1987). A comparison of different measures of persistency with special respect to variation of test-day milk yields. Livest. Prod. Sci. 16, 305–319. doi: 10.1016/0301-6226(87)90001-7
Swalve, H. H., and Gengler, N. (1999). Genetics of lactation persistency. Occ. Publ. Br. Soc. Anim. Sci. 24, 75–82. doi: 10.1017/S1463981500043090
Togashi, K., and Lin, C. Y. (2004). Efficiency of different selection criteria for persistency and lactation milk yield. J. Dairy Sci. 87, 1528–1535. doi: 10.3168/jds.S0022-0302(04)73304-4
White, I. M. S., Thompson, R., and Brotherstone, S. (1999). Genetic and environmental smoothing of lactation curves with cubic splines. J. Dairy Sci. 82, 632–638. doi: 10.3168/jds.S0022-0302(99)75277-X
Wilmink, J. B. M. (1987). Adjustment of test-day milk, fat and protein yield for age, season and stage of lactation. Livest. Prod. Sci. 16, 335–348. doi: 10.1016/0301-6226(87)90003-0
Wood, G. M., Boettcher, P. J., Jamrozik, J., Jansen, G. B., and Kelton, D. F. (2003). Estimation of genetic parameters for concentrations of milk urea nitrogen. J. Dairy Sci. 86, 2462–2469. doi: 10.3168/jds.S0022-0302(03)73840-5
Keywords: dairy buffalo, genetic parameter, genetic trend, lactation persistency, random regression model
Citation: Nazari MA, Ghavi Hossein-Zadeh N, Shadparvar AA and Kianzad D (2021) Genetic Analysis of Persistency for Milk Fat Yield in Iranian Buffaloes (Bubalus bubalis). Front. Genet. 12:633017. doi: 10.3389/fgene.2021.633017
Received: 24 November 2020; Accepted: 18 February 2021;
Published: 08 March 2021.
Edited by:
Tingxian Deng, Institute of Buffalo (CAAS), ChinaReviewed by:
Madhu Tantia, National Bureau of Animal Genetic Resources (NBAGR), IndiaHossam Eldin Rushdi Ahmed Ali Osman, Cairo University, Egypt
Copyright © 2021 Nazari, Ghavi Hossein-Zadeh, Shadparvar and Kianzad. This is an open-access article distributed under the terms of the Creative Commons Attribution License (CC BY). The use, distribution or reproduction in other forums is permitted, provided the original author(s) and the copyright owner(s) are credited and that the original publication in this journal is cited, in accordance with accepted academic practice. No use, distribution or reproduction is permitted which does not comply with these terms.
*Correspondence: Navid Ghavi Hossein-Zadeh, nhosseinzadeh@guilan.ac.ir; navid.hosseinzadeh@gmail.com orcid.org/0000-0001-9458-5860