 Cori J. Siberski-Cooper1
 Mary S. Mayes1
 Patrick J. Gorden2Luke Kramer1
 Vishesh Bhatia1
 James E. Koltes1*
- 1Department of Animal Science, Iowa State University, Ames, IA, United States
- 2Veterinary Diagnostic and Production Animal Medicine, Iowa State University, Ames, IA, United States
Complete blood counts (CBCs) measure the abundance of individual immune cells, red blood cells, and related measures such as platelets in circulating blood. These measures can indicate the health status of an animal; thus, baseline circulating levels in a healthy animal may be related to the productive life, resilience, and production efficiency of cattle. The objective of this study is to determine the heritability of CBC traits and identify genomic regions that are associated with CBC measurements in lactating Holstein dairy cattle. The heritability of CBCs was estimated using a Bayes C0 model. The study population consisted of 388 cows with genotypes at roughly 75,000 markers and 16 different CBC phenotypes taken at one to three time points (n = 33, 131, and 224 for 1, 2, and 3 time points, respectively). Heritabilities ranged from 0.00 ± 0.00 (red cell distribution width) to 0.68 ± 0.06 (lymphocytes). A total of 96 different 1-Mb windows were identified that explained more than 1% of the genetic variance for at least one CBC trait, with 10 windows explaining more than 1% of the genetic variance for two or more traits. Multiple genes in the identified regions have functions related to immune response, cell differentiation, anemia, and disease. Positional candidate genes include RAD52 motif-containing protein 1 (RDM1), which is correlated with the degree of immune infiltration of immune cells, and C-X-C motif chemokine ligand 12 (CXCL12), which is critically involved in neutrophil bone marrow storage and release regulation and enhances neutrophil migration. Since animal health directly impacts feed intake, understanding the genetics of CBCs may be useful in identifying more disease-resilient and feed-efficient dairy cattle. Identification of genes responsible for variation in CBCs will also help identify the variability in how dairy cattle defend against illness and injury.
1 Introduction
The health of dairy cattle is important for their welfare, efficiency, and profitability. Previous research has shown that health disorders impact feed intake, feed efficiency, and milk quality (Brown and Bradford, 2021; Lochmiller and Deerenberg, 2000; Siberski-Cooper et al., 2023). Given the relationships between health and feed intake and related traits, information on health could be useful to improve predictions of feed efficiency in dairy cattle. Currently, genetic evaluations for health traits have primarily used producer-reported data. This information can be highly subjective, and the recording consistency differs greatly from farm to farm, resulting in lower heritability estimates (König and May 2019). In addition to these complications, the way in which resilience is defined is not consistent. Therefore, implementation of selection for improved performance in response to illness in dairy cattle has not yet been feasible (Berghof et al., 2019). Identification of proxy traits that are objective and easy to measure would be beneficial for identification of animals that are more resilient and thus genetic selection for improved resilience and maintained efficiency under disease or stress. Complete blood counts (CBCs; Table 1) are good candidate indicator traits of health status due to their relationships with the immune system. Although no assay is perfect for general disease detection and surveillance, CBCs are routinely used for early diagnosis of illness in dairy cattle, making red and white blood cell counts from these assays routinely available as disease indicators (Roland et al., 2014). A limited number of studies have reported the relationship of CBCs with growth, disease, and efficiency in beef cattle and swine (Leach et al., 2013; Mpetile et al., 2015; Chinchilla-Vargas et al., 2020). Additionally, there is only one report on genomic heritabilities of CBCs in dairy cattle (Siberski-Cooper et al., 2022) and one known study reporting non-genomic heritability estimates of specific blood leukocyte types in Holstein Friesian cattle (Denholm et al., 2017). Thus, the objectives of this study are to 1) estimate the genomic heritability of CBCs in lactating Holstein cows and 2) identify genomic regions associated with CBCs.
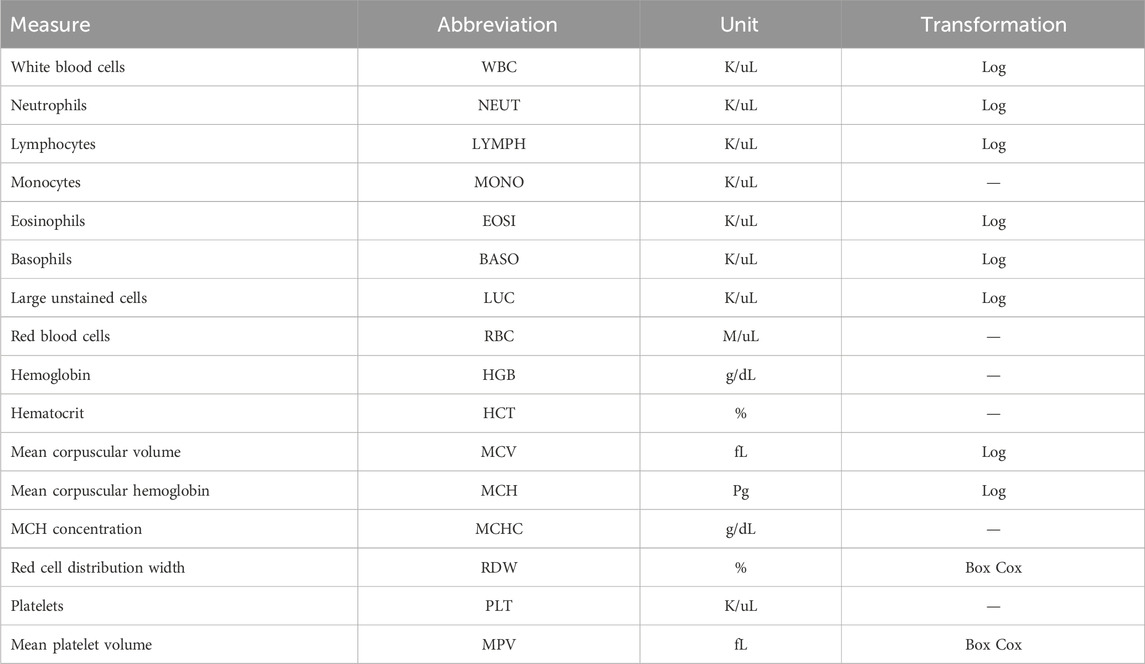
Table 1. Measurements reported in complete blood counts.
2 Materials and methods
2.1 Animal husbandry
All research conducted in this study was approved by the Iowa State University Animal Care and Use Committee (IACUC) under protocols 18–174 and 21–144. Data of 418 Holstein cows were collected between 2020 and 2022. Cows ranged from first through sixth parity and were 24–272 days in milk (DIM) at the start of data collection. To classify the point in lactation of the cows, DIM were assigned to one of four groups, namely, early-, peak-, mid-, and late-lactation. Early lactation was defined as DIM prior to 50 days, peak lactation was considered DIM 51–90 days, DIM 91–200 days were classified as mid-lactation, and any DIM after 201 days were assigned to the late-lactation category. Cows were grouped into contemporary groups (CGs) based on barn location (i.e., pen) and study replicates based on dates of data collection, resulting in a total of 10 CGs in the study. Cows were housed in a free stall barn at the Iowa State University (ISU) Dairy Farm. All cows received a standard total mixed ration (TMR) diet containing corn silage, alfalfa hay, whole cottonseed, molasses, ground corn, soybean meal and hulls, dried distiller grains, and a mineral and protein mix. Cows were milked twice per day, and milk samples were collected at both milkings 1 day per week. Milk samples were used in conjunction with daily milk weight to approximate the daily fat and protein yields.
2.2 Phenotype collection
Blood samples were collected for CBC measurements from cows two or three times during the trial period, with the number of blood collections depending on the CG. Blood samples were taken in the morning, prior to feeding and milking. Sampling occurred at the start and end of each trial, with CGs 1 to 8 having an additional sample taken at roughly halfway through the collection period. The average time between samples was 21 days. A total of 33 cows had CBCs at one time point, 131 at two time points, and 224 at three time points. Some cows had a single CBC due to either clotting of the blood sample, which prohibits the analysis for CBCs, or removal from the study pen due to a severe health disorder, including clinical mastitis and respiratory disease, based on daily consultation with ISU veterinary staff. Four milliliters of blood was collected from the tails of cattle and added to an EDTA blood tube and analyzed for CBCs using an ADVIA® 2120 Hematology System (Siemens Healthineers, Erlangen, Germany) as a commercial diagnostic service at the ISU Veterinary Clinical Pathology Laboratory. Of the 418 cows from which data were collected, CBCs were successfully reported for a total of 414 cows. A full list of cell abundance phenotypes from CBCs, along with the cells’ full names and abbreviations, is provided in Table 1. The distribution of each CBC phenotype was assessed for normality using a quantile–quantile plot. The WBC, MCV, MCH, BASO, EOSI, LYMPH, NEUT, and LUC were log-transformed to better approximate a normal distribution, whereas RDW and MPV required a Box–Cox transformation (lambda = −2). All other traits were not transformed. A summary of the cell count measures, including the mean and standard deviation, can be found in Supplementary Table S1.
2.3 Genotypic information
Genotypic data consisted of 78,985 SNP markers across the genome. Marker positions were obtained for the ARS-UCD 1.2 bovine genome build. Genotypic data quality control required a SNP marker call rate greater than 95% and a minor allele frequency greater than 5%. A total of 388 animals and 75,823 SNPs remained in the dataset following quality control.
2.4 Genetic analyses
2.4.1 Estimates of narrow sense heritability and repeatability from genomic data
Following the methodology presented in Bhatia et al. (2023), estimates of heritability for traits were obtained using the following univariate trait-based Bayes-C0 model (Kizilkaya et al., 2010):
where
2.4.2 Genome-wide association study
Following Bhatia et al. (2023), a univariate marker-based Bayes-B model was implemented in JWAS to identify genomic regions associated with CBC measurements. The model used was
where parameters follow the same naming convention described above, with the addition of
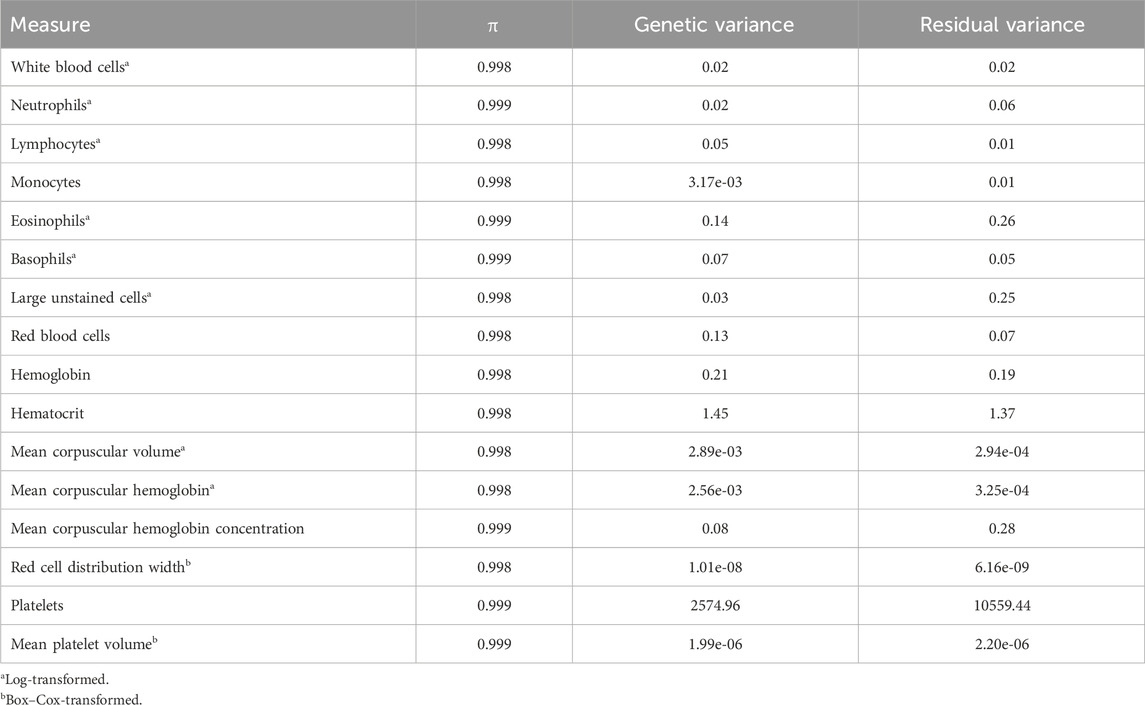
Table 2. Prior probability of exclusion (π) and variance estimates of complete blood count measures estimated from Bayes Cπ.
2.4.3 Identification of overlapping quantitative trait loci and candidate genes for CBC traits
Quantitative trait loci (QTLs) were identified as 1-Mb windows of the genome explaining more than 1% of the genetic variation, which contained all genotyped SNPs within the window. In order to explore whether the identified QTL explaining the most variance for each CBC trait had previously been associated with disease and other production traits in cattle, the GWAS peak (i.e., the 1-Mb region) was identified, and the 3′ and 5′ flanking 1-Mb windows were examined in the Animal Quantitative Trait Locus Database (QTLdb; Hu et al., 2022), based on the genomic coordinates defined at the QTLdb. The region explaining the most variance for lymphocytes was unable to be explored due to the inability to view chromosomal information on the QTLdb.
Potential candidate genes were identified by examining the 1-Mb region in the Ensembl genome browser. Previous findings related to the genes contained in the window were researched using NCBI, GeneCards, and previous publications (Stelzer et al., 2016; Cunningham et al., 2022; Sayers et al., 2022). If there were few or no genes in the 1-Mb window associated with the trait, the flanking 1-Mb windows were also inspected. Due to the number of QTLs identified, the 1-Mb region explaining the most genetic variance was explored for each CBC trait.
3 Results
3.1 Heritability and repeatability estimates
Genome-based heritability estimates for all CBC traits are reported in Table 3. Heritability estimates ranged from 0.00 ± 0.00 (RDW) to 0.68 ± 0.06 (LYMPH). The majority of the CBC traits had moderate heritability estimates, with a few having heritability estimates that are considerably high (i.e., larger than 0.50; RBC and LYMPH). The mean repeatability and upper and lower bounds of the HPD of repeatability for each trait are presented in Table 4. Repeatability estimates for CBC traits were typically moderate to high, with some having low repeatability. The range in mean repeatability was 0.00 (RDW) to 0.84 (LYMPH). Traits that had higher heritability tended to also have higher repeatability.
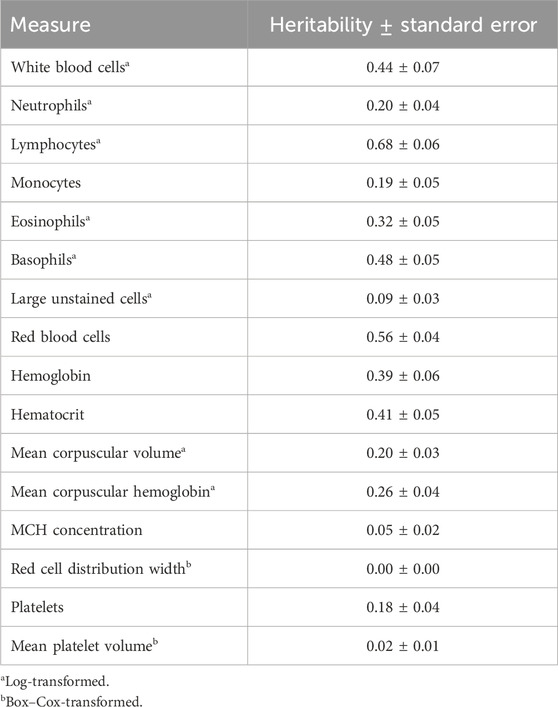
Table 3. Heritability estimates of complete blood count measures.
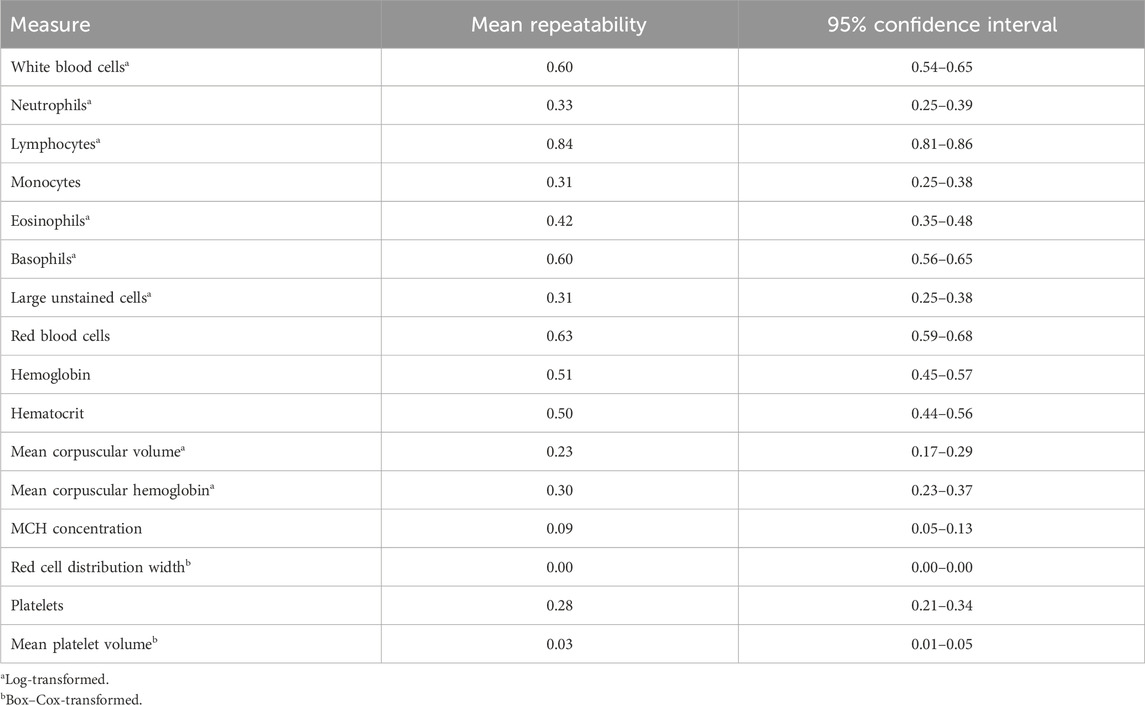
Table 4. Mean repeatability estimates and 95% confidence interval of repeatability for complete blood count measures.
3.2 Genomic regions associated and overlapping QTLs with CBC traits
Across the genome, 95 unique 1-Mb windows explained more than 1% of the genetic variance for at least one CBC trait. There were nine 1-Mb windows that accounted for more than 1% of the genetic variance for two CBC traits, and one 1-Mb window was found for three CBC traits. Each chromosome had at least one 1-Mb significant window for at least one trait, except for chromosome 26. Table 5 presents the locations of the windows that explained the most genetic variance, the percentage of genetic variance explained by the window, the WPPA, and potential candidate genes within the window for each chromosome. For a list of all 1-Mb windows that explained more than 1% of the genetic variance of the CBC traits, see Supplementary Table S2. Manhattan plots of the results of the GWAS for white blood cell, red blood cell, and platelet traits are shown in Figure 1, Figure 2, and Figure 3, respectively. The most genetic variance explained (11.9%) was by the window located at Mb 35 on chromosome 25 and was associated with hematocrit percentage. The average WPPA was 0.38, and a total of 22 windows had a WPPA above 0.50.
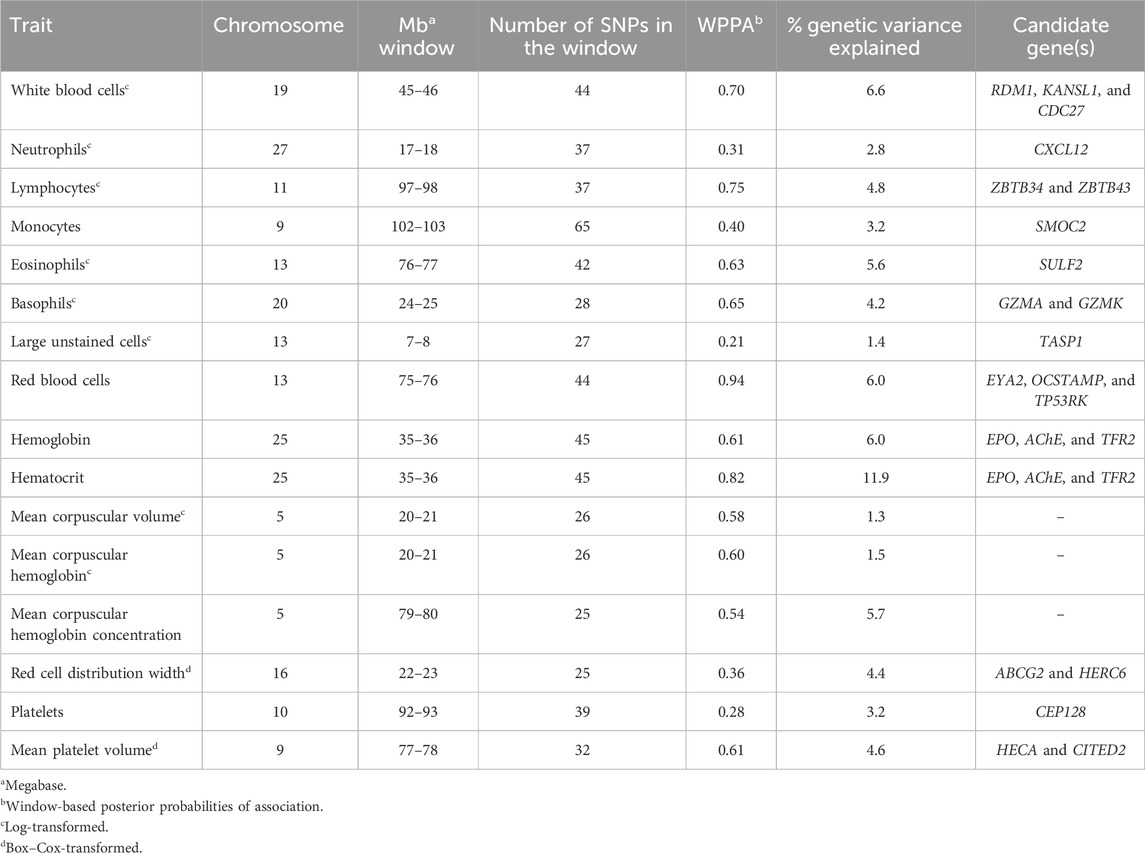
Table 5. Summary of 1-Mb windows explaining the most genetic variance for each complete blood count trait.

Figure 1. Genome-wide association study results for all white blood cells and white blood cell sub-types (i.e., leukocyte traits), with chromosome number on the X-axis and the percent of genetic variance explained on the Y-axis. Each point represents a 1-Mb window, and the red line is at 1% of the genetic variance explained.
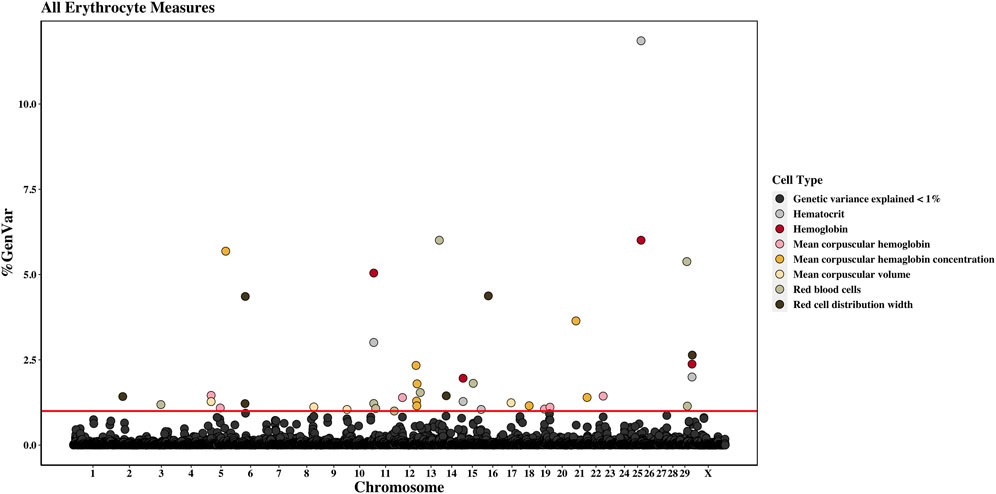
Figure 2. Genome-wide association study results for all red blood cells and red blood cell-related measures (i.e., erythrocyte traits), with chromosome number on the X-axis and the percent of genetic variance explained on the Y-axis. Each point represents a 1-Mb window, and the red line is at 1% of the genetic variance explained.
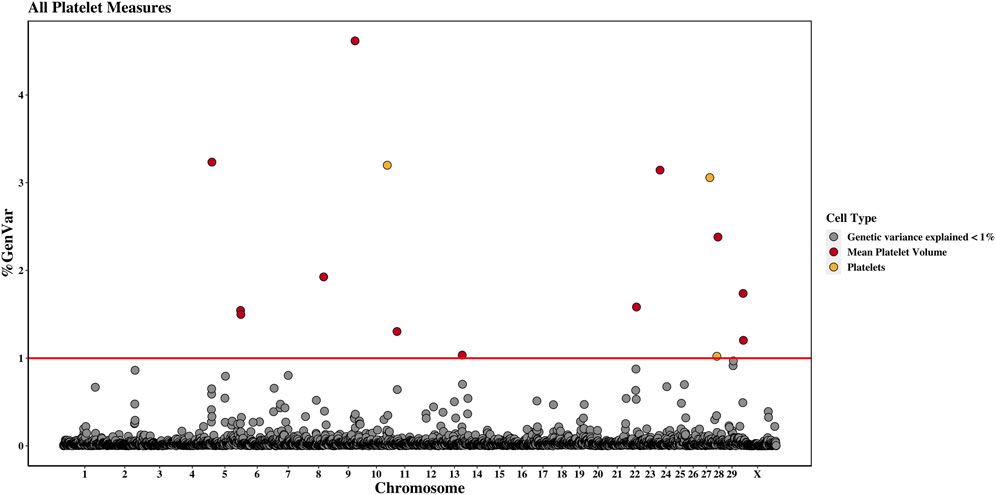
Figure 3. Genome-wide association study results for platelets and mean platelet volume, with chromosome number on the X-axis and the percent of genetic variance explained on the Y-axis. Each point represents a 1-Mb window, and the red line is at 1% of the genetic variance explained.
Within the 1-Mb window explaining the most genetic variance or flanking 1-Mb windows of thirteen CBC traits (WBC, RBC, HGB, HCT, MCV, MCH, RDW, MPV, NEUT, MONO, EOSI, BASO, and LUC), genome-wide marker associations (i.e., GWAS-based QTL) have previously been identified for production-related traits, such as fat yield or percentage, protein yield or percentage, milk conjugated linoleic acid content, and milk yield. Additionally, QTLs within the regions examined for RBC, RDW, MPV, NEUT, MONO, EOSI, BASO, and LUC have previously been identified for the length of productive life. Finally, RBC, RDW, MPV, NEUT, EOSI, BASO, and LUC had QTLs for net merit (Hu et al., 2022). For all overlapping QTLs discussed in the upcoming sections, the information on QTLs was obtained from the animal QTLdb (Hu et al., 2022). The results for all overlapping QTLs are presented in Supplementary Table S3.
3.2.1 White blood cell count
A total of five 1-Mb windows were found to explain at least 1% of the genetic variation for WBC. These windows were located on chromosomes 4, 9, 19, 21, and 29. The window on chromosome 19 explained the most variance at 6.6% and was located at 45 Mb. The WPPA for this window was 0.70. Within this window or just inside the 1-Mb window beginning at 46 Mb are the RAD52 motif-containing protein 1 (RDM1), KAT8 regulatory NSL complex subunit 1 (KANSL1), and cell division cycle 27 (CDC27) genes.
3.2.2 Red blood cell count
Nine 1-Mb windows located across six chromosomes explained 1.2%–6.0% of the genetic variance of RBCs. The regions identified were located on chromosomes 3, 11, 12, 13, 15, and 29, with three windows located on chromosome 11 and two on chromosome 29. The window on chromosome 13 at 75 Mb explained the most variance (6.0%) and had a WPPA of 0.94. Genes located in this window include EYA transcriptional coactivator and phosphatase (EYA2), osteoclast stimulatory transmembrane protein (OCSTAMP), and TP53 regulating kinase (TP53RK). Previously, a QTL was identified in the region on chromosome 13 located in the 76th Mb for somatic cell score (SCS). Within this region, QTLs were also identified for metabolic body weight (MBW) and average daily gain (ADG). Finally, a QTL located in the 74th Mb on chromosome 13 was previously identified for body weight gain (BWG).
3.2.3 Hemoglobin amount and hematocrit percentage
Four 1-Mb windows were identified for HGB on chromosomes 11, 15, 25, and X. The same regions were identified for HCT, as well as an additional window on chromosome 15. For both traits, the region located at 35 Mb on chromosome 25 accounted for the largest amount of genetic variance. The window explained 6.0% of the variance for HGB and 11.9% for HCT. The WPPA was lower for this region for HGB, with a WPPA of 0.61 compared to that of 0.82 for HCT. The erythropoietin (EPO) gene and the acetylcholinesterase (AChE) and transferrin receptor 2 (TFR2) genes are located within this window. Two QTLs for ADG were previously identified in the 35th Mb of chromosome 25.
3.2.4 Mean corpuscular volume
Between 1.1% and 1.3% of the genetic variance of MCV was accounted for by four 1-Mb windows located on chromosomes 5, 8, 10, and 17. The window on chromosome 5, located at 20 Mb, accounted for the most variance (1.3%). This window had a WPPA of 0.58.
3.2.5 Mean corpuscular hemoglobin amount
Six windows on chromosomes 5, 12, 19, and 22 explained 1.1%–1.5% of the genetic variance of MCH. Two 1-Mb windows were identified on both chromosomes 5 and 19. The window on chromosome 5 at 20 Mb accounted for the largest amount of genetic variance at 1.5% and had a WPPA of 0.60.
3.2.6 Mean corpuscular hemoglobin concentration
A total of eight 1-Mb windows explained at least 1% of the genetic variance of MCHC. These windows were located on chromosomes 5, 12 (four windows), 18, and 21 (two windows). The largest amount of variance (5.7%) was explained by the window located at 79 Mb on chromosome 5 and had a WPPA of 0.54. Five QTLs previously identified for bovine tuberculosis susceptibility and M. paratuberculosis susceptibility were located in the region in the 78th Mb on chromosome 5.
3.2.7 Red cell distribution width
Six windows explained more than 1% of the genetic variance of RDW. These windows were located on chromosomes 2, 6 (two windows), 14, 16, and X. The most variance was explained by the window on chromosome 16 (22 Mb), accounting for 4.4% of the genetic variance. This window had a WPPA of 0.36. Within the genomic region at 21 Mb on chromosome 16, QTLs were previously identified for ADG and BWG, whereas a QTL was found for feed conversion ratio in the 23rd Mb. Within a window explaining 1.2% of the genetic variation in RDW located at chromosome 6 (36 Mb) are the ATP-binding cassette subfamily G member 2 (ABCG2) and HECT and RLD domain-containing E3 ubiquitin protein ligase family member 6 (HERC6) genes.
3.2.8 Platelet count
Three 1-Mb regions, located on chromosomes 10, 27, and 28, were found to explain more than 1% of the genetic variance for PLT. The window located at 91 Mb on chromosome 10 accounted for the most variance (3.2%), and the WPPA of this window was 0.28. The gene centrosomal protein 128 (CEP128) is located in this window.
3.2.9 Mean platelet volume
There were twelve windows found on nine chromosomes that explained between 1.0% and 4.6% of the genetic variance for MPV. Windows were located on chromosomes 5 (three windows), 8, 9, 11, 13, 22, 24, 28, and X (two windows). The most variance explained (4.6%) was for the window on chromosome 9 at 77 Mb, which had a WPPA of 0.61. The Hdc homolog, cell cycle regulator (HECA) gene is located just outside of the 77-Mb window, at approximately 76.8 Mb, and the Cbp/p300 interacting transactivator with Clu/Asp rich carboxy-terminal domain 2 (CITED2) is located within the window at 77 Mb. A QTL was previously identified for MBW in the 78th Mb.
3.2.10 Neutrophil count
Five windows were identified on chromosomes 3, 5, 27, 28, and 29, explaining at least 1% of the genetic variance for NEUT. The window located at 17 Mb on chromosome 27 explained the most variance at 2.8%. This window had a WPPA of 0.31. Two QTLs were previously identified for ADG, one located within the 17-Mb and the other in the 18-Mb region. Additionally, a QTL was found for BWG in the 17th Mb and for dry matter intake in the 18th Mb. Within the window located at 45 Mb on chromosome 28, explaining 1.3% of the genetic variation, is the C-X-C motif chemokine ligand 12 (CXCL12) gene.
3.2.11 Lymphocyte count
There were eleven windows that explained at least 1% of the genetic variance in LYMPH. These windows were located on chromosomes 4, 5, 11, 15, 17, 19, 20, 23, and 29. There were two windows located on both chromosomes 17 and 23. The largest amount of variance explained was 4.8% by the window located on chromosome 11 at 97 Mb. This window had a WPPA of 0.75. Located in this window are the zinc finger and BTB domain-containing 34 and 43 (ZBTB34 and ZBTB43) genes.
3.2.12 Monocyte count
Eight windows explained more than 1% of the genetic variance of MONO. Windows were found on chromosomes 5, 9 (two windows), 11, 18, 23, 27, and 28. The most variance was explained by the window on chromosome 9 beginning at 102 Mb (3.2%) and having a PPA of 0.40. The SPARC-related modular calcium-binding 2 (SMOC2) gene is found within this window. A QTL was previously identified in this region (chromosome 9, 102 Mb) for bovine respiratory disease (BRD) susceptibility. Moreover, within the 103-Mb region, a QTL was found for BWG.
3.2.13 Eosinophil count
Between 1.2% and 5.6% of the genetic variance was explained by eleven windows for EOSI. Windows were located on chromosomes 1, 5, 7, 11, 13, 14, 18, 19, 28, and X, with two regions located on chromosome 19. The largest portion of variance (5.6%) explained was by the window located on chromosome 13 at 76 Mb. The WPPA of this window was 0.63. The sulfatase 2 (SULF2) gene is found within this window. Previously, QTLs were identified for SCS and clinical mastitis in the region located at 77 Mb on chromosome 13. Additionally, a QTL for BWG was found in the region at 76 Mb.
3.2.14 Basophil count
Eight windows located on chromosomes 5, 15, 17, 18 (two windows), 19 (two windows), and 20 accounted for more than 1% of the genetic variance for BASO. The most variance explained was by the window on chromosome 20 (24th Mb), accounting for 4.2%. This window had a WPPA of 0.65. The granzyme A (GZMA) and K (GZMK) genes are found in this window. A QTL was previously identified for clinical mastitis in the 23rd Mb and for SCS in the 25th Mb on chromosome 20.
3.2.15 Large unstained cells count
A single 1-Mb window located on chromosome 13 beginning at the seventh Mb accounted for 1.4% of the genetic variance in large unstained cells. The WPPA of this window was 0.20. The taspase 1 (TASP1) gene was found in this window.
4 Discussion
This is the first study describing the genetic architecture of CBCs in lactating Holstein cattle. The study provides novel evidence of genetic control of CBC traits in Holstein cattle. The CBC measures had heritability estimates that were generally consistent with those previously identified in beef cattle, with some having estimates larger than 0.50 (RBC and LYMPH), perhaps as a function of breed differences, or the sample size, management, or environmental factors in the current study. Multiple biologically relevant candidate genes were identified that warrant further investigation for causal genes impacting CBC abundance. The GWAS-based QTLs identified overlap with a variety of illness and disease susceptibility traits (e.g., SCS, paratuberculosis, and BRD susceptibility). Significant phenotypic associations have been found between feed intake and CBC counts (results not shown), providing motivation for the determination of the potential utility of CBC traits as proxies for feed intake. Some QTLs identified overlap with QTLs previously identified for production- and efficiency-related traits (e.g., fat, protein and milk yield, ADG, and feed conversion ratio). The results of this study are promising and provide evidence that genomic selection on CBC phenotypes could be feasible.
4.1 CBC measures in Holstein cattle are moderately to highly heritable and repeatable
Heritability estimates in the current study for individual CBCs tended to be similar to those previously reported in cattle. Previous reports of the heritability of WBC in beef cattle ranged from 0.31 to 0.47 (Leach et al., 2013; Chinchilla-Vargas et al., 2020), which supports the findings of the current study. Heritability estimates of specific WBC types (i.e., WBC, EOSI, LUC, NEUT, and MONO) were in the range of those reported for both pigs and cattle (Leach et al., 2013; Mpetile et al., 2015; Chinchilla-Vargas et al., 2020), with the exception of BASO and LYMPH, which were considerably larger than those previously reported (0.48 ± 0.05 vs. 0.12—0.23 and 0.68 ± 0.06 vs. 0.15–0.50, respectively). Estimated heritabilities of RBC-related traits also tended to be larger than those previously reported for cattle, while some were similar to those reported in swine (e.g., RBC: 0.56 ± 0.04 vs. 0.62 ± 0.25; Mpetile et al., 2015). Estimates of MCHC, RDW, and MPV heritability were substantially smaller than those previously reported and were near 0 (0.05 ± 0.02, 0.00 ± 0.00, and 0.02 ± 0.01, respectively). An important consideration is that the current study required a transformation of several CBC traits to approximate normality, while previous studies typically did not use transformation measures. It may be possible that these transformations impacted the magnitude of the estimates.
Previous studies have not estimated the repeatability of CBC measures over time. Though samples in this study were taken within a relatively short timeframe (on average 3 weeks apart over a 6-week duration), there was a wide range in repeatability estimates. The mean repeatability of RDW, MPV, and MCHC was low (<0.10), while the repeatability of HGB, WBC, BASO, RBC, and LYMPH was relatively high (>0.50). These findings indicate that some CBC traits with high repeatability may fluctuate little over short time periods, while others with low repeatability may be much more variable. This information about the variability of CBCs over short time periods may be helpful in identifying reasonable time frames to compare CBC measurements in the design of future assays or experiments on dairy cattle. Further research into the point at which a sample is taken for traits that are more variable and the impact that trait variation over time has on trait correlations will be important in determining the informativeness of a candidate indicator trait.
4.2 Genome-wide association study and candidate genes for the genetic control of CBCs
4.2.1 White blood cell count
Three genes of interest are located in the window on chromosome 19 that explained the most genetic variance for WBC. Previous research on humans has shown that the RDM1 gene is involved in mediating DNA damage repair through homologous recombination and the cellular response to a chemotherapy drug (Hamimes et al., 2005; Hamimes et al., 2006; Messaoudi et al., 2007). Moreover, knockdown of this gene reduced the proliferation of tumor cells, increased cell apoptosis, and induced cell cycle arrest (Li et al., 2017; Xu et al., 2018; Chen et al., 2019; Tong et al., 2020). The expression of RDM1 is correlated with the degree of immune infiltration of immune cells, including macrophages and neutrophils, in a variety of cancer types (Qui et al., 2021). A SNP located within 100 Kb of the RDM1 gene was associated with interdigital hyperplasia, and another was associated with sole hemorrhage in Holsteins (Sousa Junior et al., 2023). Finally, RDM1 was found to be significantly downregulated in less feed-efficient beef cattle (Chen et al., 2011). KANSL1 is an additional gene of interest. A study on human ovarian cancer found that KANSL1 is amplified and/or rearranged in ovarian cancer, associated with the lymphocyte profile, a biomarker for response to histone deacetylase inhibition, and could potentially drive the expression of genes related to immune response (Fejzo et al., 2020). Lastly, CDC27 is located in the region identified. This gene has been linked to several diseases including lupus (Shang et al., 2022), pulmonary fibrosis (Qi et al., 2020), and numerous cancers (Ahn et al., 2014; Guo et al., 2015; Xin et al., 2018). Due to the connection of these genes with regulation of immune cells, genes related to immune response, and autoimmune diseases and cancer in humans, it may be worthwhile further investigating their relationship to WBC in cattle.
4.2.2 Red blood cell count
A window located on chromosome 13 explained 6.01% of the genetic variance of RBCs and contained three potential candidate genes, namely, EYA2, OCSTAMP, and TP53RK. These genes have all been tied to blood cancers, including myeloid leukemia and myeloma. One study identified EYA2 as a potential target for molecular therapy in a subtype of acute myeloid leukemia (Ono et al., 2017), whereas OCSTAMP mRNA levels were connected to multiple myeloma (Wang et al., 2020) and TP53RK expression is inversely correlated with multiple myeloma survival (Hideshima et al., 2017). Due to acute myeloid leukemia and myeloma being blood cancers, the cancer cells can crowd out healthy blood cells, which can result in decreased RBC and anemia (American Cancer Society, 2018; Mayo Clinic, 2023). Interestingly, TP53RK was significantly downregulated in healthy Holstein cattle, compared to those PCR-positive for bovine tuberculosis (Fang et al., 2020), and was expressed at significantly lower levels in foot and mouth disease virus carriers than non-carriers (Zhu et al., 2020).
4.2.3 Hemoglobin abundance and hematocrit percentage
The GWAS regions identified for HGB and HCT were nearly identical, including the window on chromosome 25 that explained the largest portion of genetic variance for both traits. EPO, AChE, and TRF2 genes are located in this window. The protein encoded by the EPO gene promotes erythropoiesis in bone marrow. Moreover, the expression of EPO is upregulated during hypoxia, which results in increased red blood cell production and an enhanced oxygen-carrying capacity of blood (Schuster et al., 1989; Jelkmann, 1992; Lam et al., 2009). Knock-out of AChE in mice resulted in anemia. Additionally, the amount of hemoglobin in the knockout mice was found to be significantly lower. This study also hypothesized that AChE may be involved in the regulation of erythroblast-like cell responsiveness to EPO (Xu et al., 2019). An additional study on humans by Gupta et al. (2018) found that AChE levels were higher in cases of anemia related to the size of the RBCs (i.e., macrocytic and microcytic), suggesting that it may play a role in the maintenance of the shape and integrity of RBCs. This study also reported a negative correlation of AChE levels with hemoglobin. The TFR2 gene is a partner and modulator of the EPO receptor gene (EPOR) complex and is required for efficient erythropoiesis. Furthermore, knockout of TFR2 in bone marrow results in higher hemoglobin and red blood cell counts, and researchers speculated that TFR2 may serve as a control system of RBC number (Nai et al., 2015).
4.2.4 Mean corpuscular volume, mean corpuscular hemoglobin amount, and mean corpuscular hemoglobin concentration
For MCV, MCH, and MCHC, the window that explained the most variance included only one or two genes. Moreover, these genes have not been determined to have functions related to MCV, MCH, MCHC, or related traits. On examining the 1-Mb regions surrounding those identified in the GWAS, some long non-coding RNAs (lncRNAs) for MCV and MCH were observed. Moreover, located just outside of the region identified on chromosome 17 for MCV is the sprout RTK signaling antagonist 1 (SPRY1). This gene has been identified as a regulator of red blood cell production during anemia and a transducer of EPOR signals (Sathyanarayana et al., 2012). Thus, it may be possible that the lncRNA found may be regulating the nearby gene. For MCHC, the importin 8 (IPO8) gene is located roughly 0.1 Mb outside of the identified region. This gene has been associated with increased MCH in mice (Blake et al., 2021) and therefore may be related to MCHC in cattle, but little information is available.
4.2.5 Red cell distribution width
Within the region explaining 1.2% of the genetic variance in RDW are the ABCG2 and HERC6 genes. Zhou et al. (2005) reported that the expression of the ABCG2 gene is upregulated in two murine erythroid cell systems during erythroid differentiation. Moreover, the ABCG2 protein was expressed in mature red blood cells of mice, rhesus monkeys, and humans. Desuzinges-Mandon et al. (2010) reported that the ABCG2 gene also functions in the cellular export of heme. Similarly, the HERC6 gene is induced during erythroid differentiation (Maragno et al., 2011). Though these genes have not been related to differences in RDW (i.e., the coefficient of the variation of erythrocyte size), it is possible, given their relationship to erythrocyte differentiation, that they may also influence RDW. Additionally, a mutation in the ABCG2 gene has previously been identified as having an effect on milk production and composition of Holstein cows (Cohen-Zinder et al., 2005), and HERC6 was found to have increased expression in beef cattle with BRD compared to healthy cattle (Scott et al., 2022).
4.2.6 Platelet count
A gene of interest located in the region explaining the most genetic variance for PLT is CEP128. This gene is a risk locus for autoimmune thyroid diseases (Wang et al., 2019). Ijaz et al. (2018) reported that an increase in serum L-thyroxine level, a thyroid hormone, was associated with platelet count. Moreover, thyroid disorders are commonly found in individuals with immune thrombocytopenia (i.e., a deficiency in platelets). The link between CEP128 and thyroid diseases and the connection between the thyroid and platelets may indicate a potential link between the gene and platelets.
4.2.7 Neutrophil count
The CXCL12 gene is located in a region explaining 1.3% of the genetic variance of NEUT. This gene is of particular interest as several pieces of evidence exist for its involvement with neutrophils. Metzemaekers et al. (2020) summarizes the roles of chemokines, including CXCL12, in relation to neutrophils. Importantly, it is critically involved in neutrophil bone marrow storage and release regulation (Metzemaekers et al., 2020; Cambier et al., 2023). Isles et al. (2019) found that CXCR4/CXCL12 signaling may play a key role in the retention of neutrophils at inflammatory sites. Additionally, CXCL12 signaling has been shown to enhance neutrophil migration (Cali et al., 2022). Given this clear connection between CXCL12 and neutrophils, it is a strong candidate gene for neutrophils in cattle.
4.2.8 Lymphocyte count
Two zinc finger and BTB domain-containing genes are located in the window explaining the most genetic variance for LYMPH. This family of genes has been reported to play a key role in B-cell development (Chevrier and Corcoran, 2014). Recently, ZBTB43 was found to be differentially expressed in human cells after coronavirus infection and was therefore hypothesized to be involved in the cellular response to COVID-19 infection (Mamoor, 2020). Additionally, ZBTB34 was predicted to be involved in the regulation of immune system processes in brown rats (Vedi et al., 2023). In feedlot cattle, ZBTB43 was identified as a potential biomarker and candidate disease gene for BRD (Hasankhani et al., 2021), further suggesting it may play a role in the immune system of cattle.
4.2.9 Monocyte count
The SMOC2 gene is potentially a gene of interest for monocytes in cattle. In a study of humans with heart failure, a negative correlation was found between SMOC2 and monocytes (Zhou et al., 2023). Moreover, the gene is highly expressed during wound healing (Rocnik et al., 2006). Given that monocytes are required for tissue regeneration and are one of the first responders to tissue injury (Shi and Pamer, 2011; Ogle et al., 2016), it may be possible that SMOC2 plays a role in the genetic control of monocytes. In beef cross cattle, SMOC2 was significantly downregulated in healthy cattle compared to those with bovine viral diarrhea virus (Tizioto et al., 2015).
4.2.10 Eosinophil count
The SULF2 gene is located in the window explaining the most genetic variance for EOSI. This gene is involved in TNF-α signaling and is overexpressed in rheumatoid arthritis (Siegel et al., 2022). Given that rheumatoid arthritis is an autoimmune and inflammatory disease, it is possible that there is a link between SULF2 and immune-related cells like eosinophils.
4.2.11 Basophil count
Two genes located in the region explaining the most genetic variance for BASO belong to the granzyme family (GZMA and GZMK). This family of genes is involved in mediating cell death (Chowdhury and Lieberman, 2008), as well as playing a potential role in immune signaling (Cullen et al., 2010). GZMA specifically has been shown to have pro-inflammatory activity (Lieberman, 2010). Due to the relationship between BASO and inflammation, a link between granzyme genes and BASO is possible. Aaranday-Cortes et al. (2012) and Bhat et al. (2023) found that GZMA was significantly upregulated in cattle with bovine tuberculosis compared to healthy cattle. Interestingly, this gene was more highly expressed in beef cross steers with lower gain than those with higher gain (Lindholm-Perry et al., 2017). A SNP located within 1 Mb of the GZMK gene was associated with the Johne’s disease infection status of Holstein cattle (Mallikarjunappa et al., 2018).
4.2.12 Large unstained cells count
Large unstained cells are large peroxidase-negative cells, most often large lymphocytes, virocytes, blasts, and hematopoietic stem cells (Merter et al., 2023). The TASP1 gene located in the region identified for LUC has been identified as a potential anticancer therapeutic target (Niizuma et al., 2015). Moreover, the gene has been identified as playing a role in filopodia, which is essential during differentiation of innate immune cells and may play a role in the developmental processes of immune cells (Hensel et al., 2022). Soares et al. (2021) reported that the TASP1 gene was located in a window explaining 0.63% of the genetic variance for subclinical ketosis in first parity Holstein cows.
4.3 Study implications and limitations
Despite the limited sample size, this study provides novel information about the heritability and genetic architecture of blood cell traits in dairy cattle. Moreover, sometimes, large populations are not required to obtain strong signals in GWAS analyses of functional traits. Since CBC traits can be impacted by differences in animal health and management styles, these factors should be considered when evaluating CBC traits. The findings are important because they lay the groundwork for future research to evaluate the relationship of CBCs with other traits or identify the underlying causes of variation in these health traits in lactating Holstein cows. In U.S. dairy cattle, the average number of lactations is 2.8, and cows that remain in the herd longer usually have fewer health issues (Shabalina et al., 2019; Hu et al., 2021; Michigan State University Dairy Extension, 2022). Health disorders have a large expense (Bar et al., 2008; Gohary et al., 2016; Liang et al., 2017; Robcis et al., 2023), thus having a significant impact on the economic sustainability of the dairy industry. Moreover, as health directly impacts feed consumption, milk production (Siberski-Cooper et al., 2023), and the efficiency of an animal through nutrient partitioning (Lochmiller and Deerenberg, 2000; Horst et al., 2018; Brown and Bradford, 2021) and increases energy demands (Kvidera et al., 2017), it is worthwhile to examine the genetic relationship of CBCs with longevity, feed intake, and efficiency. Additional studies are needed to evaluate how baseline levels (i.e., normal circulating levels) of CBCs may impact the incidence and severity of illness in dairy cattle.
5 Conclusion
Genomic-based heritabilities for CBCs in lactating Holstein dairy cattle were similar to those previously reported in beef cattle. The GWAS results for CBC traits identified many potential candidate genes and overlapped with a host of known GWAS results for disease susceptibility and traits related to animal growth, efficiency, and production. Some of the candidate genes identified may play a role in the immune response (e.g., RDM1 and KANSL1) and the differentiation of RBCs (e.g., EPO, ABCG2, and HERC6). Given the lactation cycle of dairy cattle and the impact it has on immune response, future studies further investigating the relationship of CBC phenotypes with productive life and maintained production efficiency, including assays of cell type functionality, would be beneficial. This study indicates that CBC measures may be useful as proxies for improvement in health, resilience, and feed efficiency.
Data availability statement
The original contributions presented in the study are included in the article/Supplementary Materials; further inquiries can be directed to the corresponding author. Data will also be available in animal QTLdb from April 2024.
Ethics statement
The animal study was approved by the Institutional Animal Care and Use Committee. The study was conducted in accordance with the local legislation and institutional requirements.
Author contributions
CS-C: writing–original draft, writing–review and editing, data curation, formal analysis, and investigation. MM: writing–review and editing, data curation, and resources. PG: writing–review and editing and resources. LK: writing–review and editing and formal analysis. VB: writing–review and editing and formal analysis. JK: writing–review and editing, conceptualization, formal analysis, funding acquisition, investigation, project administration, resources, and supervision.
Funding
The author(s) declare that financial support was received for the research, authorship, and/or publication of this article. Funding was provided by the Foundation for Food and Agricultural Research (FFAR) and the Council for Dairy Cattle Breeding (CDCB) under project #CA18-SS-0000000236 Improving dairy feed efficiency, sustainability, and profitability by impacting farmers’ breeding and culling decisions, the Iowa Agriculture and Home Economics Experiment Station, Ames, Iowa (Project No. NRSP-8), the Hatch Act, and the State of Iowa. CS-C was also funded in part by a dairy graduate fellowship from Land O’ Lakes.
Conflict of interest
The authors declare that the research was conducted in the absence of any commercial or financial relationships that could be construed as a potential conflict of interest.
Publisher’s note
All claims expressed in this article are solely those of the authors and do not necessarily represent those of their affiliated organizations, or those of the publisher, the editors, and the reviewers. Any product that may be evaluated in this article, or claim that may be made by its manufacturer, is not guaranteed or endorsed by the publisher.
Supplementary material
The Supplementary Material for this article can be found online at: https://www.frontiersin.org/articles/10.3389/fgene.2024.1360295/full#supplementary-material
References
Ahn, J. W., Kim, H. S., Yoon, J., Jang, H., Han, S. M., Eon, S., et al. (2014). Identification of somatic mutations in EGFR/KRAS/ALK-negative lung adenocarcinoma in never-smokers. Genome Med. 6 (2), 18. doi:10.1186/gm535
American Cancer Society (2018). Signs and symptoms of acute myeloid leukemia (AML). Avaliable at: https://www.cancer.org/cancer/types/acute-myeloid-leukemia/detection-diagnosis-staging/signs-symptoms.html.
Aranday-Cortes, E., Hogarth, P. J., Kraveh, D. A., Whelan, A. O., Villarreal-Ramos, B., Lalvani, A., et al. (2012). Transcriptional profiling of disease-induced host responses in bovine tuberculosis and the identification of potential diagnostic biomarkers. PLOS ONE 7 (2), e30626. doi:10.1371/journal.pone.0030626
Bar, D., Tauer, L. W., Bennett, G., González, R. N., Hertl, J. A., Schukken, Y. H., et al. (2008). The cost of generic clinical mastitis in dairy cows as estimated by using dynamic programming. J. Dairy Sci. 91 (6), 2205–2214. doi:10.3168/jds.2007-0573
Berghof, T. V. L., Poppe, M., and Mulder, H. A. (2019). Opportunities to improve resilience in animal breeding programs. Front. Genet. 9, 692. doi:10.3389/fgene.2018.00692
Bhat, S. A., Elnaggar, M., Hall, T. J., McHugo, G. P., Reid, C., MacHugh, D. E., et al. (2023). Preferential differential gene expression within the WC1.1+ γδ T cell compartment in cattle naturally infected with Mycobacterium bovis. Front. Immunol. 14, 1265038. doi:10.3389/fimmu.2023.1265038
Bhatia, V., Stevens, T., Derks, M. F. L., Dunkelberger, J., Knol, E. F., Ross, J. W., et al. (2023). Identification of the genetic basis of sow pelvic organ prolapse. Front. Genet. 14, 1154713. doi:10.3389/fgene.2023.1154713
Blake, J. A., Baldarelli, R., Kadin, J. A., Richardson, J. E., Smith, C. L., Bult, C. J., et al. (2021). Mouse genome database (MGD): knowledgebase for mouse-human comparative biology. Nucleic Acids Res. 49 (D1), D981–D987. doi:10.1093/nar/gkaa1083
Brown, W. E., and Bradford, B. J. (2021). Invited review: mechanisms of hypophagia during disease. J. Dairy Sci. 104 (9), 9418–9436. doi:10.3168/jds.2021-20217
Cali, B., Deygas, M., Marcuzzi, E., Cassara, A., Toffali, L., Vetralla, M., et al. (2022). Atypical CXCL12 signaling enhances neutrophil migration by modulating nuclear deformability. Sci. Signal. 15, eabk2552. doi:10.1126/scisignal.abk2552
Cambier, S., Gouwy, M., and Proost, P. (2023). The chemokines CXCL8 and CXCL12: molecular and functional properties, role in disease and efforts towards pharmacological intervention. Cell. Mol. Immunol. 20, 217–251. doi:10.1038/s41423-023-00974-6
Chen, Y., Condro, C., Quinn, K., Herd, R. M., Parnell, P. F., and Vanselow, B. (2011). Global gene expression profiling reveals genes expressed differentially in cattle with high and low residual feed intake. Anim. Genet. 42, 475–490. doi:10.1111/j.1365-2052.2011.02182.x
Chen, Y., Sun, Z., and Zhong, T. (2019). RDM1 promotes critical processes in breast cancer tumorigenesis. J. Cell. Mol. Med. 23 (8), 5432–5439. doi:10.1111/jcmm.14425
Cheng, H., Fernando, R., and Garrick, D. (2018). “Jwas: Julia implementation of whole-genome analyses software,” in Proceedings of the 11th World Congress on Genetics Applied to Livestock Production, Auckland, New Zealand, 11-16 February 2018 (Feed the Future Innovation Labs Annual Meeting).
Chevrier, S., and Corcoran, L. M. (2014). BTB-ZF transcription factors, a growing family of regulators of early and late B-cell development. Immunol. Cell. Biol. 92, 481–488. doi:10.1038/icb.2014.20
Chinchilla-Vargas, J., Kramer, L. M., Tucker, J. D., Hubbel, D. S., Powel, J. G., Lester, T. D., et al. (2020). Genetic basis of blood-based traits and their relationship with performance and environment in beef cattle at weaning. Front. Genet. 11, 717. doi:10.3389/fgene.2020.00717
Chowdhury, D., and Lieberman, J. (2008). Death by a thousand cuts: granzyme pathways of programmed cell death. Annu. Rev. Immunol. 26, 389–420. doi:10.1146/annurev.immunol.26.021607.090404
Cohen-Zinder, M., Seroussi, E., Larkin, D. M., Loor, J. J., Everts-van der Wind, A., Lee, J. H., et al. (2005). Identification of a missense mutation in the bovine ABCG2 gene with a major effect on the QTL on chromosome 6 affecting milk yield and composition in Holstein cattle. Genome Res. 15 (7), 936–944. doi:10.1101/gr.3806705
Cullen, S. P., Brunet, M., and Martin, S. J. (2010). Granzymes in cancer and immunity. Cell Death Differ. 17 (4), 616–623. doi:10.1038/cdd.2009.206
Cunningham, F., Allen, J. E., Allen, J., Alvarez-Jarreta, J., Amode, M. R., Armean, I. M., et al. (2022). Ensembl 2022. Nucleic Acids Res. 50 (D1), D988–D995. doi:10.1093/nar/gkab1049
Denholm, S. J., McNeilly, T. N., Banos, G., Coffey, M. P., Russell, G. C., Bagnall, A., et al. (2017). Estimating genetic and phenotypic parameters of cellular immune-associated traits in dairy cows. J. Dairy Sci. 100 (4), 2850–2862. doi:10.3168/jds.2016-11679
Desuzinges-Mandon, E., Arnaud, O., Martinez, L., Huché, F., Di Pietro, A., and Falson, P. (2010). ABCG2 transports and transfers heme to albumin through its large extracellular loop. J. Biol. Chem. 285 (43), 33123–33133. doi:10.1074/jbc.M110.139170
Fang, L., Lin, W., Jia, H., Gao, X., Sui, X., Guo, X., et al. (2020). Potential diagnostic value of the peripheral blood mononuclear cell transcriptome from cattle with bovine tuberculosis. Front. Vet. Sci. 7, 295. doi:10.3389/fvets.2020.00295
Fejzo, M. S., Chen, H., Anderson, L., McDermott, M. S. J., Karlan, B., Konecny, G. E., et al. (2020). Analysis in epithelial ovarian cancer identifies KANSL1 as a biomarker and target gene for immune response and HDAC inhibition. Gynecol. Oncol. 160 (2), 539–546. doi:10.1016/j.ygyno.2020.11.008
Fernando, R., Toosi, A., Wolc, A., Garrick, D., and Dekkers, J. (2017). Application of whole-genome prediction methods for genome-wide association studies: a bayesian approach. J. Agric. Biol. Environ. Stat. 22, 172–193. doi:10.1007/s13253-017-0277-6
Gohary, K., Overton, M. W., Von Massow, M., LeBlanc, S. J., Lissemore, K. D., and Duffield, T. F. (2016). The cost of a case of subclinical ketosis in Canadian dairy herds. Can. Vet. J. 57 (7), 728–732.
Guo, H., Chen, W., Ming, J., Zhong, R., Yi, P., Zhu, B., et al. (2015). Association between polymorphisms in cdc27 and breast cancer in a Chinese population. Tumour Biol. 36 (7), 5299–5304. doi:10.1007/s13277-015-3190-z
Gupta, S., Belle, V. S., Rajashekhar, R. K., Jogi, S., and Prabhu, R. V. K. (2018). Correlation of red blood cell acetylcholinesterase enzyme activity with various RBC indices. Indian J. Clin. biochem. 33 (4), 445–449. doi:10.1007/s12291-017-0691-0
Hamimes, S., Arakawa, H., Stasiak, A. Z., Kierzek, A. M., Hirano, S., Yang, Y., et al. (2005). RDM1, a novel RNA recognition motif (RRM)-containing protein involved in the cell response to cisplatin in vertebrates. J. Biol. Chem. 280 (10), 9225–9235. doi:10.1074/jbc.M412874200
Hamimes, S., Bourgeon, D., Stasiak, A. Z., Staiak, A., and Van Dyck, E. (2006). Nucleic acid-binding properties of the RRM-containing protein RDM1. Biochem. Biophys. Res. Commun. 344 (1), 87–94. doi:10.1016/j.bbrc.2006.03.154
Hasankhani, A., Bahrami, A., Sheybani, N., Fatehi, F., Abadeh, R., Ghaem Maghami Farahani, H., et al. (2021). Integrated network analysis to identify key modules and potential hub genes involved in bovine respiratory disease: a systems biology approach. Front. Genet. 12, 753839. doi:10.3389/fgene.2021.753839
Hensel, A., Stahl, P., Moews, L., König, L., Patwardhan, R., Höing, A., et al. (2022). The Taspase1/Myosin1f-axis regulates filopodia dynamics. iScience 25, 104355. doi:10.1016/j.isci.2022.104355
Hideshima, T., Cottini, F., Nozawa, Y., Seo, H. S., Ohguchi, H., Samur, M. K., et al. (2017). P53-related protein kinase confers poor prognosis and represents a novel therapeutic target in multiple myeloma. Blood 129 (10), 1308–1319. doi:10.1182/blood-2016-09-738500
Horst, E. A., Kvidera, S. K., Al-Qaisi, M., Abeyta, M. A., Rhoads, R. P., and Baumgard, L. H. (2018). “Energy cost of inflammation in dairy cows,” in Tri-state dairy nutrition conference (Tri-State Dairy), 65–76.
Hu, H., Mu, T., Ma, Y., Wang, X., and Ma, Y. (2021). Analysis of longevity traits in Holstein cattle: a review. Front. Genet. 12, 695543. doi:10.3389/fgene.2021.695543
Hu, Z., Park, C. A., and Jreecy, J. M. (2022). Bringing the Animal QTLdb and CorrDB into the future: meeting new challenges and providing updated services. Nucleic Acids Res. 50 (D1), D956–D961. doi:10.1093/nar/gkab1116
Ijaz, S. H., Jamal, S. M., and Qayyum, R. (2018). Relationship between thyroid hormone levels and mean platelet count and volume: quantitative assessment. Quant. Assess. Cureus. 10 (10), e3421. doi:10.7759/cureus.3421
Isles, H. M., Herman, K. D., Robertson, A. L., Loynes, C. A., Prince, L. R., Elks, P. M., et al. (2019). The CXCL12/CXCR4 signaling Axis retains neutrophils at inflammatory sites in zebrafish. Front. Immunol. 10, 1784. doi:10.3389/fimmu.2019.01784
Jelkmann, W. (1992). Erythropoietin: structure, control of production, and function. Physiol. Rev. 72 (2), 449–489. doi:10.1152/physrev.1992.72.2.449
Kizilkaya, K., Fernando, R. L., and Garrick, D. J. (2010). Genomic prediction of simulated multibreed and purebred performance using observed fifty thousand single nucleotide polymorphism genotypes. J. Anim. Sci. 88, 544–551. doi:10.2527/JAS.2009-2064
König, S., and May, K. (2019). Invited review: phenotyping strategies and quantitative-genetic background of resistance, tolerance and resilience associated traits in dairy cattle. Animal 13 (5), 897–908. doi:10.1017/S1751731118003208
Kvidera, S. K., Horst, E. A., Abuajamieh, M., Mayorga, E. J., Sanz Fernandez, M. V., and Baumgard, L. H. (2017). Glucose requirements of an activated immune system in lactating Holstein cows. J. Dairy Sci. 100 (3), 2360–2374. doi:10.3168/jds.2016-12001
Lam, S. Y., Tipoe, G. L., and Fung, M. L. (2009). Upregulation of erythropoietin and its receptor expression in the rat carotid body during chronic and intermittent hypoxia. Adv. Exp. Med. Biol. 648, 207–214. doi:10.1007/978-90-481-2259-2_24
Leach, R. J., Chitko-McKown, C. G., Bennett, G. L., Jones, S. A., Kachman, S. D., Keele, J. W., et al. (2013). The change in differing leukocyte populations during vaccination to bovine respiratory disease and their correlations with lung scores, health records, and average daily gain. J. Anim. Sci. 91, 3564–3573. doi:10.2527/jas.2012-5911
Li, W., Huang, Q., Sun, D., Zhang, G., and Tan, J. (2017). RDM1 gene overexpression represents a therapeutic target in papillary thyroid carcinoma. Endocr. Connect. 6 (8), 700–707. doi:10.1530/EC-17-0209
Liang, D., Arnold, L. M., Stowe, C. J., Harmon, R. J., and Bewley, J. M. (2017). Estimating US dairy clinical disease costs with a stochastic simulation model. J. Dairy Sci. 100 (2), 1472–1486. doi:10.3168/jds.2016/11565
Lieberman, J. (2010). Granzyme A activates another way to die. Immunol. Rev. 235 (1), 93–104. doi:10.1111/j.0105-2896.2010.00902.x
Lindholm-Perry, A. K., Cunningham, H. C., Kuehn, L. A., Vallet, J. L., Keele, J. W., Foote, A. P., et al. (2017). Relationships between the genes expressed in the mesenteric adipose tissue of beef cattle and feed intake and gain. Anim. Genet. 48, 386–394. doi:10.1111/age.12565
Lochmiller, R. L., and Deerenberg, C. (2000). Trade-offs in evolutionary immunology: just what is the cost of immunity? Oikos 88, 87–98. doi:10.1034/j.1600-0706.2000.880110.x
Mallikarjunappa, S., Sargolzaei, M., Brito, L. F., Meade, K. G., Karrow, N. A., and Pant, S. D. (2018). Short communication: uncovering quantitative trait loci associated with resistance to Mycobacterium avium ssp. paratuberculosis infection in Holstein cattle using a high-density single nucleotide polymorphism panel. J. Dairy Sci. 101 (8), 7280–7286. doi:10.3168/jds.2018-14388
Mamoor, S. (2020). The transcription factor ZBTB43 is differentially expressed and transcriptionally induced in models of coronavirus infection. OSF Prepr. doi:10.31219/osf.io/jhnfv
Maragno, A. L., Pironin, M., Alcalde, H., Cong, X., Knobeloch, K. P., Tangy, F., et al. (2011). ISG15 modulates development of the erythroid lineage. PLoS One 6 (10), e26068. doi:10.1371/journal.pone.0026068
Mayo Clinic (2023). Multiple myeloma Mayo foundation for medical education and research. Avaliable at: https://www.mayoclinic.org/diseases-conditions/multiple-myeloma/symptoms-causes/syc-20353378.
Merter, M., Sahin, U., Uysal, S., Dalva, K., and Yuksel, M. K. (2023). Role of large unstained cells in predicting successful stem cell collection in autologous stem cell transplantation. Transfus. Apher. Sci. 62 (2), 103517. doi:10.1016/j.transci.2022.103517
Messaoudi, L., Yang, Y., Kinomura, A., Stavreva, D. A., Yan, G., Bortolin-Cavaillé, M., et al. (2007). Subcellular distribution of human RDM1 protein isoforms and their nucleolar accumulation in response to heat shock and proteotoxic stress. Nucleic Acids Res. 35 (19), 6571–6587. doi:10.1093/nar/gkm753
Metzemaekers, M., Gouwy, M., and Proost, P. (2020). Neutrophil chemoattractant receptors in health and disease: double-edged swords. Cell. Mol. Immunol. 17, 433–450. doi:10.1038/s41423-020-0412-0
Mpetile, Z., Young, J. M., Gabler, N. K., Dekkers, J. C. M., and Tuggle, C. K. (2015). Assessing peripheral blood cell profile of Yorkshire pigs divergently selected for residual feed intake. J. Anim. Sci. 93, 892–899. doi:10.2527/jas.2014-8132
MSU Extension Dairy (2023). What is the buzz around cow longevity? Michigan state university. Avaliable at: www.canr.msu.edu/news/what-is-the-buzz-around-cow-longevity#:∼:text=The%20current%20average%20number%20of.
Nai, A., Lidonnici, M. R., Rausa, M., Mandelli, G., Pagani, A., Silvestri, L., et al. (2015). The second transferrin receptor regulates red blood cell production in mice. Blood 125 (7), 1170–1179. doi:10.1182/blood-2014-08-596254
Niizuma, H., Cheng, E. H., and Hsieh, J. J. (2015). Taspase 1: a protease with many biological surprises. Mol. Cell. Oncol. 2 (4), e999513. doi:10.1080/23723556.2014.999513
Ogle, M. E., Segar, C. E., Sridhar, S., and Botchwey, E. A. (2016). Monocytes and macrophages in tissue repair: implications for immunoregenerative biomaterial design. Exp. Biol. Med. 241 (10), 1084–1097. doi:10.1177/1535370216650293
Ono, R., Masuya, M., Ishii, S., Katayama, N., and Nosaka, T. (2017). Eya2, a target activated by plzf, is critical for PLZF-RARA-induced leukemogenesis. Mol. Cel. Biol. 37 (13), 005855–e616. doi:10.1128/MCB.00585-16
Plummer, M., Best, N., Cowles, K., and Vines, K. (2015). Package ‘coda. Avaliable at: https://cran.r-project.org/web/packages/coda/coda.pdf (Accessed September 25, 2023).
Qi, F., Li, Y., Yang, X., Wu, Y., Lin, L., and Liu, X. (2020). Hsa_circ_0044226 knockdown attenuates progression of pulmonary fibrosis by inhibiting CDC27. Aging 12 (14), 14808–14818. doi:10.18632/aging.103543
Qiu, C., Li, Z., Cao, W., Cai, X., Ye, L., Zhang, C., et al. (2021). Correlation analysis of RDM1 gene with immune infiltration and clinical prognosis of hepatocellular carcinoma. Biosci. Rep. 41 (9), BSR20203978. doi:10.1042/BSR20203978
Robcis, R., Ferchiou, A., Berrada, M., Ndiaye, Y., Herman, N., Lhermie, G., et al. (2023). Cost of lameness in dairy herds: an integrated bioeconomic modeling approach. J. Dairy Sci. 106 (4), 2519–2534. doi:10.3168/jds.2022-22446
Rocnik, E. F., Liu, P., Sato, K., Walsh, K., and Vaziri, C. (2006). The novel SPARC family member SMOC-2 potentiates angiogenic growth factor activity. J. Biol. Chem. 281 (32), 22855–22864. doi:10.1074/jbc.M513463200
Roland, L., Drillich, M., and Iwersen, M. (2014). Hematology as a diagnostic tool in bovine medicine. J. Vet. Diagn. Invest. 26 (5), 592–598. doi:10.1177/1040638714546490
Sathyanarayana, P., Dev, A., Pradeep, A., Ufkin, M., Licht, J. D., and Wojchowski, D. M. (2012). Spry1 as a novel regulator of erythropoiesis, EPO/EPOR target, and suppressor of JAK2. Blood 119 (23), 5522–5531. doi:10.1182/blood-2011-11-392571
Sayers, E. W., Bolton, E. E., Brister, J. R., Canese, K., Chan, J., Comeau, D. C., et al. (2022). Database resources of the national center for biotechnology information. Nucleic Acids Res. 50 (D1), D20–D26. doi:10.1093/nar/gkab1112
Schuster, S. J., Badiavas, E. V., Costa-Giomi, P., Weinmann, R., Erslev, A. J., and Caro, J. (1989). Stimulation of erythropoietin gene transcription during hypoxia and cobalt exposure. Blood 73 (1), 13–16. doi:10.1182/blood.v73.1.13.bloodjournal73113
Scott, M. A., Woolums, A. R., Swiderski, C. E., Thompson, A. C., Perkins, A. D., Nanduri, B., et al. (2022). Use of nCounter mRNA profiling to identify at-arrival gene expression patterns for predicting bovine respiratory disease in beef cattle. BMC Vet. Res. 18 (1), 77. doi:10.1186/s12917-022-03178-8
Shabalina, T., Yin, T., and König, S. (2019). Influence of common health disorders on the length of productive life and stayability in German Holstein cows. J. Dairy Sci. 103 (1), 583–596. doi:10.3168/jds.2019-16985
Shang, S., Zhou, Y., Chen, K., Chen, L., Li, P., Li, D., et al. (2022). A novel gene CDC27 causes SLE and is associated with the disease activity. Front. Immunol. 13, 876963. doi:10.3389/fimmu.2022.876963
Shi, C., and Pamer, E. (2011). Monocyte recruitment during infection and inflammation. Nat. Rev. Immunol. 11, 762–774. doi:10.1038/nri3070
Siberski-Cooper, C. J., Mayes, M. S., Gorden, P. J., Hayman, K., Hardie, L., Shonka-Martin, B. N., et al. (2023). The impact of health disorders on automated sensor measures and feed intake in lactating Holstein dairy cattle. Front. Anim. Sci. 3, 1064205. doi:10.3389/fanim.2022.1064205
Siberski-Cooper, C. J., Mayes, M. S., Healey, M., Goetz, B. M., Baumgard, L. H., and Koltes, J. E. (2022). Associations of wearable sensor measures with feed intake, production traits, lactation, and environmental parameters impacting feed efficiency in dairy cattle. Front. Anim. Sci. 3, 841797. doi:10.3389/fanim.2022.841797
Siegel, R. J., Singh, A. K., Panipinto, P. M., Shaikh, F. S., Vinh, J., Han, S. U., et al. (2022). Extracellular sulfatase-2 is overexpressed in rheumatoid arthritis and mediates the TNF-α-induced inflammatory activation of synovial fibroblasts. Cell. Mol. Immunol. 19 (10), 1185–1195. doi:10.1038/s41423-022-00913-x
Soares, R. A. N., Vargas, G., Duffield, T., Schenkel, F., and Squires, E. J. (2021). Genome-wide association study and functional analyses for clinical and subclinical ketosis in Holstein cattle. J. Dairy Sci. 104 (9), 10076–10089. doi:10.3168/jds.2020-20101
Sousa Junior, L. P. B., Pinto, L. F. B., Cruz, V. A. R., Oliveira Junior, G. A., Oliveira, H. R., Chud, T. S., et al. (2023). Genome-wide association and functional genomic analyses for various hoof health traits in North American Holstein cattle. J. Dairy Sci. doi:10.3168/jds.2023-23806
Stelzer, G., Rosen, N., Plaschkes, I., Zimmerman, S., Twik, M., Fishilevich, S., et al. (2016). The GeneCards suite: from gene data mining to disease genome sequence analyses. Curr. Protoc. Bioinforma. 54, 1. doi:10.1002/cpbi.5
Tizioto, P. C., Kim, J., Seabury, C. M., Schnabel, R. D., Gershwin, L. J., Van Eenennaam, A. L., et al. (2015). Immunological response to single pathogen challenge with agents of the bovine respiratory disease complex: an RNA-sequence analysis of the bronchial lymph node transcriptome. PLOS ONE 10 (6), e0131459. doi:10.1371/journal.pone.0131459
Tong, L., Cao, W., Sheng, J., Zhu, E., Yu, Y., Zhong, T., et al. (2020). RDM1 plays an oncogenic role in human ovarian carcinoma cells. Artif. Cells Nanomed. Biotechnol. 48 (1), 885–892. doi:10.1080/21691401.2020.1770267
Vedi, M., Smith, J. R., Hayman, G. T., Tutaj, M., Brodie, K. C., De Pons, J. L., et al. (2023). 2022 updates to the rat genome database: a findable, accessible, interoperable, and reusable (FAIR) resource. Genetics 224 (1), iyad042. doi:10.1093/genetics/iyad042
Wang, B., Jia, X., Yao, Q., Li, Q., He, W., Li, L., et al. (2019). CEP128 is a crucial risk locus for autoimmune thyroid diseases. Mol. Cell. Endocrinol. 480, 97–106. doi:10.1016/j.mce.2018.10.017
Wang, Z. L., Liu, Y., Zhou, Y. L., Li, J. L., Sun, Q. Y., Wu, L. X., et al. (2020). Osteoclast stimulatory transmembrane protein (OC-STAMP) is a promising molecular prognostic indicator for multiple myeloma. Eur. J. Haematol. 105 (2), 185–195. doi:10.1111/ejh.13425
Xin, Y., Ning, S., Zhang, L., and Cui, M. (2018). CDC27 facilitates gastric cancer cell proliferation, invasion and metastasis via twist-induced epithelial-mesenchymal transition. Cell Physiol. biochem. 50 (2), 501–511. doi:10.1159/000494164
Xu, G., Du, J., Wang, F., Zhang, F., Hu, R., Sun, D., et al. (2018). RAD52 motif-containing protein 1 promotes non-small cell lung cancer cell proliferation and survival via cell cycle regulation. Oncol. Rep. 40 (2), 833–840. doi:10.3892/or.2018.6459
Xu, M. L., Luk, W. K. W., Liu, E. Y. L., Kong, X. P., Wu, Q. Y., Xia, Y. J., et al. (2019). Differentiation of erythroblast requires the dimeric form of acetylcholinesterase: interference with erythropoietin receptor. Chem.-Biol. Interact. 308, 317–322. doi:10.1016/j.cbi.2019.06.006
Zhou, L., Peng, F., Li, J., and Gong, H. (2023). Exploring novel biomarkers in dilated cardiomyopathy-induced heart failure by integrated analysis and in vitro experiments. Exp. Ther. Med. 26 (1), 325. doi:10.3892/etm.2023.12024
Zhou, S., Zong, Y., Ney, P. A., Nair, G., Stewart, C. F., and Sorrentino, B. P. (2005). Increased expression of the Abcg2 transporter during erythroid maturation plays a role in decreasing cellular protoporphyrin IX levels. Blood 105 (6), 2571–2576. doi:10.1182/blood-2004-04-1566
Zhu, J. J., Stenfeldt, C., Bishop, E. A., Canter, J. A., Eschbaumer, M., Rodriguez, L. L., et al. (2020). Mechanisms of maintenance of foot-and-mouth disease virus persistence inferred from genes differentially expressed in nasopharyngeal epithelia of virus carriers and non-carriers. Front. Vet. Sci. 7, 340. doi:10.3389/fvets.2020.00340
Keywords: dairy cattle, complete blood counts, genome-wide association study, candidate genes, heritability
Citation: Siberski-Cooper CJ, Mayes MS, Gorden PJ, Kramer L, Bhatia V and Koltes JE (2024) The genetic architecture of complete blood counts in lactating Holstein dairy cows. Front. Genet. 15:1360295. doi: 10.3389/fgene.2024.1360295
Received: 22 December 2023; Accepted: 04 March 2024;
Published: 27 March 2024.
Edited by:
Eduard Murani, Research Institute for Farm Animal Biology, GermanyReviewed by:
Marta Alonso-Hearn, Basque Research and Technology Alliance (BRTA), SpainSamuele Bovo, University of Bologna, Italy
Copyright © 2024 Siberski-Cooper, Mayes, Gorden, Kramer, Bhatia and Koltes. This is an open-access article distributed under the terms of the Creative Commons Attribution License (CC BY). The use, distribution or reproduction in other forums is permitted, provided the original author(s) and the copyright owner(s) are credited and that the original publication in this journal is cited, in accordance with accepted academic practice. No use, distribution or reproduction is permitted which does not comply with these terms.
*Correspondence: James E. Koltes, jekoltes@iastate.edu