 Li Yang
 Shuai Zhang
 Dake Chu
 Xumei Wang
- 1Department of Gastroenterology, The First Affiliated Hospital of Xi’an Jiaotong University, Xi’an, China
- 2School of Pharmacy, Xi’an Jiaotong University, Xi’an, China
- 3College of Horticulture, Shanxi Agricultural University, Jinzhong, China
Chalcone synthase (CHS) is a key enzyme that catalyzes the first committed step of flavonoid biosynthetic pathway. It plays a vital role not only in maintaining plant growth and development, but also in regulating plant response to environmental hazards. However, the systematic phylogenomic analysis of CHS gene family in a wide range of plant species has not been reported yet. To fill this knowledge gap, a large-scale investigation of CHS genes was performed in 178 plant species covering green algae to dicotyledons. A total of 2,011 CHS and 293 CHS-like genes were identified and phylogenetically divided into four groups, respectively. Gene distribution patterns across the plant kingdom revealed the origin of CHS can be traced back to before the rise of algae. The gene length varied largely in different species, while the exon structure was relatively conserved. Selection pressure analysis also indicated the conserved features of CHS genes on evolutionary time scales. Moreover, our synteny analysis pinpointed that, besides genome-wide duplication and tandem duplication, lineage specific transposition events also occurred in the evolutionary trajectory of CHS gene family. This work provides novel insights into the evolution of CHS gene family and may facilitate further research to better understand the regulatory mechanism of traits relating to flavonoid biosynthesis in diverse plants.
1 Introduction
Flavonoids are important secondary metabolites due to their biological and pharmacological activities. They are composed of more than 7000 compounds, each containing a C6-C3-C6 carbon skeleton derived from phenylalanine (Wang et al., 2018; Shen et al., 2022). Flavonoids are not only the main components determining the color of flowers and fruits, but also play essential roles in phytohormone transport and plant resistance to various biotic and abiotic stresses (Peer and Murphy, 2007; Mierziak et al., 2014; Iwashina, 2015). Besides, due to their antibacterial, anti-inflammatory, analgesic, and antipyretic properties, flavonoids are considered as natural antioxidants with multiple benefits for the health of human beings (Hoensch and Oertel, 2015).
Chalcone synthase (CHS) is the first enzyme reported to be involved in the initial committed step of flavonoid biosynthetic pathway. It catalyzes the condensation reaction of p-coumaroyl-CoA and three malonyl CoA molecules to produce phenyl styrene ketone (chalcone), the precursor of various flavonoid derivatives (Koes et al., 1994; Zhang et al., 2017). CHS enzyme is a member belonging to the plant-specific type III polyketide synthase (PKS) superfamily (Austin and Noel, 2003). It functions as a 40-45 kDa protein homodimers with two independent active sites (Jiang et al., 2008). Members of the CHS family have high similarity in amino acid sequences, with each consisting of two conserved structural domains and a catalytic center composed of four residues, Cys-His-Asn-Phe (Ferrer et al., 1999).
In plants, CHS genes have been reported to be involved in a wide range of physiological and biological processes. An earlier research showed that CitCHS2 had a strong regulatory impact on the accumulation of flavonoids in citrus cell cultures (Moriguchi et al., 1999). This conclusion was undoubtedly correct, as revealed by the functional study of CHS gene family members in citrus by Wang et al. (2018), and the correlation analysis between CHS activity and contents of flavonoid pigments by Li et al. (2016). Multiple studies have also documented that the transcript levels of CHS genes play important roles in plant response to high temperature stress (Correia et al., 2014; Glagoleva et al., 2019), and light treatment (Zoratti et al., 2014). In addition, the mutation or abnormal expression of CHS genes was reported to be associated with male sterility in different plants, such as petunia, radish, and cotton (Napoli et al., 1999; Yang et al., 2008; Kong et al., 2020).
Genome-wide analyses of CHS gene family have been performed in various plant species, such as citrus (Wang et al., 2018), soybean (Anguraj Vadivel et al., 2018), Salvia miltiorrhiza (Deng et al., 2018), cotton (Kong et al., 2020), eggplant (Wu et al., 2020), Zostera marina (Ma et al., 2021), and Chrysanthemum nankingense (Zhu et al., 2022). Most of these studies focused on the identification and characterization of CHS homologs within a specific species, as well as gene expression profiles in diverse tissues/stages or under different treatments. For example, eight CHS genes were identified in Salvia miltiorrhiza, and they showed tissue-specific expression patterns and differential transcriptional responses to MeJA treatment (Deng et al., 2018). Despite these advances, the genomic architecture of CHS family in the evolutionary trajectories has not yet been investigated.
With the availability of numerous sequenced genomes and the development of bioinformatic tools, such as the synteny network approach for large-scale synteny computation by Zhao and Schranz (2017), large-scale phylogenomic analyses (combined phylogenetic and synteny analysis) are widely used in studying the genetics and the evolution of complex gene families (Zhao et al., 2017; Kerstens et al., 2020). To gain insights into how CHS gene family evolved, we performed a comprehensive phylogenomic analysis of CHS genes from 178 plant species covering green algae to dicotyledons. Our results revealed the early origin of this gene family across the plant kingdom. Selection pressure analysis pinpointed out the conserved features of CHS genes on evolutionary time scales. In addition, the phylogeny, gene structure, protein characteristics, and synteny network were systematically investigated. This work broadens our understanding of the evolution of CHS gene family and provides compelling opportunities for further functional studies on flavonoid biosynthesis.
2 Materials and methods
2.1 Identification of CHS family members
A set of 178 plant genomes, basically from Pancaldi et al. (2022), was used for analysis in this study (Supplementary Table S1). Information of species taxonomic classification was obtained from Angiosperm Phylogeny Website (APG) and NCBI databases (Leebens-Mack et al., 2019). Species tree was constructed by ETE 3.1.1 and subsequently visualized in iTOL v5 (Huerta-Cepas et al., 2016; Letunic and Bork, 2021).
Two different methods were employed to identify CHS family members. Four amino acid sequences of Arabidopsis thaliana CHS genes were firstly used as queries to search against the protein databases of 178 plant genomes using BLAST 2.14.0 with an e-value of 1e-2 (Camacho et al., 2009). Obtained protein sequences were then aligned using MAFFT v7 (Katoh et al., 2019; Supplementary MaterialS1, 2), followed by gap filtering in trimAl 1.2rev59 with parameters gt 0.8, st 0.001, and cons 60 (Capella-Gutiérrez et al., 2009). Filtered multiple sequence alignment (MSA) was finally used to construct maximum likelihood tree in FastTree 2.1.11 (Price et al., 2010). Tree branches containing query sequences and conforming to evolutionary relationships were retained, and gene hits on the branches were considered as candidate homologs. In parallel, the Hidden Markov Model (HMM) profiles of Chal_sti_synt_C (PF00195) and Chal_sti_synt_N (PF02797) domains were downloaded from Pfam database (http://pfam.xfam.org/), and were used to construct CHS HMM using hmmbuild implemented in HMMER 3.3.2 (Finn et al., 2011). The specific CHS HMM files were subsequently employed as inputs to search against aforementioned protein databases using hmmsearch. The resulting outputs were then mutually verified with the results of BLAST search. Finally, only hits that contain both Chal_sti_synt_C and Chal_sti_synt_N domains were designated as true CHS homologs, while those containing either of two domains were considered as CHS-like homologs.
2.2 Phylogenomic analysis and gene classification
Amino acid sequences of 2,011 CHS and 293 CHS-like genes were identified and used for phylogeny analysis and classification. Gene names were represented by adding abbreviated species prefix to the original names. The evolutionary trees of CHS and CHS-like genes were rooted in XP_005651931.1 and XP_005650884.1, homologs from Coccomyxa subellipsoidea, the early-branching lineage of Chlorophyta, respectively. MSA was obtained by using MAFFT v7.520 with default settings (Katoh et al., 2019), followed by the filtration of gap columns using trimAl 1.2rev59 (Capella-Gutiérrez et al., 2009). Subsequently, IQ-TREE v2.2.2.9 was employed to construct maximum-likelihood tree with the parameters of model MFP and bootstrap replicates 1,000 (Nguyen et al., 2015). Webtool iTOL v5 was used for the final visualization of phylogeny trees (Letunic and Bork, 2021).
2.3 Gene structure and protein characteristic analysis
Gene structure information of CHS/CHS-like genes in every species was parsed from the corresponding GFF3 files using an in-house Perl script. Gene length, CDS number, and CDS length were indicated by mean values when multiple gene copies were presented in one species. Protein characteristics, including molecular weight (MW), isoelectric point (pI), and hydropathicity (GRAVY), were predicted using online website (http://www.detaibio.com/sms2/).
2.4 Selection pressure analysis
Homologous gene pairs were firstly identified in each representative species using reciprocal BLASTP with the threshold of identity >50%. Nucleotide and amino acid sequences per genome were aligned by MAFFT v7.520 (Katoh et al., 2019), and the ratio of nonsynonymous substitutions (Ka) to synonymous substitutions (Ks) of each homologous pair was estimated by KaKs_Calculator implemented in ParaAT2.0 (Wang et al., 2010; Zhang et al., 2012). Ka/Ks values <1 represents negative or purifying selection, while Ka/Ks values >1 is regarded as positive selection.
2.5 Synteny network construction and clustering
Pair-wise comparisons of protein sequences from 178 plant genomes were conducted by software Diamond v2.0.11.149 (Buchfink et al., 2015). The top five hits of each genome were recruited as inputs to detect syntenic blocks using MCScanX, with a minimum match size of three and a maximum gap of 25 (Wang et al., 2012). The outputs formed a synteny network across 178 genomes, among which nodes represent genes and edges indicate syntenic relationships between genes. Edges with two CHS/CHS-like genes were extracted by Shell script and designated as CHS/CHS-like synteny network, which was graphically represented in Gephi v0.9.2 (Bastian et al., 2009). Synteny clusters were identified by executing the Infomap function in R package igraph (Rosvall and Bergstrom, 2008), and those containing at least three nodes were retained and visualized in Cytoscape v3.8.2 (Shannon et al., 2003). Profiling of species and node numbers within each cluster was investigated using an in-house R script. This was followed by cluster dissimilarity computation using Jaccard method and hierarchical clustering using ward. D (Dixon, 2003; Kolde, 2012). Collinear connections between gene nodes were graphically shown in evolutionary trees using iTOL v5 (Letunic and Bork, 2021).
3 Results
3.1 Genome-wide identification of CHS/CHS-like genes in plants
A group of 178 genomes from different plant species (Supplementary Table S1) (Pancaldi et al., 2022), with a range from Chlorophyta to flowering plants, was collected for genome-wide identification of CHS gene family. A total of 2,011 CHS homologous genes was detected in 162 genomes (Figure 1; Supplementary Tables S2-S4), with 12.4 members per genome on average. The coefficient of variation (CV) of the CHS copy number was 80%, much higher than what is found in the conserved gene family such as CesA (40%) (Pancaldi et al., 2022). This difference could be largely explained by diverse functional characteristics. CHS genes, playing a role in the biosynthesis of secondary metabolites (Ma et al., 2021), tend to have higher variability as a result of evolutionary adaption to abiotic and biotic stresses. In addition, we also identified 293 CHS-like genes in 98 genomes (∼3 per genome, CV = 189%, Figure 1; Supplementary Tables S2-S4). The copy number of CHS/CHS-like genes was found to correlate with the ploidy level (cor = 0.45/0.43, p < 0.001 for both, Supplementary Figure S1), but not with the number of genome duplications in each species (cor = 0.08/0.03, p > 0.01 for both, Supplementary Figure S2). This result implies that other factors, such as local gene duplications and gene losses, also impact the size of CHS and CHS-like gene families during evolution.
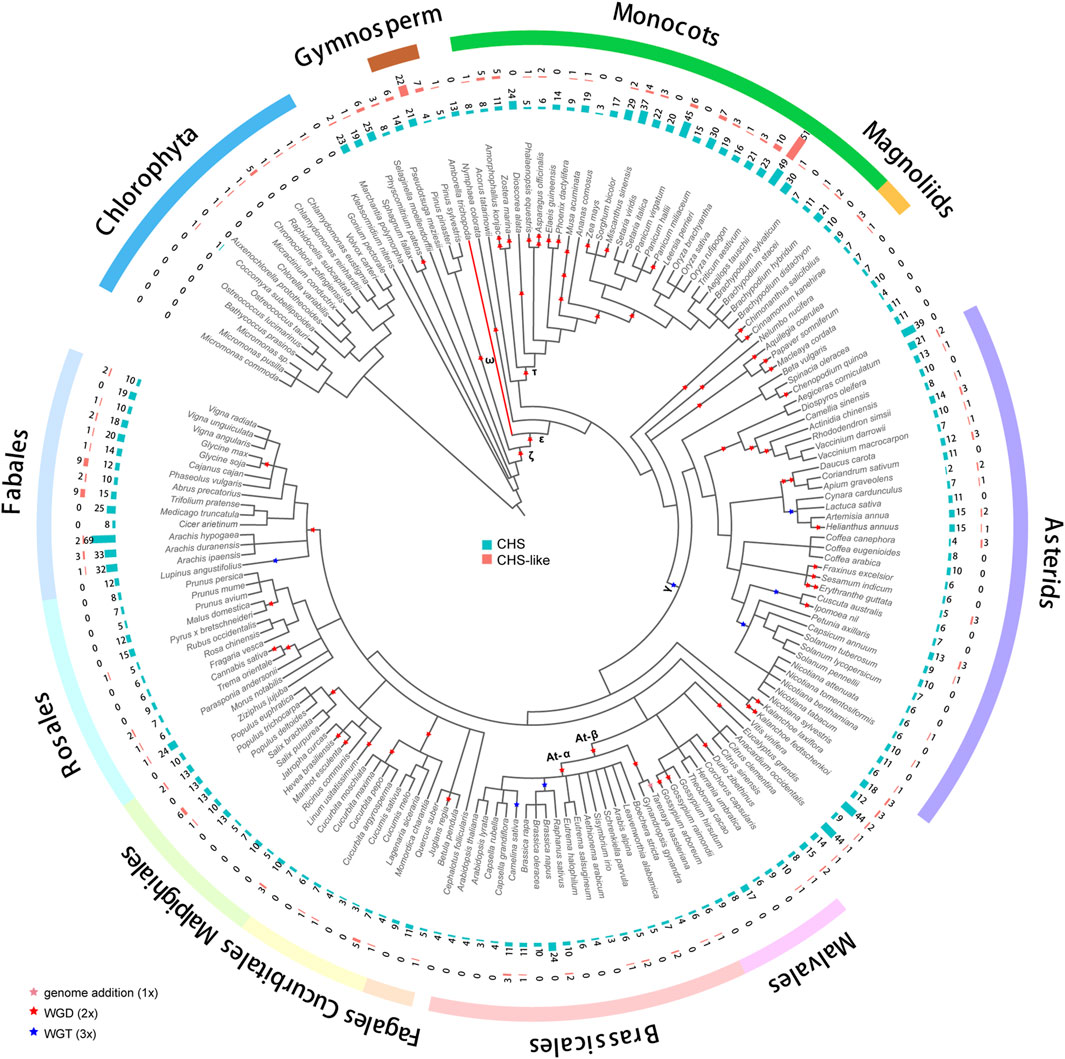
Figure 1. Distribution of CHS and CHS-like genes across 178 plant genomes. The genome duplication events are inferred from earlier studies (Zhao et al., 2017; Gao et al., 2020; Kerstens et al., 2020; Liu et al., 2022; Ma et al., 2022; Hoang et al., 2023). Pink, red, and blue stars represent known genome addition, WGD, and WGT events, respectively. Clades of species belonging to Fabales, Rosales, Malpighiales, Cucurbitales, Fagales, Brassicales, Malvales, Asterids, Magnoliids, Monocots, Gymnosperm, and Chlorophyta are color-coded. The basal angiosperm Amborella trichopoda is indicated with a red branch. The bar plots from inner to outer layers display the copy numbers of CHS and CHS-like genes, respectively.
3.2 Phylogenetic analysis and classification of CHS/CHS-like genes
We performed phylogenetic analysis to investigate the evolutionary characteristics of CHS and CHS-like genes. The distribution of CHS genes across 162 plant genomes showed that CHS appeared as early as the green algal phase, suggesting that the origin of CHS can be traced back to before the rise of algae (Figure 1). The 2,011 CHS homologs were phylogenetically categorized into four groups (Figure 2; Supplementary Figure S3). Group I possessed three out of four query AtCHS sequences, and contained CHS genes covering Chlorophyta Coccomyxa subellipsoidea, gymnosperm, monocots, magnoliids, and a wide spectrum of eudicot clades, including asterids, Malvales, Brassicales, Cucurbitales, Malpighiales, Rosales, and Fabales. Group II was only confined to monocots, with high copy numbers in Poaceae, especially in diploid Miscanthus sinensis. Group III had the most CHS homologs from diverse plant species, including bryophytes, gymnosperm, monocots, magnoliids, and most eudicot orders. Here, we observed that CHS genes were extensively expanded in asterids (145) and Fabales (229), and remarkably low in Brassicales (3). Group IV was angiosperm-specific, with CHS genes from monocots, magnoliids, and eudicots, and included another query AtCHS sequence. The result of a relatively simple species composition in group IV implies a later origin of the genes within this group compared to those of group I and III.
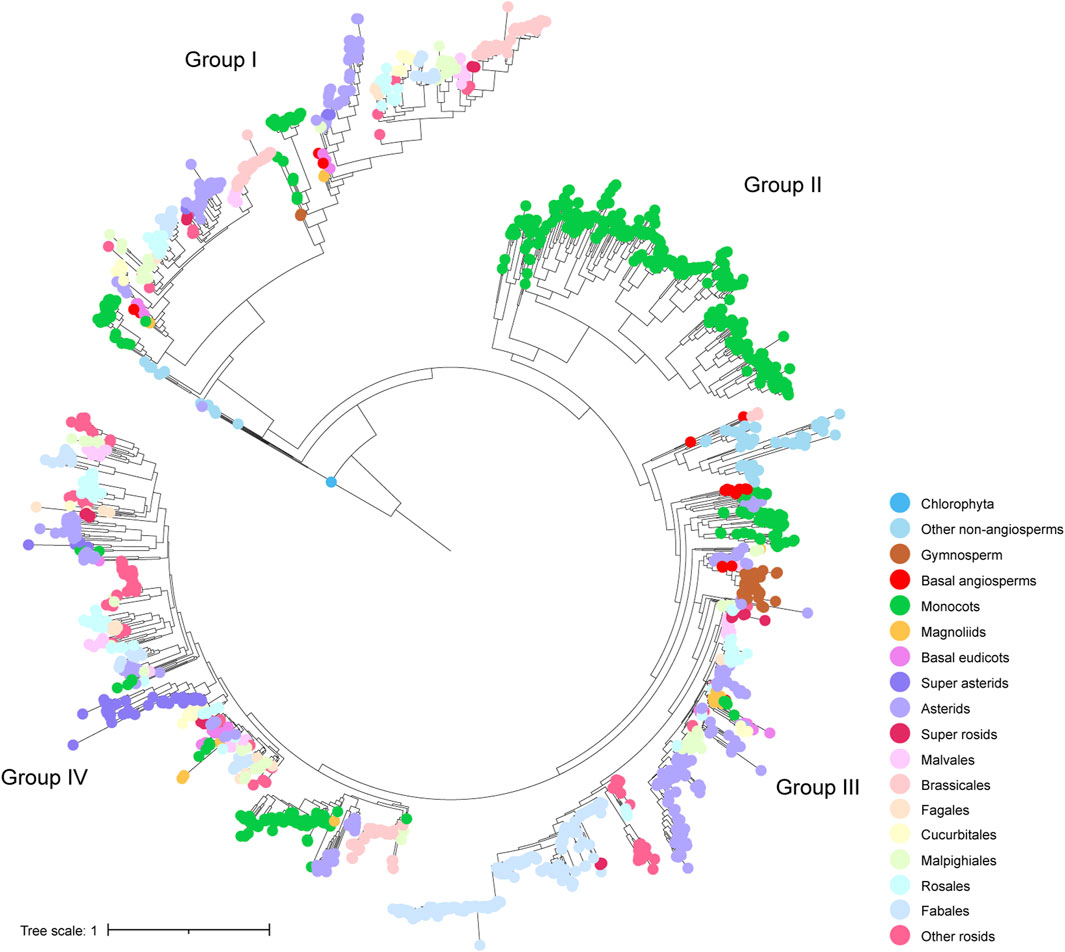
Figure 2. Phylogenetic tree of identified CHS genes. Four subgroups were indicated by group labels (I - IV). Colorful dots at the tips of leaves represent different clades of species to which different genes belong.
Phylogenetic analysis on CHS-like genes also provided evidence that 293 CHS-like genes were clustered into four groups (Supplementary Figure S4). Group I contained 33 CHS-like genes from species covering Chlorophyta, lycophytes, bryophytes, and few angiosperms. Group III was mainly composed of CHS-like homologs from monocots, while group II and IV possessed a wide range of species, i.e., from lycophytes, bryophytes, gymnosperm, monocots, magnoliids, to dicotyledonous plants such as Fabaceae.
3.3 Features of gene structure, protein characteristic, and selection pressure estimation
To exploit how gene structure of CHS/CHS-like genes changed during the time scale of evolution, we performed exon-intron structure analysis for all obtained genes. The CHS homologs have slightly longer gene lengths than CHS-like genes (Figure 3A), while the CDS lengths of CHS were about twice as long as what were observed for CHS-like (Figure 3B). However, there was no significant difference in exon number between these two types of genes (Figure 3C).
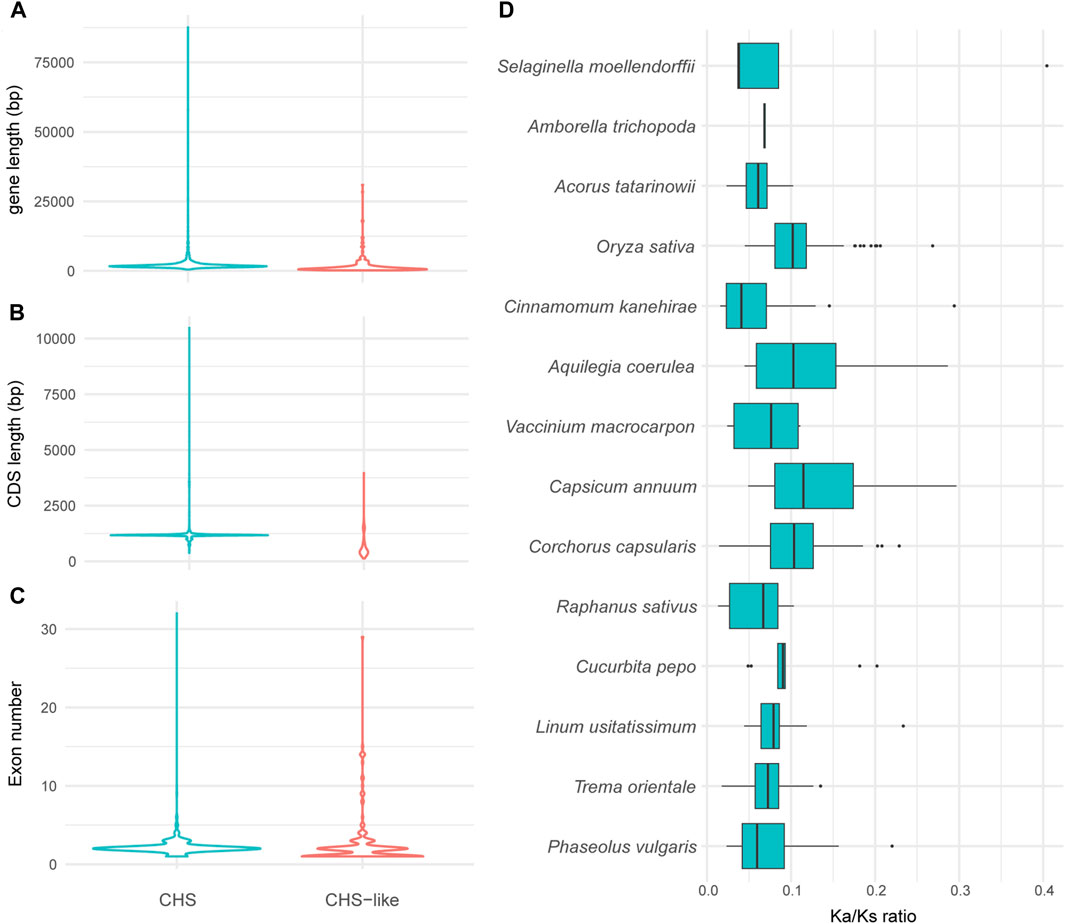
Figure 3. The variation of gene structures and Ka/Ks values of CHS and/or CHS-like genes. (A–C) Graphical display of gene length (A), CDS length (B), and exon number (C) of all analyzed plant genomes. (D), Ka/Ks values of CHS in 14 representative species. The Ka/Ks of Coccomyxa subellipsoidea was excluded due to only one gene copy of CHS.
We next used 15 out of 178 genomes to systematically study the exon-intron structures of CHS and CHS-like genes in species level (Table 1). Generally, CHS genes varied largely in gene lengths across different species (CV = 47%), while their CDS lengths were relatively conserved (CV = 15.0%). This variation may be caused by the presence of introns or transposons, since most CHS genes have more than two exons. When looking into CHS-like genes, both gene lengths and CDS lengths differed greatly, with the CV of 95.3% and 66.6%, respectively. We speculate that this may be due to the fusion of other protein domains with Chal_sti_synt_N/C domains contained in CHS-like sequences.
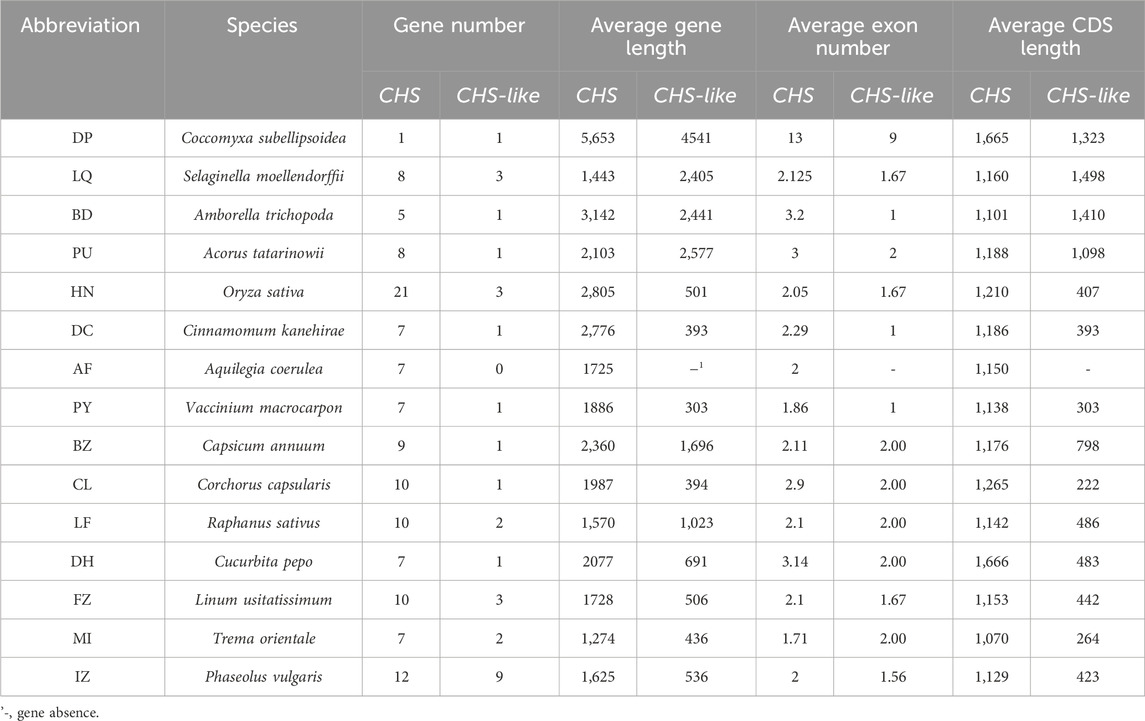
Table 1. Structural characteristics of CHS and CHS-like genes in 15 representative species.
We then focused on protein characteristics of CHS and CHS-like genes (Supplementary Table S5), including amino acid length (aa), isoelectric point (pI), molecular weight (MW), and hydrophilia preference (GRAVY). In general, genes belonging to CHS have longer protein sequences, with 397 aa on average. This is more than twice as long as what was found for CHS-like, which displays an average of just 199 aa. This tendency is exactly consistent with the result of their MW values, with the average weight of 43.4 and 22.0 kDa, respectively. Moreover, slight variations were detected between CHS and CHS-like proteins in terms of pI and GRAVY, with all sequences around seven and -0.1, respectively.
To estimate the selection pressure of CHS/CHS-like genes, the ratio of nonsynonymous substitutions (Ka) to synonymous substitutions (Ks) of each homologous pair in 15 representative plant species was calculated using ParaAT2.0 software (Zhang et al., 2012). The Ka/Ks values were not shown for all CHS-like genes, as well as CHS gene from Coccomyxa subellipsoidea, since only one or zero gene copies were detected in most analyzed species. The Ka/Ks ratios of all retained CHS homologous pairs were found to be lower than 1, revealing that CHS genes have undergone negative selection (Figure 3D). This result indicates the conserved feature of CHS genes on evolutionary time scales, and also reflects the importance of secondary metabolite biosynthesis in plant species.
3.4 Gene duplication and synteny network analysis
To explore the syntenic conservation of CHS and CHS-like genes, we performed phylogenomic synteny network analysis based on the genomic contexts in each genome. About 65.0% of the CHS (1,307 out of 2,011) genes were present in CHS synteny network with 22,946 connections (Supplementary Table S6). This is a fairly low percentage, approximately 15%–24% lower than those found in synteny studies working on highly conserved gene families, such as MADS-box and CesA/Csl (Zhao et al., 2017; Pancaldi et al., 2022). This result suggests that the synteny of CHS genes playing a role in secondary metabolite biosynthesis is much weaker than that of genes involved in developmental process. However, only 8.9% of the CHS-like genes (26 out of 293) were contained in CHS-like synteny network with 27 connections in total (Supplementary Table S6).
For a next step, by decomposing synteny networks into communities of closely related gene pairs, a total of 57 CHS and 4 CHS-like clusters were identified with 992 and 15 syntelogs, respectively (Figures 4, 5; Supplementary Figures S5-S6; Supplementary Table S7). The phylogenomic profiles of CHS and CHS-like synteny clusters are remarkably different. Four large and dense CHS clusters (1-4) were highly conserved, consisting of CHS syntelogs from basal angiosperms to dicotyledon plants (Figures 4, 5; Supplementary Table S7). Besides, several smaller clusters (6-7, 9-10, 12, 14, 17, 22, 27, 29, 36, 50 and 111) were also relatively conserved across angiosperm species. Clusters 5, 16, 31, 42, and 46 contained CHS genes of different genomes from diverse clades of eudicots. Moreover, multiple groups of genes belonging to specific plant branches were found with different sizes. For example, rosids, monocots, and Fabales were discovered in a multitude of clusters (6-15), while asterids and super asterids were only represented in a few clusters (1-2; Figures 4, 5; Supplementary Table S7). Next to the findings of CHS, we also parsed the species composition of CHS-like synteny network (Supplementary Figure S6A). Two of the four identified synteny clusters contained CHS-like genes of genomes covering magnoliids and eudicots (1, 5), while the other two clusters were specific to Chlorophyta (4) and Malpighiales (2; Supplementary Figure S6A; Supplementary Table S7).
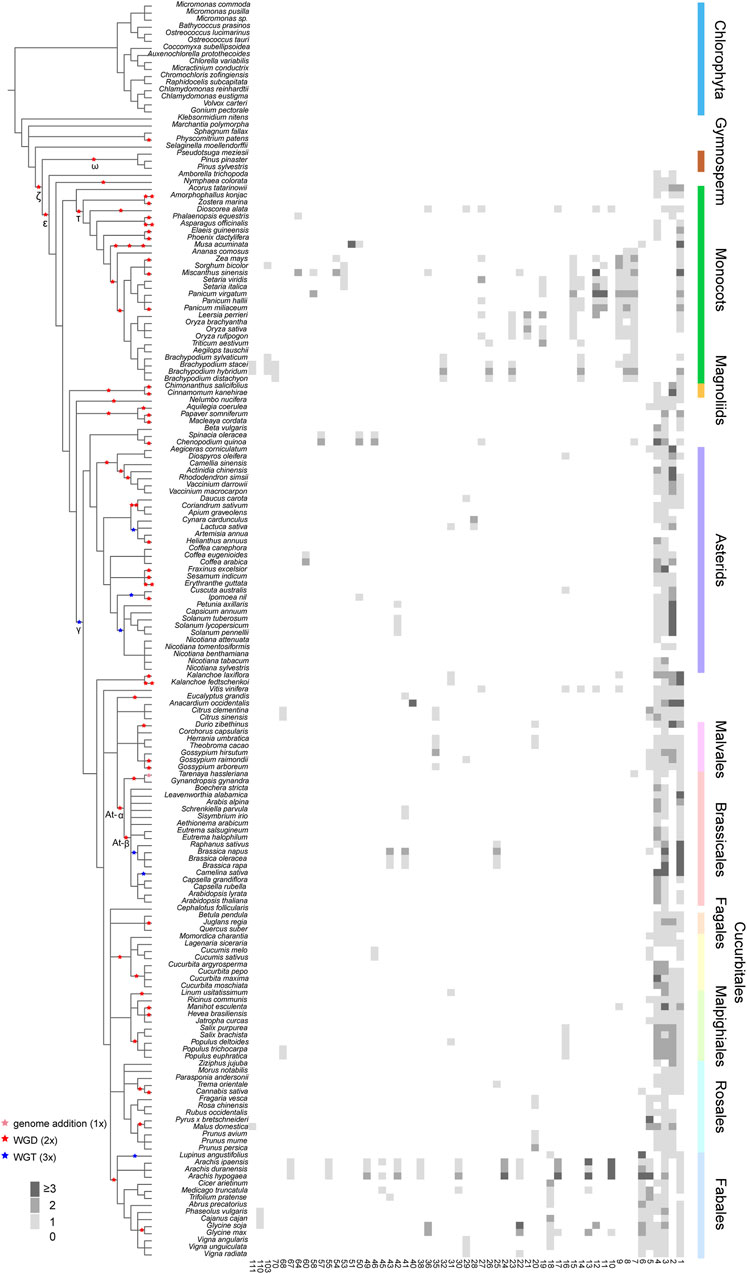
Figure 4. Phylogenomic profiling of CHS syntenic clusters. The genome duplication events are inferred from earlier studies (Zhao et al., 2017; Gao et al., 2020; Kerstens et al., 2020; Liu et al., 2022; Ma et al., 2022; Hoang et al., 2023). Pink, red, and blue stars represent known genome addition, WGD, and WGT events, respectively. Clades of species belonging to Fabales, Rosales, Malpighiales, Cucurbitales, Fagales, Brassicales, Malvales, Asterids, Magnoliids, Monocots, Gymnosperm, and Chlorophyta are color-coded. Rows and columns represent species and clusters, respectively. Gene numbers per species within each cluster is indicated by a grey gradient.
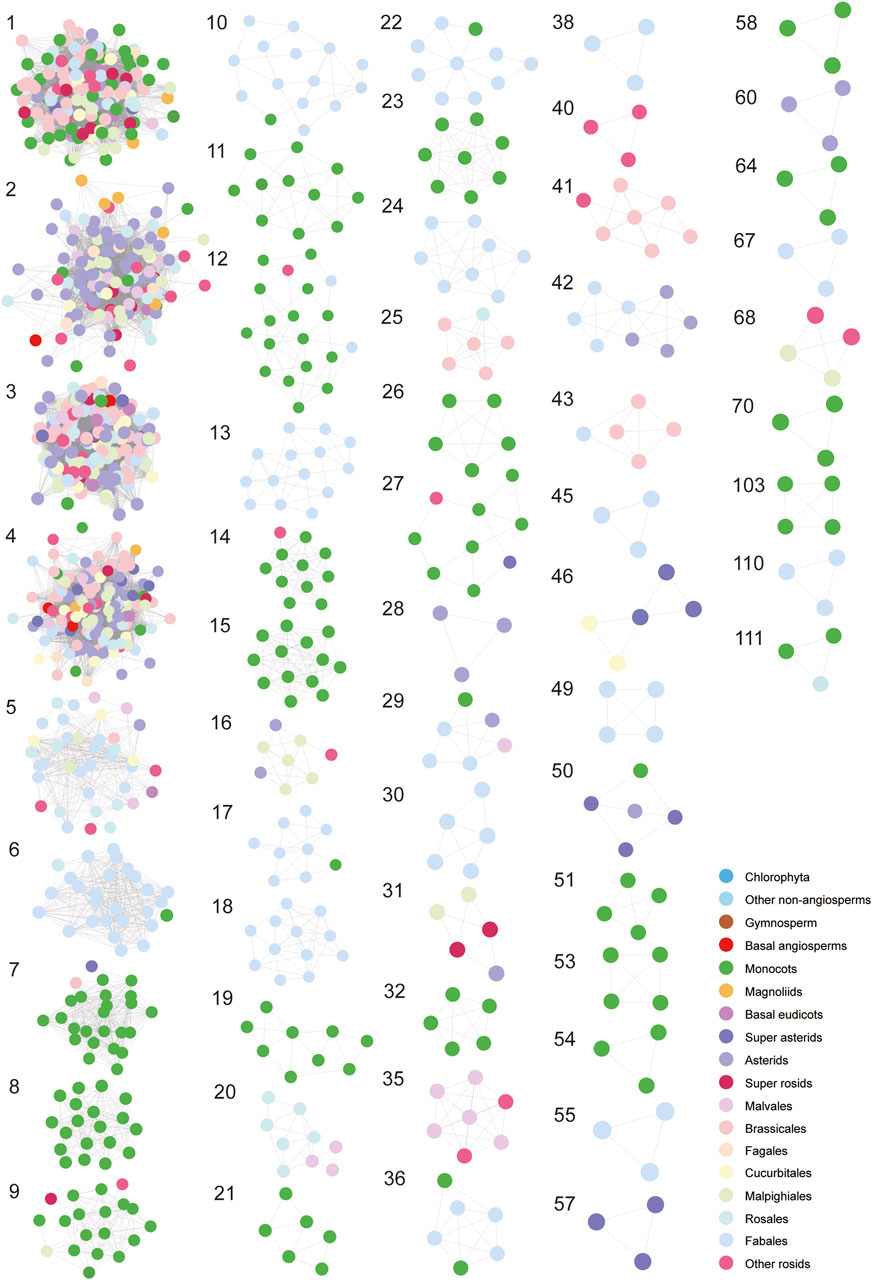
Figure 5. Visualization of each syntenic cluster in accordance with the order of clusters in Figure 4. The colorful nodes (syntelogs) represent different clades of species to which different genes belong.
To deep into the genomic organization of CHS genes and gain insights into their relevance to the evolution, we combined the syntenic connections within each of the clusters with the phylogenetic trees mentioned earlier (Figure 6; Supplementary Figure S6D). In general, puny consistency was found between syntenic conservation of gene architecture and phylogenetic classification of CHS genes, especially for genes belonging to group II and group IV. One largest cluster (1), comprising 5,412 connections, widely spanned these two groups. Further analysis showed that this cluster covered 14.2% of the syntenic CHS genes and 59.0% of the plant species included in this study. These results indicate that genomic contexts of group II and group IV experienced severe genomic rearrangements. The other two groups were relatively independent from each other. Specifically, group I was mainly sub-organized by two clusters (3, 4), and group III spanned one of the largest clusters (2). Except these several dense clusters, a number of syntenic connections within multiple small clusters were found to spread across different CHS groups. These could be resulted from the background noise of synteny analysis according to Pancaldi et al. (2022). In addition, syntelogs from several monocots-specific clusters (8, 32, 51, 53, 54, and 70) were found to phylogenetically form into monophyletic clades, as well as those belonging to Fabales (24, 49, 55, 67, and 110), Sapindales (40), asterids (60), and super asterids (57). These results indicate that CHS genes have undergone abundant ancient transposition activities within these categories.
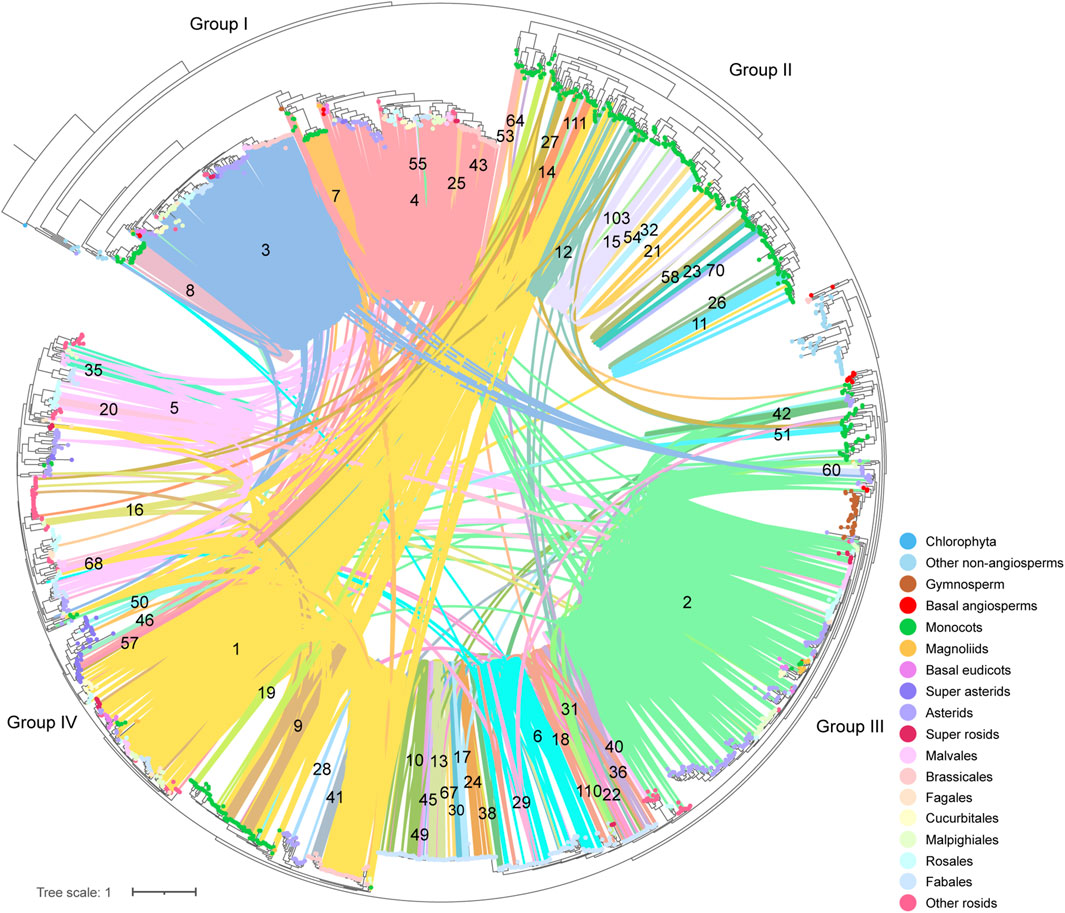
Figure 6. Phylogenetic classification and syntenic relationships of CHS genes. The number located on the syntenic line indicates the number of the synteny cluster. The colorful dots on the tips of leaves represent different clades of species to which different genes belong.
4 Discussion
The development of bioinformatics and the completion of various sequenced genomes provide us easier ways to study genetic variability and evolution. CHS is an essential enzyme involved in the production of flavonoid derivatives and plays an important role in biological processes related to plant growth and development (Kong et al., 2020). CHS family has been reported in a large number of plant species, such as soybean, cotton, and eggplant among many others (Anguraj Vadivel et al., 2018; Kong et al., 2020; Wu et al., 2020). However, gene identification in distantly related genomes is not always easy to perform. In this study, we employed two independent approaches, blast similarity search combined with phylogenetic analysis and Pfam domain search, to identify CHS/CHS-like homologs from 178 plant species. Compared with several related studies that only relied on a blast or Pfam threshold, the approach adopted in this study based on both phylogenetic relationships and domain presence is more reasonable and reliable. Most of the hits obtained by blast/phylogeny and Pfam were overlapping with each other, except for a small number of specific hits (data not shown), which were subsequently determined manually. This finally leads to the identification of 2,011 CHS and 293 CHS-like homologs from 162 to 98 plant genomes, respectively (Supplementary Tables S2-S4). Slight differences in CHS gene copies were found in comparison with former studies, such as six less in rice and three more in maize (Han et al., 2016; Han et al., 2017), which may be due to the update of genome versions or genome annotations.
Few studies have explored the genomic architecture of this gene family across the evolutionary time scales. A comparable phylogeny study by Xie et al. (2016) using a limited number of species showed that CHS genes were first found in bryophytes. However, the presence of CHS gene in Coccomyxa subellipsoidea (Supplementary Table S2), provides evidence that the origin of this gene can be traced back to early Chlorophyta in this current study. This result implies that limited taxon sampling cannot obtain a complete picture of gene family evolution. In addition, the 2,011 CHS homologs were phylogenetically clustered into four groups (Figure 2). This is consistent with the classification by Zhu et al. (2022), who studied the phylogeny of CHS genes within several plant species, but different from the categorization found in other related studies (Kong et al., 2020; Wu et al., 2020; Ma et al., 2021). Ruling out that this difference is due to different taxon sampling, it would suggest that the division of gene families should take into account not only phylogeny classification, but also other results such as gene function, structure variations, and expression patterns.
As previous studies pinpoint out that most CHS genes contain two exons and one intron (Kong et al., 2020; Zhu et al., 2022), the same does also hold for CHS homologs identified in our work, with a few exceptions that may be caused by assembly errors (Figure 3). However, the number of exons varied considerably among CHS-like genes, indicating potential function divergence possibly allowed by relaxed selection on redundant genes. In addition, the Ka/Ks ratios of CHS gene pairs in 14 representative plant species were less than 1, which was identical to those found in former studies (Anguraj Vadivel et al., 2018; Ma et al., 2021; Zhu et al., 2022). One exception was found in Gossypium barbadense that was not included in our study, with six pairs of duplicated genes having Ka/Ks ratios greater than 1, indicating the presence of positive selection (Kong et al., 2020). If this is true, whether this pattern is also present in other species is not clear. Future work could address this question by investigating CHS genes from more related plant genomes. Several reports also revealed the diverse expression patterns of CHS genes in different tissues and developmental stages (Wang et al., 2018; Kong et al., 2020). This may raise more questions that could be explored by future studies. How is this expression differentiation evolved from lower plants to higher plants? How is it associated with phenotype evolution?
5 Conclusion
CHS is regarded as an important enzyme involved in the production of flavonoid derivatives and plays a role in various physiological and biological processes. In this study, we performed a phylogenomic analysis of CHS gene family using 178 genomes with a range from Chlorophyta to flowering plants. Our results revealed the early origin of CHS and CHS-like genes, that is, before the rise of algae. The conservation in gene structure and the negative selection of CHS genes indicate the conserved nature of flavonoid pathway, which also reflects the functional importance of flavonoid biosynthesis in plants. The synteny network analysis of CHS gene family also pinpointed both conservation and lineage-specific patterns. These findings provide novel insights into the evolutionary history of CHS gene family.
Data availability statement
The original contributions presented in the study are included in the article/Supplementary Material, further inquiries can be directed to the corresponding authors.
Author contributions
LY: Data curation, Formal Analysis, Software, Visualization, Writing–original draft, Writing–review and editing. SZ: Methodology, Software, Validation, Writing–review and editing. DC: Project administration, Supervision, Writing–review and editing. XW: Funding acquisition, Project administration, Writing–review and editing.
Funding
The author(s) declare that financial support was received for the research, authorship, and/or publication of this article. This work was financially supported by the National Natural Science Foundation of China (No 32370408).
Acknowledgments
We acknowledge Francesco Pancaldi for providing original data of most plant genomes used in this study. We would like to thank two reviewers for their constructive suggestions and comments.
Conflict of interest
The authors declare that the research was conducted in the absence of any commercial or financial relationships that could be construed as a potential conflict of interest.
Publisher’s note
All claims expressed in this article are solely those of the authors and do not necessarily represent those of their affiliated organizations, or those of the publisher, the editors and the reviewers. Any product that may be evaluated in this article, or claim that may be made by its manufacturer, is not guaranteed or endorsed by the publisher.
Supplementary material
The Supplementary Material for this article can be found online at: https://www.frontiersin.org/articles/10.3389/fgene.2024.1368358/full#supplementary-material
References
Anguraj Vadivel, A. K., Krysiak, K., Tian, G., and Dhaubhadel, S. (2018). Genome-wide identification and localization of chalcone synthase family in soybean (Glycine max [L]Merr). BMC Plant Biol. 18 (1), 325. doi:10.1186/s12870-018-1569-x
Austin, M. B., and Noel, J. P. (2003). The chalcone synthase superfamily of type III polyketide synthases. Nat. Prod. Rep. 20 (1), 79–110. doi:10.1039/b100917f
Bastian, M., Heymann, S., and Jacomy, M. (2009). Gephi: an open source software for exploring and manipulating networks. Proc. Int. AAAI Conf. web Soc. media 3 (1), 361–362. doi:10.1609/icwsm.v3i1.13937
Buchfink, B., Xie, C., and Huson, D. H. (2015). Fast and sensitive protein alignment using DIAMOND. Nat. Methods 12 (1), 59–60. doi:10.1038/nmeth.3176
Camacho, C., Coulouris, G., Avagyan, V., Ma, N., Papadopoulos, J., Bealer, K., et al. (2009). BLAST+: architecture and applications. BMC Bioinforma. 10, 421. doi:10.1186/1471-2105-10-421
Capella-Gutiérrez, S., Silla-Martínez, J. M., and Gabaldón, T. (2009). trimAl: a tool for automated alignment trimming in large-scale phylogenetic analyses. Bioinformatics 25 (15), 1972–1973. doi:10.1093/bioinformatics/btp348
Correia, B., Rodriguez, J. L., Valledor, L., Almeida, T., Santos, C., Cañal, M. J., et al. (2014). Analysis of the expression of putative heat-stress related genes in relation to thermotolerance of cork oak. J. Plant Physiol. 171 (6), 399–406. doi:10.1016/j.jplph.2013.12.004
Deng, Y., Li, C., Li, H., and Lu, S. (2018). Identification and characterization of flavonoid biosynthetic enzyme genes in Salvia miltiorrhiza (Lamiaceae). Molecules 23 (6), 1467. doi:10.3390/molecules23061467
Dixon, P. (2003). VEGAN, a package of R functions for community ecology. J. Veg. Sci. 14 (6), 927–930. doi:10.1111/j.1654-1103.2003.tb02228.x
Ferrer, J. L., Jez, J. M., Bowman, M. E., Dixon, R. A., and Noel, J. P. (1999). Structure of chalcone synthase and the molecular basis of plant polyketide biosynthesis. Nat. Struct. Biol. 6 (8), 775–784. doi:10.1038/11553
Finn, R. D., Clements, J., and Eddy, S. R. (2011). HMMER web server: interactive sequence similarity searching. Nucleic Acids Res. 39, W29–W37. doi:10.1093/nar/gkr367
Gao, B., Wang, L., Oliver, M., Chen, M., and Zhang, J. (2020). Phylogenomic synteny network analyses reveal ancestral transpositions of auxin response factor genes in plants. Plant Methods 16, 70. doi:10.1186/s13007-020-00609-1
Glagoleva, A. Y., Ivanisenko, N. V., and Khlestkina, E. K. (2019). Organization and evolution of the chalcone synthase gene family in bread wheat and relative species. BMC Genet. 20, 30. doi:10.1186/s12863-019-0727-y
Han, Y., Cao, Y., Jiang, H., and Ding, T. (2017). Genome-wide dissection of the chalcone synthase gene family in Oryza sativa. Mol. Breed. 37, 119. doi:10.1007/s11032-017-0721-x
Han, Y., Ding, T., Su, B., and Jiang, H. (2016). Genome-wide identification, characterization and expression analysis of the chalcone synthase family in maize. Int. J. Mol. Sci. 17 (2), 161. doi:10.3390/ijms17020161
Hoang, N. V., Sogbohossou, E. O. D., Xiong, W., Simpson, C. J. C., Singh, P., Walden, N., et al. (2023). The Gynandropsis gynandra genome provides insights into whole-genome duplications and the evolution of C4 photosynthesis in Cleomaceae. Plant Cell. 35 (5), 1334–1359. doi:10.1093/plcell/koad018
Hoensch, H. P., and Oertel, R. (2015). The value of flavonoids for the human nutrition: short review and perspectives. Clin. Nutr. Exp. 3, 8–14. doi:10.1016/j.yclnex.2015.09.001
Huerta-Cepas, J., Serra, F., and Bork, P. (2016). ETE 3: reconstruction, analysis, and visualization of phylogenomic data. Mol. Biol. Evol. 33 (6), 1635–1638. doi:10.1093/molbev/msw046
Iwashina, T. (2015). Contribution to flower colors of flavonoids including anthocyanins: a review. Nat. Product. Commun. 10 (3), 1934578X1501000–544. doi:10.1177/1934578x1501000335
Jiang, C., Kim, S. Y., and Suh, D.-Y. (2008). Divergent evolution of the thiolase superfamily and chalcone synthase family. Mol. Phylogenet Evol. 49 (3), 691–701. doi:10.1016/j.ympev.2008.09.002
Katoh, K., Rozewicki, J., and Yamada, K. D. (2019). MAFFT online service: multiple sequence alignment, interactive sequence choice and visualization. Brief. Bioinform 20 (4), 1160–1166. doi:10.1093/bib/bbx108
Kerstens, M. H., Schranz, M. E., and Bouwmeester, K. (2020). Phylogenomic analysis of the APETALA2 transcription factor subfamily across angiosperms reveals both deep conservation and lineage-specific patterns. Plant J. 103 (4), 1516–1524. doi:10.1111/tpj.14843
Koes, R. E., Quattrocchio, F., and Mol, J. N. (1994). The flavonoid biosynthetic pathway in plants: function and evolution. BioEssays 16 (2), 123–132. doi:10.1002/bies.950160209
Kong, X., Khan, A., Li, Z., You, J., Munsif, F., Kang, H., et al. (2020). Identification of chalcone synthase genes and their expression patterns reveal pollen abortion in cotton. Saudi J. Biol. Sci. 27 (12), 3691–3699. doi:10.1016/j.sjbs.2020.08.013
Leebens-Mack, J. H., Barker, M. S., Carpenter, E. J., Deyholos, M. K., Gitzendanner, M. A., Graham, S. W., et al. (2019). One thousand plant transcriptomes and the phylogenomics of green plants. Nature 574, 679–685. doi:10.1038/s41586-019-1693-2
Letunic, I., and Bork, P. (2021). Interactive Tree of Life (iTOL) v5: an online tool for phylogenetic tree display and annotation. Nucleic Acids Res. 49, W293–W296. doi:10.1093/nar/gkab301
Li, M., Cao, Y.-T., Ye, S.-R., Irshad, M., Pan, T.-F., and Qiu, D.-L. (2016). Isolation of CHS gene from Brunfelsia acuminata flowers and its regulation in anthocyanin biosysthesis. Molecules 22 (1), 44. doi:10.3390/molecules22010044
Liu, Y., Wang, S., Li, L., Yang, T., Dong, S., Wei, T., et al. (2022). The Cycas genome and the early evolution of seed plants. Nat. Plants 8 (4), 389–401. doi:10.1038/s41477-022-01129-7
Ma, L., Wang, Q., Zheng, Y., Guo, J., Yuan, S., Fu, A., et al. (2022). Cucurbitaceae genome evolution, gene function and molecular breeding. Hortic. Res. 9, uhab057. doi:10.1093/hr/uhab057
Ma, M., Zhong, M., Zhang, Q., Zhao, W., Wang, M., and Luo, C. (2021). Phylogenetic implications and functional disparity in the Chalcone synthase gene family of common Seagrass Zostera marina. Front. Mar. Sci. 8, 760902. doi:10.3389/fmars.2021.760902
Mierziak, J., Kostyn, K., and Kulma, A. (2014). Flavonoids as important molecules of plant interactions with the environment. Molecules 19 (10), 16240–16265. doi:10.3390/molecules191016240
Moriguchi, T., Kita, M., Tomono, Y., EndoInagaki, T., and Omura, M. (1999). One type of chalcone synthase gene expressed during embryogenesis regulates the flavonoid accumulation in citrus cell cultures. Plant Cell. Physiol. 40 (6), 651–655. doi:10.1093/oxfordjournals.pcp.a029589
Napoli, C. A., Fahy, D., Wang, H.-Y., and Taylor, L. P. (1999). White anther: a petunia mutant that abolishes pollen flavonol accumulation, induces male sterility, and is complemented by a chalcone synthase transgene. Plant Physiol. 120 (2), 615–622. doi:10.1104/pp.120.2.615
Nguyen, L. T., Schmidt, H. A., von Haeseler, A., and Minh, B. Q. (2015). IQ-TREE: a fast and effective stochastic algorithm for estimating maximum-likelihood phylogenies. Mol. Biol. Evol. 32 (1), 268–274. doi:10.1093/molbev/msu300
Pancaldi, F., van Loo, E. N., Schranz, M. E., and Trindade, L. M. (2022). Genomic architecture and evolution of the cellulose synthase gene superfamily as revealed by phylogenomic analysis. Front. Plant Sci. 13, 870818. doi:10.3389/fpls.2022.870818
Peer, W. A., and Murphy, A. S. (2007). Flavonoids and auxin transport: modulators or regulators? Trends Plant Sci. 12 (12), 556–563. doi:10.1016/j.tplants.2007.10.003
Price, M. N., Dehal, P. S., and Arkin, A. P. (2010). FastTree 2–approximately maximum-likelihood trees for large alignments. PloS One 5 (3), e9490. doi:10.1371/journal.pone.0009490
Rosvall, M., and Bergstrom, C. T. (2008). Maps of random walks on complex networks reveal community structure. Proc. Natl. Acad. Sci. U. S. A. 105 (4), 1118–1123. doi:10.1073/pnas.0706851105
Shannon, P., Markiel, A., Ozier, O., Baliga, N. S., Wang, J. T., Ramage, D., et al. (2003). Cytoscape: a software environment for integrated models of biomolecular interaction networks. Genome Res. 13 (11), 2498–2504. doi:10.1101/gr.1239303
Shen, N., Wang, T., Gan, Q., Liu, S., Wang, L., and Jin, B. (2022). Plant flavonoids: classification, distribution, biosynthesis, and antioxidant activity. Food Chem. 383, 132531. doi:10.1016/j.foodchem.2022.132531
Wang, D., Zhang, Y., Zhang, Z., Zhu, J., and Yu, J. (2010). KaKs_Calculator 2.0: a toolkit incorporating gamma-series methods and sliding window strategies. Genomics, Proteomics Bioinforma. 8 (1), 77–80. doi:10.1016/S1672-0229(10)60008-3
Wang, Y., Tang, H., DeBarry, J. D., Tan, X., Li, J., Wang, X., et al. (2012). MCScanX: a toolkit for detection and evolutionary analysis of gene synteny and collinearity. Nucleic Acids Res. 40 (7), e49. doi:10.1093/nar/gkr1293
Wang, Z., Yu, Q., Shen, W., El Mohtar, C. A., Zhao, X., and Gmitter, F. G. (2018). Functional study of CHS gene family members in citrus revealed a novel CHS gene affecting the production of flavonoids. BMC Plant Biol. 18 (1), 189. doi:10.1186/s12870-018-1418-y
Wu, X., Zhang, S., Liu, X., Shang, J., Zhang, A., Zhu, Z., et al. (2020). Chalcone synthase (CHS) family members analysis from eggplant (Solanum melongena L.) in the flavonoid biosynthetic pathway and expression patterns in response to heat stress. PLoS One 15 (4), e0226537. doi:10.1371/journal.pone.0226537
Xie, L., Liu, P., Zhu, Z., Zhang, S., Zhang, S., Li, F., et al. (2016). Phylogeny and expression analyses reveal important roles for plant PKS III family during the conquest of land by plants and angiosperm diversification. Front. Plant Sci. 7, 1312. doi:10.3389/fpls.2016.01312
Yang, S., Terachi, T., and Yamagishi, H. (2008). Inhibition of chalcone synthase expression in anthers of Raphanus sativus with ogura male sterile cytoplasm. Ann. Bot. 102 (4), 483–489. doi:10.1093/aob/mcn116
Zhang, X., Abrahan, C., Colquhoun, T. A., and Liu, C.-J. (2017). A proteolytic regulator controlling chalcone synthase stability and flavonoid biosynthesis in Arabidopsis. Plant Cell. 29 (5), 1157–1174. doi:10.1105/tpc.16.00855
Zhang, Z., Xiao, J., Wu, J., Zhang, H., Liu, G., Wang, X., et al. (2012). ParaAT: a parallel tool for constructing multiple protein-coding DNA alignments. Biochem. Biophys. Res. Commun. 419 (4), 779–781. doi:10.1016/j.bbrc.2012.02.101
Zhao, T., Holmer, R., de Bruijn, S., Angenent, G. C., van den Burg, H. A., and Schranz, M. E. (2017). Phylogenomic synteny network analysis of MADS-Box transcription factor genes reveals lineage-specific transpositions, ancient tandem duplications, and deep positional conservation. Plant Cell. 29 (6), 1278–1292. doi:10.1105/tpc.17.00312
Zhao, T., and Schranz, M. E. (2017). Network approaches for plant phylogenomic synteny analysis. Curr. Opin. Plant Biol. 36, 129–134. doi:10.1016/j.pbi.2017.03.001
Zhu, L., Ding, Y., Wang, S., Wang, Z., and Dai, L. (2022). Genome-wide identification, characterization, and expression analysis of CHS gene family members in Chrysanthemum nankingense. Genes. 13 (11), 2145. doi:10.3390/genes13112145
Keywords: chalcone synthase, flavonoids, phylogeny, gene conservation, synteny network
Citation: Yang L, Zhang S, Chu D and Wang X (2024) Exploring the evolution of CHS gene family in plants. Front. Genet. 15:1368358. doi: 10.3389/fgene.2024.1368358
Received: 10 January 2024; Accepted: 04 April 2024;
Published: 30 April 2024.
Edited by:
Igor V. Bartish, Institute of Botany (ASCR), CzechiaReviewed by:
Tao Zhao, Northwest A&F University, ChinaZhenyuan Pan, Shihezi University, China
Chao Zhang, Northwest A&F University, China
Copyright © 2024 Yang, Zhang, Chu and Wang. This is an open-access article distributed under the terms of the Creative Commons Attribution License (CC BY). The use, distribution or reproduction in other forums is permitted, provided the original author(s) and the copyright owner(s) are credited and that the original publication in this journal is cited, in accordance with accepted academic practice. No use, distribution or reproduction is permitted which does not comply with these terms.
*Correspondence: Xumei Wang, wangxumei@mail.xjtu.edu.cn
†ORCID: Xumei Wang, orcid.org/0000-0002-1468-6635; Li Yang, orcid.org/0000-0002-9360-4617
‡These authors have contributed equally to this work and share first authorship