

- 1 Department of Anatomy, Faculty of Medical Sciences, University of Fukui, Fukui, Japan
- 2 Department of Neuroscience, University of Connecticut Health Center, Farmington, CT, USA
Terminals containing vesicular glutamate transporter (VGLUT) 2 make dense axosomatic synapses on tectothalamic GABAergic neurons. These are one of the three types of glutamatergic synapses in the inferior colliculus (IC) identified by one of three combinations of transporter protein: VGLUT1 only, VGLUT2 only, or both VGLUT1 and 2. To identify the source(s) of these three classes of glutamatergic terminals, we employed the injection of Fluorogold (FG) into the IC and retrograde transport in combination with in situ hybridization for VGLUT1 and VGLUT2 mRNA. The distribution of FG-positive soma was consistent with previous reports. In the auditory cortex, all FG-positive cells expressed only VGLUT1. In the IC, the majority of FG-positive cells expressed only VGLUT2. In the intermediate nucleus of the lateral lemniscus, most FG-positive cells expressed VGLUT2, and a few FG-positive cells expressed both VGLUT1 and 2. In the superior olivary complex (SOC), the majority of FG-positive cells expressing VGLUT2 were in the lateral superior olive, medial superior olive, and some periolivary nuclei. Fewer FG-positive cells expressed VGLUT1&2. In the ventral cochlear nucleus, almost all FG-positive cells expressed VGLUT1&2. On the other hand in the dorsal cochlear nucleus, the vast majority of FG-positive cells expressed only VGLUT2. Our data suggest that (1) the most likely sources of VGLUT2 terminals in the IC are the intermediate nucleus of the lateral lemniscus, the dorsal cochlear nucleus, the medial and lateral superior olive, and the IC itself, (2) VGLUT1 terminals in the IC originate only in the ipsilateral auditory cortex, and (3) VGLUT1&2 terminals in IC originate mainly from the VCN with minor contributions from the SOC and the lateral lemniscal nuclei.
Introduction
The inferior colliculus (IC) receives ascending inputs from many lower auditory nuclei (Whitley and Henkel, 1984; Oliver, 1985, 1987; Saint Marie et al., 1989; Saint Marie and Baker, 1990; Oliver et al., 1995; Gonzalez-Hernandez et al., 1996; Alibardi, 1998; Cant and Benson, 2006) and descending inputs from the auditory cortex (Winer et al., 1998). In spite of the number of studies about neurotransmitters used in these pathways (Saint Marie et al., 1989; Saint Marie and Baker, 1990; Gonzalez-Hernandez et al., 1996; Alibardi, 1998), the expression of neurotransmitters, especially glutamate, in the auditory nuclei is not well defined because of the lack of reliable markers. The lack of information about neurotransmitters, as well as the complexity of the inputs, has retarded progress in understanding the synaptic organization of the IC (Oliver et al., 1999; Loftus et al., 2004).
Vesicular glutamate transporters (VGLUT) are reliable markers for glutamatergic terminals (Kaneko and Fujiyama, 2002), and currently three subtypes of VGLUT are known (Takamori, 2006). In the IC, both VGLUT1 and VGLUT2 are found in synaptic terminals (Kaneko et al., 2002; Altschuler et al., 2008; Ito et al., 2009), but VGLUT3 is not (Ito et al., 2009). Indeed, three types of glutamatergic terminals have been identified in the IC; terminals containing only VGLUT1, those containing only VGLUT2, and those containing both molecules (VGLUT1&2) (Ito et al., 2009). Certain VGLUT molecules in terminals seems to associate with specific patterns of synaptic organization: For example, the large terminals in IC tend to contain VGLUT1 and terminate on distal dendrites (Altschuler et al., 2008). In contrast, numerous, smaller VGLUT2-positive axosomatic terminals encircle somata of GABAergic tectothalamic cells (Ito et al., 2009). Therefore, elucidating the combination of VGLUT molecules in glutamatergic neurons which project to the IC will help to identify the origin of these VGLUT1- and VGLUT2-containing glutamatergic terminals. To identify the source of these inputs, we employed in situ hybridization (ISH) for VGLUT molecules combined with the retrograde transport and immunohistochemical detection of Fluorogold (FG) after the large injection of FG into the IC. Neurons expressing VGLUT mRNA exhibit whole population of glutamatergic neurons and large FG injection into the IC reveals neural population making projection to the IC. Therefore, this approach is useful to show the sources of IC VGLUT terminals.
Materials and Methods
Subjects
Fourteen adult Long-Evans rats were used for this study. All experiments were done in accordance with institutional guidelines at the University of Connecticut Health Center and in accordance with NIH guidelines for the care and use of laboratory animals. All efforts were made to minimize the number of animals used and their suffering.
Survival Surgery
Rats were anesthetized with ketamine (97.5 mg/kg i.m.) and xylazine (2.4 mg/kg i.m.), and maintained in an areflexive state with isoflurane mixed with oxygen for the duration of the surgery and recording. Surgery and recording were done in a double-walled sound attenuating chamber (IAC, Bronx, NY, USA). Acoustic stimuli were generated by a TDT System 2 (Tucker Davis Technologies, Gainesville, FL, USA) under the control of a PC computer and custom software. All sounds were delivered by Beyer earphones (DT-48, Hicksville, NY, USA) via sealed enclosures. Animals were fixed in a stereotaxic apparatus that incorporated hollow ear bars to deliver sound stimuli. The sound delivery system was calibrated from 60 to 40,000 Hz, and the calibration was performed at the end of the ear bar with a 1/8′ microphone (Brüel & Kjær, Nærum, Denmark). A craniotomy opened the right parietal bone over the visual cortex. Glass micropipettes (4–7 μm tip, 0.5–5 MΩ) were filled with 3% FG (Fluorochrome, Denver, CO, USA) diluted in saline. These glass electrodes were advanced with a microdrive (Burleigh Inchworm, Fishers, NY, USA) mounted on the stereotaxic manipulator through the cortex after the dura was opened. Recordings of activity evoked by sounds in the contralateral ear were used to locate the IC. Acoustically driven responses of single or multiple units were amplified with a Dagan 2400 amplifier (Minneapolis, MN, USA) and a low noise amplifier (Princeton Applied Research, model 5113 amplifiers). Neurons in the central nucleus of the IC (ICC) were identified by short latency responses to white noise bursts or pure tones. At locations in the IC with brisk responses, FG was iontophoretically injected from the recording pipette with a 2–5 μA current for durations of 2–5 min with a 50% duty cycle (7 s on/7 s off).
Four to seven days after the surgery, the rats were deeply anesthetized with ketamine (97.5 mg/kg i.m.) and xylazine (2.4 mg/kg i.m.), and perfused transcardially with 4% paraformaldehyde in 0.1 M phosphate buffer (PB, pH 7.4). After cryoprotection in 30% sucrose in PB for 2 days, serial, 40 μm-thick, coronal sections were cut with a freezing microtome. A series of every fifth section was used for histology.
Immunohistochemistry for FG
We used a rabbit polyclonal antibody to detect FG (AB153, Millipore). Specificity of the antibody was confirmed by absence of staining in tissues which did not contain FG. Sections were incubated with the rabbit anti-FG antibody (1:8000) diluted in 0.3% Triton X-100 with 1% normal goat serum in 0.05 M phosphate-buffered saline (PBS-XG), followed by an incubation in a biotinylated goat anti-rabbit secondary antibody (1:200; Vector Laboratories, Burlingame, CA, USA) diluted in PBS-XG. After an incubation in avidin-biotinylated peroxidase complex (1:50; ABC-Elite, Vector) in PBS containing 0.3% Triton X-100 (PBS-X), sections were processed for a Nickel-diaminobenzidine (DAB) reaction. Sections were mounted on coated glass slides, counterstained with Neutral Red (Fisher Scientific, Fair Lawn, NJ, USA), dehydrated through graded alcohols, cleared with Histoclear (National Diagnostics, Atlanta, GA, USA), and coverslipped with Permount (Fisher Scientific, Waltham, MA, USA).
Brightfield Ish Combined with Immunohistochemistry for FG
Both digoxigenin (DIG)- and fluorescein (FL)-labeled antisense riboprobes were made from cDNAs of mouse VGLUT1 (nucleotides of 152–1085, GenBank accession number NM_182993.2) and mouse VGLUT2 (nucleotides of 848–2044, GenBank accession number NM_080853.2). The specificity of the riboprobes for VGLUT1 and VGLUT2 was established in previous studies (Watakabe et al., 2006; Nakamura et al., 2007). Furthermore, the sequences of VGLUT1, VGLUT2 probes have very high similarities with corresponding regions of the rat cDNAs (96 and 94%, respectively). On the other hand, similarities of these riboprobes with other members of the family of molecules are low: The mouse VGLUT1 riboprobe shares only 74 and 71% identity with the corresponding regions of the rat VGLUT2 and VGLUT3 mRNA; and the mouse VGLUT2 riboprobe has only 74 and 76% homology with the rat VGLUT1 and VGLUT3 mRNA.
All 14 animals were processed for non-radioactive ISH. The procedure for non-radioactive ISH was described previously (Liang et al., 2000; Ito et al., 2007, 2008). Free-floating sections were washed in 0.1 M PB (pH 7.0) for 5 min twice, immersed in PB containing 0.3% Triton X-100, and rinsed in 0.1 M PB. Then, sections were acetylated for 10 min at room temperature with 0.003% acetic acid anhydrate, 1.3% (v/v) triethanolamine, and 6.5% (w/v) HCl diluted in DEPC-treated water. After being rinsed in 0.1 M PB twice, the sections were incubated for 1 h at 70°C in a prehybridization buffer containing 50% (v/v) formamide, 5 × SSC buffer (a 5× concentration of SSC buffer containing 16.65 mM sodium chloride and 16.65 mM sodium citrate buffer, pH 7.0), 2% blocking reagents (Roche Diagnostics, Mannheim, Germany), 0.1% N-lauroylsarcosine (NLS), and 0.1% sodium dodecyl sulfate. Then, the sections were hybridized with 1 μg/ml DIG-labeled sense or antisense RNA probe for VGLUT1 or VGLUT2 in freshly prepared prehybridization buffer for 20 h at 70°C. After two washes in 2× SSC, 50% formamide, and 0.1% NLS for 20 min at 70°C, the sections were rinsed in 2× SSC with 0.1% NLS for 20 min twice at 37°C, and in 0.2× SSC with 0.1% NLS for 20 min twice at 37°C. These sections were incubated with 1% blocking reagent (Roche) diluted in Tris–HCl (pH 7.5) and 0.15 M NaCl (TS7.5) for 1 h at room temperature, and then with alkaline phosphatase-conjugated anti-DIG antibody Fab fragment (1:2000; Roche) and rabbit anti-FG antibody (1:8000) in 1% blocking reagent (Roche) diluted in TS7.5 at room temperature overnight. After the secondary and ABC reactions described above, FG was visualized by a DAB reaction. Subsequently, the bound phosphatase was visualized by a reaction with nitro blue tetrazolium chloride/5-bromo-4-chloro-3-indolyl phosphate toluidine salt (Roche) for 4 h at 37°C in Tris–HCl (pH 9.5), 0.15 M NaCl, and 10 mM MgCl2. Finally, the sections were mounted on coated glass slides, dehydrated, cleared with Histoclear (National Diagnostics, Atlanta, GA, USA), and coverslipped.
Double Fluorescent Ish Combined with Immunohistochemistry for FG
In three rats that showed the strongest signals in brightfield ISH, brainstem sections were also processed for a combination of fluorescent ISH and FG immunohistochemistry. For fluorescent ISH to detect VGLUT1 and VGLUT2 expression, the FL-labeled riboprobe for VGLUT1 and DIG-labeled riboprobe for VGLUT2 were diluted in hybridization buffer at a final concentration of 1 μg/ml. The hybridization temperature was set at 70°C. After the incubation and washing described above, these sections were incubated with alkaline phosphatase-conjugated sheep anti-FL antibody Fab fragment (1:2000; Roche), peroxidase-conjugated sheep anti-DIG antibody Fab fragment (1:2000; Roche), and rabbit anti-FG (1:1000) in 1% blocking reagent (Roche) diluted in TS7.5 at room temperature overnight. The sections were rinsed three times, and then the bound peroxidase was reacted with dinitrophenol-tyramide signal amplification (Perkin-Elmer, Waltham, MA, USA). After three more washes, the sections were incubated with AlexaFluor 488-conjugated goat anti-rabbit IgG (1:100; Invitrogen, Carlsbad, CA, USA), blocked by 10% normal rabbit serum, and then incubated with AlexaFluor 647-conjugated rabbit anti-dinitrophenol (1:50; Invitrogen) diluted in 1% normal rabbit serum/TS7.5. To visualize bound alkaline phosphatase by fluorescent microscopy, sections were developed with 0.005% (w/v) 4-chloro-2-methylbenzenediazonium hemi-zinc chloride (Fast Red TR, Roche), 1% (v/v) 2-hydroxy-3-naphthoic acid-2′-phenylanilide phosphate (HNPP, Roche) diluted in 0.1 M Tris–HCl (pH 8.0), 0.15 M NaCl, 10 mM MgCl2, for 30 min at room temperature. The sections were mounted on glass slides with CC/Mount (DBS, Pleasanton, CA, USA).
Image Analysis
Fluorescent images were acquired with a laser scanning confocal microscope (Zeiss 510 META, Carl Zeiss Microimaging, Göttingen, Germany) or structural illuminated microscope (Zeiss Axiovert microscope with Apotome, Zeiss). For the laser scanning confocal microscopy, AlexaFluor 488 was excited by a 488 nm Ar laser, and emitted fluorescence was filtered with a 500–530 nm band-pass filter. Fast Red was excited by a 543-nm He–Ne laser, and emitted fluorescence was filtered with a 565–615 nm band-pass filter. AlexaFluor 647 was excited by a 633-nm He–Ne laser, and emitted fluorescence was filtered with a 650-nm low-pass filter. Images of each dye were taken sequentially to avoid bleed-through artifact. For structural illuminated microscopy, filter sets for FITC, rhodamine, and Cy5 were used to visualize AlexaFluor 488, FastRed, and AlexaFluor 647, respectively. Minimal adjustments of the levels were made by Photoshop CS3 (Adobe Systems, San Jose, CA, USA).
To plot FG-immunofluorescent cells, we took images of FG-positive cells with a ×10 lens (NA 0.5). Outlines of the evenly spaced (200 μm) serial sections were traced with Neurolucida (MBF Bioscience, Inc., Williston, VT, USA), and the images of FG-positive cells were assembled on the trace. The nuclei were identified by Nissl cytoarchitecture, and in accordance with Mugnaini et al. (1980) for the cochlear nuclei complex (CNC), Schofield and Cant (1991) for the superior olivary complex (SOC), Saint Marie et al. (1997) for the nuclei of the lateral lemniscus (NLL), and Loftus et al. (2008) for the IC.
Results
Injection sites
The injection was restricted to the IC in all 14 cases. In nine cases, the injection site was mainly in the ICC. In two cases, the injection site was in the lateral cortex of the IC (LC). In three cases, the injection was made around the border of the ICC and LC. Double fluorescent ISH combined with FG immunohistochemistry was performed in three cases, and those injection sites were in the ICC (08-110; Figure 1A) and the border of the ICC and LC (08-118 and 08-124; Figures 1B,C).
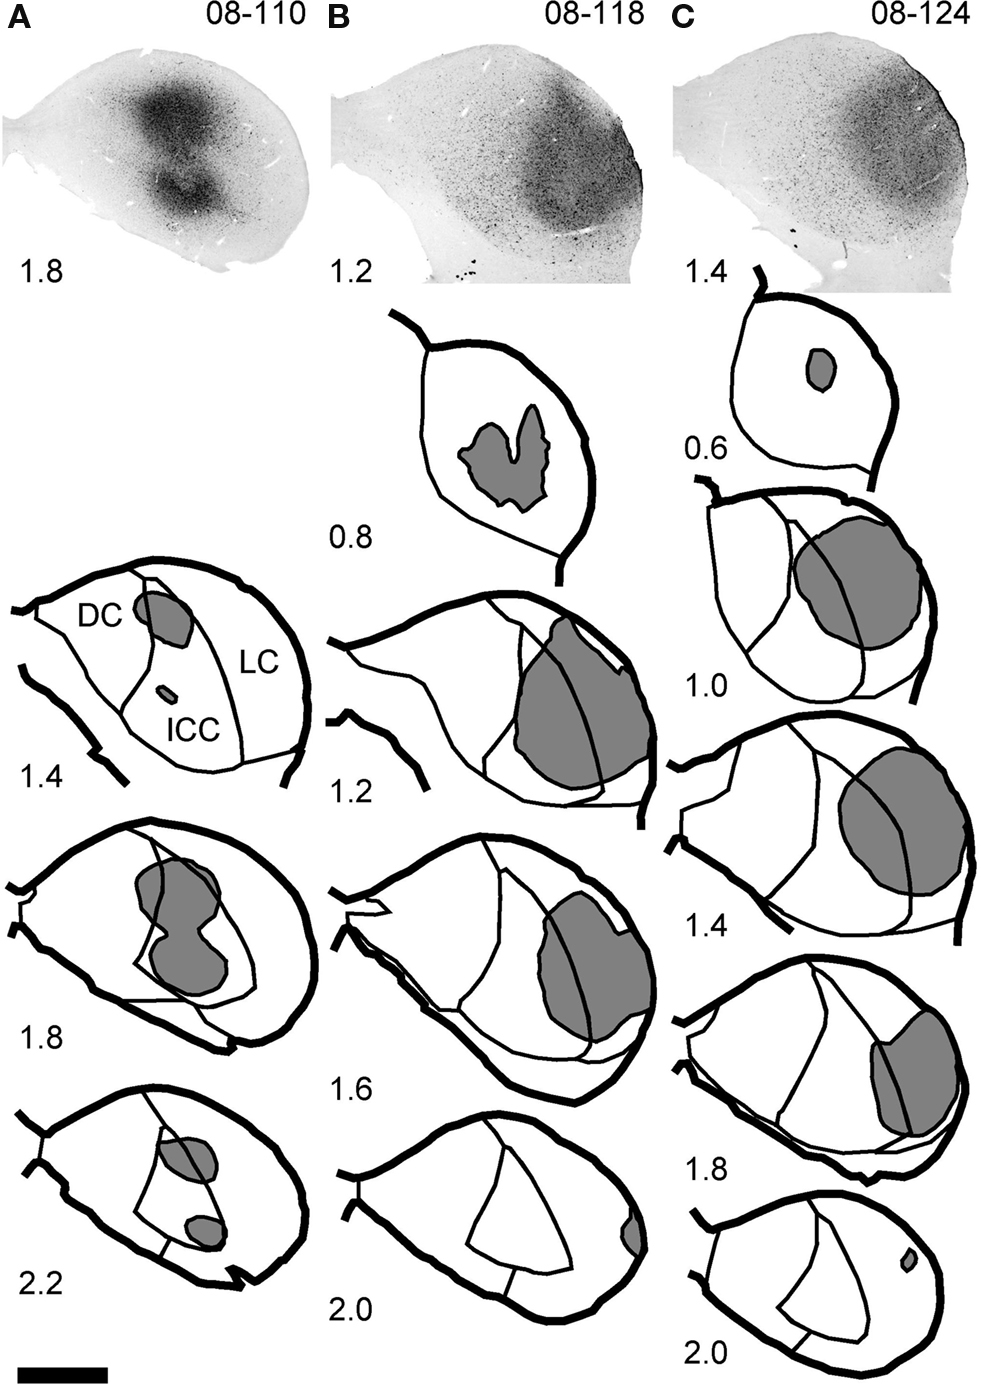
Figure 1. Injection sites of FG. Top images show the center of the injection site in three animals processed for fluorescent ISH. Line drawings show the full extent of the injection sites (gray) at several rostro-caudal levels. In case 08-110 (A), the injection is almost restricted to the central nucleus (ICC). In cases 08-118 (B) and 08-124 (C), the injections are larger, and they cover both the lateral cortex (LC) and lateral part of the ICC. Numbers indicate the distance (in millimeters) from the section which contains the most rostral part of the ventral nucleus of the lateral lemniscus (VNLL). Note that in the case 08-110, two injections were made. Scale bar: 1 mm.
Overview of Retrograde Labeling and Vglut Gene Expression
The combined analysis of retrograde FG-labeling and gene expression for VGLUT revealed four patterns of retrogradely labeled neurons. Some retrogradely FG-labeled neurons expressed the gene for VGLUT2 only (VGLUT2 in the text; FG+/V1−/V2+ in the figures and tables). Others co-expressed both VGLUT1 and VGLUT2 (VGLUT1&2 in the text; FG+/V1+/V2+ in the figures and tables). The third pattern was FG-labeling and the absence of either VGLUT1 or VGLUT2 gene expression (FG+/V1−/V2− in the figures and tables). This is most likely associated with neurons that use GABA or glycine as a neurotransmitter. These first three patterns were prevalent in the auditory midbrain, pons, and medulla. FG-labeling with gene expression of VGLUT1 alone was not seen in these regions. However, in the auditory cortex the only pattern observed was FG-labeled neurons that expressed only VGLUT1 (VGLUT1 in the text). In all cases, FG-retrogradely labeled cells were found in the contralateral IC, bilaterally in the dorsal NLL (DNLL), ipsilaterally in the intermediate and ventral NLL (INLL and VNLL), bilaterally in the SOC, and contralaterally in the CNC. Four cases had bilateral FG retrograde label in the auditory cortex. The general pattern of retrograde labeling was consistent with previous studies (Beyerl, 1978; Coleman and Clerici, 1987; Herbert et al., 1991; Saldana and Merchan, 1992; Gonzalez-Hernandez et al., 1996; Oliver et al., 1999).
Midbrain
The main source of VGLUT2 inputs to the IC from the midbrain was the contralateral IC and the ipsilateral INLL. The majority of the retrogradely labeled cells in the IC were located in the contralateral central nucleus (Figure 2A). We found numerous neurons expressing VGLUT2 but none that expressed VGLUT1. VGLUT2 was expressed in around 90% of FG-positive cells in the central nucleus and lateral cortex (Table 2) and in over 70% of FG-positive neurons in dorsal cortex (Table 2). No neurons expressed VGLUT1 or VGLUT1&2 (Figures 2B,3A1–4; Tables 1,2). The FG-labeled cells without VGLUT expression are likely the GABAergic neurons. So, both glutamatergic and GABAergic neurons have projections through the commissure of the IC.
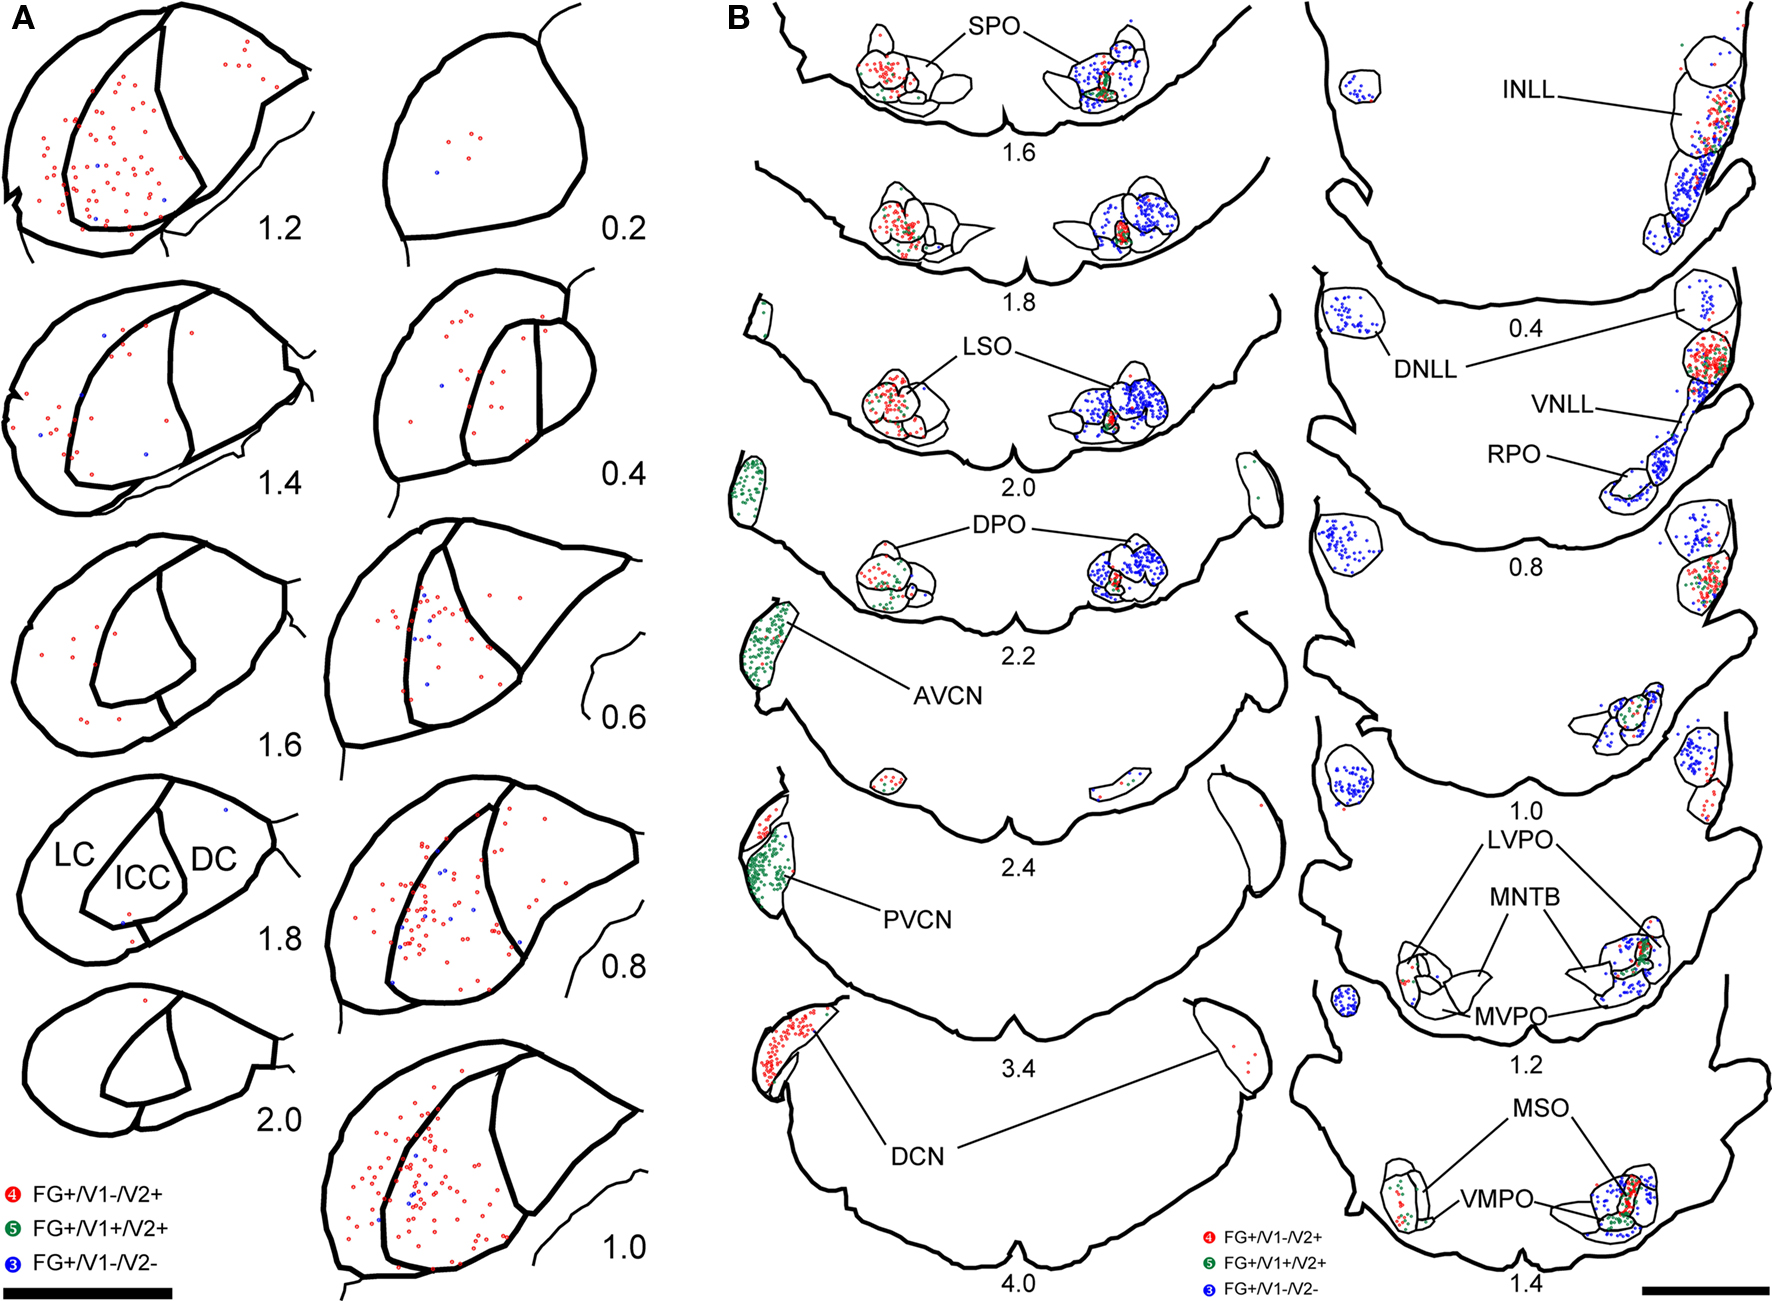
Figure 2. Plots of retrogradely labeled cells in the IC (A), NLL, SOC, and CNC (B) of the case 08-118. In the IC (A), contralateral side to the injection site was presented. Red dots indicate cells positive for both FG and VGLUT2 but negative for VGLUT1 (FG+/ V1−/ V2+). Green dots indicate cells positive for all three molecules (FG+/ V1+/ V2+). Blue dots indicate cells positive for FG but negative for VGLUT1 and VGLUT2 (FG+/ V1−/ V2−). Numbers indicate the distance (in millimeter) from the section which contains the most rostral part of the VNLL. Scale bar: 2 mm.
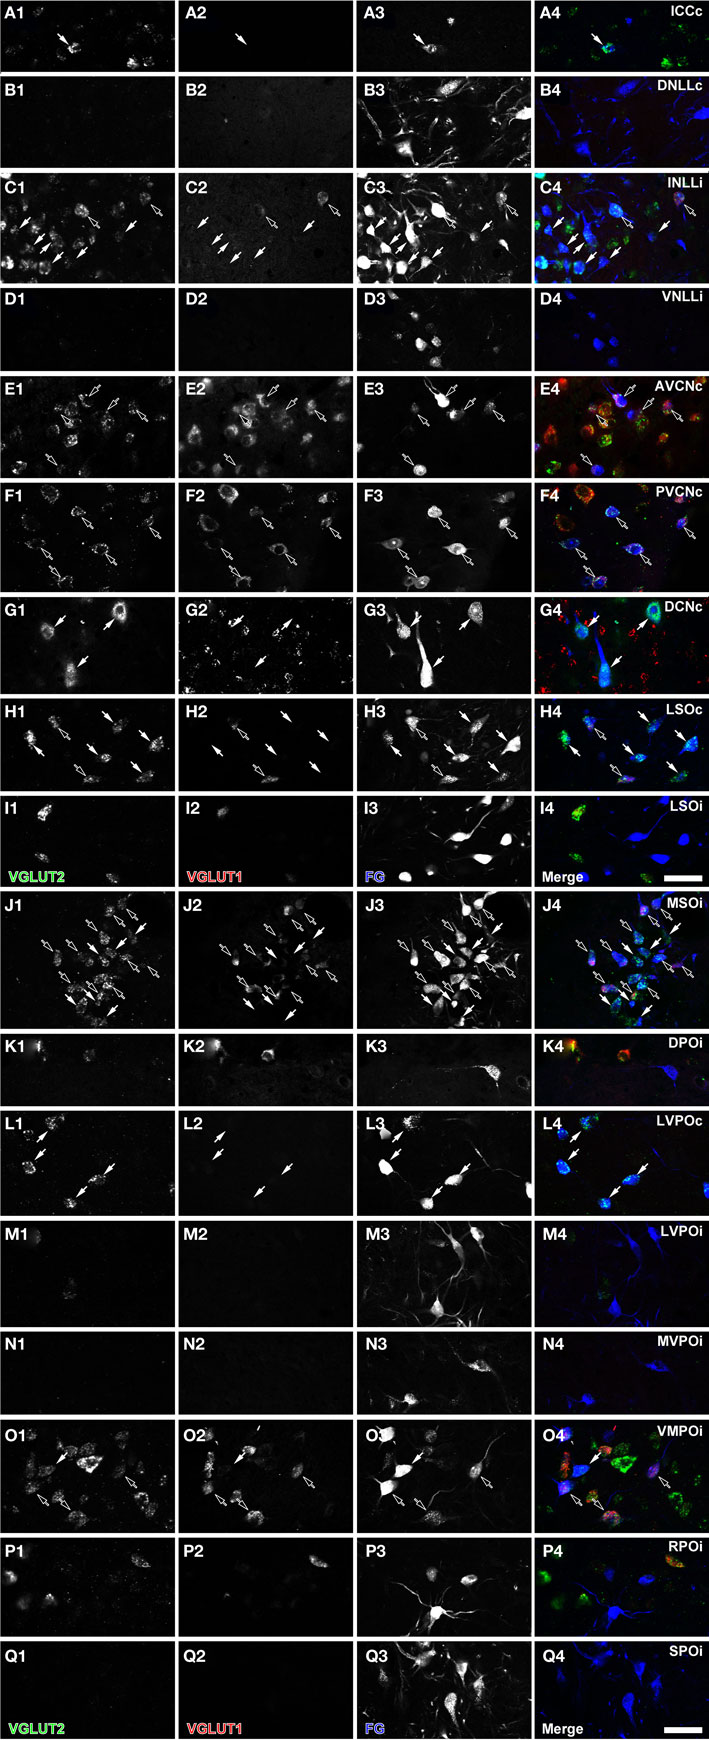
Figure 3. Fluorescent micrographs of retrogradely labeled cells in the IC (A), NLL (B–D), CNC (E–G), and SOC (H–Q). Some retrogradely labeled cells expressed only VGLUT2 (white arrows) or both VGLUT1 and VGLUT2 (black arrows). The “c” and “i” after the abbreviation of the nuclei mean contralateral and ipsilateral to the injection site. Green: VGLUT2; red: VGLUT1; blue: FG. Scale bar: 50 μm.
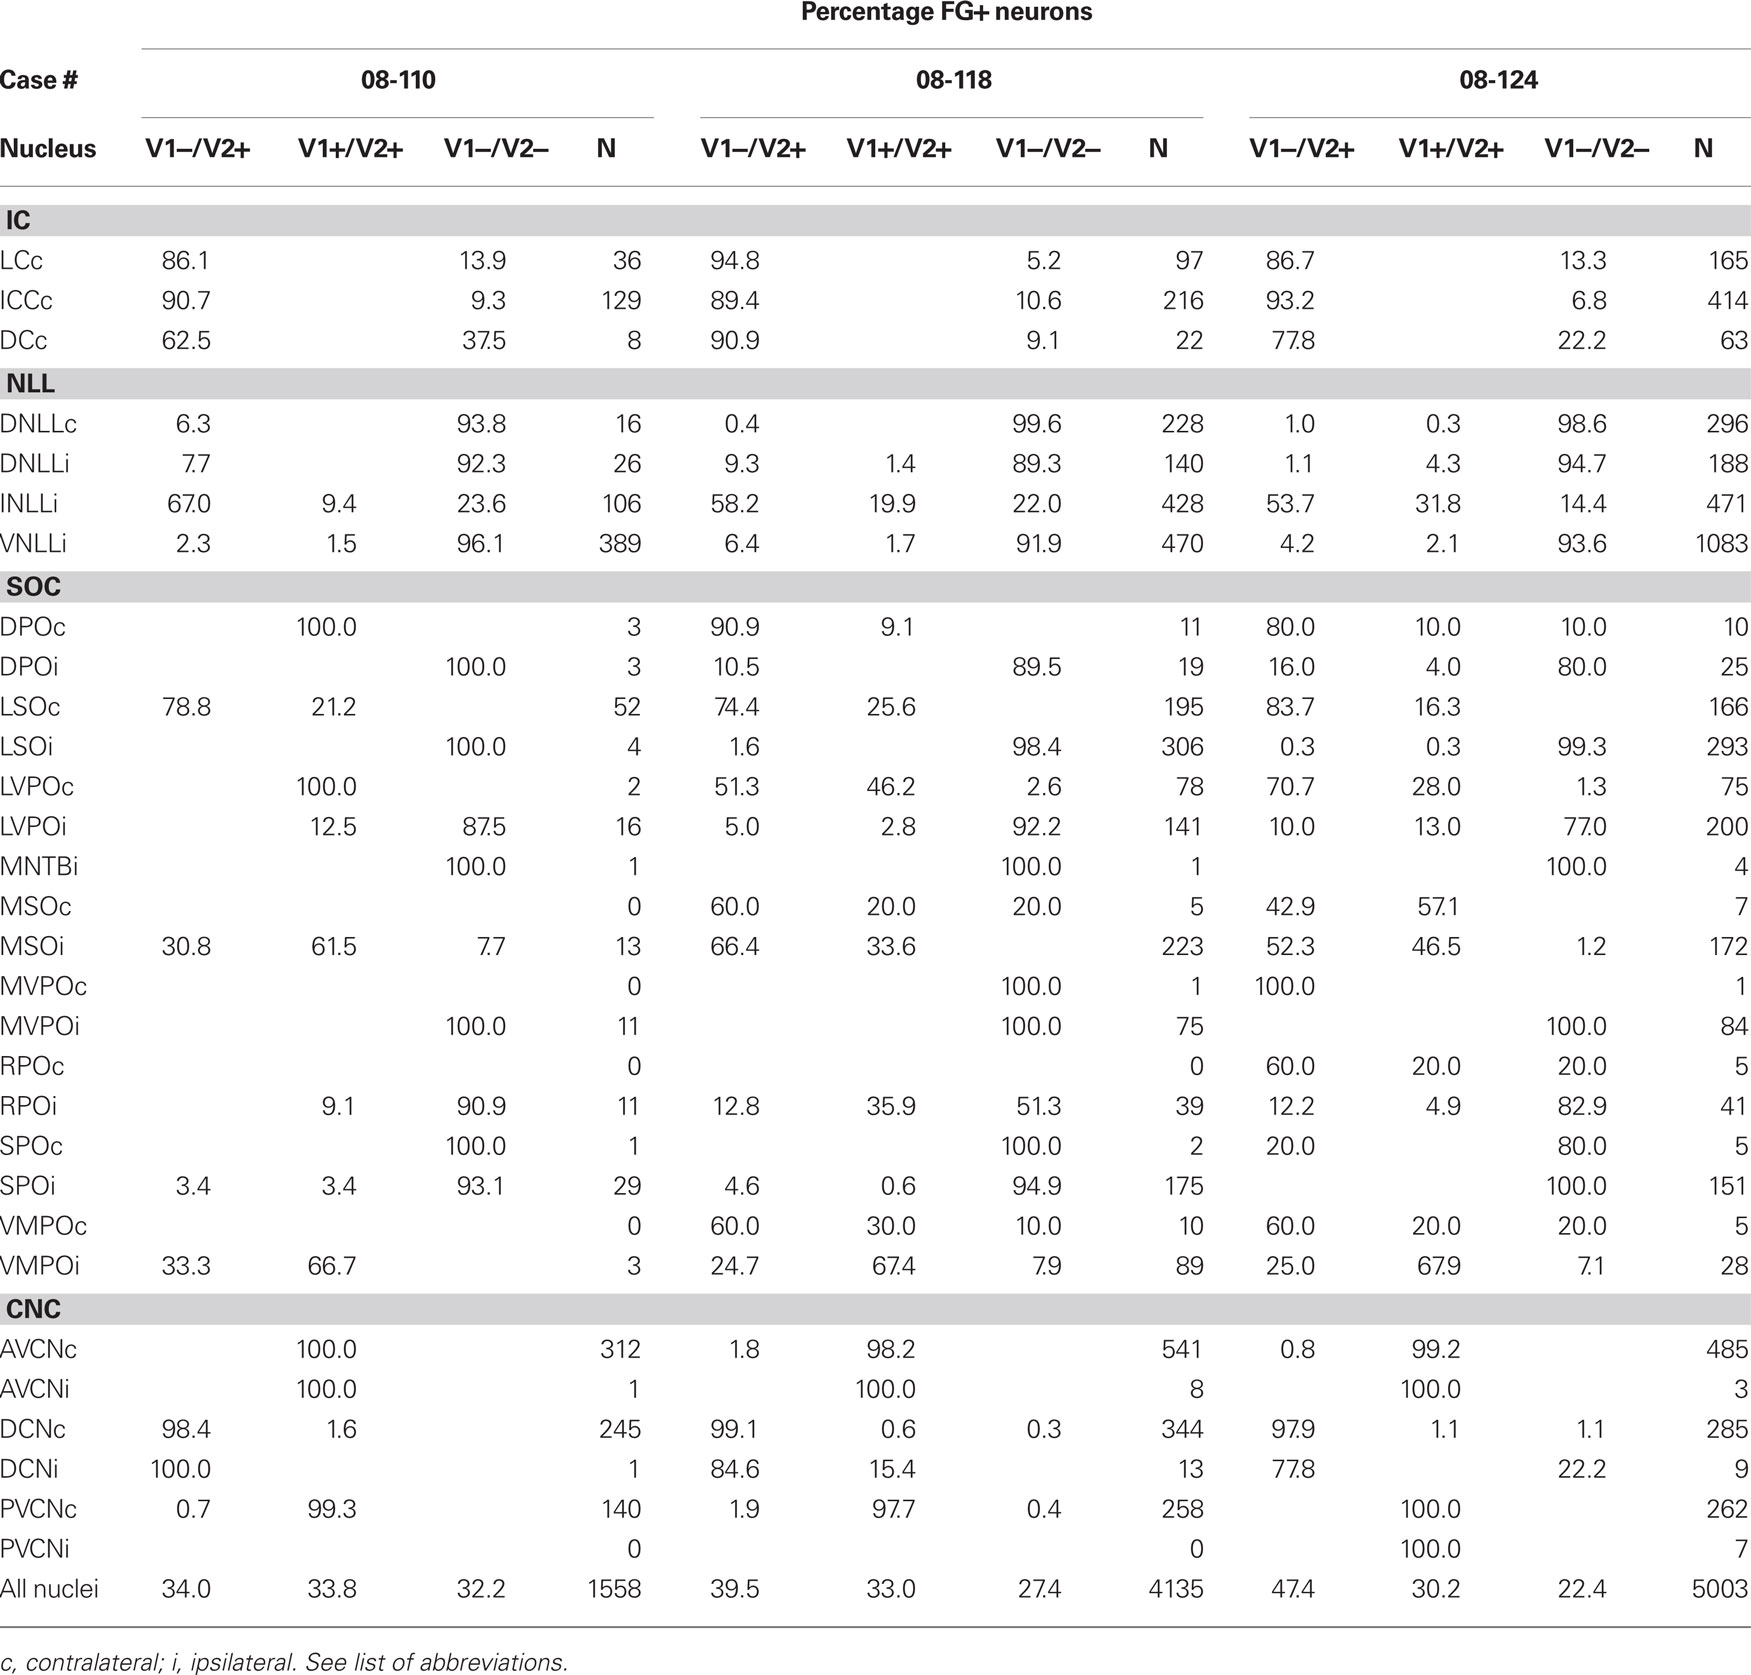
Table 1. The percentage and number of FG-positive neurons that express VGLUT1 (V1) and/or VGLUT2 (V2).
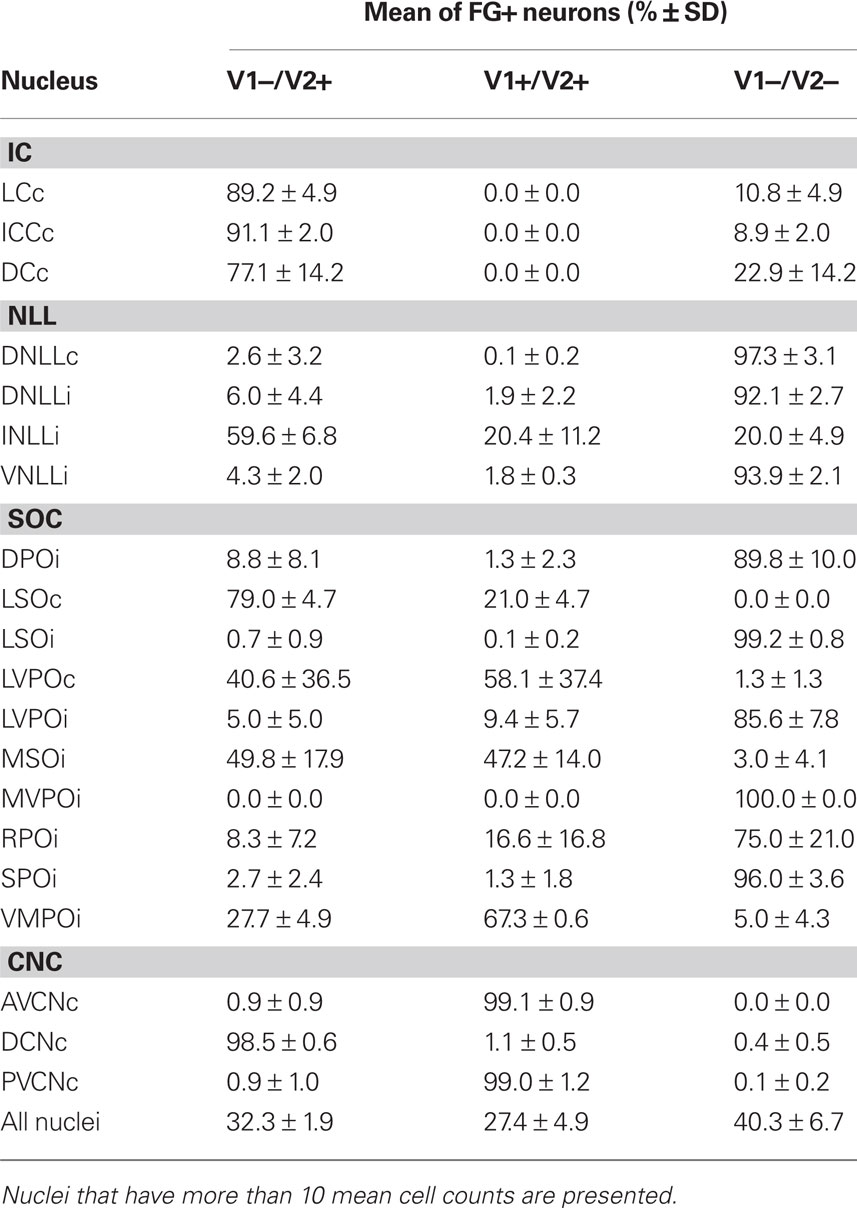
Table 2. Mean percentage and standard deviation of all FG-positive cells that express VGLUT1 (V1) and VGLUT2 (V2) calculated from the three cases in Table 1.
The INLL also had significant numbers of FG-labeled, VGLUT2-expressing cells. Fewer FG-labeled cells expressed VGLUT1&2. Both patterns were found throughout the nucleus (Figure 2B, sections 0.4–1.4). Over 50% of FG-positive cells in the ipsilateral INLL expressed VGLUT2 (white arrows in Figure 3C). Around 20% of retrogradely labeled cells co-expressed VGLUT1&2 (black arrows in Figure 3C). The morphology was very similar for the FG-positive cells that expressed VGLUT1&2 or VGLUT2 alone (Figure 3C) and project to the IC.
In the DNLL, expression of either VGLUT was rare (Figure 2B, sections 0.4–1.4; Figure 3B). We found that VGLUT negative neurons comprised over 90% of FG-labeled neurons in the contralateral and ipsilateral side, respectively (Table 2). Most likely, these are GABAergic neurons. A similar pattern was seen in the ventral part of the lateral lemniscus where the expression of VGLUT was rare. Over 90% of VNLL retrogradely labeled cells were not positive for VGLUT1 or VGLUT2 (Figure 2B, sections 0.4 and 0.8; Figure 3D). These are likely GABAergic and/or glycinergic neurons with projections to the IC.
Cochlear Nucleus
Most FG-labeled neurons in the cochlear nucleus were found on the contralateral side, but the patterns in AVCN and PVCN were different from the DCN (Figure 2B, sections 2.0–4.0). Almost all the FG-positive cells (99%) co-expressed VGLUT1&2 in the AVCN (Figure 3E) and PVCN (Figure 3F). These were likely to be T-stellate cells with projections to the IC (Oliver, 1987; Oertel et al., 1990; Oliver et al., 1999). In contrast, the large cells in the DCN mainly found in layer 2 expressed only VGLUT2, and only these, presumably fusiform cells, were labeled with FG (Figure 3G). This is consistent with presumed glutamatergic inputs to the IC from these cells (Adams, 1979; Oliver, 1984a). No other neurons were FG-labeled including the small granule cells that were positive for only VGLUT1 (Figure 3G2).
Superior Olivary Complex
In general, the IC projections from the SOC followed either the LSO pattern, the MSO pattern, or the SPO pattern. The LSO pattern was a mixture of VGLUT expression on the contralateral side and non-VGLUT expression on the ipsilateral side. The MSO pattern was predominantly an ipsilateral projection that was exclusively VGLUT-positive. The SPO pattern was also an ipsilateral projection, but it was exclusively non-glutamatergic (Table 2).
In the contralateral LSO, all FG-positive cells expressed VGLUT2 (Table 2; white arrows in Figure 3H). About 20% co-expressed VGLUT1&2. The morphology of these two types of FG-positive cells was similar (Figure 3I). Cells expressing both molecules were located throughout the nucleus (Figure 2B, sections 1.6–2.2) and represent an exclusively glutamatergic contralateral LSO projection. In the ipsilateral LSO, to the contrary, 99% of the hundreds of FG-positive cells were negative for both VGLUT1 and VGLUT2 (Table 2; Figure 3I). Thus, the ipsilateral LSO projection is probably exclusively glycinergic, and a glutamatergic input to the ipsilateral IC from LSO appears to be absent in the rat.
In the LSO pattern, VGLUT2 or VGLUT1&2 expression in FG-labeled neurons was seen on the contralateral side, and a lack of VGLUT expression was seen on the ipsilateral side. The DPO (Figure 2B, sections 1.0–2.2; Figure 3K), the LVPO (Figure 2B, sections 1.0–2.2; Figures 3L,M), and the RPO (Figure 2B, sections 0.4–1.0; Figure 3P) followed the general LSO pattern. However, they tended to have fewer FG-labeled VGLUT2 or VGLUT1&2 expressing neurons on the contralateral side (Table 1) and FG-positive cells expressed neither VGLUT gene on the ipsilateral side (Table 2). Thus, this pattern provides mixed glutamatergic and non-glutamatergic inputs to the IC with a predominant inhibitory input from the ipsilateral side.
In the MSO, almost all FG-positive cells expressed VGLUT2 on the ipsilateral side. About half of these co-expressed VGLUT1&2 (Table 2; black arrowheads in Figure 3J). Both types of neurons were located throughout the nucleus (Figure 2B, sections 1.2–2.2) and were flat-shaped and densely packed in the dorso-ventral axis. Thus, at least 97% of the ipsilateral MSO projection to IC is glutamatergic.
The MSO pattern emphasizes the ipsilateral glutamatergic input to IC. The VMPO follows the MSO pattern (Figure 2B, sections 1.2–2.2). FG-positive cells were mainly found on the ipsilateral side, and most of them colocalized VGLUT2. The majority of FG-positive cells co-expressed VGLUT1&2 (Table 2). Both VGLUT2 and VGLUT1&2 cells had similar morphology (Figure 3O).
In the SPO pattern, VGLUT expression was rare and most projections to IC were ipsilateral.
This pattern was seen in the SPO (Figure 2B, sections 1.0–2.2) and the MVPO (Figure 2B, sections 0.8–2.2). In SPO, over 96% of FG-positive cells were negative for VGLUT1 and/or VGLUT2 (Table 2; Figure 3Q). Likewise, in the MVPO there were almost no VGLUT-expressing, FG-positive neurons found on the ipsilateral side (Table 1; Figure 3N). These data suggest both SPO and MVPO function exclusively as ipsilateral inhibitory inputs to IC. Interestingly, this is similar to the pattern seen for the VNLL, non-glutamatergic inputs to ipsilateral IC. Both VNLL and these periolivary nuclei may receive excitatory inputs from the contralateral cochlear nucleus.
Auditory Cortex
In the ipsilateral AC, numerous neurons were retrogradely labeled with FG and expressed VGLUT1 (Figure 4A). We examined the cortex in four cases that underwent non-florescent ISH and found that most retrogradely labeled cells were in layer 5 and expressed only VGLUT1 (Figure 4C). In contrast, FG-labeled cells did not express VGLUT2 (Figures 4B,D). VGLUT2 expression in the cortex was slightly above the background level in layer 2–4 and moderate in layer 6 in the rostral AC (Figures 5A,B), which is consistent with previous studies (Hisano et al., 2000; De Gois et al., 2005). This weak expression of VGLUT2 in the cortex was in contrast to the strong expression in the thalamus seen in the same section (Figure 5C). Since all FG-positive cells expressed only VGLUT1, we did not count the FG-labeled cells or calculate the percentage of VGLUT in FG-labeled cells.
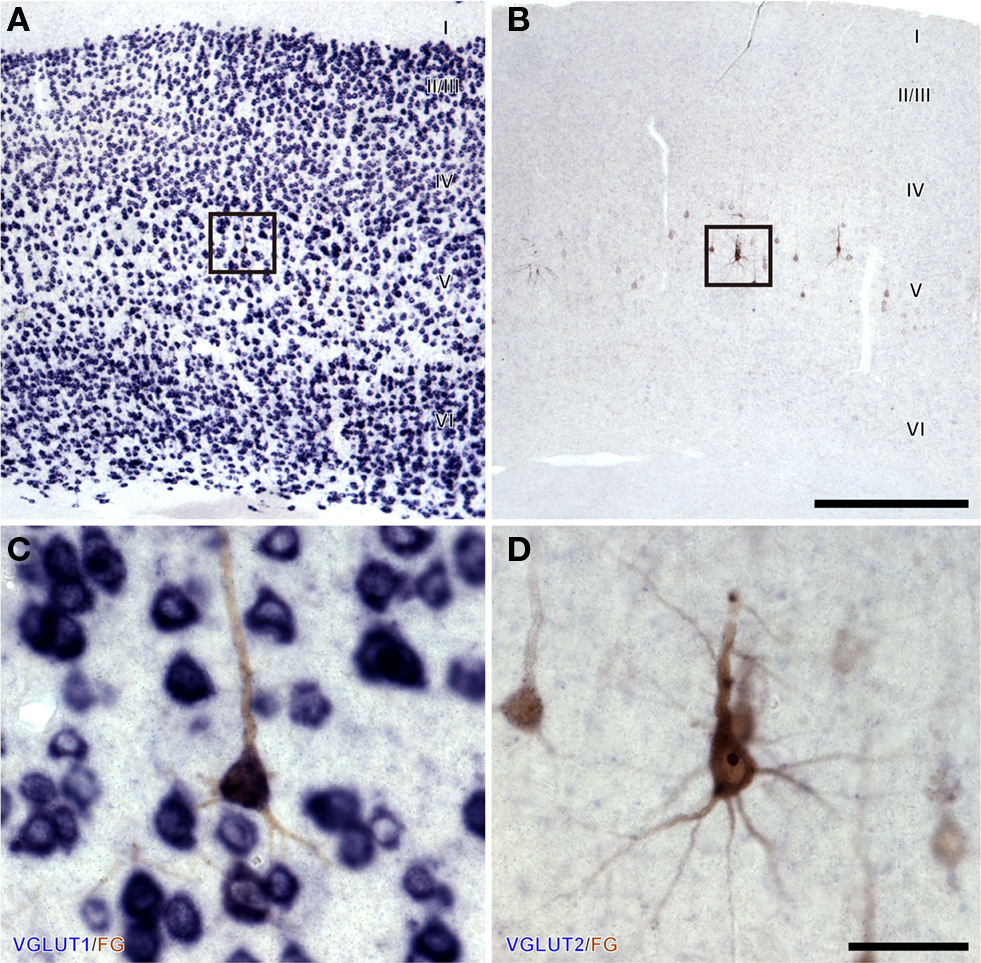
Figure 4. Corticofugal neurons in layer 5 (V) express only VGLUT1. Brightfield ISH for VGLUT1 (A,C) or VGLUT2 (B,D) combined with immunohistochemistry for FG showed that retrogradely labeled pyramidal neurons express VGLUT1 but not VGLUT2. (C,D) Are the higher magnification of boxes in (A,B), respectively. Scale bars: 500 μm (A,B), and 50 μm (C,D)
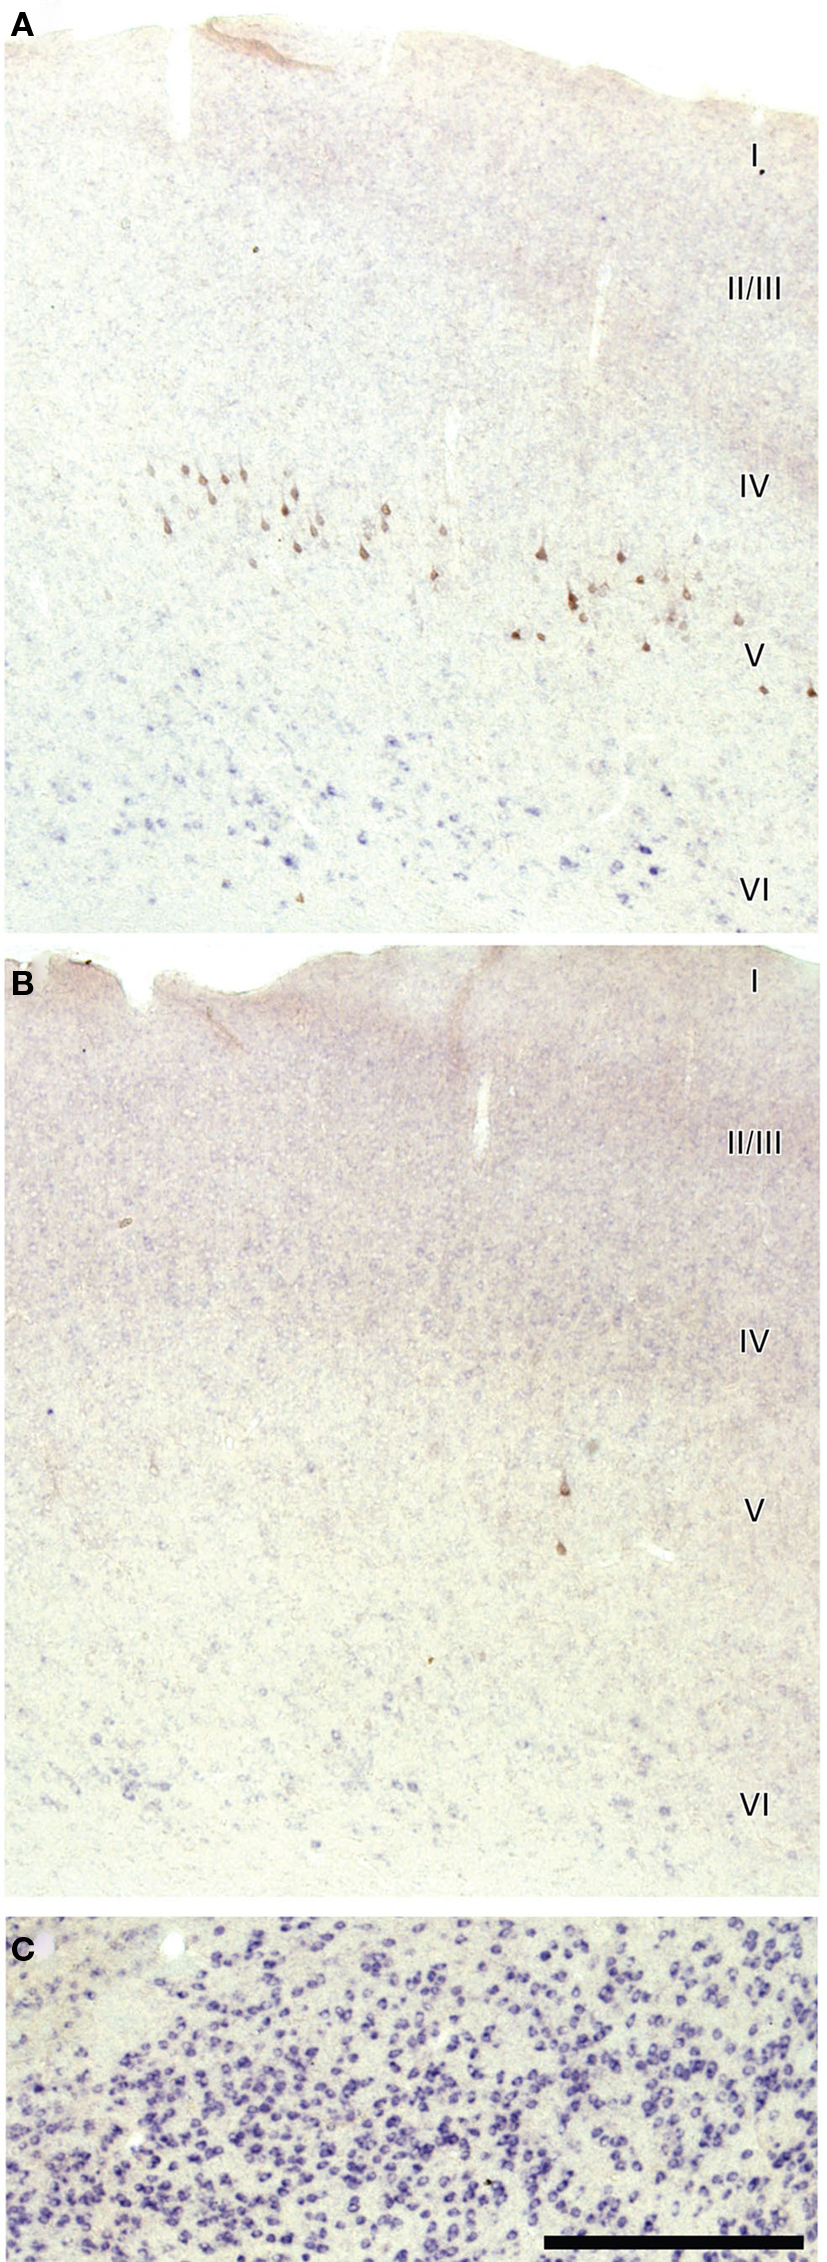
Figure 5. Weak expression of VGLUT2 in layer 6 (VI) of rostral auditory cortex in same case as Figure 4. Compared to Figure 4B, this section is developed to show weak expression and consequently some background labeling. Modest VGLUT2 expression is in layer 6 of ipsilateral cortex (A) and contralateral cortex (B), but it is weak compared to the thalamus of the same section (C). Labeling in layers 2/3 and 4 (II/III and IV) is slightly above background and less intense than layer 6. Lack of above background label in layer 5 suggests no FG? neurons are VGLUT2 positive. Scale bar: 500 μm.
Discussion
These results suggest the origins of both excitatory and inhibitory terminals in the IC. In the IC, putative glutamatergic terminals contain VGLUT1 and/or VGLUT2 (Altschuler et al., 2008; Ito et al., 2009). Three kinds of glutamatergic terminals are seen in the IC, those with only the VGLUT2 protein, those with only the VGLUT1 protein, and those with both proteins (Ito et al., 2009). Neither terminals nor soma positive for VGLUT3 were found in the IC (Ito et al., 2009). The present data offer new information about the origins of these terminals. The VGLUT1 terminals in the IC most likely arise from pyramidal cells in the auditory cortex since that is the predominant gene expressed in cortex. The IC terminals that contain GABA or glycine are highly likely to come from the FG-positive cells that lack VGLUT1 and VGLUT2 expression. The IC terminals that contain VGLUT1 and VGLUT2 proteins most likely come from the neurons that express both genes, and this pattern is most prevalent in the ventral cochlear nucleus. The VGLUT2 terminals constitute the largest number of terminals in the IC. It is of interest because it is the only type of terminal that makes dense axosomatic and axodendritic terminals on the large GABAergic tectothalamic neurons (Ito et al., 2009). However, there are multiple inputs that could be the source of these terminals.
Possible Sources of Axosomatic Vglut2 Terminals in IC
Our data demonstrate that possible sources of VGLUT2 terminals in the IC are the contralateral LSO and DCN and the ipsilateral INLL, MSO, and VMPO. Each of these sources is also a potential source for the axosomatic VGLUT2 terminals on the large GABAergic neurons in the IC. In addition, the local axons of IC neurons from the both the ipsilateral and contralateral sides are possible sources of VGLUT2 axosomatic terminals. Most IC neurons make local axonal collaterals (Oliver et al., 1991) and many project contralaterally through the commissure to the opposite side (Saldana and Merchan, 1992). These multiple sources of VGLUT2 may make different types of terminals in the IC. For example, some VGLUT2 terminals synapse on small, distal dendrites (Altschuler et al., 2008; Ito et al., 2009), and these may not be from the same source as the dense VGLUT2 axosomatic terminals. Some DCN terminals with round synaptic vesicles make asymmetric axosomatic synapses on large IC cells in the cat (Oliver, 1984a, 1985). So, DCN neurons expressing VGLUT2 may be the source of some of the VGLUT2 axosomatic terminals on the large GABAergic IC neurons. Indeed, the GABAergic neurons are the largest IC cells in the cat (Oliver et al., 1994) similar to the rat (Ito et al., 2009).
It is unlikely that a single axon forms all of the axosomatic VGLUT2 terminals that surround the soma of the large GABAergic IC cells in the IC (Ito et al., 2009). Calyx- or endbulb-like terminals have not been seen in the IC in Golgi preparations or in anterograde transport experiments (Morest and Oliver, 1984; Oliver, 1984b; Oliver et al., 1991, 1999). These endings may come from a single brainstem nucleus or multiple nuclei.
Cells with axosomatic VGLUT2-positive terminals are distributed in all parts of the IC (Ito et al., 2009). This suggests that if a single nucleus supplies all the axosomatic VGLUT2 endings, the most likely source is a nucleus where retrogradely FG-labeled cells are always numerous regardless of the location of the injection site in the IC. Using this logic, our data suggest that the MSO and LSO are unlikely candidates for a single source since the number of retrogradely labeled cells in those nuclei varied dramatically between cases, while the number of retrogradely labeled cells in the other nuclei was consistently high. Only 4/14 cases (including 08-118 and 08-124) in which injections were made in lateral ICC have large numbers of retrogradely labeled cells in the LSO and MSO. These results are consistent with the findings in the gerbil (Cant and Benson, 2006) where the number of retrogradely labeled cells in the LSO and MSO were few when injections were made into the medial central nucleus. On the other hand, if the VGLUT2 axosomatic endings are formed by terminals from multiple sources, we cannot exclude any of the nuclei.
One population of IC terminals contained both VGLUT1 and VGLUT2 proteins, and this suggests one or more source expressing both genes. Since axosomatic endings on large IC GABAergic neurons express only VGLUT2 (Altschuler et al., 2008; Ito et al., 2009), it is unlikely that nuclei with neurons expressing VGLUT1&2 will be the sources of the dense axosomatic synapse. The percentage of neurons expressing VGLUT1&2 was larger than VGLUT2 alone in the AVCN, PVCN, LVPO, and VMPO. Since AVCN and PVCN exclusively expressed VGLUT1&2, they can be ruled out completely as a source for the VGLUT2 terminals in IC. Most presumed terminals from the AVCN in the SOC contain both VGLUT1 and VGLUT2 proteins (e.g., Billups, 2005).
Functional Considerations
The present results demonstrate that different combinations of VGLUT gene expression are present in the auditory brainstem nuclei that project to the IC. This may be related to functional differences in the pathways to the IC. The properties of the vesicular transporters of glutamate are very similar (Schafer et al., 2002; Varoqui et al., 2002); however, the vesicles that use VGLUT1 have two pathways for recycling vesicles, while those using VGLUT2 or VGLUT3 only have one (Voglmaier et al., 2006). This suggests that vesicles using VGLUT1 may recycle faster under prolonged, high-frequency stimuli. This ability to recycle faster may explain why the VGLUT1 synapses on hippocampal neurons depress more slowly than VGLUT2 synapses in response to high-frequency stimulation and recover more quickly (Fremeau Jr. et al., 2004). This resistance to depression and faster recycling may be related to the prevalence of VGLUT1&2 expression in the AVCN, MSO, VMPO, and LVPO pathways. The VGLUT1-expression pattern was also found in the MGV and auditory cortex where phase locking is not commonly expected, and it raises the possibility that VGLUT1 may be associated fast spiking neurons or other synaptic functions. In contrast, the pure VGLUT2 synapses from the DCN and local IC axons may have a different function unrelated to rapid firing and rapid vesicle recycling.
Conflict of Interest Statement
The authors declare that the research was conducted in the absence of any commercial or financial relationships that could be construed as a potential conflict of interest.
Acknowledgments
We gratefully acknowledge the gift of the VGLUT1 and VGLUT2 riboprobes from Drs. Tetsuo Yamamori and Akiya Watakabe (National Institute for Basic Biology, Japan) and Phillip Polychoniou (Duke University) for his help with the data analysis. This work is supported by grants from Uehara Memorial Research Scholarship (Tetsufumi Ito) and NIH DC00189 (Douglas L. Oliver).
References
Adams, J. C. (1979). Ascending projections to the inferior colliculus. J. Comp. Neurol. 183, 519–538.
Alibardi, L. (1998). Ultrastructural and immunocytochemical characterization of neurons in the rat ventral cochlear nucleus projecting to the inferior colliculus. Ann. Anat. 180, 415–426.
Altschuler, R. A., Tong, L., Holt, A. G., and Oliver, D. L. (2008). Immunolocalization of vesicular glutamate transporters 1 and 2 in the rat inferior colliculus. Neuroscience 154, 226–232.
Beyerl, B. D. (1978). Afferent projections to the central nucleus of the inferior colliculus in the rat. Brain Res. 145, 209–223.
Billups, B. (2005). Colocalization of vesicular glutamate transporters in the rat superior olivary complex. Neurosci. Lett. 382, 66–70.
Cant, N. B., and Benson, C. G. (2006). Organization of the inferior colliculus of the gerbil (Meriones unguiculatus): differences in distribution of projections from the cochlear nuclei and the superior olivary complex. J. Comp. Neurol. 495, 511–528.
Coleman, J. R., and Clerici, W. J. (1987). Sources of projections to subdivisions of the inferior colliculus in the rat. J. Comp. Neurol. 262, 215–226.
De Gois, S., Schafer, M. K., Defamie, N., Chen, C., Ricci, A., Weihe, E., Varoqui, H., and Erickson, J. D. (2005). Homeostatic scaling of vesicular glutamate and GABA transporter expression in rat neocortical circuits. J. Neurosci. 25, 7121–7133.
Fremeau, R. T. Jr., Kam, K., Qureshi, T., Johnson, J., Copenhagen, D. R., Storm-Mathisen, J., Chaudhry, F. A., Nicoll, R. A., and Edwards, R. H. (2004). Vesicular glutamate transporters 1 and 2 target to functionally distinct synaptic release sites. Science 304, 1815–1819.
Gonzalez-Hernandez, T., Mantolan-Sarmiento, B., Gonzalez-Gonzalez, B., and Perez-Gonzalez, H. (1996). Sources of GABAergic input to the inferior colliculus of the rat. J. Comp. Neurol. 372, 309–326.
Herbert, H., Aschoff, A., and Ostwald, J. (1991). Topography of projections from the auditory cortex to the inferior colliculus in the rat. J. Comp. Neurol. 304, 103–122.
Hisano, S., Hoshi, K., Ikeda, Y., Maruyama, D., Kanemoto, M., Ichijo, H., Kojima, I., Takeda, J., and Nogami, H. (2000). Regional expression of a gene encoding a neuron-specific Na(+)-dependent inorganic phosphate cotransporter (DNPI) in the rat forebrain. Brain Res. Mol. Brain Res. 83, 34–43.
Ito, T., Bishop, D. C., and Oliver, D. L. (2009). Two classes of GABAergic neurons in the inferior colliculus. J. Neurosci. 29, 13860–13869.
Ito, T., Hioki, H., Nakamura, K., Kaneko, T., Iino, S., and Nojyo, Y. (2008). Some gamma-motoneurons contain gamma-aminobutyric acid in the rat cervical spinal cord. Brain Res. 1201, 78–87.
Ito, T., Hioki, H., Nakamura, K., Tanaka, Y., Nakade, H., Kaneko, T., Iino, S., and Nojyo, Y. (2007). Gamma-aminobutyric acid-containing sympathetic preganglionic neurons in rat thoracic spinal cord send their axons to the superior cervical ganglion. J. Comp. Neurol. 502, 113–125.
Kaneko, T., and Fujiyama, F. (2002). Complementary distribution of vesicular glutamate transporters in the central nervous system. Neurosci. Res. 42, 243–250.
Kaneko, T., Fujiyama, F., and Hioki, H. (2002). Immunohistochemical localization of candidates for vesicular glutamate transporters in the rat brain. J. Comp. Neurol. 444, 39–62.
Liang, F., Hatanaka, Y., Saito, H., Yamamori, T., and Hashikawa, T. (2000). Differential expression of gamma-aminobutyric acid type B receptor-1a and -1b mRNA variants in GABA and non-GABAergic neurons of the rat brain. J. Comp. Neurol. 416, 475–495.
Loftus, W. C., Bishop, D. C., Saint Marie, R. L., and Oliver, D. L. (2004). Organization of binaural excitatory and inhibitory inputs to the inferior colliculus from the superior olive. J. Comp. Neurol. 472, 330–344.
Loftus, W. C., Malmierca, M. S., Bishop, D. C., and Oliver, D. L. (2008). The cytoarchitecture of the inferior colliculus revisited: a common organization of the lateral cortex in rat and cat. Neuroscience 154, 196–205.
Morest, D. K., and Oliver, D. L. (1984). The neuronal architecture of the inferior colliculus in the cat: defining the functional anatomy of the auditory midbrain. J. Comp. Neurol. 222, 209–236.
Mugnaini, E., Warr, W. B., and Osen, K. K. (1980). Distribution and light microscopic features of granule cells in the cochlear nuclei of cat, rat, and mouse. J. Comp. Neurol. 191, 581–606.
Nakamura, K., Watakabe, A., Hioki, H., Fujiyama, F., Tanaka, Y., Yamamori, T., and Kaneko, T. (2007). Transiently increased colocalization of vesicular glutamate transporters 1 and 2 at single axon terminals during postnatal development of mouse neocortex: a quantitative analysis with correlation coefficient. Eur. J. Neurosci. 26, 3054–3067.
Oertel, D., Wu, S. H., Garb, M. W., and Dizack, C. (1990). Morphology and physiology of cells in slice preparations of the posteroventral cochlear nucleus of mice. J. Comp. Neurol. 295, 136–154.
Oliver, D. L. (1984a). Dorsal cochlear nucleus projections to the inferior colliculus in the cat: a light and electron microscopic study. J. Comp. Neurol. 224, 155–172.
Oliver, D. L. (1984b). Neuron types in the central nucleus of the inferior colliculus that project to the medial geniculate body. Neuroscience 11, 409–424.
Oliver, D. L. (1985). Quantitative analyses of axonal endings in the central nucleus of the inferior colliculus and distribution of 3H-labeling after injections in the dorsal cochlear nucleus. J. Comp. Neurol. 237, 343–359.
Oliver, D. L. (1987). Projections to the inferior colliculus from the anteroventral cochlear nucleus in the cat: possible substrates for binaural interaction. J. Comp. Neurol. 264, 24–46.
Oliver, D. L., Beckius, G. E., and Shneiderman, A. (1995). Axonal projections from the lateral and medial superior olive to the inferior colliculus of the cat: a study using electron microscopic autoradiography. J. Comp. Neurol. 360, 17–32.
Oliver, D. L., Ostapoff, E. M., and Beckius, G. E. (1999). Direct innervation of identified tectothalamic neurons in the inferior colliculus by axons from the cochlear nucleus. Neuroscience 93, 643–658.
Oliver, D. L., Winer, J. A., Beckius, G. E., and Saint Marie, R. L. (1994). Morphology of GABAergic neurons in the inferior colliculus of the cat. J. Comp. Neurol. 340, 27–42.
Oliver, D. L., Kuwada, S., Yin, T. C., Haberly, L. B., and Henkel, C. K. (1991). Dendritic and axonal morphology of HRP-injected neurons in the inferior colliculus of the cat. J. Comp. Neurol. 303, 75–100.
Saint Marie, R. L., and Baker, R. A. (1990). Neurotransmitter-specific uptake and retrograde transport of [3H]glycine from the inferior colliculus by ipsilateral projections of the superior olivary complex and nuclei of the lateral lemniscus. Brain Res. 524, 244–253.
Saint Marie, R. L., Shneiderman, A., and Stanforth, D. A. (1997). Patterns of gamma-aminobutyric acid and glycine immunoreactivities reflect structural and functional differences of the cat lateral lemniscal nuclei. J. Comp. Neurol. 389, 264–276.
Saint Marie, R. L., Ostapoff, E. M., Morest, D. K., and Wenthold, R. J. (1989). Glycine-immunoreactive projection of the cat lateral superior olive: possible role in midbrain ear dominance. J. Comp. Neurol. 279, 382–396.
Saldana, E., and Merchan, M. A. (1992). Intrinsic and commissural connections of the rat inferior colliculus. J. Comp. Neurol. 319, 417–437.
Schafer, M. K., Varoqui, H., Defamie, N., Weihe, E., and Erickson, J. D. (2002). Molecular cloning and functional identification of mouse vesicular glutamate transporter 3 and its expression in subsets of novel excitatory neurons. J. Biol. Chem. 277, 50734–50748.
Schofield, B. R., and Cant, N. B. (1991). Organization of the superior olivary complex in the guinea pig. I. Cytoarchitecture, cytochrome oxidase histochemistry, and dendritic morphology. J. Comp. Neurol. 314, 645–670.
Takamori, S. (2006). VGLUTs: ‘exciting’ times for glutamatergic research? Neurosci. Res. 55, 343–351.
Varoqui, H., Schafer, M. K., Zhu, H., Weihe, E., and Erickson, J. D. (2002). Identification of the differentiation-associated Na+/PI transporter as a novel vesicular glutamate transporter expressed in a distinct set of glutamatergic synapses. J. Neurosci. 22, 142–155.
Voglmaier, S. M., Kam, K., Yang, H., Fortin, D. L., Hua, Z., Nicoll, R. A., and Edwards, R. H. (2006). Distinct endocytic pathways control the rate and extent of synaptic vesicle protein recycling. Neuron. 51, 71–84.
Watakabe, A., Ohsawa, S., Hashikawa, T., and Yamamori, T. (2006). Binding and complementary expression patterns of semaphorin 3E and plexin D1 in the mature neocortices of mice and monkeys. J. Comp. Neurol. 499, 258–273.
Whitley, J. M., and Henkel, C. K. (1984). Topographical organization of the inferior collicular projection and other connections of the ventral nucleus of the lateral lemniscus in the cat. J. Comp. Neurol. 229, 257–270.
Keywords: vesicular glutamate transporter, in situ hybridization, retrograde transport, auditory system
Citation: Ito T and Oliver DL (2010) Origins of glutamatergic terminals in the inferior colliculus identified by retrograde transport and expression of VGLUT1 and VGLUT2 genes. Front. Neuroanat. 4:135. doi: 10.3389/fnana.2010.00135
Received: 08 April 2010;
Paper pending published: 21 May 2010;
Accepted: 07 September 2010;
Published online: 28 September 2010
Edited by:
Miguel A. Merchán, Universidad de Salamanca, SpainCopyright: © 2010 Ito and Oliver. This is an open-access article subject to an exclusive license agreement between the authors and the Frontiers Research Foundation, which permits unrestricted use, distribution, and reproduction in any medium, provided the original authors and source are credited.
*Correspondence: Douglas L. Oliver, Department of Neuroscience, University of Connecticut Health Center, Farmington, CT 06030-3401, USA. e-mail:ZG9saXZlckBuZXVyb24udWNoYy5lZHU=