


- 1 Instituto de Neurociencias de Castilla y León, Salamanca, Spain
- 2 Instituto de Investigación en Discapacidades Neurológicas, Medical School, University of Castilla-La Mancha, Albacete, Spain
We tested whether lesions of the excitatory glutamatergic projection from the auditory cortex (AC) to the inferior colliculus (IC) induce plastic changes in neurons of this nucleus. Changes in neuronal activation in the IC deprived unilaterally of the cortico-collicular projection were assessed by quantitative c-Fos immunocytochemistry. Densitometry and stereology measures of sound-induced c-Fos immunoreactivity in the IC showed diminished labeling at 1, 15, 90, and 180 days after lesions to the AC suggesting protein down-regulation, at least up to 15 days post-lesion. Between 15 and 90 days after the lesion, c-Fos labeling recovers, approaching control values at 180 days. Thus, glutamatergic excitation from the cortex maintains sound-induced activity in neurons of the IC. Subdivisions of this nucleus receiving a higher density of cortical innervation such as the dorsal cortex showed greater changes in c-Fos immunoreactivity, suggesting that the anatomical strength of the projection correlates with effect strength. Therefore, after damage of the corticofugal projection, neurons of the IC down-regulate and further recover sound-induced c-Fos protein expression. This may be part of cellular mechanisms aimed at balancing or adapting neuronal responses to altered synaptic inputs.
Introduction
The inferior colliculus (IC) is a major center of acoustic integration in the midbrain. It receives convergent ascending projections from multiple auditory brainstem nuclei, as well as intrinsic and commissural connections along with descending projections from the auditory cortex (AC). This cortico-collicular projection is direct, excitatory and bilateral, although stronger toward the ipsilateral side (Feliciano and Potashner, 1995; Saldaña et al., 1996). Excitation seems to be mediated by glutamate (Helfert et al., 1991; Wenthold, 1991; Wenthold et al., 1993; Feliciano and Potashner, 1995). The specific role of this descending projection from the AC to the IC in auditory processing is still unknown, although it is clearly involved in modulating IC neuronal responses to sound. Electrophysiological studies suggest that the cortico-collicular projection has either positive or negative feedback effects in neuronal firing properties of IC neurons. After blocking auditory cortical activity with tetrodotoxin, a majority of IC neurons either increase or decrease firing rates (Nwabueze-Ogbo et al., 2002; Popelar et al., 2003). Overactivation of the AC following local infusion of the GABAA antagonist bicuculline increases neuronal activity in the IC (Sun et al., 2007, 2009).
Modulatory effects of the AC projection on IC neuronal responses may involve ongoing changes in the activity level of IC neurons. Sun et al. (2007, 2009) found that the transcription factor c-Fos, an immediate early expression gene that is a well-known marker of neuronal activity, is overexpressed in sound-stimulated IC neurons shortly after pharmacological activation of the AC. These authors found that neurons in IC subdivisions with a higher innervation density from the cortico-collicular projection have higher levels of c-Fos protein expression (Sun et al., 2007, 2009), thus suggesting a direct correlation between the anatomical strength of the cortico-collicular projection and modulatory effects on the activity of IC neurons. On the other hand, we reported (Clarkson et al., 2010a) that after unilateral lesions of the AC, auditory brainstem response (ABR) thresholds were elevated 15 days after the lesion, returning to near normal values at 90 days post-lesion. Startle reflex and prepulse inhibition tests also showed diminished responses 15 days after lesions of the AC, followed by recovery 90 and 180 days after the lesion (Clarkson et al., 2010a). These findings stress the fact that damage of the cortico-collicular projection results in altered processing in IC neurons, due to loss of cortical modulation. Interestingly, however, IC function seems to return to normal 90–180 days after AC ablation (Clarkson et al., 2010a). Thus, connections from the AC to the IC may be involved in reparative or adaptive mechanisms after auditory damage. In this regard, it would be relevant to assess spatial and temporal changes in sound-evoked activity of IC neurons, measured by changes in the expression of c-Fos, at different times after silencing the cortico-collicular projection.
Therefore, we tested whether descending excitatory deafferentation of the IC after cortical ablation induces changes in activity of IC neurons, measured by patterns of sound-induced c-Fos activity. We also addressed whether such changes revert back with time, suggesting compensatory and/or reparative events in the adult animal. Toward this goal, we analyzed across IC subdivisions the effects of short- and long-term unilateral lesions of the AC on sound-activated expression of the transcription regulator protein c-Fos.
Materials and Methods
Experimental Animals and Groups
Twenty-four male Wistar albino rats were used, with a weight of 230 g and 12 weeks of age (Table 1). Animals were provided by the Animal House facility of the University of Salamanca. The use and care of the animals as well as the surgical procedures were approved and supervised by institutional committees, following national (R.D. 1201/2005) and EU regulations (DOCE L 222; 24-08-1999) for the use and care of animals in research.
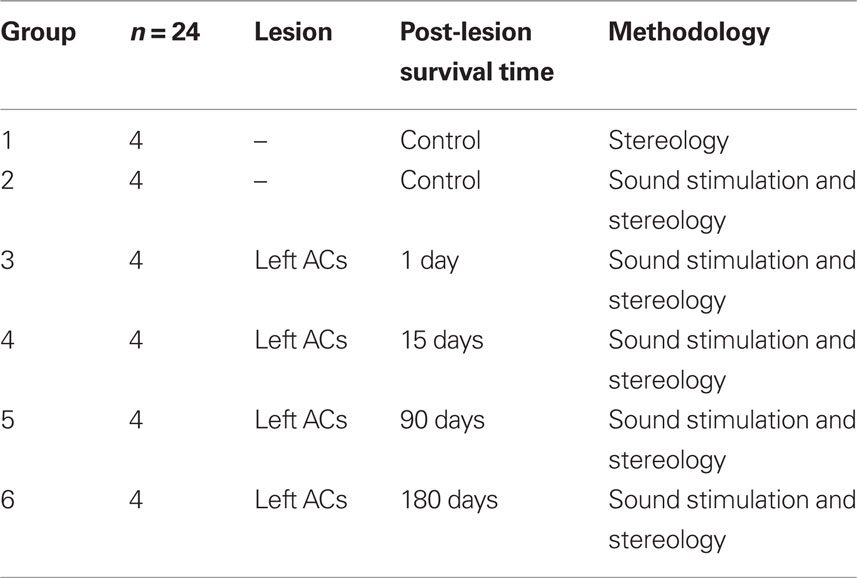
Table 1. Experimental groups.
Lesions of the Auditory Cortex
Animals (groups 3–6, n = 16, Table 1) were anesthetized with ketamine chlorhydrate (30 mg/kg, Imalgene® 1000, Rhone Méreuse, Lyon, France) and xylazine chlorhydrate (5 mg/kg Rompun®, Bayer, Leverkusen, Germany). Unilateral ablation by aspiration of the left auditory cortices (primary – Au1, dorsal – AuD, and ventral – AuV areas), including cortical layers V and VI, was carried out under stereotaxic control using a stereotaxic frame (#900, David Kopf Ins., Tujunga, CA, USA) following a procedure described in detail elsewhere (Clarkson et al., 2010a).
Sound Stimulation
Twenty animals distributed in five groups (2–6, Table 1) were acoustically stimulated to analyze c-Fos expression in the IC. Seventy-two hours before the stimulation protocol, animals including non-stimulated controls (group 1, n = 4, Table 1), were housed individually in an acoustically isolated area of the animal house. Animals at 1, 15, 90, and 180 days post-lesion and corresponding stimulated controls were anesthetized with 20% urethane (1.5 g/kg, i.p.) and placed in a purposely made acoustic stimulation chamber, built according to the specifications of Yoshida et al. (2000). Open field stimulus consisted of 5.0 kHz, 80 dB pure tones presented at 300 ms on/500 ms off cycles, with a rise time of 10 ms for a total duration of 60 min. Sound was amplified and delivered through four open field speakers (Mac Audio Electronic GmbH & Co. KG, Germany).
Sound exposure levels were measured inside the chamber, before and after each experiment, using a 1/2-inch condenser microphone (Brüel and Kjær 4191, Nærum, Denmark), placed in a position equivalent to that of the animal’s head. After stimulation delivery, animals were allowed to rest in a quiet environment for 100 min. After this, animals still under the effects of urethane anesthesia were perfusion-fixed following standard protocols described below.
Histological Methods
Two hundred fifty microliters of Ringer buffer (pH 6.9, 36°C) with 0.01% heparin were perfused transcardially, followed by 1000 ml of fixative, consisting of 4% p-formaldehyde and 0.025% glutaraldehyde, at room temperature. After fixation, the brains were dissected out, sectioned and postfixed by immersion in the same fixative solution for 2 h before being cryoprotected by immersion in 30% sucrose in 0.1 M phosphate buffer (PB), pH 7.4 at 4°C for 48 h. The brains were then serially sectioned in the coronal plane at 40 μ using a sliding freezing microtome.
c-Fos immunocytochemistry
Alternate serial sections of the brain including the IC were labeled for c-Fos with immunocytochemistry. Sections floating in a beaker were sequentially washed with 0.05 M Tris buffered saline (TBS), pH 7.6, followed by inhibition of endogenous peroxidase by incubating with 10% methanol + H2O2 3% in 0.1 M PB for 10 min. Sections were then washed with TBS–Triton X100 0.3% (0.05 M, pH 7.6, 3 × 15 min on a shaker) and non-specific labeling was blocked using 10% fetal calf serum. Sections were incubated with a polyclonal anti c-Fos Ab-5 antibody made in rabbit (Oncogene Research Products; catalog No. PC38, San Diego, CA, USA). It was raised against a synthetic peptide (SGFNADYEASSSRC) corresponding to amino acid residues 4–17 of human c-Fos [1:7,500]. Sections were incubated in a secondary antibody, a biotinylated anti-rabbit IgG (H + L) (BA-1000, Vector Laboratories, Burlingame, CA, USA), at a dilution of 1:200 in TBS 0.05 M + Triton X100 0.3% for 120 min at room temperature. After this, sections were washed again with TBS–Triton X100 and incubated in avidin–biotinylated peroxidase complex in TBS–Triton X100 for 90 min. The peroxidase reaction was revealed with 3,3′-diamino-benzidine (DAB) and nickel-ammonium sulfate (0.16%) + H2O2 (0.006%) for 5 min in all sections. Immunostained sections were mounted on slides, dried, dehydrated, cover slipped, and sealed. To test the specificity of the detection system, incubation with primary antibodies was omitted. No specific staining was observed.
Stereology Counts, Densitometry, and Morphometry of c-Fos Immunoreactive Nuclei
Nuclei immunoreactive for c-Fos (c-Fos Ir) were counted as particles in each of the three divisions of the IC, dorsal cortex (DCIC), lateral cortex (LCIC), and central nucleus (CNIC). To determine particle counting parameters, Preliminary Population Estimates, and Optical Fractionator tests (West et al., 1991) were applied by using Stereo Investigator 8.0 software (Micro Bright Field, Inc, VT, USA).
c-Fos Ir neuronal nuclei, displaying a clear-cut border was counted as positive particles. They were clearly differentiated from glial cells based on size. Limited section depth and adequate immunoreactions’ intensity allowed clear distinction of c-Fos Ir nuclei. A minimum of 250 c-Fos Ir nuclei was counted for each study case, including unlesioned controls, either stimulated or non-stimulated, or lesioned, stimulated animals. Counts were made in each IC division bilaterally, obtaining final values by the Estimated Total by Optical Fractionator. Gundersen’s error coefficient m = 1 (Gundersen et al., 1999) was calculated, with values ranging from 0.4 to 0.6.
For image analysis four selected sections were picked from equivalent interaural levels in the rostro-caudal axis. Images were captured with a digital camera, using a 20 × dry objective (Leica-PlanFluotar/0.80). Mosaic fields of the entire IC were assembled with the individual images (Neurolucida Vs 8.0, MicroBrightField, Inc, Williston, VT, USA). Image analysis was carried out with Scion ImageJ 1.42q software (National Institutes of Health – NIH), adjusting the microscope illumination source before each image capture to obtain similar light intensities in all cases.
After selecting one section per case at the same rostro-caudal level (interaural level: 0.12 mm, Paxinos and Watson, 2005) two trained observers separately marked the contours and segmented a minimum of 300 particles from each section. Particles were analyzed to obtain average gray levels and standard deviation (SD), using Scion ImageJ. Average values were analyzed statistically. Based on this data, a threshold of the average gray level ± SD, equivalent to levels 0–88 of the gray scale, was set as segmentation range for densitometry and morphometry measurements. Using this threshold, image mosaics from experimental cases were segmented and sections analyzed at four equivalent interaural levels of the rostro-caudal axis.
For each particle segmented between 0 and 88, gray level average values and SD, nuclear perimeter, and coordinate values of two-dimensional placement in the image were obtained. Positional values were fed into MATLAB (The MathWorks, Inc, Natick, MA, USA) along with gray value average and SD of segmented immunoreactive nuclei to build topographic densitometry maps of the IC.
Results
Lesion Localization in the AC
All ablations specifically encroached the major subdivisions of the AC: primary, dorsal and ventral cortices. Lesion depth reached layers Vc and VI, leaving the white matter unaffected. Lesions affected between 65.47 and 84.89% of the cortices.
c-Fos Immunocytochemistry
The c-Fos antibody, sharply labeled structures identifiable on the basis of size and shape as neuronal nuclei. Non-stimulated control animals showed moderately labeled nuclei (see c-Fos Densitometry and Morphometry), which were more concentrated in the dorsal two-thirds of the IC (Figure 1A). Control animals stimulated for 60 min with the 5.0 kHz, 80 dB test tone (group 2, n = 4, Table 1) showed much more abundant c-Fos Ir nuclei, with a higher concentration in the dorsalmost regions of the three IC subdivisions (Figure 1B). The highest density of c-Fos Ir nuclei was seen in layer 1 of the DCIC and in the dorsal portions of the CNIC.
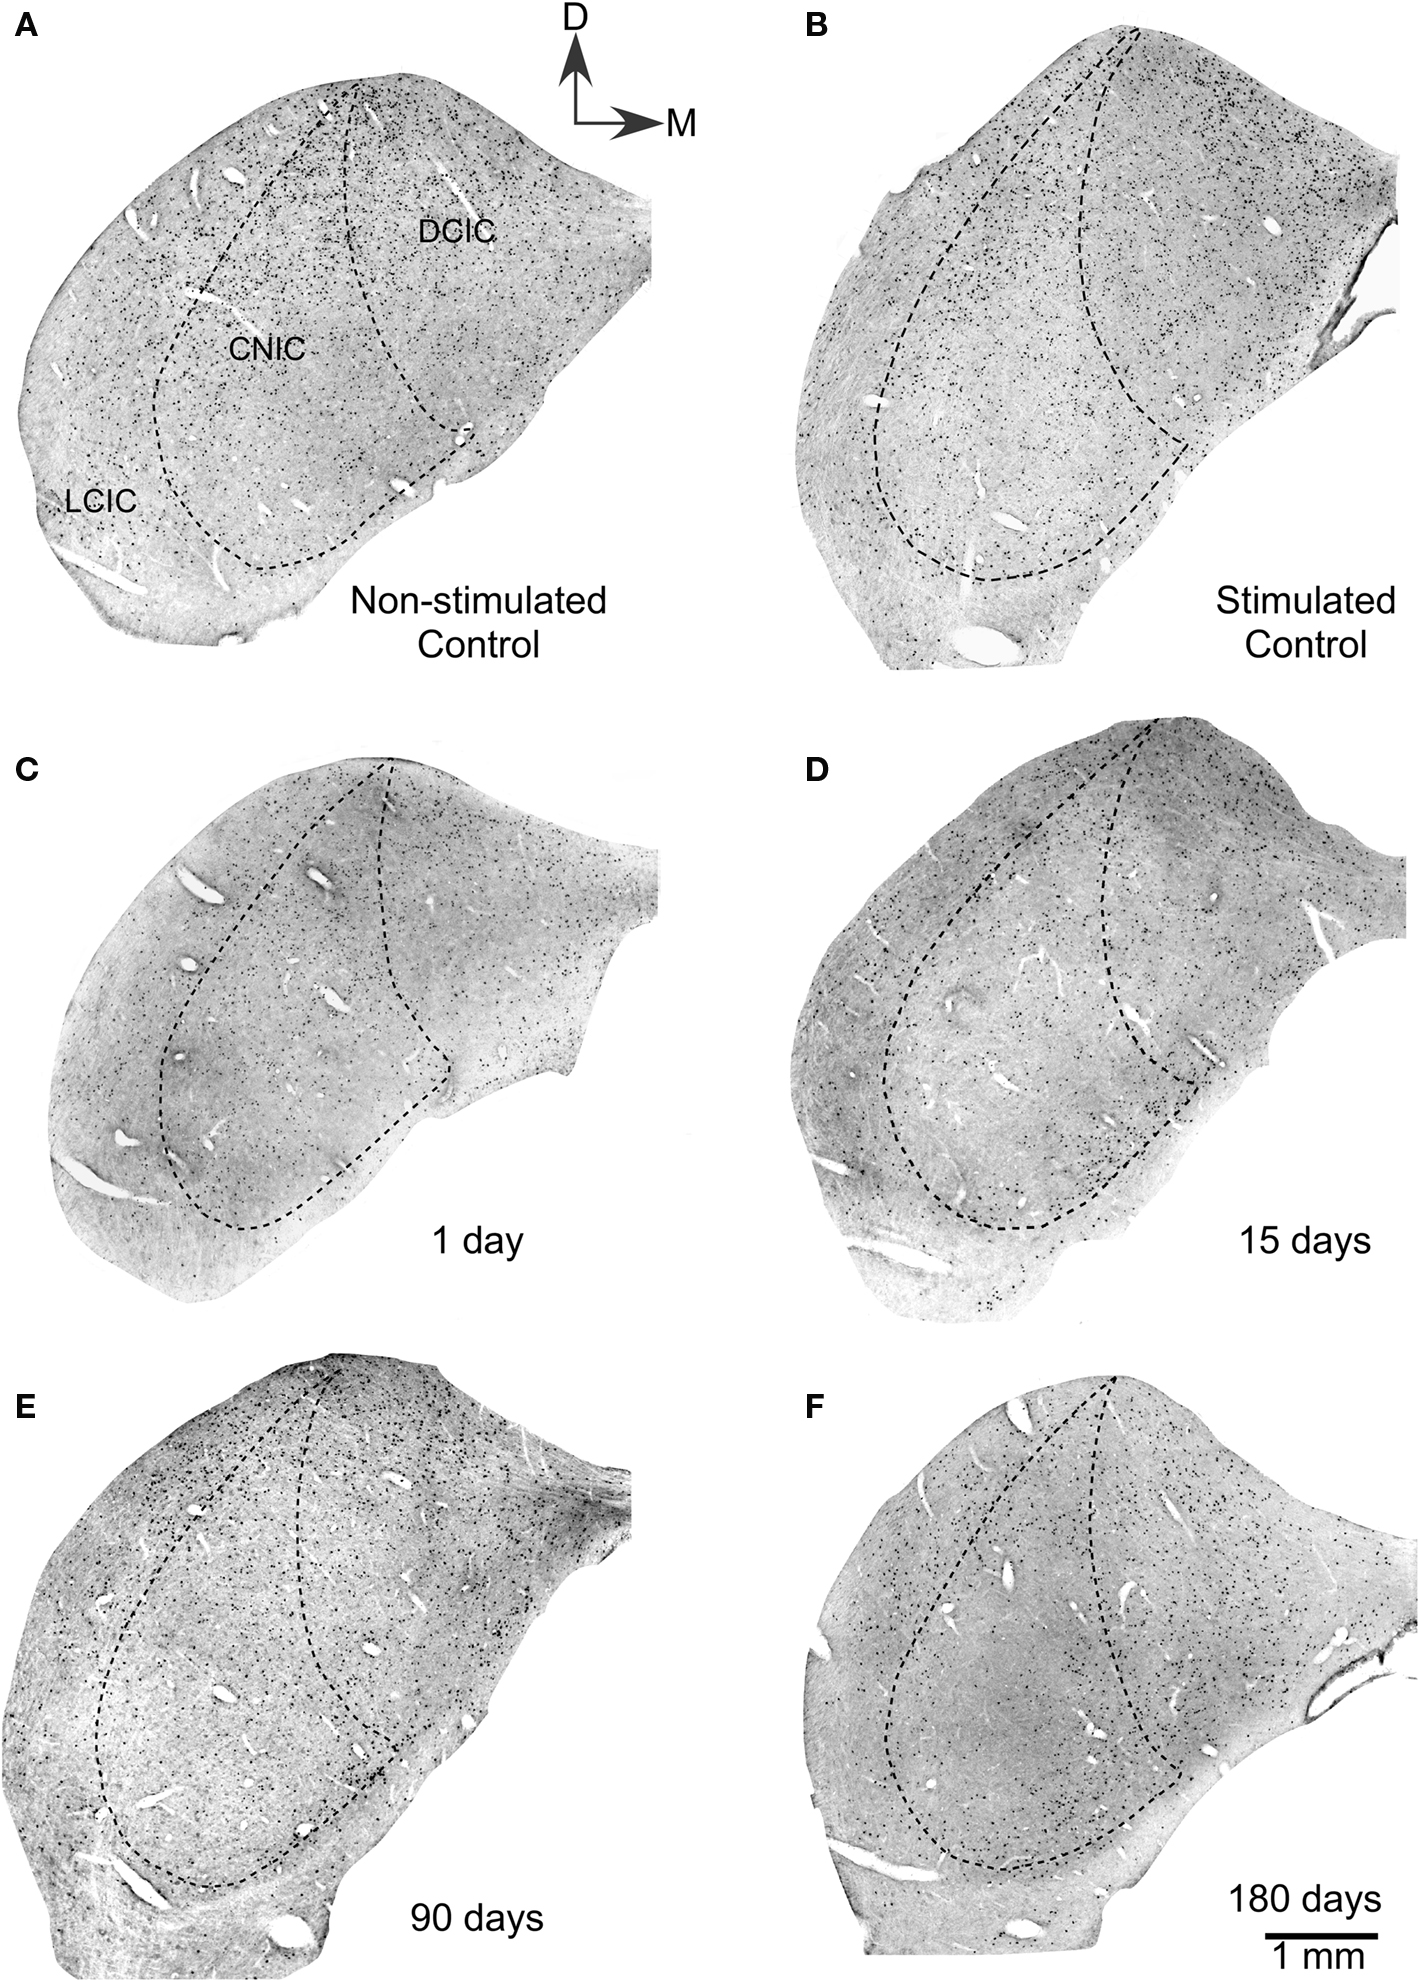
Figure 1. Low power magnification photomicrograph showing sections of the ipsilateral inferior colliculus immunostained for c-Fos after lesions of the auditory cortex. (A) Non-stimulated control groups showed neuronal nuclei c-Fos Ir in all subdivisions of the IC. Also, in stimulated controls (B), a large number of c-Fos immunoreactive nuclei are seen in all three subdivisions of control inferior colliculi after sound stimulation. (C) One day after the cortical lesion, sound stimulation induces lower numbers of c-Fos immunoreactive neuronal nuclei. (D) Fifteen days after cortical ablation, sound-evoked c-Fos immunoreactivity is even lower than at 1 day after the lesion. (E) Ninety days after the cortical lesion, sound stimulation induces c-Fos immunoreactivity in neuronal nuclei, with numbers higher than at 15 days, but still lower than in stimulated controls. (F) Hundred eighty days after the cortical ablation, sound-evoked c-Fos immunoreactivity is close to control values.
One day after the cortical lesion, identically stimulated animals (group 3, n = 4, Table 1) showed a moderate decrease in the density of c-Fos Ir neuronal nuclei in all subdivisions, although mainly in the middle zone of the DCIC (Figure 1C), when compared with stimulated controls. In animals 15 days after the lesion (group 4, n = 4, Table 1), acoustic stimulation induced very low densities of c-Fos Ir, in the DCIC and in the CNIC (Figure 1D), although accumulations of c-Fos Ir neuronal nuclei were seen in its ventral portions. After 90 or 180 days of cortical lesion, sound-stimulated animals (groups 5 and 6, n = 4, Table 1) did not show visible differences with controls in the density or distribution of c-Fos Ir neuronal nuclei (Figures 1E,F).
c-Fos densitometry and morphometry
Comparisons of average gray levels of c-Fos Ir neuronal nuclei (range: 0–88, 0 corresponding to the darkest particles and 88 to the lightest particles, see Materials and Methods) showed that c-Fos immunoreactivity was, on average, 31.75% more intense in stimulated than in non-stimulated controls (Figure 2). Comparison of stimulated controls and experimental groups 1 day and 15 days after the cortical lesion, showed a shift in gray level values of 25.43 and 23.76%, respectively toward the upper (white) end of the gray level range, whereas there were no significant differences at 90 days post-lesion. After 180 days post-lesion the gray average levels were higher than those in the control group (Figure 2). Comparisons between stimulated controls, and lesioned animals in the sides ipsi- and contralateral to the lesion, showed significant differences only in the 15 days post-lesion group (data not shown).
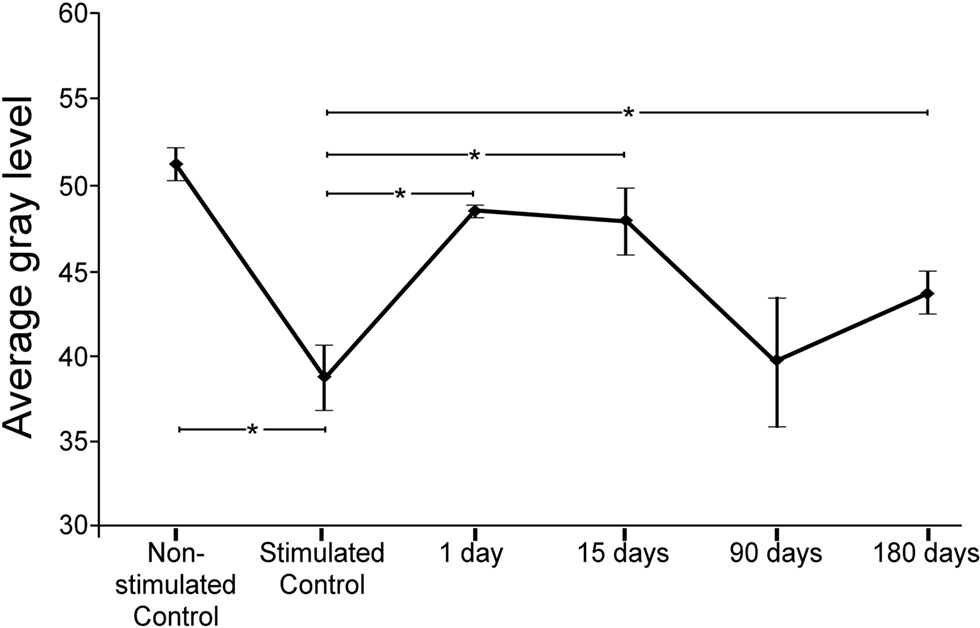
Figure 2. Average gray levels of sound-induced c-Fos immunoreactivity in nuclei of the inferior colliculus at different times after a unilateral cortical lesion. In control non-stimulated groups, means were higher (i.e., shifted toward lighter gray levels) than in the stimulated control. Comparisons between stimulated controls and lesioned stimulated groups shows that the average levels shift toward values closer to the white side of the gray range at 1 and 15 days after the lesion. Ninety and 180 days after the lesion, gray values return to levels comparable to controls. The asterisks show the significant differences (average ± 2SD) between both, the non-stimulated control and the group of stimulated control, and the stimulated control group and lesioned groups.
In the non-stimulated control cases, density plots of c-Fos Ir gray values showed less c-Fos Ir neuronal nuclei than in stimulated controls with a random distribution of dark and light particles in the three subdivisions of the IC (Figures 3A,B), although higher densities were found in medial and lateral regions (Figure 3A). The stimulated controls showed abundant c-Fos Ir nuclei in the darker range of the gray spectrum in the three subdivisions of the IC, mainly in the cortices (Figure 3B). In animals stimulated 1 day after the AC lesion there was a slight decrease in c-Fos Ir particle number and density in all IC subdivisions (Figure 3C). Also, we show in figure 3D-3F, the distribution of all the nuclei c-Fos positives between 0-88 (gray values) in the control groups (non-stimulated and stimulated) and animals after one day post-lesion. After 15 days we observed overall diminished numbers and densities of c-Fos Ir neuronal nuclei, although a band of particles with the highest labeling density was detectable in ventro-medial portions of the CNIC (Figure 4A). Ninety days after the lesion, sound-stimulated animals showed a distribution of c-Fos Ir particles similar to controls, along with increased neuronal nuclei density (Figure 4B). In animals stimulated 180 days after the lesion, the distribution of c-Fos Ir neuronal nuclei in the IC was similar to the 90 day post-lesion and control groups, with just a slight decrease in the density of immunoreactive particles (Figure 4C). Also, we analyze in the figure 4D-F the distribution of c-Fos immunoreactive nuclei in the range between 0-88 (gray levels) to find differences among lesioned groups at different times of survival post-lesion, and we found in the histograms a recovery of the gray values arrangement, in animals stimulated after long-term post-lesion.
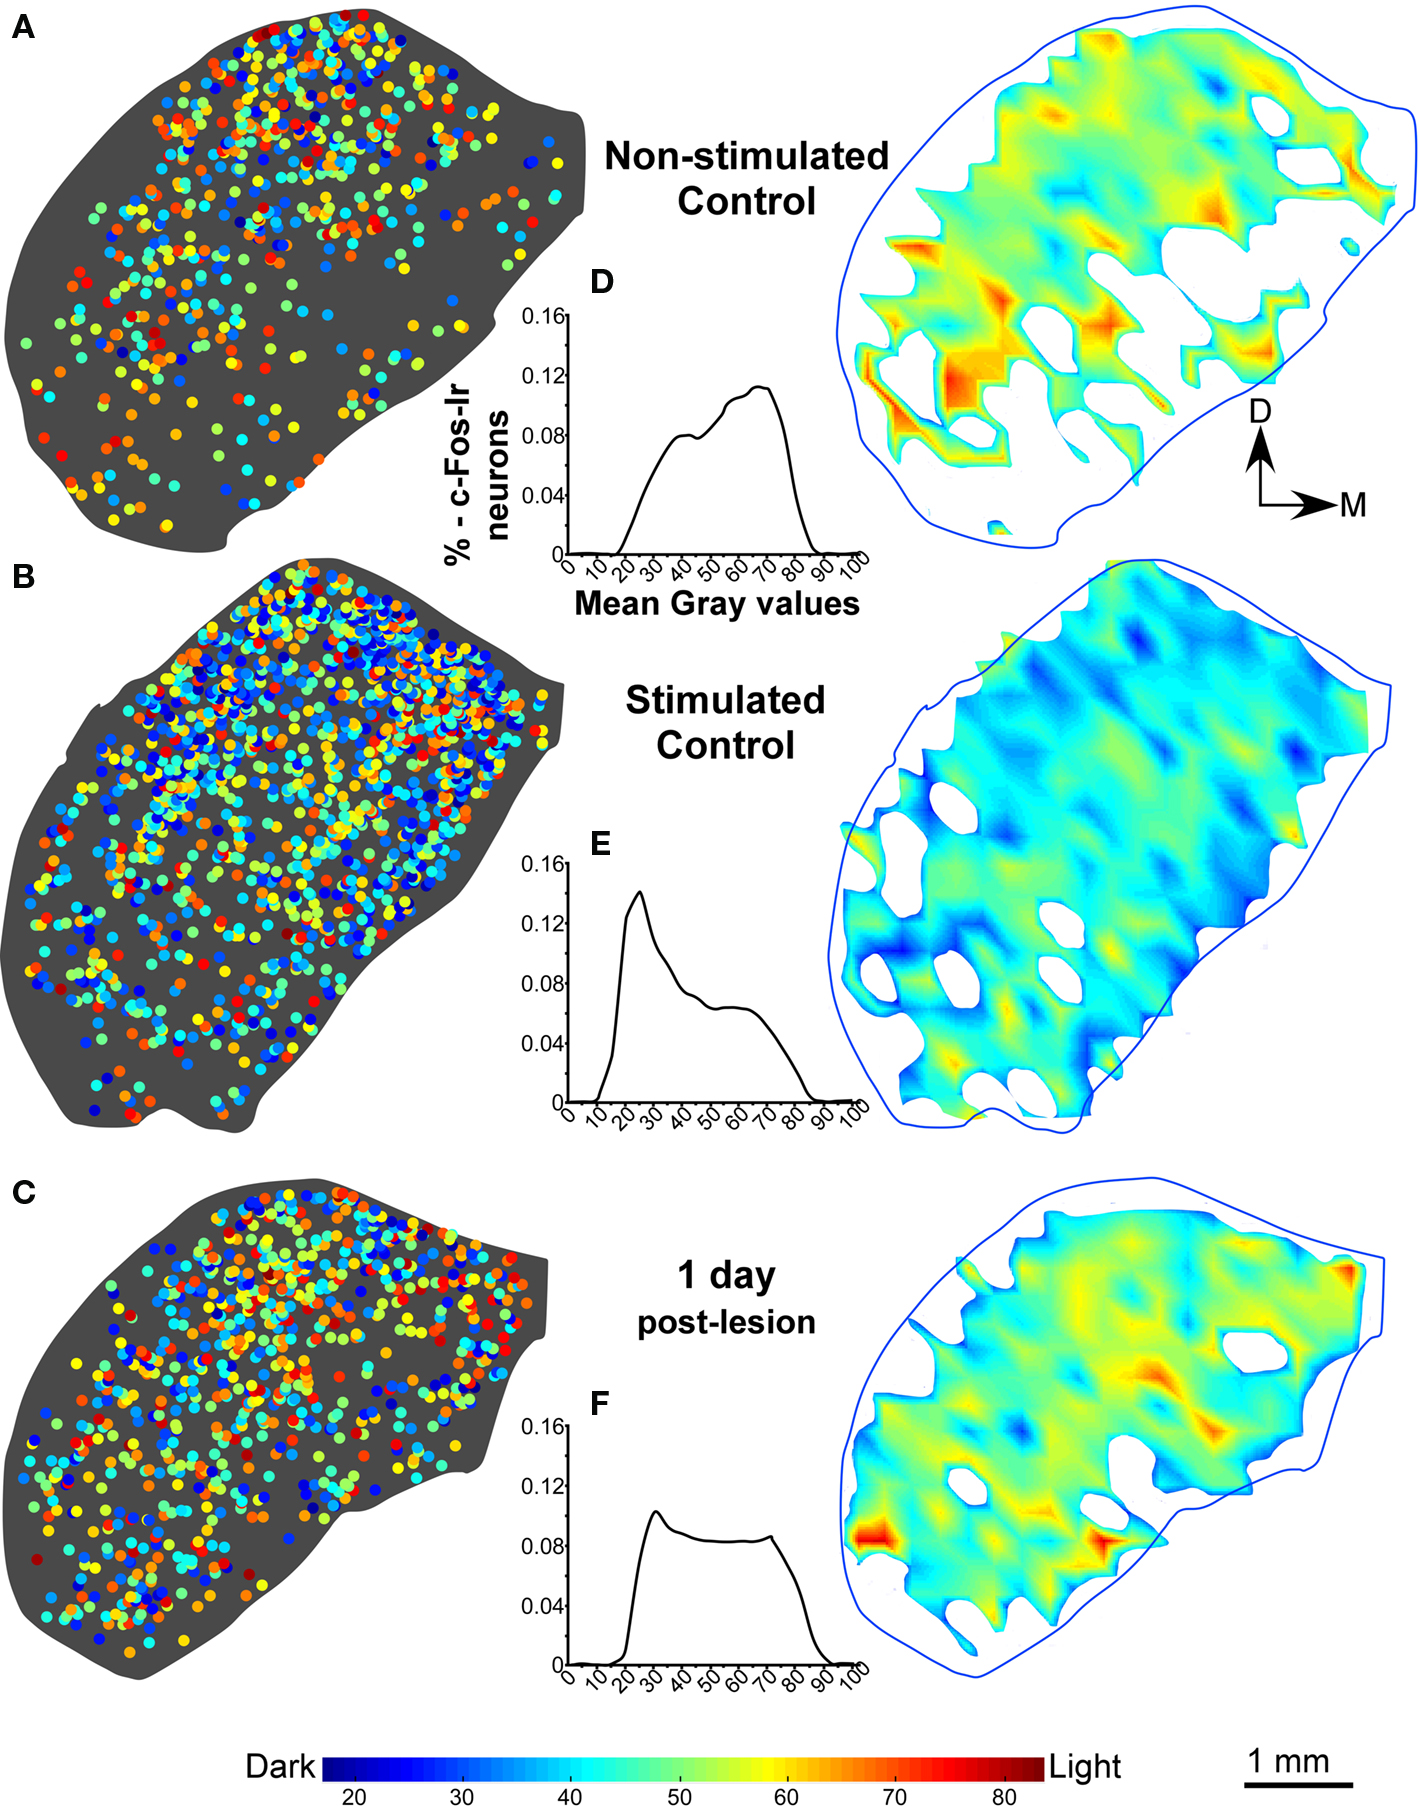
Figure 3. (A,B) Distribution density, gray value plots, and histograms of c-Fos immunoreactive neuronal nuclei, in representative sections of the inferior colliculus in non-stimulated control groups and control groups after sound stimulation. In stimulated control animals, the sound stimulation protocol utilized (see text), induces a higher density of c-Fos labeling, than in non-stimulated controls (A,B), in particular in the dorsal two-thirds of the nucleus including the dorsal cortex (DCIC). (C) c-Fos labeling density diminishes after stimulation at 1 day post-lesion. As shown in the interval histograms in (D,E), gray intensity values of individual c-Fos immunoreactive nuclei shift toward more intense (higher numerical) values between non-stimulated and stimulated controls. After 1 day post-lesion, values are lower than in stimulated controls and the histogram curve (F) is more flat than in stimulated control group.
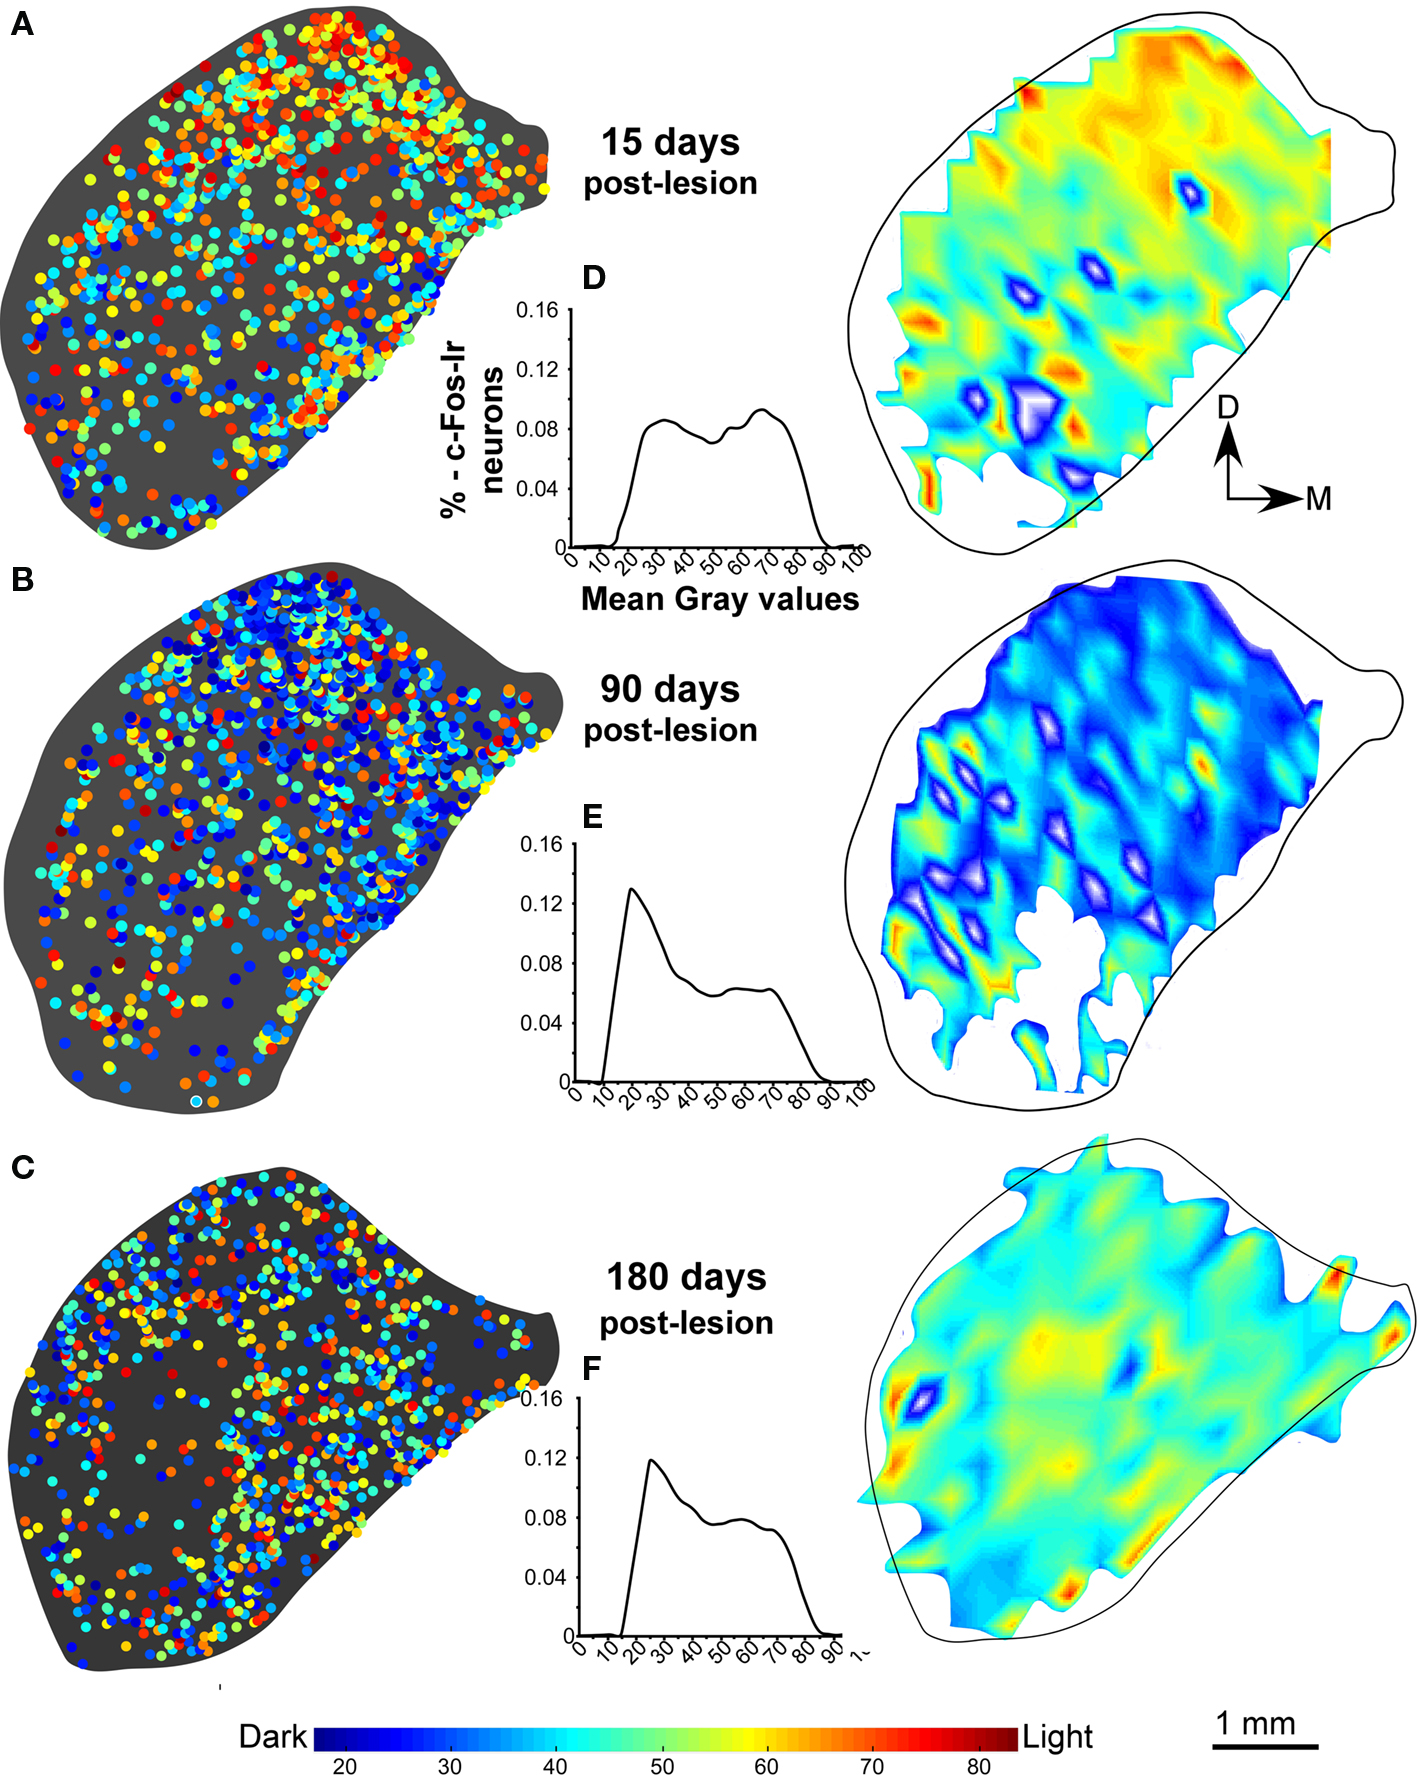
Figure 4. Distribution density and gray value plots of c-Fos immunoreactive nuclei in representative sections of the inferior colliculus after sound stimulation. (A) After 15 days post-lesion, values continue to be lower than the in the stimulated control group (B,C) c-Fos labeling densities are comparable to those in controls after sound stimulation 90 days (B) and 180 days (C) post-lesion. The interval histograms in (D) shows two slight peaks in values more close to 88, whereas the histograms in (E,F), show that gray intensity values of individual c-Fos immunoreactive nuclei at 90 and 180 days after the cortical lesion are comparable to controls, suggesting recovery of neuronal activity.
Perimeter of c-Fos Ir neuronal nuclei in the IC was, on average, 9.08% significantly larger in stimulated controls than in non-stimulated controls (Figure 5). Animals lesioned for 90 days showed a statistically significant increase of 9.18% in the average perimeter ± SD of c-Fos immunoreactive neuronal nuclei (Figure 5), relative to stimulated controls. Comparisons in all animals between c-Fos Ir nuclei perimeter in the sides ipsi- and contralateral to the lesion showed that the perimeter only was significantly increased in the contralateral IC from animals stimulated with sound 90 days after the AC lesion (data not shown).
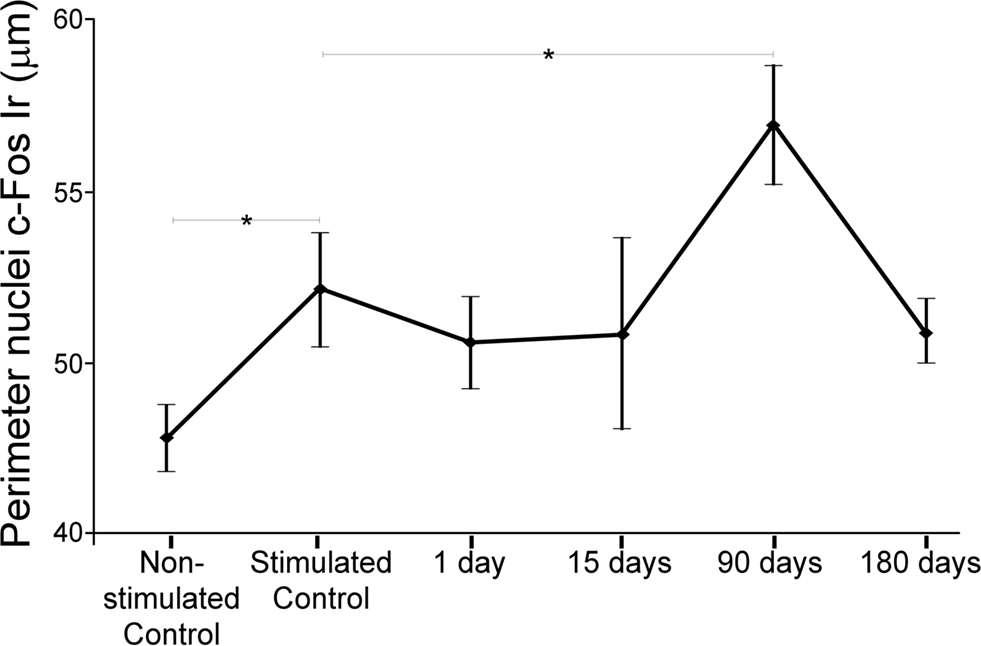
Figure 5. Charts showing average perimeter of c-Fos immunoreactive neuronal nuclei. Perimeter increases significantly (*mean ± 2SD) between non-stimulated and stimulated controls, also after 90 days post-lesion (see text for details).
c-Fos stereology counts
Stereology counts of c-Fos Ir neuronal nuclei in animals from the control non-stimulated cases (group 1, n = 4, Table 1) showed a total average number of 133985 ± 5330 immunoreactive particles in both ICs. In stimulated controls (group 2, n = 4, Table 1) the average number of c-Fos Ir nuclei was 155326 ± 5324, an increase of 15.92% (Figure 6A) relative to non-stimulated controls. Comparisons between stimulated controls and animals exposed to sound at different times after lesions of the AC, showed an overall decrease in average numbers of c-Fos Ir neuronal nuclei (Figure 6A). Thus, after 1 day post-lesion there was an average of 88809 ± 3670 labeled nuclei in the IC. In animals stimulated 15 days after the lesion, the average was 61810 ± 10045, the largest decrease detected. In animals surviving 90 days after the lesion, there was an average of 99978 ± 6159 c-Fos Ir neuronal nuclei after sound stimulation. At 180 days after the lesion, the average number was larger, with 115262 ± 8359 neuronal nuclei. Therefore, 1 day after the lesion of the AC, there is a 42% decrease in c-Fos Ir neuronal nuclei in the IC after sound stimulation relative to identically stimulated controls. After 15 days post-lesion, the decrease reaches 55%. Ninety days after the lesion, the decrease is 33% and it goes down to 23% 180 days after the lesion (Figure 6A). Average decreases in c-Fos immunoreactive neuronal nuclei between the sides ipsi- and contralateral to the lesion, were found to be significantly different in the IC only in animals stimulated 1 day after ablation of the AC (mean ± SD), with a larger decrease in the ipsilateral side (Figure 6B).
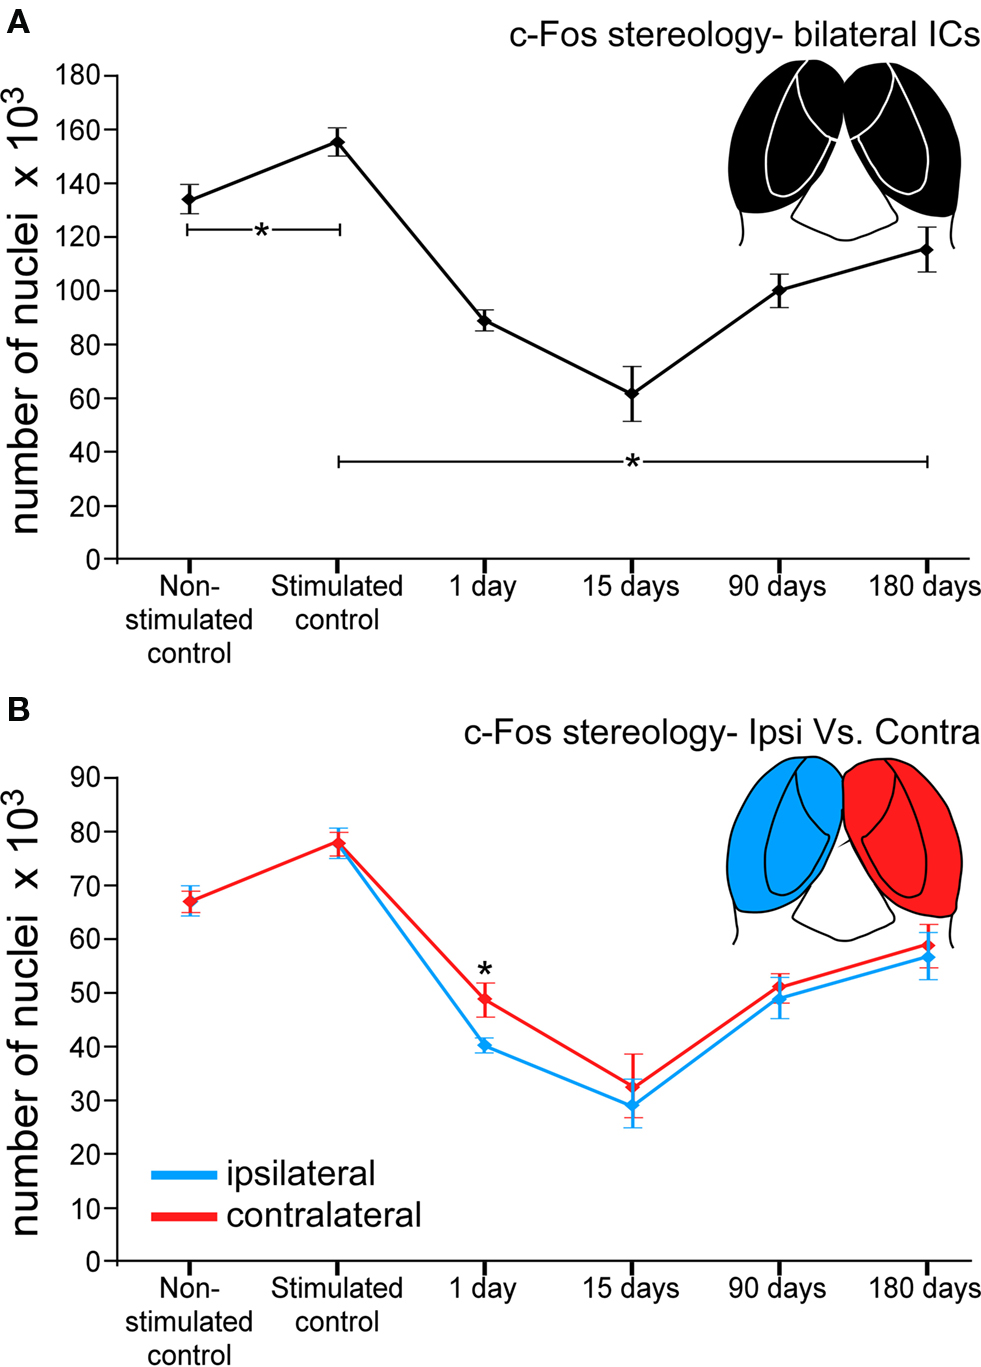
Figure 6. Graphs showing number of c-Fos immunoreactive neuronal nuclei in the IC after sound stimulation at different times after lesions of the auditory cortex. (A) The number of c-Fos immunoreactive neuronal nuclei significantly drops at 1 day (42%) and 15 days (55%) after the cortical lesion. Ninety and 180 days post-lesion, the number of immunoreactive neurons following sound stimulation recovers, but still remains below control values (33% at 90 days and 23% at 180 days). *Asterisks denote the significant differences between the control groups and the stimulated control and each lesioned group, and means the average value ± 2SD (error bars). (B) The number of c-Fos immunoreactive neurons differs between the sides ipsi- and contralateral to the cortical lesion. At 1 day after the lesion, the number of c-Fos immunoreactive neurons is significantly lower in the ipsilateral side. At 15, 90, and 180 days the number of immunoreactive neurons is comparable, although slightly lower in the ipsilateral side.
In addition, each of the three major IC subdivisions was analyzed separately in acoustically stimulated animals, pooling quantitative results from both ICs (Figure 7). The largest variation in c-Fos Ir neuronal nuclei was seen in the DCIC. One day after the lesion, the number of c-Fos Ir neuronal nuclei was 54% lower than in stimulated controls, whereas at 15 days post-lesion it had dropped to 68%, the lowest value recorded. After 90 days of the AC lesion, the average number of c-Fos Ir neuronal nuclei after sound stimulation in the IC was 42.25% lower than in controls. After 180 days of the lesion of the AC, the average number of c-Fos Ir neurons after sound stimulation was still 30% lower relative to values in control ICs (Figure 7A). Comparisons between the DCIC from the sides ipsi- and contralateral to the lesion, showed significant differences only in the 1 day post-lesion group, with a larger decrease in the side ipsilateral to the cortical lesion (Figure 7B).
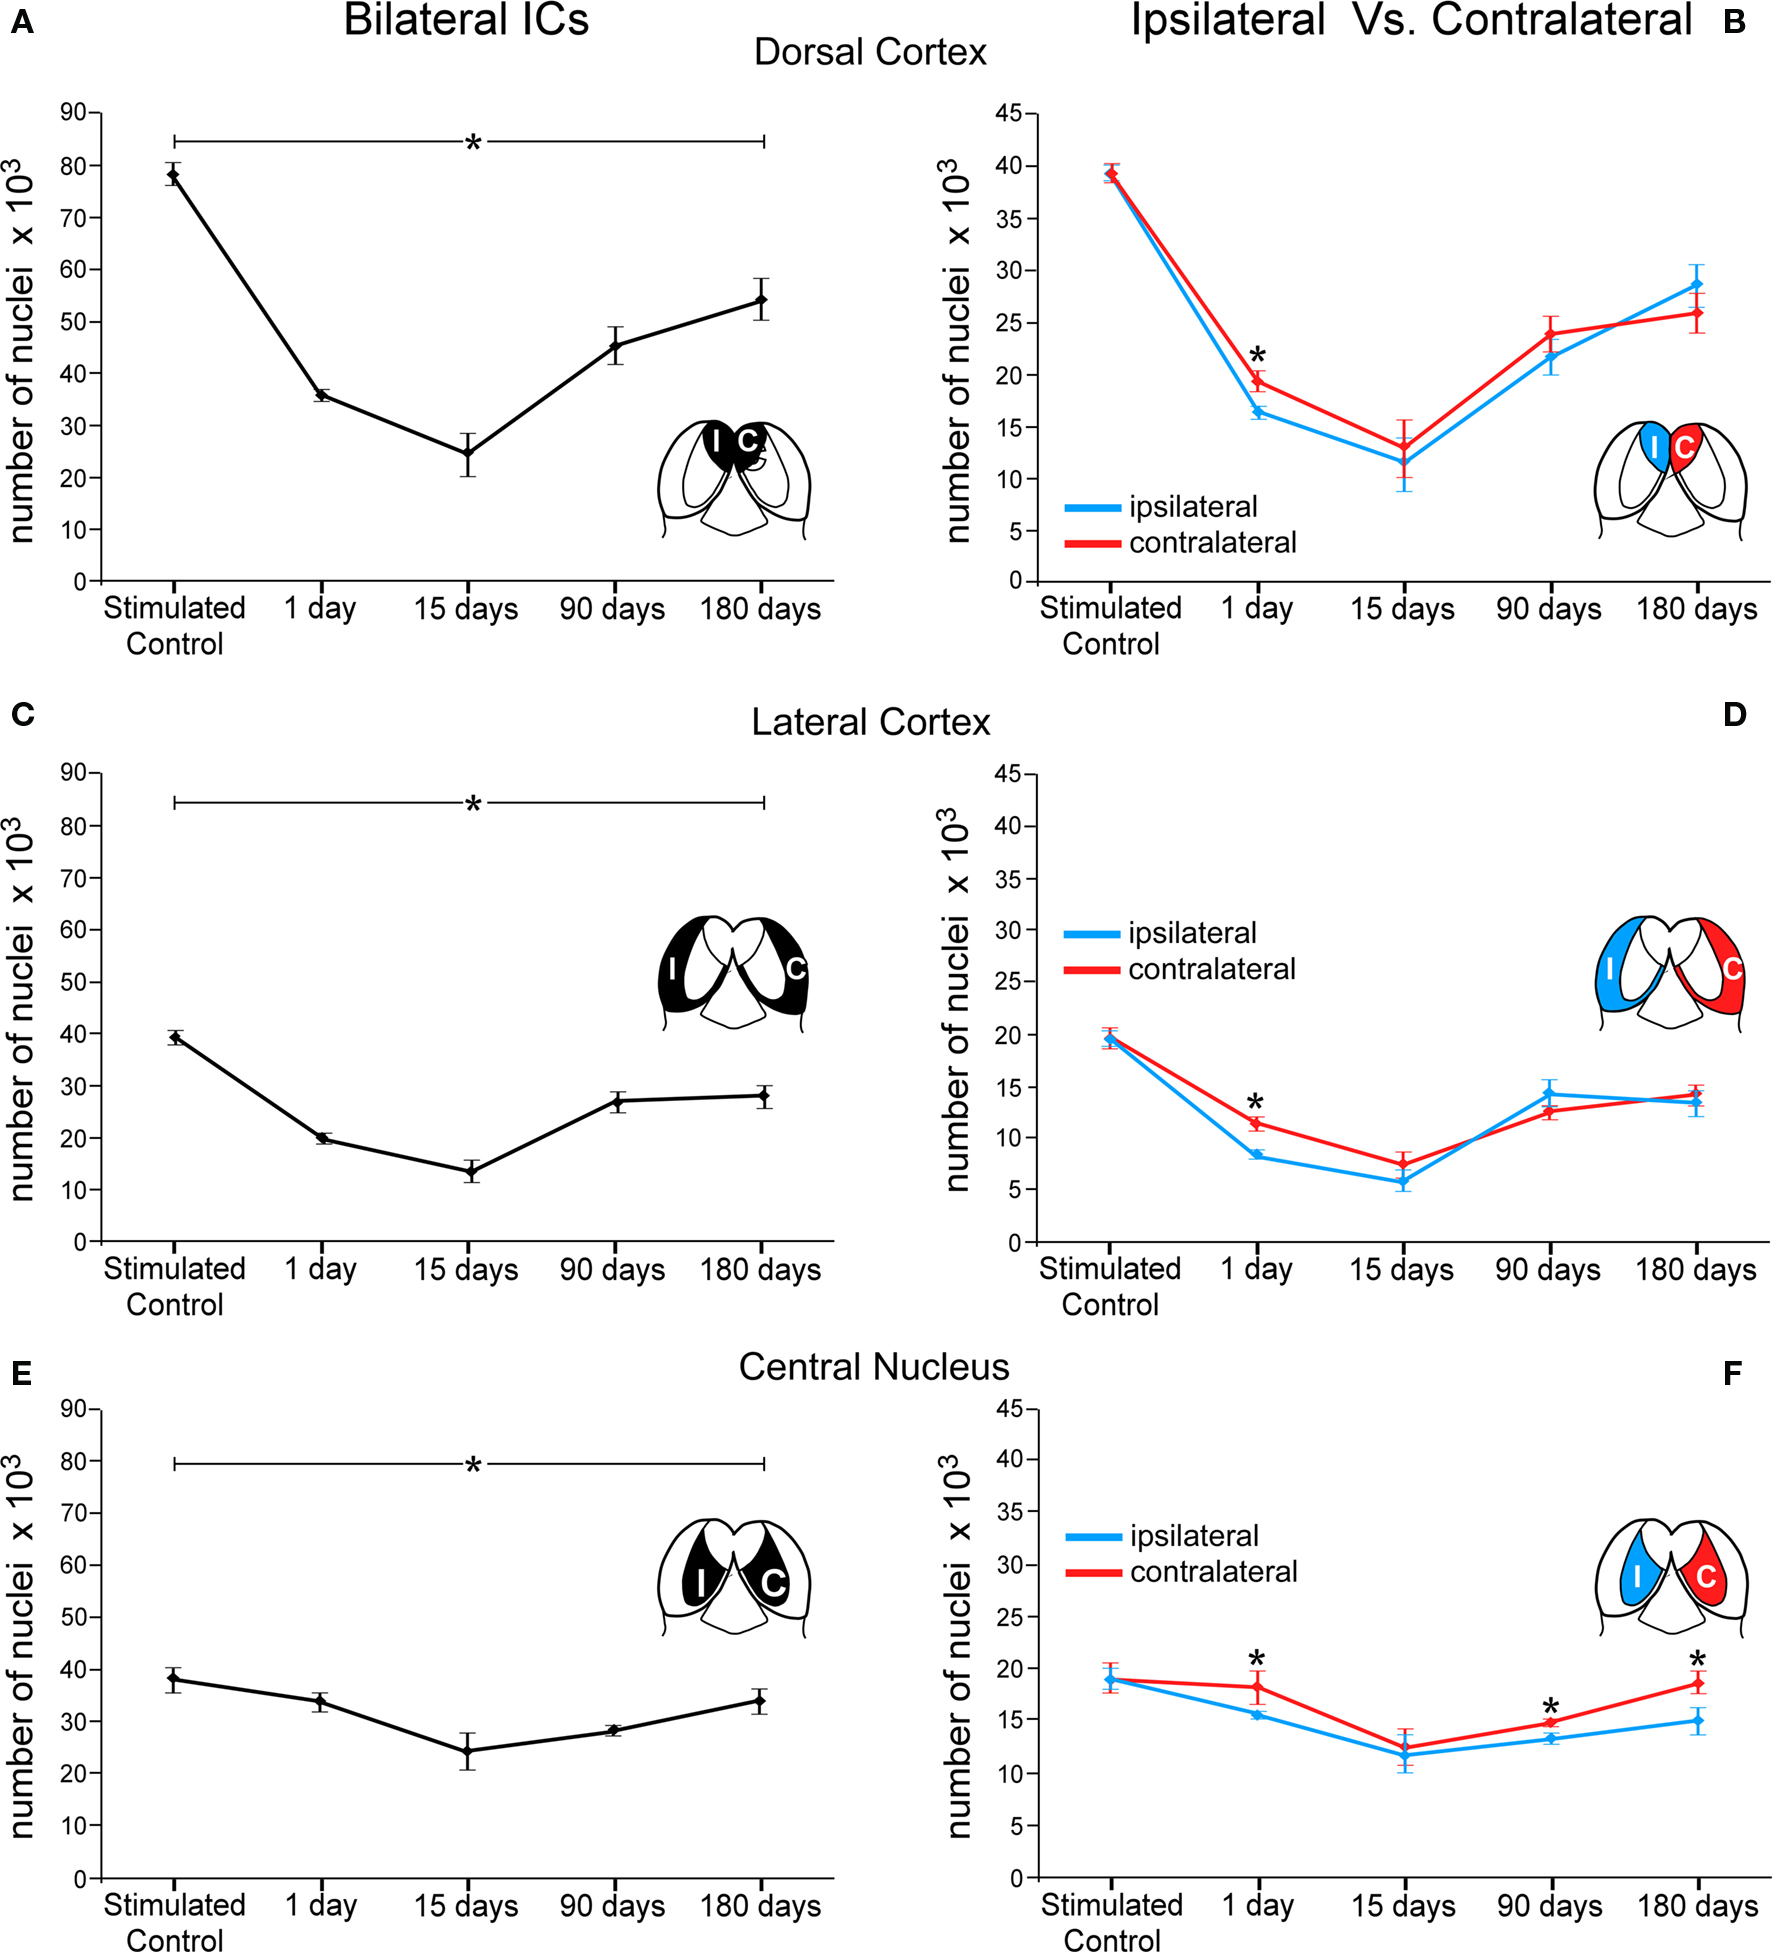
Figure 7. Graphs showing number of c-Fos immunoreactive neuronal nuclei by cytoarchitectural subdivisions of the IC after sound stimulation at different times after lesions of the auditory cortex. The asterisks denote changes (average ± 2SD, with a p < 0.005) in numbers of immunoreactive nuclei at different times after the cortical lesion. These changes are larger in the dorsal cortex (A) and lateral cortex (C) and less so in the central nucleus (E) although following similar temporal patterns (compare with Figure 6). In (B,D,F) the asterisks show significant differences in c-Fos immunoreactive nuclei between the sides ipsi- and contralateral to the lesion. In animals stimulated 1 day after the cortical lesion, the number of c-Fos immunoreactive nuclei is significantly lower in the ipsilateral side in the three IC subdivisions (*DC: 15%, EC: 27%, and CN: 14%). In the central nucleus (F), the contralateral side shows significantly higher numbers of immunoreactive nuclei after 90 and 180 days of the cortical lesion (*10% and 20%, respectively).
In the LCIC, there were also significant percent variations in the number of c-Fos Ir neuronal nuclei after sound stimulation between the ICs (bilateral) of lesioned and stimulated control animals, with a 49% decrease 1 day after the lesion, 65% 15 days after the lesion, 31.7% at 90 days and 29% after 180 days post-lesion (Figure 7C). Comparisons between the LCIC from the sides ipsi- and contralateral to the lesion, showed, similar to the DCIC, significant differences only in the 1 day post-lesion group, with a higher decrease in the side ipsilateral to the lesion region (Figure 7D).
Changes in sound-stimulated c-Fos Ir neurons in the CNIC after cortical lesions were notably less dramatic than in the other two subdivisions, with values 10% lower than in stimulated controls in the case of the 1 day post-lesion group. Fifteen days after the lesion of the AC, the number of c-Fos Ir nuclei was 36% lower that in controls and 90 days after the lesion it was 25.91% lower. After 180 days of the AC lesion, the drop in the number of c-Fos Ir neuronal nuclei returned to values near 11% (Figure 7E). When the sides ipsi- and contralateral to the AC lesion were compared, significant differences were seen at 1 day, 90 and 180 days after the lesion, with the ipsilateral side showing a comparatively largest decrease in the average number of c-Fos Ir neuronal nuclei after sound stimulation (Figure 7F). However, no significant differences were found between both sides in the 15 days post-lesion group.
Discussion
We show that unilateral lesions in the AC induce short- and long-term changes in the IC affecting c-Fos protein production. One day after unilateral ablation of the ACs, c-Fos expression in IC neurons induced by acoustic stimulation, is diminished. Fifteen days after the cortical lesion, c-Fos expression subsequent to acoustic stimulation is further diminished. Ninety days after the lesion we find recovery of c-Fos activity relative to stimulated controls. After 180 days of lesion-induced changes, all c-Fos values tested histologically, i.e., neuron number, average gray values and nuclear perimeter had returned to values comparable to those of the stimulated control group. Also, stereology counts of the number of c-Fos immunoreactive neuronal nuclei in the three major subdivisions of the IC showed that the most significant changes in c-Fos expression affected both IC cortical divisions, DCIC and LCIC. The number of c-Fos immunoreactive collicular neurons was comparable in both sides at all survival times, with the exception of the 1 day survival group, in which the side ipsilateral to the lesion showed fewer immunoreactive neurons than the contralateral side.
The induction of the expression of protein products of immediate early genes (IEG), notably c-Fos (Greenberg and Ziff, 1984; Ceccatelli et al., 1989; Bullitt, 1990), is a widely used tool for the anatomical identification and mapping of cells and neuronal circuits activated in response to different stimuli. c-fos is an IEG that does not require “de novo” protein synthesis (Herrera and Robertson, 1996) and therefore can be quickly activated as part of primary nuclear responses to intracellular signaling cascades (Soloaga et al., 2003). In the auditory pathway c-Fos is highly expressed after acoustic stimulation (Friauf 1992, 1995; Zhang et al., 1996). Also, c-Fos expression patterns have been used to study central auditory activity after lesions to the auditory receptor or ascending auditory pathways followed by electrical stimulation (Saito et al., 1999; Nagase et al., 2000, 2003; Nakamura et al., 2003, 2005; Reisch et al., 2007). Here we have used c-Fos expression to test how the lack of descending activity after disruption of pathways originating in the AC to the IC affects sound-induced activation of neurons in this nucleus.
One day after the cortical lesion, the largest drops in c-Fos Ir neuronal nuclei relative to control-stimulated animals are seen in the IC ipsilateral to the lesion and in the contralateral DCIC. These regions correspond to those more affected by preterminal degeneration after ablation of the AC, as described by Feliciano and Potashner (1995). Therefore, loss of excitatory endings in the IC originating in the AC may lead to diminished activity in IC neurons. In this regard, Sun et al. (2007) showed that blocking inhibition in the AC with bicuculline, increased c-Fos immunoreactivity in the IC, mainly in its cortical regions, although this increase it was concentrated in the side ipsilateral to the injection. Our results indicate that diminished neuronal activity of IC neurons after deafferentation of descending projection is evidenced by a decreased sound-induced c-Fos expression, being more intense in those IC subdivisions that receiving more dense descending (AC) projections.
To the best of our knowledge, this is the first time that labeling intensity measured as average gray levels and nuclear perimeter are used as metrics to quantify c-Fos immunoreactivity levels after induced activation. Average gray levels may be an indicator of the amount of chromogen deposited in immunoreactive nuclei, which in turn is a function of the amount of antigen detected, when reaction times are carefully controlled. On the other hand, c-fos transcriptional control involves histone phosphorylation and acetylation which may vary chromatin condensation state, likely leading to changes in nuclear mass, translated into perimeter variations of immunoreactive nuclei (Clayton et al., 2000; Brami-Cherrier et al., 2009). One day after AC lesion, overall c-Fos immunostaining intensity decreases, as shown by a significant shift in average gray levels toward higher, or “less dark” values. In addition, the perimeter of c-Fos Ir nuclei also decreases. These two quantitative changes, along with diminished of total number of c-Fos Ir nuclei, strengthens the notion that lesions to the cortico-collicular pathway reduce, in the short range, not only the number of nuclei, but also protein production rates in neurons of the IC.
Fifteen days after cortical lesion, there is a further significant decrease of c-Fos immunoreactivity in both ICs after sound stimulation (Figures 4A and 6A). These findings support diminished c-Fos production in IC neurons 15 days after ablation, which may bear correlation with a significant drop in acoustic activity found previously by us with ABRs (Clarkson et al., 2010a). We have shown that 15 days after AC lesions, ABR amplitudes are diminished; particularly wave V (Clarkson et al., 2010a), which hypothetically originates in the IC (Biacabe et al., 2001). The correlation between strongly diminished c-Fos production and IC activity 15 days post-lesion is also supported by the finding that the acoustic startle reflex/prepulse inhibition was also attenuated after an identical post-lesion period (Clarkson et al., 2010a). Feliciano and Potashner (1995) found that 7 days after unilateral lesions to the AC, GABA inhibition might be altered in the IC as a consequence of a drop in GABA release. Therefore, both excitation and inhibition are likely to become affected in the IC by lesions to the descending projection, leading to, at least, a partial activity block (Clarkson et al., 2010a) which is seen at this time post-lesion in continuing c-Fos down-regulation.
In the experimental group analyzed 90 days after cortical ablation, the number of c-Fos immunoreactive neuronal nuclei in the IC tends to increase relative to shorter post-lesion times (1 and 15 days), but it is still lower than in sound-stimulated controls. Interestingly, however, average gray values in nuclei approached those of control animals. We previously reported that 90 days after AC ablation, ABRs recover in amplitude and thresholds, relative to those recorded in animals 15 days post-lesion (Clarkson et al., 2010a). These findings support a trend toward a long-range recovery of neuronal activity patterns. Also, at 90 days post-lesion, the average nuclei perimeter of c-Fos immunoreactive collicular neurons was even larger than in stimulated controls and more so in the side contralateral to the lesion. If changes in nuclear perimeter do reflect changes in synthesis activity (see above), such an increase may be interpreted as a rebound c-Fos activity above normal values, being higher in the contralateral region less affected by the loss of the corticofugal projection. Recovery suggested by the increase in c-Fos activity in the IC 90 days after lesioning the corticofugal projection may reflect structural and functional plasticity mechanism (see Butz et al., 2009). Such mechanisms are still unknown in the IC, including the possibility of collateral sprouting from the intact cerebral cortex or other sources.
After 180 days of the lesion to the AC, c-Fos immunoreactivity after sound stimulation, approached control values, as seen by gray levels and number of c-Fos Ir neuronal nuclei. This supports recovery of normal production of c-Fos and correlates with functional recovery, as measured by auditory startle response/prepulse inhibition after 180 days post-lesion (Clarkson et al., 2010a). Also previous studies from our lab show that under identical experimental conditions, calretinin immunoreactive neurons increase in number in the IC up to 180 days after the lesion to the AC, further returning to control values 240 days after the lesion (Clarkson et al., 2010b). It is known that c-fos accumulation in nuclei depends on intracellular Ca2+ and second messenger increases as a consequence of changes in neuronal activity (Morgan and Curran, 1988; Sheng and Greenberg, 1990). Turrigiano (1999) suggested that balanced intracellular Ca2+ concentrations are needed to reach a “set point level” in neurons, needed to keep excitability and firing within adequate ranges. Changes in the concentration of this ion may lead to a global imbalance of inward and outward currents, thus altering excitability. In this regard, our data indicate that c-Fos recovery and return to control values coincides with the highest level of calretinin up-regulation (Clarkson et al., 2010b) 180 days after lesioning the AC. This temporal correlation may be explained by stabilization of Ca2+ entry produced after recovery of the homeostatic balance of activity in the IC.
All these findings indicate that, in adult animals, after ablation of the corticofugal projection to the IC, neurons in this midbrain auditory nucleus and the functional circuits in which they assemble have the capacity of progressively recovering, on the long range, the loss of activity subsequent to AC ablation. Although more experiments will be needed to determine which structures and mechanisms are involved in “compensating” this loss of activity, our results suggest that long-range repair or adaptation in the IC is successful, as there seems to be functional recovery.
Conflict of Interest Statement
The authors declare that the research was conducted in the absence of any commercial or financial relationships that could be construed as a potential conflict of interest.
Acknowledgments
The authors would like to thank Ignacio Plaza for excellent technical assistance and Dr. Marco Izquierdo and Dr. Manuel Malmierca for assistance with sound stimulation, and Dr. Enrique López-Poveda for developing the morphometry, densitometry and numerical analysis methods employed in the study. This work was supported by grants from the Ministry of Science and Innovation of the Government of Spain, #BFU2009-13754-C02 and #BFU2006-13974, and by Proyecto de Excelencia JCyL #GR221 to Miguel A. Merchán).
References
Biacabe, B., Chevallier, J. M., Avan, P., and Bonfils, P. (2001). Functional anatomy of auditory brainstem nuclei: application to the anatomical basis of brainstem auditory evoked potentials. Auris Nasus Larynx 28, 85–94.
Brami-Cherrier, K., Roze, E., Girault, J. A., Betuing, S., and Caboche, J. (2009). Role of the ERK/MSK1 signalling pathway in chromatin remodelling and brain responses to drugs of abuse. J. Neurochem. 108, 1323–1335.
Bullitt, E. (1990). Expression of c-fos-like protein as a marker for neuronal activity following noxious stimulation in the rat. J. Comp. Neurol. 296, 517–530.
Butz, M., van Ooyen, A., and Worgotter, F. (2009). A model for cortical rewiring following deafferentation and focal stroke. Front. Comput. Neurosci. 3:10. doi: 10.3389/neuro.10.010.2009.
Ceccatelli, S., Villar, M. J., Goldstein, M., and Hokfelt, T. (1989). Expression of c-Fos immunoreactivity in transmitter-characterized neurons after stress. Proc. Natl. Acad. Sci. U.S.A. 86, 9569–9573.
Clarkson, C., Lòpez, D. E., and Merchán, M. A. (2010a). Long-term functional recovery in the rat auditory system after unilateral auditory cortex ablation. Acta Otolaryngol. 130, 326–332.
Clarkson, C., Juìz, J. M., and Merchán, M. A. (2010b). Long-term regulation in calretinin staining in the rat inferior colliculus after unilateral auditory cortical ablation. J. Comp. Neurol. 518, 4261–4276.
Clayton, A. L., Rose, S., Barratt, M. J., and Mahadevan, L. C. (2000). Phosphoacetylation of histone H3 on c-fos- and c-jun-associated nucleosomes upon gene activation. EMBO J. 19, 3714–3726.
Feliciano, M., and Potashner, S. J. (1995). Evidence for a glutamatergic pathway from the guinea pig auditory cortex to the inferior colliculus. J. Neurochem. 65, 1348–1357.
Friauf, E. (1992). Tonotopic order in the adult and developing auditory system of the rat as shown by c-fos immunocytochemistry. Eur. J. Neurosci. 4, 798–812.
Friauf E. (1995). C-fos immunocytochemical evidence for acoustic pathway mapping in rats. Behav. Brain Res. 66, 217–224.
Greenberg, M. E., and Ziff, E. B. (1984). Stimulation of 3T3 cells induces transcription of the c-fos proto-oncogene. Nature 311, 433–438.
Gundersen, H. J., Jensen, E. B., Kieu, K., and Nielsen, J. (1999). The efficiency of systematic sampling in stereology – reconsidered. J. Microsc. 193(Pt 3), 199–211.
Helfert, R. H., Snead, C. R., and Altschuler, R. A. (1991). “The ascending auditory pathways,” in Neurobiology of Hearing: The Central Auditory System, eds R. A. Altschuler, R. P. Bobbin, B. M. Clopton, and D. W. Hoffman (New York: Raven Press), 1–25.
Herrera, D. G., and Robertson, H. A. (1996). Activation of c-fos in the brain. Prog. Neurobiol. 50, 83–107.
Morgan, J. I., and Curran, T. (1988). Calcium as a modulator of the immediate-early gene cascade in neurons. Cell Calcium 9, 303–311.
Nagase, S., Miller, J. M., Dupont. J., Lim, H. H., Sato, K., and Altschuler, R. A. (2000). Changes in cochlear electrical stimulation induced Fos expression in the rat inferior colliculus following deafness. Hear. Res. 147, 242–250.
Nagase, S., Mukaida, M., Miller, J. M., and Altschuler, R. A. (2003). Neonatal deafening causes changes in Fos protein induced by cochlear electrical stimulation. J. Neurocytol. 32, 353–361.
Nakamura, M., Rosahl, S. K., Alkahlout, E., Gharabaghi, A., Walter, G. F., and Samii, M. (2003). C-Fos immunoreactivity mapping of the auditory system after electrical stimulation of the cochlear nerve in rats. Hear. Res. 184, 75–81.
Nakamura, M., Rosahl, S. K., Alkahlout, E., Walter, G. F., and Samii, M. M. (2005). Electrical stimulation of the cochlear nerve in rats: analysis of c-Fos expression in auditory brainstem nuclei. Brain Res. 1031, 39–55.
Nwabueze-Ogbo, F. C., Popelar, J., and Syka, J. (2002). Changes in the acoustically evoked activity in the inferior colliculus of the rat after functional ablation of the auditory cortex. Physiol. Res. 51(Suppl. 1), S95–S104.
Paxinos, G., and Watson, C. (2005). The Rat Brain in Stereotaxic Coordinates, 5th Edn. Burlington: Elsevier Academic Press.
Popelar, J., Nwabueze-Ogbo, F. C., and Syka, J. (2003). Changes in neuronal activity of the inferior colliculus in rat after temporal inactivation of the auditory cortex. Physiol. Res. 52, 615–628.
Reisch, A., Illing, R. B., and Laszig, R. (2007). Immediate early gene expression invoked by electrical intracochlear stimulation in some but not all types of neurons in the rat auditory brainstem. Exp. Neurol. 208, 193–206.
Saito, H., Miller, J. M., Pfingst, B. E., and Altschuler, R. A. (1999). Fos-like immunoreactivity in the auditory brainstem evoked by bipolar intracochlear electrical stimulation: effects of current level and pulse duration. Neuroscience 91, 139–161.
Saldaña, E., Feliciano, M., and Mugnaini, E. (1996). Distribution of descending projections from primary auditory neocortex to inferior colliculus mimics the topography of intracollicular projections. J. Comp. Neurol. 371, 15–40.
Sheng, M., and Greenberg, M. E. (1990). The regulation and function of c-fos and other immediate early genes in the nervous system. Neuron 4, 477–485.
Soloaga, A., Thomson, S., Wiggin, G. R., Rampersaud, N., Dyson, M. H., Hazzalin, C. A., Mahadevan, L. C., and Arthur, J. S. (2003). MSK2 and MSK1 mediate the mitogen- and stress-induced phosphorylation of histone H3 and HMG-14. EMBO J. 22, 2788–2797.
Sun, X., Guo, Y. P., Shum, D. K., Chan, Y. S., and He, J. (2009). Time course of cortically induced fos expression in auditory thalamus and midbrain after bilateral cochlear ablation. Neuroscience 160, 186–197.
Sun, X., Xia, Q., Lai, C. H., Shum, D. K., Chan, Y. S., and He, J. (2007). Corticofugal modulation of acoustically induced Fos expression in the rat auditory pathway. J. Comp. Neurol. 501, 509–525.
Turrigiano, G. G. (1999). Homeostatic plasticity in neuronal networks: the more things change, the more they stay the same. Trends Neurosci. 22, 221–227.
Wenthold, R. J. (1991). “Neurotransmitters of brainstem auditory nuclei,” in Neurobiology of Hearing: The Central Auditory System, eds R. A. Altschuler, R. P. Bobbin, B. M. Clopton, D. W. Hoffmann (New York: Raven Press), 121–139.
Wenthold, R. J., Hunter, C., and Petralia, R. S. (1993). “Excitatory amino acid in the rat cochlear nucleus,” in The Mammalian Cochlear Nuclei: Organization and Function, eds M. A. Merchan, J. M. Juiz, D. A. Godfrey, and E. Mugnaini (New York: Plenum Press), 179–194.
West, M. J., Slomianka, L., and Gundersen, H. J. (1991). Unbiased stereological estimation of the total number of neurons in the subdivisions of the rat hippocampus using the optical fractionator. Anat. Rec. 231, 482–497.
Yoshida, N., Hequembourg, S. J., Atencio, C. A., Rosowski, J. J., and Liberman, M. C. (2000). Acoustic injury in mice: 129/SvEv is exceptionally resistant to noise-induced hearing loss. Hear. Res. 141, 97–106.
Keywords: rat, immediate early gene, homeostatic plasticity, auditory descending projection
Citation: Clarkson C, Juíz JM and Merchán MA (2010) Transient down-regulation of sound-induced c-Fos protein expression in the inferior colliculus after ablation of the auditory cortex. Front. Neuroanat. 4:141. doi: 10.3389/fnana.2010.00141
Received: 03 March 2010;
Paper pending published: 04 March 2010;
Accepted: 27 September 2010;
Published online: 20 October 2010
Edited by:
Douglas L. Oliver, University of Connecticut Health Center, USAReviewed by:
Maria E. Rubio, University of Pittsburgh, USAAvril Genene Holt, Wayne State University, USA
Copyright: © 2010 Clarkson, Juíz and Merchán. This is an open-access article subject to an exclusive license agreement between the authors and the Frontiers Research Foundation, which permits unrestricted use, distribution, and reproduction in any medium, provided the original authors and source are credited.
*Correspondence: Miguel A. Merchán, Laboratory for the Neurobiology of Hearing, Instituto de Neurociencias de Castilla y León, Pintor Fernando Gallego Street, 1, Salamanca 37007, Spain. e-mail:bWVyY2hhbkB1c2FsLmVz