
 Vanessa Rocha-Rego
- Laboratório de Neurobiologia II, Instituto de Biofísica Carlos Chagas Filho, Universidade Federal do Rio de Janeiro, Rio de Janeiro, Brazil
In small-brained mammals, such as opossums, the cortex is organized in fewer sensory and motor areas than in mammals endowed with larger cortical sheets. The presence of multimodal fields, involved in the integration of sensory inputs has not been clearly characterized in those mammals. In the present study, the corticocortical connections of the forepaw representation in the somatosensory caudal (SC) area of the Didelphis aurita opossum was studied with injections of fluorescent anatomical tracers in SC. Electrophysiological mapping of S1 was used to delimit its respective rostral and caudal borders, and to guide SC injections. The areal borders of S1 and the location of area SC were further confirmed by myeloarchitecture. In S1, we found a well-delimited forepaw representation, although it presented a crude internal topographic organization. Cortical projections to S1 originate in somatosensory areas of the parietal cortex, and appeared to be mostly homotopic. Physiological and connectional evidence were provided for a topographic organization in opossum area SC as well. Most notably, corticocortical projections to the forepaw representation of SC originated from somatosensory cortical areas and from cortex representing other sensory modalities, especially the visual peristriate cortex. This suggests that SC might be involved in multimodal processing similar to the posterior parietal cortex of species with larger brains.
Introduction
The anatomical and functional organization of cortical somatosensory and motor systems can vary extensively in different extant species. Comparative studies of large-brained mammals, like primates, demonstrate that they have an expanded neocortex and increased number of cortical fields (Kaas, 2004), including a number of sensory and motor areas, and an enlarged posterior parietal (PP) cortex subdivided in small fields in which information from different sensory modalities is integrated to orient motor performance (Kaas, 2004, 2008; Fogassi and Luppino, 2005). In primates, primary and secondary sensory areas are typically unimodal. In contrast, PP cortex is intensely connected to somatosensory, visual, motor, and premotor fields (Cavada, 2001; Matelli and Luppino, 2001; Kaas, 2004). Such connections enable PP fields to generate complex behaviors with the forearms and hands that include aggressive, defensive, and reaching movements following intracortical microstimulation (Cooke and Graziano, 2003; Cooke et al., 2003; Stepniewska et al., 2005, 2009).
On the other hand, in mammals with small brains the cortical sheet is dominated by few sensory and motor fields (Krubitzer et al., 1997; Catania et al., 1999, 2000; Catania, 2007) that include primary and secondary sensory areas, as well as motor areas such as primary motor area, M1 (Krubitzer and Hunt, 2007). Additionally, in most mammals studied, at least a rudimentary PP cortex has been identified between visual and somatosensory cortices (Huffman et al., 1999; Slutsky et al., 2000; Padberg et al., 2005; Padberg and Krubitzer, 2006), with few exceptions (Catania, 2007). In species with small brains, since cortical space devoted to sensory and motor integration is limited, part of the multimodal processing seems to occur in primary sensory areas (e.g., Budinger et al., 2006; Campi et al., 2007) and in cortical regions located at the border separating those areas (Wallace et al., 2004). For instance, in gerbils, primary auditory cortex (A1) seems to integrate sensory information through direct cortical projections originating from other sensory fields like somatosensory and visual cortices, and from PP cortex as well (Budinger et al., 2006). Projections from multisensory thalamic nuclei provide an additional anatomical substrate for a role of primary auditory cortex in multimodal integration (Budinger et al., 2006).
In our laboratory, we are especially interested in the neural basis of hand dexterity from a phylogenetic (evolutionary) standpoint (Padberg et al., 2007). The emergence of fine movements that primates are able to perform with the hand must be partly due to an increase in complexity of cortical circuits that were originally present in more primitive animals endowed with much smaller cortical sheets. Opossums of the genus Didelphis have been regarded as good models for the study of brain evolution. They are considered primitive because their body forms are similar to those of early marsupials (Kemp, 2005 cited by Kaas, 2011), and they possess small lissencephalic brains, especially when related to its body size (Beck et al., 1996), similar to a putative common ancestor of the mammalian lineage (Jerison, 1990, 2007).
Opossums of the genus Didelphis are marsupials represented by six different species with a wide geographic distribution over the Americas (Wilson and Regard, 2005). Each Didelphis species has its own geographic distribution, but the main aspects of their anatomy and neurobiology are very much alike (Gardner, 1973; Rocha-Miranda and Lent, 1978; Cerqueira, 1985; Wilson and Regard, 2005). Many of the neurobiological studies performed in marsupials used different species of opossums from the genus Didelphis. The first electrophysiological mappings of parietal cortex of these marsupial species put in evidence two topographically organized somatosensory fields displaying a complete representation of the contralateral body: a primary somatosensory area (S1) and a second somatosensory area (S2; Lende, 1963; Magalhaes-Castro and Saraiva, 1971; Pubols et al., 1976). In S1, there was a contralateral representation of the body that was inverted, with the tail located most medially, followed by the representation of hindlimb, trunk, forelimb (including the forepaw), and face in a medial to lateral progression. The representation of the body in S2 was smaller than in S1 and was “upright” or mirror-reverted in relation to that found in S1. Additionally, while receptive fields in S1 were typically small and located on the contralateral part of the body, in S2 receptive fields were large and sometimes bilateral (for a review, see Karlen and Krubitzer, 2007).
However, a more recent account of the Didelphis virginiana parietal cortex revealed that in addition to S1 and S2, there were three other somatosensory areas, comprising a total of five different somatosensory fields (Beck et al., 1996). According to this study, the parietal ventral area, or area PV, was confounded as part of area S2 in previous studies, but it actually displayed its own topographically organized representation of the body surface (Beck et al., 1996). The other two parietal fields corresponded to the somatosensory rostral (SR) area and somatosensory caudal (SC) area sharing respectively the rostral and caudal borders of area S1. In anesthetized preparations, both SR and SC were typically unresponsive to sensory stimulation (Beck et al., 1996). Nonetheless, they were considered to be somatosensory fields because of their strong connections with area S1 (Beck et al., 1996). In Didelphis aurita, the region immediately caudal to area SC was identified as visual peristriate cortex (PS), which comprised two or three belt-like areas located anterior to the primary visual cortex (V1). These belt-like areas received visuotopically organized connections from V1 and from the superior colliculus (Martinich et al., 2000).
Despite the fact that the opossum brain has been studied for quite a long time (e.g., Rocha-Miranda and Lent, 1978), there are to our knowledge only two anatomical tracer studies describing cortical connections of the somatosensory cortex in marsupials. In the first study, performed in Didelphis virginiana, Beck et al. (1996) made injections located in S1 (briefly described above), but connections of other somatosensory fields, like the somatosensory rostral and caudal fields, were not investigated. The second anatomical tracer study was performed in the Australian marsupial Trichosurus vulpecula, also known as the brush-tailed possum (Elston and Manger, 1999). Similar to Didelphis virginiana, the brush-tailed possum presented at least three somatosensory fields that were topographically organized: S1, S2, and PV. A field caudal to S1 was named PP cortex, in which neurons were responsive to deep somatosensory stimulation and received ipsilateral projections from S1, S2, and PV. This cortical region was additionally connected to other sensory and motor areas, such as the primary and secondary visual areas, and motor cortex (Elston and Manger, 1999), and might be homologous to area SC described in Didelphis virginiana.
Although precious for comparative studies, from a phylogenetic point of view data obtained in the brush-tailed possum may not be ideal for reconstructing the organization of the primitive brains of ancestral mammals. In this species the somatosensory cortex presents barrel fields (Weller, 1972), a derived brain feature (Krubitzer and Huffman, 2000) not shared with the other marsupial species studied so far (e.g., Huffman et al., 1999, but see also Beck et al., 1996). Opossum species from the genus Didelphis have brains with conserved features, such as a small number of cortical fields, and the absence of derived features such as clearly defined barrel fields. Thus, these marsupials are considered important models to infer the organization of primitive brains of mammalian ancestors (Kaas, 2011).
Because information about connections and physiological properties of SC area in opossum species is currently lacking, it is not clear yet whether this cortical region is exclusively involved in processing somatosensory information, similar to anterior parietal caudal areas 1 and 2 of anthropoid primates; or if, alternatively, opossum SC has a role in integrating sensory information of different modalities similar to PP cortical areas of other species. Additionally, it is also possible that area SC in the opossum might be primarily concerned in integrating somatosensory information from the forelimb only and in processing converging information from other sensory modalities, with special emphasis on the visual connections with the representation of the inferior visual field, which includes the visual space around the forepaw.
In order to further elucidate this point, the present study characterizes the ipsilateral corticocortical connections of the representation of the forepaw in area SC of the South American Didelphis aurita opossum, using electrophysiological mapping to guide injections of anatomical tracers. Our results confirm that the representation of the forepaw in S1 has a gross topographic organization that is not entirely ordered at a fine-grained level, since an orderly progression of receptive fields is not observed in rows of closely spaced recording sites. We also provide physiological and connectional evidence for topographic organization in opossum area SC. Additionally; we demonstrate that SC receives information from other cortical fields besides the parietal somatosensory areas, suggesting that it might be involved in multimodal processing similar to the PP cortex of species with larger brains.
Materials and Methods
Cortical connections and topographic organization of areas S1 and SC were investigated using neuroanatomical tracing techniques in six Didelphis aurita opossums, male and female, weighting from 1.4 to 2.8 kg (Table 1). Electrophysiological recording was combined with myelin processing to provide identification of cortical fields. All procedures were approved by the Commission of Animal Care of the Institute of Biophysics Carlos Chagas Filho (IBCCF) from the Federal University of Rio de Janeiro, Brazil (CAUAP protocol # 053-06-2005); and were in accordance with the guidelines published in the NIH Guide for the Care and Use of Laboratory Animals (http://www.nap.edu/catalog/12910.html). Animals were obtained from the IBCCF animal facility, under the license of the Brazilian Institute of the Environment and Renewable Natural Resources (IBAMA).
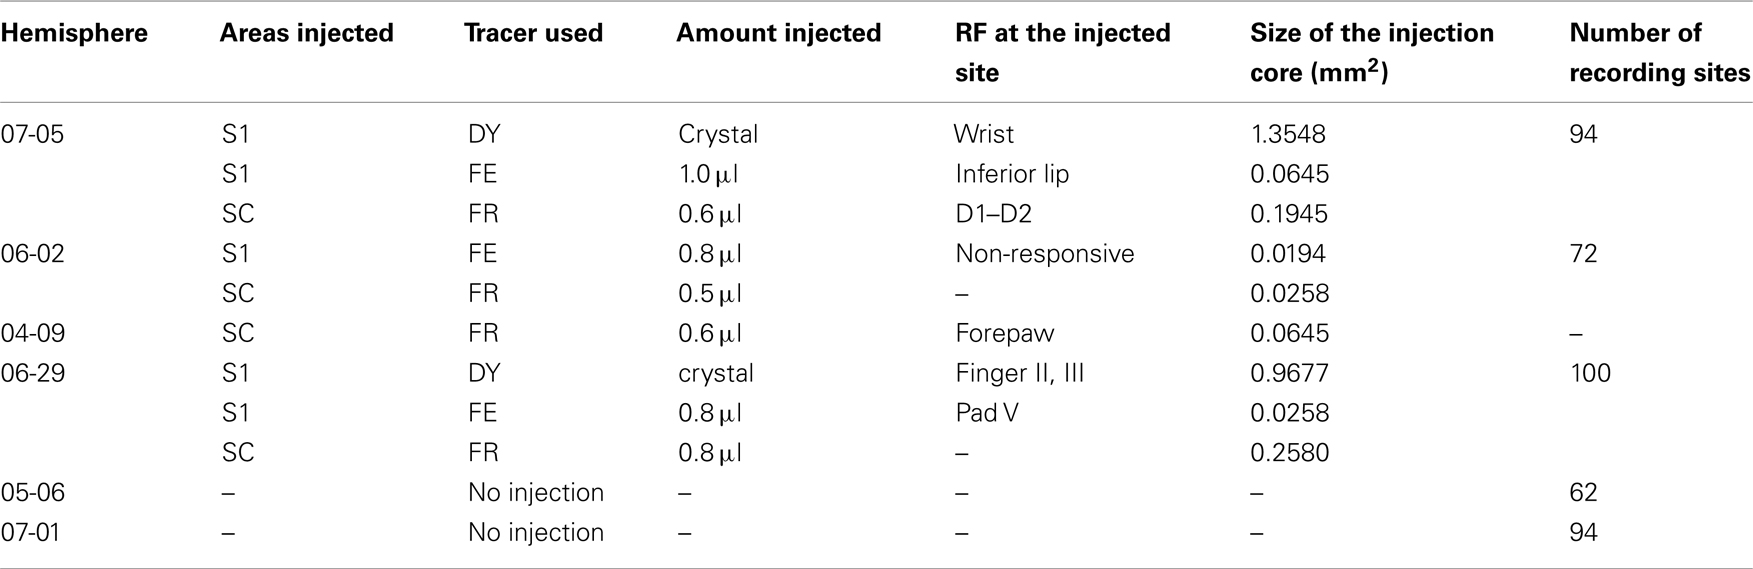
Table 1. Summary of neurotracer injections and electrophysiological recording cases.
Surgical Procedures
Somatosensory cortex mapping and neurotracer injections were performed under aseptical conditions in anesthetized animals. Before surgical procedures, the opossums were medicated with antibiotics (Pentabiótico Veterinário Pequeno Porte, FORT DODGE, 0.58 mg/ml, I.M.), dexamethasone (Decadron, Prodrome, 4 mg/ml), and vitamin K (0.3 ml – Kanakion, Roche, 10 mg/ml).
Animals were anesthetized using two different protocols. For injection of anatomical tracers, animals received a single dose of 60 mg/kg of thiopental sodium (Thionembutal 0.5 g, Abbott). After the recovery period of 10–12 days to allow tracer transport, animals were submitted to a terminal mapping session in which urethane was used as anesthetic (initial dose of 1.25 g/kg IP, plus supplementary doses of 0.42 g/kg as needed). Anesthesia level was closely monitored during the procedures. Atropine was injected after anesthesia (Ariston; 0.25 mg/ml; I.M.). Body temperature was maintained with a heating pad, and heart rate was monitored during the surgery. Animals were initially placed in a stereotaxic frame. The skin and temporal muscle were retracted, and a craniotomy was performed to expose the cortex from the orbital fissure to the occipital cortex. The dura-mater was cut and retracted, and the brain surface was kept moist with saline. Photomicrographs of the exposed neocortex were obtained using a digital camera coupled to a microscope. The brightness and contrast of the images were then adjusted using either Canvas software (Deneba Inc.) or Adobe Photoshop (Adobe Systems, San Jose, CA, USA). The blood vessel pattern obtained in this photograph was used to mark recording and injection sites.
Electrophysiological Mapping
Sites for injection of anatomical tracers were chosen after a short electrophysiological mapping session in which the representation of the forepaw in S1 was identified. The rostral and caudal borders of area S1 at the same mediolateral level as the forepaw representation were also localized. A second more extensive and terminal mapping session was performed after the survival period of 10–12 days necessary for anatomical tracer transport. Later, electrophysiological maps were combined with architectonic boundaries obtained by myelin staining (see below).
Low impedance tungsten microelectrodes (Frederick Haer Inc. e Micro Probe Inc., 0.8–1.2 MΩ) were lowered perpendicular to the cortical surface at depths of 500–1000 μm. Each electrode penetration site was marked at the photograph of the brain surface. For each recording site, the body was stimulated with small probes or a paint brush. Response intensity and location of receptive fields were annotated and represented on schematic drawings of the body. We characterized a response as “cutaneous” if neurons were responsive to light touch on the skin or to displacement of hairs, including vibrissae. On the other hand, if neurons were responsive only to taps, deep tactile stimulation of the skin, and/or passive manipulation of body segments (proprioception), the response was labeled as “deep”. Some sites located at area SC were visually stimulated with full field light flashes.
Neuronal activity was qualitatively evaluated along rows of electrode penetration sites. Changes in intensity of background activity from one site to the next were annotated and considered as indicative of a physiological border.
Anatomical Tracer Injections
We placed fluorescent anatomical tracers in electrophysiologically identified representations of the forepaw or the forelimb within S1. Tracer injection sites in SC were generally caudal to the forelimb representation in S1, at the same mediolateral level. In total, five injections were made in S1 and four in SC. Connections were identified by the use of fluorescent anatomical tracers, such as fluororuby (FR, Invitrogen, Carlsbad, CA, USA), fluoroemerald (FE, Invitrogen, Carlsbad, CA, USA), and diamidino-yellow (DY, Sigma Aldrich). Injections of 10% FE and 10% FR (both in phosphate buffer, PB) were made with Hamilton syringes. The syringe was positioned at three depths between 500 and 1500 μm from the cortical surface. A total injection volume of anatomical tracer ranging from 0.4 to 1.0 μl was distributed between these three depths during 10–20 min of injection. Alternatively, a single small undiluted DY crystal was inserted in the cortex to produce retrograde label.
After the injections, the cortex was covered with a contact lens with gelfoam on top. The craniotomy was then covered with a dental acrylic cap that was molded to fit the skull opening. This cap was fixed on the remaining skull with dental cement. The temporal muscle and the skin were sutured back in place. The animals were recovered and closely monitored for 10–12 days to allow the retrograde transport of the tracers. At the end of the survival period, the somatosensory cortex was submitted to an extensive mapping session to provide details of the representation of the forepaw and forearm (see above).
Perfusion and Histological Processing
Immediately before perfusion procedures, opossums were deeply anesthetized with sodium pentobarbital (90 mg/ml/kg i.p.; Knoll, RJ, Brazil). After the animal was rendered areflexive, a thoracotomy was performed. Heparin was injected into the left ventricle to avoid intravascular coagulation. Perfusion was made through the aorta with approximately 300 ml of 0.9% saline buffer followed by the same amount of 4% paraformaldehyde (PF) diluted in 0.1 M PB (pH 7.4). Finally, solutions of 10% and 30% sucrose in PB were perfused for cryoprotection.
After perfusion, the brain was removed from the skull. Cerebral hemispheres were separated from the diencephalon, which was kept in a solution of 30% sucrose – 4% PF for a related study. The injected neocortex was flattened by carefully placing the cortical tissue in-between two glass slides overnight deepened in a 30% sucrose solution. The next day, the neocortex was frozen in dry ice, and then cut at 40 μm thickness. Adjacent cortical sections were processed for myelin staining (Gallyas, 1979) or mounted unstained for fluorescent microscopy analysis.
Data Analysis
Injection sites, retrogradely labeled neurons, blood vessels, and cortical section contours were plotted using a fluorescent microscope equipped with an x/y stage encoding system attached to a computer (Orthoplan 2, MD-Plot 3.3 software – Minnesota Datametrics Corporation).
The nomenclature used for the cortical subdivisions was according to that of a previous study in Didelphis virginiana opossum (Beck et al., 1996). Myeloarchitectonic subdivisions of the neocortex were drawn using a histological slide projector. The resultant drawing was overlapped with the electrophysiological map obtained for that same hemisphere, using the position of the injection sites (generally apparent as small pale ovals in myelin-stained sections) as landmarks. The x/y plots with the representation of cortical labeled cell bodies were superimposed with the adjacent myelin section based in the blood vessel distribution, section contours, site of the injections, and other artifacts. Composite drawings containing section contours, areal borders, injection and recording sites, and distribution of labeled cells were then made using Canvas X software (ACD-Systems). Labeled cells in each resulting composite drawing were counted. The intensity of corticocortical connections was then expressed as the percentage of labeled cells per cortical area in each injection case separately (Table 2).
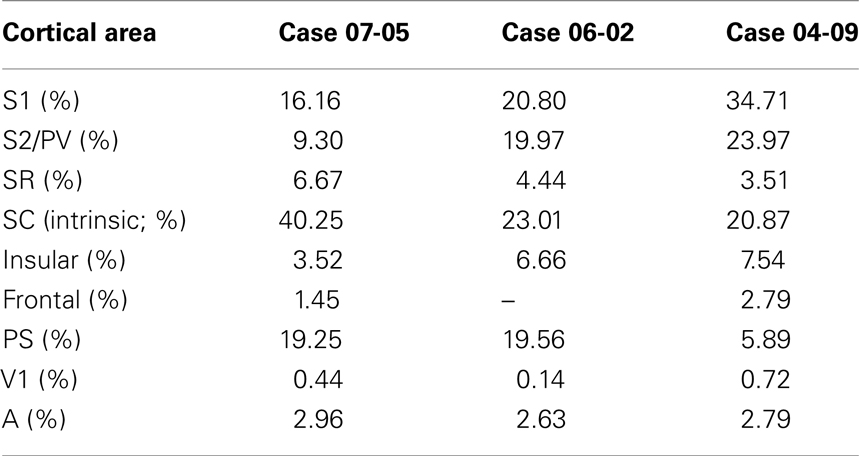
Table 2. Quantification of ipsilateral corticocortical projections to SC.
Results
The primary goal of this study was to characterize, in the marsupial opossum, the pattern of corticocortical connectivity of the forepaw representation in primary and caudal somatosensory areas, S1 and SC. We combined electrophysiological mapping of Didelphis aurita parietal cortex with injections of anatomical tracers and myeloarchitecture of corresponding cortical tangential sections to identify the location of areas S1, SR, and SC.
In our experiments, we first identified the S1 forepaw representation with a short mapping session consisting of 10–15 recording sites. Anatomical tracers were then injected in the forepaw representation in area S1 and at a corresponding mediolateral level in area SC. In area SC, responses to forepaw stimulation were recorded, although with different receptive field properties as those of S1 (see below). The animal was recovered for about 2 weeks to allow for tracer transport. After this period, the opossum was submitted to a more detailed mapping session and then perfused for histological processing and analysis. The location of injection sites were confirmed by identification of areal borders in myelin-stained tangential sections of the cortex.
In this paper, we will first describe the topographic organization of the forepaw representation in S1 in detail; and then, we will show the ipsilateral corticocortical projections that converge to SC. Additionally, we will describe the corticocortical projections to S1 observed in one case. The thalamocortical projections that resulted from our injections will be the subject of a subsequent paper.
Correlation between Electrophysiological Recordings and Myeloarchitecture in the Opossum Parietal Cortex
Neurons in S1 typically presented high spontaneous background activity, responsiveness to light cutaneous stimulation or displacement of hairs (Figure 1), and smaller receptive fields than neurons in adjacent areas SC and SR, which were generally responsive to deep stimulation or were non-responsive (Figure 1). Borders between areas SR, S1, and SC, defined by electrophysiological mapping, were further confirmed by the pattern of myelin staining (Figure 2A). Usually, the transition from S1 to SC was marked by a reduction in background activity and absence of cutaneous responses (Figure 2). In one case in which we obtained responses in area SC (see below), the border with area S1 was determined by reversions in the progression of receptive fields in anterior to posterior rows of recording sites.
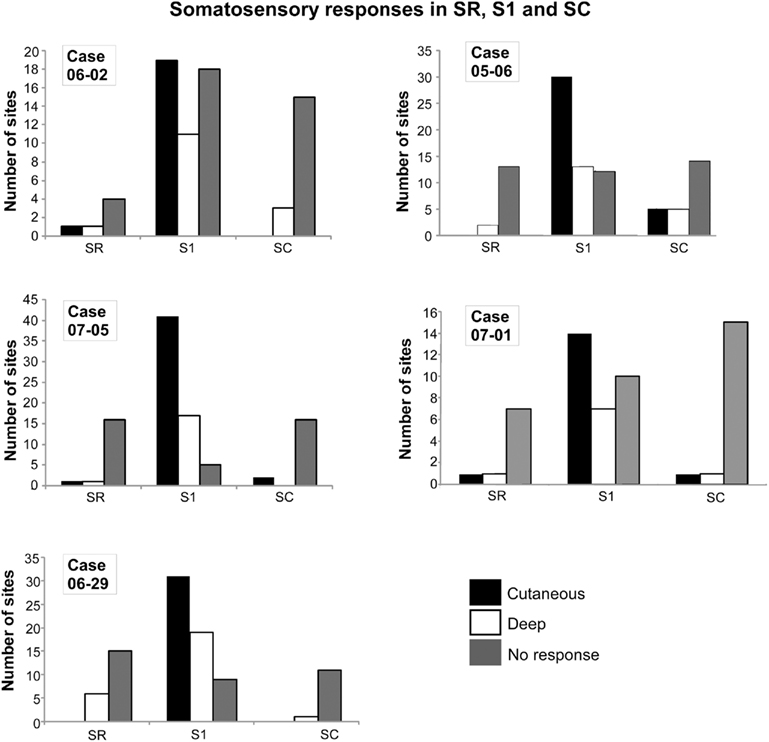
Figure 1. Quantification of electrophysiological responses in areas SR, S1, and SC in five different cases. The total number of recorded sites in each case is depicted in Table 1. In S1, although neurons responsive to cutaneous stimulation predominated, in some sites neuronal responses could only be elicited by deep or more intense stimuli (like deep pressure or limb displacement). Sites with non-responsive neurons were also found in S1. In SC and SR, sites with non-responsive neurons predominated, although neurons responsive to cutaneous (light) stimulation could also be found. Abbreviations: S1, primary somatosensory area; SC, somatosensory caudal area; SR, somatosensory rostral area.
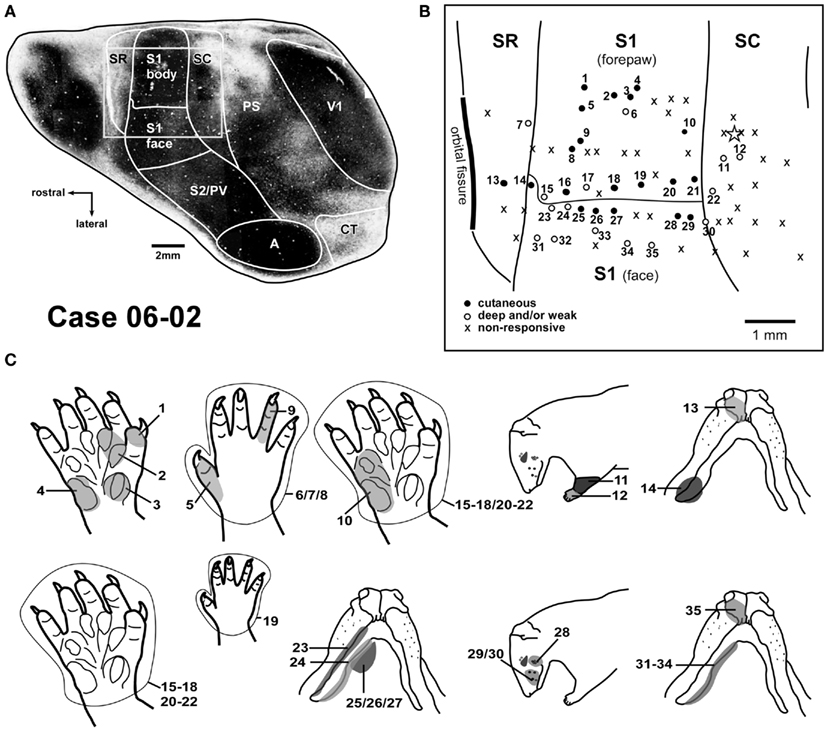
Figure 2. Correlation between myeloarchitecture and the electrophysiological map in case 06-02. (A) Tangential section stained for myelin showing areal borders. The square frames the region represented in the upper right box (B). (B) Map of the forepaw representation and part of the face representation in areas SR, S1, and SC. Responsiveness of each site is characterized by different symbols as depicted in the inferior left corner. The star marks one tracer injection site in area SC that is further illustrated in Figure 7A. (C) Multiunit receptive fields recorded in sites depicted in (B) of this Figure are numbered accordingly in the drawings. Abbreviations: A, auditory field; CT, caudal temporal area; PS, peristriate cortex; PV, parietal ventral area; S2, secondary somatosensory area; V1, primary visual area.
Recording sites were classified according to the responsiveness of neurons as “cutaneous,” “deep,” or “non-responsive” (Figure 1). In all cases, cutaneous responses predominated in area S1 (52% of 266 sites in S1, n = 5 cases, Figure 1). Nevertheless, sites with non-responsive neurons (19.2%), or responsive to “deep” stimulation (28.8%), were also obtained in S1. Although sites with non-responsive neurons predominated in SR and SC (79.4% of 68 sites in SR, 79.5% of 88 sites in SC, Figure 1), some responsiveness to stimulation of deep receptors (including responses to passive limb movements, 16.2% in SR; 11.4% in SC) and sometimes to stimulation of cutaneous receptors (4.4% in SR, 9.1% in SC) could be elicited from neurons in these areas (Figures 1 and 2).
Myelin histological processing of cortical sections (Figure 2A) revealed that borders defined by electrophysiological mapping and myeloarchitecture were generally coincident. S1 was identified as a densely myelinated region in the parietal cortex. Immediately rostral to S1 and caudal to the orbital fissure, we distinguished SR as a weakly stained region. SC exhibited moderate myelin staining, more intense than the one obtained in SR, but not as dark as S1.
Additional cortical architectonic subdivisions were evident in myelin-stained sections. Similar to S1, the primary visual area (V1), and the auditory cortex (A) were intensely stained for myelin (Figure 2A). In frontal cortex, a rounded and intensely myelinated region was usually identified, corresponding in location to area F4 (Ebner, 1978). The peristriate cortex (PS) in Didelphis aurita is located between V1 and the parietal cortex (Martinich et al., 2000). This region was less intensely stained than the adjoining areas V1 and SC (Figure 2A). In the peristriate cortex, irregularities of myelin staining (Figure 2A) seemed to occupy the same position as the cytochrome oxidase modules previously described in this species (Martinich et al., 1990).
Physiological Representation of the Forepaw in Area S1
The best stimuli for evoking responses from S1 consisted in either cutaneous stimulation or very light taps or squeezes (Figure 1). Receptive fields in the forepaw representation typically comprised single digit tips, whole digits, or palmar pads (Figures 2B,C – sites 1, 3, 4, 5, and 9). Some sites in S1 presented neurons that were responsive to more than one digit (Figure 3 – site d) or to more than one palmar pad (Figures 2B,C – site 2, and 10; Figure 3 – site 4). Occasionally, the receptive field included the whole digit and the adjacent palm pad (Figure 3 – site c; Figure 4 – sites 3, 4, 6, and 26). Most of the recording sites in the forepaw representation contained neurons responsive to stimulation of the glabrous forepaw. Sites with neurons responsive to the dorsal (hairy) forepaw were also identified (Figures 2B,C – sites 5–9, and 19).
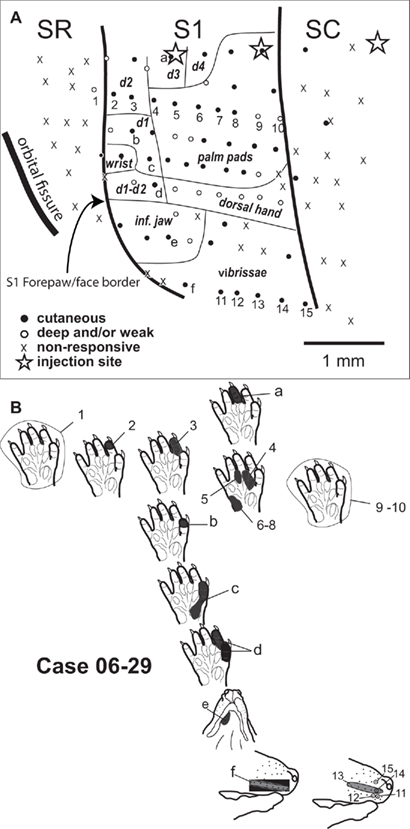
Figure 3. Topographic organization of the forepaw representation and part of the face representation in opossum area S1 (case 06-29). (A) Somatotopic map in S1. Transition to adjacent areas SR and SC at the same mediolateral level is characterized by a lack of responsiveness (x). Stars illustrate injection sites (see Table 1). (B) Receptive fields obtained in selected anterior to posterior rows of recording sites at a medial (numbers 1–10) and a lateral (numbers 11–15) position in S1, representing part of the forepaw and face representations, respectively. A medial to lateral row of sites (letters a to f) is also illustrated. The corresponding receptive fields are represented at their relative topographic position as the actual recording sites as shown in (A).
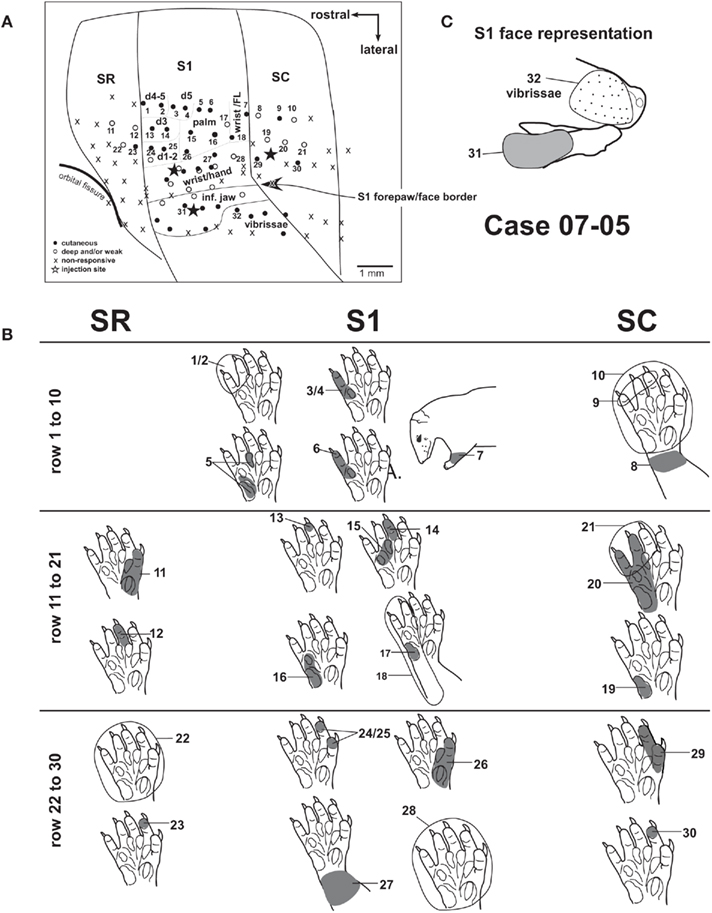
Figure 4. Progressions of recording sites from area SR to area SC (case 07-05). (A) Electrophysiological map. Each numbered recording site has its corresponding receptive field illustrated in (B,C). Three different rows of recording sites are represented. (B) Diagram illustrating the receptive fields from the three rows of recording sites depicted in (A). Receptive fields recorded in a given cortical area are aligned in the same column of the diagram. Multiunit receptive fields in SR and SC are usually mapped with deep stimulation and tend to be larger than those in S1. (C) Receptive fields recorded at the representation of the inferior jaw and lip. The representation of vibrissae is lateral and posterior to the representation of the inferior jaw (see also Figure 3). Corticocortical connections after anatomical tracer injections in this case [black stars in (A)] are shown in Figures 6A and 8.
In S1, digit tips were generally represented rostral to palm pads (Figures 2B,C – sites 1–4, and Figure 3 – sites 2–8). Additionally, distal palm pads, proximal palm pads, wrist, and forearm were represented in a rostral-to-caudal sequence (Figure 2C – sites 2–4; Figure 3 – sites 4–8; Figure 4 – sites 15–18 and 24–27). In S1, we also observed a medial to lateral topographic organization consisting in a progression from the ulnar forepaw, including digits 3–5, to digits 1 and 2 in the radial forepaw (Figure 3 – sites a, 3, b–d; Figure 4 – sites 3, 14, 25).
In some instances, despite closely spaced recording sites, we were not able to detect a precise topographic organization in S1 (e.g., Figure 4 – sites 3–6). Additionally, neurons responsive to the whole forepaw were usually found close to the border of the face representation (Figures 2B,C – sites 15–21) or next to the border with area SC (Figure 3 – sites 9, 10; Figure 4 – site 28).
The Face Representation in Area S1
We mapped part of the representation of the face in S1 in order to define the lateral border of the forepaw representation in S1. The transition from the representation of the forepaw to the representation of the face was sharp. Inferior jaw and chin were represented in the anterior portion of the face representation in S1 (Figure 2 – sites 24–27, and 31–34; Figure 3 – site e; Figure 4 – site 31). Progressing from the representation of the inferior jaw to more caudal and lateral portions of the face representation in S1, we found the representation of the vibrissae, including the lateral vibrissae (Figure 2 – site 28) and the vibrissae of the snout (Figure 2 – sites 29–30; Figure 3 – site f, 11–15; Figure 4 – site 32). In one case (06-29, Figure 3), we obtained receptive fields consisting of a single vibrissa, suggesting a fine topographic organization (Figure 3 – sites 11, 12, 14, 15). Ventral vibrissae located close to the lip were represented in more anterior parts of S1 than dorsal vibrissae (Figure 3 – sites 11–15). In some sites, neurons responsive to stimulation of multiple vibrissae were recorded (Figure 3 – site 13; Figure 4 – site 32).
Physiological Recordings in Areas SR and SC
Responses in areas SR and SC, when present, were generally evoked by deep stimulation, including limb movements. Full field visual stimulation did not elicit any clear response when tested under urethane anesthesia. Somatosensory receptive fields in areas SR and SC tended to be larger than those in S1. They generally encompassed the whole forepaw (Figure 2 – sites 12, 22; Figure 4 – sites 10, 22), forearm (Figure 2 – site 11), or multiple digits (Figure 4 – sites 9, 21). Sites with neurons displaying good responses to light cutaneous stimulation and relatively small receptive fields were sometimes recorded in SR (Figure 2 – site 13) and SC (Figure 4 – site 30).
In our experiments, neurons in area SC tended to be more responsive than neurons in SR. In case 07-05 (Figure 4), we obtained evidence for a crude topographic representation of the forepaw in SC that mirrored that of S1. Basically, the representation of the forearm and wrist was found close to the S1/SC border (Figure 2 – site 11, and Figure 4 – sites 7 and 8). A progression from the caudal border of S1 to the caudal border of SC revealed receptive fields that were progressively more distal in the forepaw (Figure 4 – sites 7–9, 18–21, and 28–30). Additionally, SC displayed a medial to lateral topographic organization similar to that of S1 in which digits 1 and 2 (i.e., the representation of the radial forepaw, Figure 4 – sites 29 and 30) were represented more laterally than digits 3, 4, and 5 (i.e., the representation of the ulnar forepaw, Figure 4 – sites 9, 19–21). We were not able to identify any topographic organization in area SR because most of the sites recorded in this area contained non-responsive neurons.
Cortical Connections of Opossum Parietal Cortex
Different fluorescent tracers were injected in areas S1 and SC resulting in injection cores that ranged from 0.02 to 1.35 mm2 (Table 1). Analysis of the sequence of tangential sections in all cases revealed that the core of each injection encompassed most of the cortical layers, without reaching the white matter. Injection sites and retrograde labeled cell bodies were identified (Figures 5 and 6) and represented in composite schematic drawings (Figures 6A, 7, and 8).
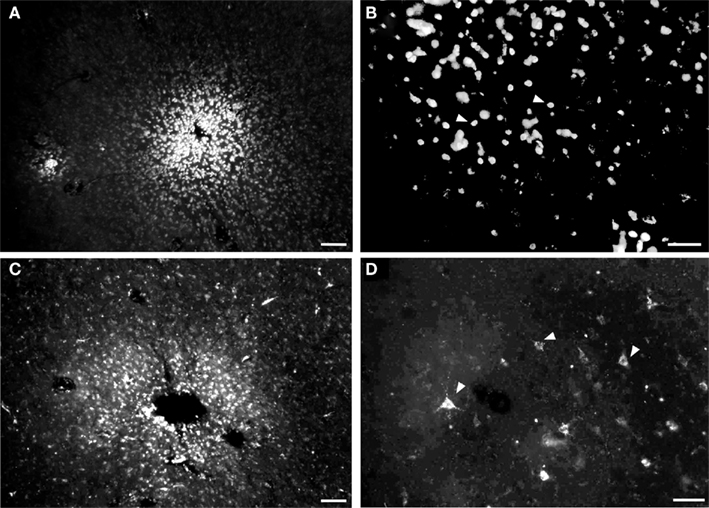
Figure 5. Photomicrographs of injection sites of fluorescent anatomical tracers and retrogradely labeled neurons in tangential cortical sections. (A) Site labeled after insertion of a small crystal of diamidine yellow (DY). (B) Cellular nuclei retrogradely labeled by DY. (C) Fluororuby injection site. (D) Neurons retrogradely labeled by fluororuby (white arrowheads show some examples) Calibration bars: (A,C) = 50 μm; (B,D) = 100 μm.
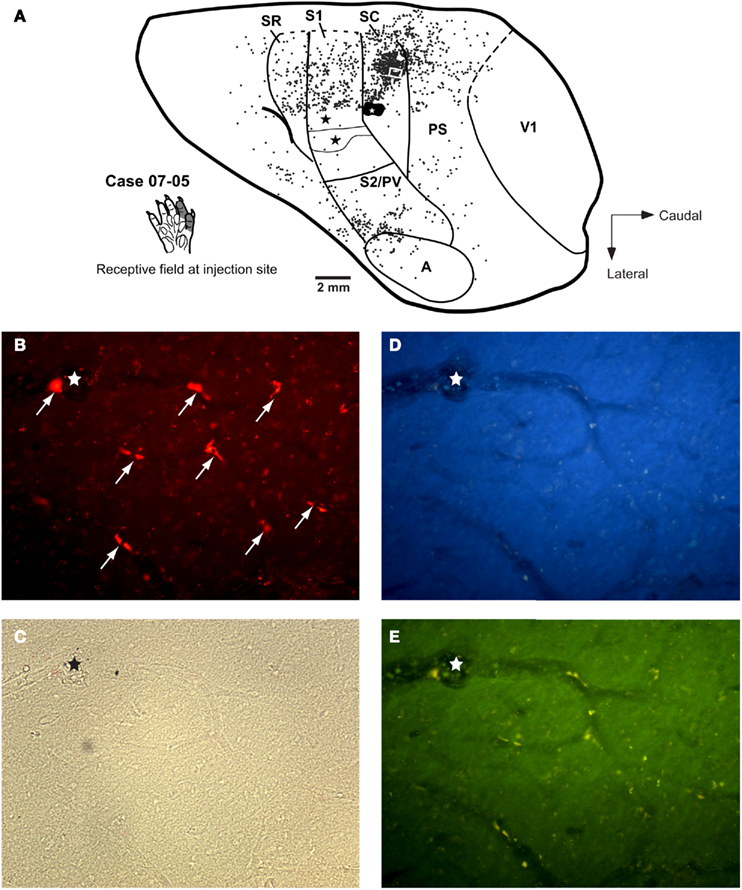
Figure 6. Case 07-05. Corticocortical and intrinsic connections after a small FR injection in area SC. (A) Injection in the representation of digits 1–2 in area SC. Labeled cells are more numerous at the medial half of area SC as compared to the lateral half. A similar bias can be observed in area S1 (corresponding to the forepaw representation, see also Figure 4) and in area SR. Concentration of labeled cells in S2/PV probably corresponds to homotopic corticocortical connections. Additional connections originate in peristriate cortex (PS), auditory cortex (A), and “insular” cortex (i.e., the region anterior to area S2/PV). Black stars depict the center of other injection sites; one of them is illustrated in Figure 8. The white square in SC depicts the region corresponding to the photomicrographs in parts (B) to (E). (B) Representative profiles of FR-labeled (intrinsic) neurons in area SC. White arrows point to retrogradely labeled cell bodies after tracer injection in SC. (C) to (D) Photomicrographs of the same region framed in (B) obtained with brightfield microscopy (C) or using different fluorescence filters: (D) filter for UV; (E) filter for fluorescein. The region of the histological section framed in these photomicrographs did not present any DY-labeled neuron (D), see also Figure 8. Although the FR-labeled neurons (B) could also be detected as yellowish contours under the fluorescein filter (E), the specificity of this label can be confirmed by the absence of any conspicuous label under the UV-filter (D) or using the brightfield (C). The stars in (B) to (E) depict the same blood vessel for reference.
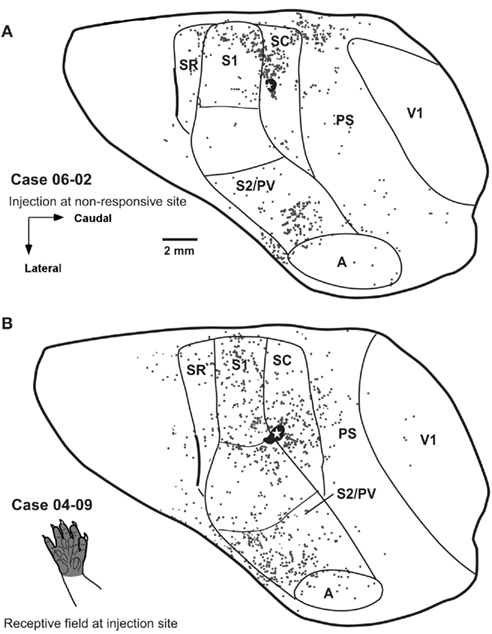
Figure 7. Distribution of retrogradely labeled cells after single FR injections in area SC in two additional cases. (A) In case 06-02 distribution of labeled cells is very similar to that observed in case 07-05 (Figure 6A). The injected region was not responsive to cutaneous stimulation. (B) In case 04-09 part of the injection core spread from the center of the injection to caudal S1, probably reaching the face representation. Spatial distribution of labeled cells looks different from that observed in cases 07-05 (Figure 6A) and 06-02 (A).
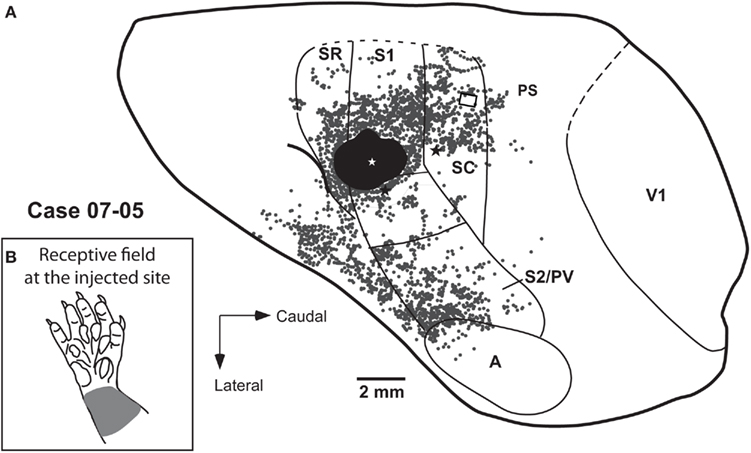
Figure 8. S1 corticocortical and intrinsic connections (case 07-05). (A) Projections were revealed after insertion of a small crystal of DY in the representation of the wrist in S1 (white star), resulting in a large tracer core that invaded part of the representation of the face in S1 and part of SR (black halo). Black stars depict the center of injection sites from which corticocortical connections are not illustrated. Corticocortical connections for the injection in SC are illustrated in Figure 6A. The small square in SC depicts the region photographed in Figure 6. (B) Multiunit receptive field at the injection site.
Cortical projections to area SC (cases 07-05, 06-02, 04-09)
We made three small injections of FR in area SC in three different cases (Figures 6 and 7). In two of them, the injection core was entirely contained within SC. In case 07-05, the anatomical tracer injection was placed in a site where neurons were responsive to somatosensory stimulation of the digits (Figure 6A). In case 06-02, the tracer was injected in a site containing non-responsive neurons but close to the representation of the forepaw in SC (Figures 2 and 7A). In a third SC injection (case 04-09), the tracer was placed in the representation of the glabrous forepaw, but a small part of the injection halo invaded area S1 (case 04-09; Figure 7B). In these three cases, the injection sites were typically at the same mediolateral level as the representation of the forepaw and forearm in S1 (see above), and the retrograde labeled cells were found dispersed mainly in ipsilateral somatosensory, auditory, and peristriate visual cortices (Figures 6 and 7).
All three cases revealed projections that originated in different somatosensory fields, including S1, SR, and S2/PV (Figures 6A and 7). Projections from S1 to SC were usually moderate, representing 16–35% of all retrogradely labeled cells sampled in our reconstructions (Table 2) and originated predominantly in the representation of the forepaw. Considering only labeled cells in S1, 97.28% of them originated from the forepaw representation in case 07-05; and 94.67% in case 06-02. Heterotopic projections from the face representation of S1 to SC were scarce. In case 04-09, we observed a relatively higher number of retrograde labeled cells in the face representation of S1 (41.67% of all labeled cells in S1). This was probably caused by tracer spreading from the injection site in SC to the face representation to S1 (Figure 7B).
The lateral parietal cortex was another source of projections to SC (representing 9.30% to 23.97% of all labeled cells, see Table 2). This region was previously identified as areas S2 and PV (Beck et al., 1996). Generally, labeled cells were concentrated in the anterior half of S2/PV (Figures 6A and 7B); suggesting that most of the projections from this region originated in area PV, since S2 is located posterior and medial to PV (Beck et al., 1996). Cortical ipsilateral projections from SR to SC ranged from 3.51 to 6.67% of all labeled cells (Table 2).
The most lateral and anterior part of opossum parietal cortex of has been identified as “insular cortex” (Ebner, 1978; Martinich et al., 2000). In our experiments, we observed that this region also projects to area SC (ranging from 3.52 to 7.54% of all labeled cells, Table 2). Additionally, in two cases, few labeled cells were located immediately rostral to the orbital fissure (case 07-05: 1.45%; case 04-09: 2.79% of all labeled cells), but no labeled cells were found close to the rostral pole of the frontal cortex in any of the three cases studied.
Anatomical tracer injections in area SC revealed substantial projections from peristriate visual cortex in at least two cases (case 07-05: 19.25%; case 06-02: 19.56%; case 04-09: 5.89% of all labeled cells). The peristriate cortex (PS) of the opossum is located caudal to area SC, and is composed of at least two different belt-like visual areas rostral to V1 (Martinich et al., 2000). Labeled cells were found along the mediolateral extension of PS, but in case 07-05 and 06-02, projections seemed to originate mainly in its medial half (Figures 6A and 7A). In V1, occasional labeled cells were observed (less than 1% of all labeled cells, Table 2). Finally, few projections arising from auditory cortex (A) were consistently observed in all three cases analyzed (from 2.79 to 2.96% of the total labeled cells).
SC intrinsic connections
Intrinsic projections in SC corresponded to 20–40% of all labeled cells (Table 2). In cases 06-02 and 07-05, anatomical tracer injections in the representation of forepaw resulted in a concentration of retrograde labeled cells in the medial half of area SC (Figures 6 and 7A). A more homogeneous distribution of labeled cells along the mediolateral extent of SC was obtained in case 04-09 (Figure 7B) where the injection core seemed to have invaded part of the face representation in S1.
Cortical projections to S1 (case 07-05)
In case 07-05, we inserted one small crystal of DY into the representation of the wrist in S1 (Figure 8). This injection produced a relatively large effective tracer core, which partially invaded the representation of face in S1 and a non-responsive zone in SR (Figure 8).
Most projections to the forepaw representation in this experiment originated in cortical areas that process somatosensory information, including SR, SC, S2/PV, and the “insular cortex” (a lightly myelinated region of the lateral parietal cortex located anterior to PV and caudal to F4; cf. Ebner, 1978; Martinich et al., 2000; Figure 8). We observed dense projections from area SC to the forepaw representation in area S1 (16.88% of all labeled cells). This projection was essentially homotopic, since most of the S1-projecting cells were located in the medial half of SC (Figure 8), where we recorded responses to digits, forepaw, and forearm (Figure 4).
In case 07-05, many DY-labeled cells were found in area SR (12.72% of all labeled cells), but it is conceivable that part of them corresponded to intrinsic connections, since a small part of the injection core invaded SR. Lateral to S1, projections from the S2/PV region were also found (Figure 8; 17.69% of the labeled cells). Most of this projection originated in the anterior part of S2/PV, suggesting that projections from PV to S1 were denser than those from S2 (see Beck et al., 1996).
Projections from the peristriate visual cortex to S1 were represented by few labeled cells (1.82% of total labeled cells), especially when compared to the small-sized injections made in area SC (see above). No labeled neuron was found in V1 or in frontal cortex (Figure 8). Projections from auditory cortex to S1 corresponded to only 2.76% of the all labeled cells.
S1 Intrinsic connections
In case 07-05, most of the intrinsic projections of the forepaw representation were located medial to the injection site, corresponding to the representation of the forepaw, and possibly to other body parts, such as the forearm and trunk (cf. Figures 4 and 8). Projections arising from the face representation were also present (8.32% of labeled cells in S1), but they were less numerous than the projections originated in the representation of the forepaw (91.68% of all labeled cells in S1). It is possible that some of the intrinsic projections from the face representation in S1 were due to the invasion of the tracer core into the face representation.
Discussion
A previous study of the cortex of Didelphis virginiana characterized five different somatosensory fields, areas S1, S2, PV, SR, and SC (Beck et al., 1996). Areas S1, S2, and PV displayed independent topographic representations of the contralateral half of the body identified in electrophysiological mapping experiments (Beck et al., 1996). Also, in previous studies using anesthetized preparations, there was no evidence for topographically organized maps in areas SR and SC because these cortical fields were unresponsive to sensory stimulation (Lende, 1963; Magalhaes-Castro and Saraiva, 1971; Pubols et al., 1976; Beck et al., 1996). Nevertheless, SR and SC could be identified based on their anatomical connections with S1 (Beck et al., 1996).
In the present investigation, we studied the organization of the representation of the forepaw in areas S1 of the Didelphis aurita, and the connections of SC with other cortical fields, using combined electrophysiological, anatomical tracing, and architectural analysis. At least three general important features of our data should be highlighted: (1) the topographic organization of the forepaw representation in area S1 was rather crude instead of regular and precise, with predominance of neurons responsive to cutaneous stimulation, but also displaying neurons responsive only to deep stimulation or that were not responsive at all; (2) area SC displayed a topographic organization that was mirror-reversed to that found in S1; (3) the pattern of connections to the forepaw representation in S1 was similar to that of SC, except for the fact that SC received additional projections from auditory and visual cortices. This suggests a role of SC in multimodal integration. A detailed discussion of these major findings and on the phylogenetic significance of the opossum area SC follows below.
Topographic Organization of Forepaw Representations in Area S1
For most mammals (see Johnson, 1990 for a comprehensive review) including opossum species of the genus Didelphis (Lende, 1963; Magalhaes-Castro and Saraiva, 1971; Pubols et al., 1976; Beck et al., 1996), representation of the contralateral half of the body in S1 cortex has an “upside-down” disposition in which the face is represented most laterally, followed by forelimb, trunk, and hindlimb, in a lateral to medial sequence. However, most of the previous S1 maps in the opossum do not provide detailed information about the internal organization of the forepaw representation (Lende, 1963; Magalhaes-Castro and Saraiva, 1971; Pubols et al., 1976; Beck et al., 1996). One exception is the study of Pubols et al. (1976) in which the authors state that the organization of the ventral forepaw is “extensive, orderly, and precise.” Although no individual cases are illustrated, the authors present a summary map of the representation of the forepaw. According to Pubols et al. (1976), ventral digits are represented anteriorly and palm pads posteriorly, in a regular topographical fashion in which digits 1–5 and its accompanying palm pads are regularly represented from lateral to medial in S1. This topographic arrangement is also shared by many other species, including the squirrel, tree shrews, and primates (Johnson, 1990).
Although our data confirmed this general topographic arrangement, our maps from individual cases indicated that the forepaw representation in S1 was not entirely regular and precise. Neurons in individual sites in S1 presented responses to digit tips, whole digits, individual palm pads, multiple digits, multiple pads, or even the whole forepaw. Eventually, these receptive fields were repeated along two or more sites in a row. Sites containing neurons responsive to the whole forepaw could be close to sites containing neurons responsive to discrete parts of the forepaw. We did not record neurons with receptive fields smaller than a whole palm pad, or representing intermediate or proximal phalanges. Furthermore, we detected some examples of actual lack of topographical order in sequences of closely spaced recording sites (e.g., sites 4–6 in case 07-05, Figure 4). It is important to note that Pubols et al. (1976) recorded under a different anesthetic protocol than the one we used and this may account for some of the differences with our mapping results depicted above.
Another consistent feature of S1 detected by our mapping experiments was the prevalence of many sites with neurons responsive to the whole forepaw which were characteristically located close to the border with the face representation in S1. Neurons in these sites were generally responsive to very light taps, but not to cutaneous stimulation. In S1 of other mammals, the border between the forepaw and face representations can be less responsive to cutaneous stimulation and can display different architectonic and connectional arrangements than the rest of area S1 (Krubitzer et al., 1986; Hayama and Ogawa, 1997; Jain et al., 1998, 2001; Fang et al., 2002; Kaas, 2004). In some rodent species, such as the squirrel and the rat, the hand–face border consists of dysgranular cortex instead of the usual granular cortex that comprises most of S1 (or area 3b). Typically, dysgranular cortex is less responsive to cutaneous stimulation than the granular cortex (Krubitzer et al., 1986). Similar to what has been described in rodents (Zilles and Wree, 1985; Krubitzer et al., 1986; Santiago et al., 2007), and also in primates (Fang et al., 2002), a region of dysgranular cortex interposing between the representation of the face and forepaw was detected in other marsupials as well (Elston and Manger, 1999; Huffman et al., 1999), but not in representatives of the genus Didelphis. Nevertheless, it is conceivable that these opossum species present a circuitry in the hand–face border that is differentiated from the rest of S1, thus resulting in neurons displaying attenuation of cutaneous responsiveness and larger receptive fields in anesthetized preparations.
The absence of neuronal responsiveness in some sites in S1 could, in principle, be due to anesthesia levels. Most of our mapping sessions were performed under urethane anesthesia, using the same protocol adopted by Beck et al. (1996). These authors do not report a significant number of sites with non-responsive neurons in S1, but their individual electrophysiological maps are less dense than ours. It is important to highlight that we only classified a site as “unresponsive” if we were able to record responses elsewhere under the same anesthetic conditions (i.e., during the same period of time in which no supplemental anesthetic doses were administered). This indicated that the absence of response was probably due to a local differential sensitivity to anesthetics and not to a generalized depression of cortical activity. The same reasoning applied to sites with non-responsive neurons in SC (see “Functional Organization of Area SC” below).
Cortical Projections to S1
S1 connections revealed in case 07-05 by the DY crystal inserted in the representation of the forepaw basically confirmed previous findings of Beck et al. (1996) after large WGA-HRP injections in the representation of the face in area S1 of the Didelphis virginiana. Although in our experiment the tracer was placed in a different sensory representation of S1, both studies agree in that: (1) intrinsic connections are distributed rather uniformly around the core of the injection sites; (2) SC and somatosensory cortical areas SR, S2, and PV are all connected to S1; (3) homotopic connections with other somatosensory areas seem to predominate over heterotopic connections; (4) connections to PV are more intense than those to S2. Denser connections between S1 and PV as compared to connections between S1 and S2 were also reported in other mammals like the brush-tailed possum (Elston and Manger, 1999), and the squirrel (Krubitzer et al., 1986).
Functional Organization of Area SC
In this study, evidence for topographic organization in the SC area of the opossum was provided for the first time. Receptive fields in anterior to posterior rows of sites reverted from the digit tips to palm pads and wrist in S1, back to pads and digit tips in SC. This indicates a representation of the body in SC that is mirror-imaged to that of S1. The medial to lateral extension of SC also seems to present a topographic organization parallel to that of S1. This is the kind of topography obtained in fields immediately caudal to S1 in rodents (Slutsky et al., 2000) or in anthropoid primates (Kaas, 1983, 2004). However, similar to the brush-tailed possum (Elston and Manger, 1999) and to the squirrel (Slutsky et al., 2000), and different from area 1 of anthropoid primates (Kaas, 2004), most sites in area SC of the Didelphis aurita contained neurons that were either responsive to deep stimulation or non-responsive at all.
Neurons in sites located at more lateral portions of SC were not responsive. This was the region where the representation of the face in SC was expected to be found. We do not believe that the absence of response to face stimulation in the lateral part of SC was due to technical issues like variation in anesthetic levels, since we were able to record from the forepaw representation under the same conditions in which the putative face representation was unresponsive (e.g., case 07-05, Figure 4). Nevertheless, it still needs to be elucidated whether opossum SC contains a complete representation of the contralateral body, similar to areas S1, S2, and PV.
Results of SC connectivity indicate that there is a representation of the face in the lateral part of SC. In cases 07-05 and 06-02, in which injection sites were restricted to the representation of the forepaw in SC, intrinsic connections were predominantly with the medial parts of SC where the forepaw is represented (Figures 6A and 7A). Additionally, projecting cells from S1 and S2/PV were concentrated in their respective forepaw representations, whereas the representation of the face in S1 and in S2/PV seemed to be devoid of labeled cells. This is different from what was obtained in case 04-09 where the SC injection site invaded a small part of the representation of the face in S1. In this case (04-09), many labeled cells were found in the lateral half of SC, and in the face representation of S1 and S2/PV (Figure 7B). These data would then implicate that SC intrinsic and corticocortical projections were predominantly homotopic.
Another possibility is that opossum SC would be a cortical field specialized in processing information from the forelimb only. This would have some interesting implications in terms of the evolutionary origin of parietal cortical fields. If SC has a complete representation of the body and is specialized in processing somatosensory information, then it would be homologous to caudal somatosensory fields of other species, like area PM in the squirrel or area 1 and 2 in most anthropoid primates. But, supposing that opossum SC is specialized in processing information from the forepaw and forelimb only, and taking into account that it receives visual information from occipital fields (see below), this would make SC homologous to PP cortical fields of higher mammals (corresponding to Brodmann’s areas 5 and 7) where somatosensory information is combined with visual inputs to provide a body-centered frame of coordinates used to guide hand and forelimb movements (see below).
Cortical Connections of SC: Functional and Phylogenetic Implications
One important original contribution of the present study was the characterization of the cortical projections to area SC (Figure 9). In our three cases, SC injections were made in the forepaw representation and revealed projections from all identified somatosensory fields including S1, SR, S2/PV, and the insular cortex that extends rostral to area PV. Quantification of retrogradely labeled neurons in cases 07-05 and 06-02 combined revealed that, apart from intrinsic connections (representing 32% of the labeled neurons), most of the ipsilateral corticocortical input to SC arises from S1, visual peristriate cortex (PS), and S2/PV, each region corresponding to about 20% of the projections to SC. Minor contributions arise from auditory cortex (3%) and the cortex anterior to the orbital sulcus (1%). This basically confirms data obtained by Beck et al. (1996) in which SC was identified as a somatosensory processing area based on its connections with S1. In addition, because our injections in SC revealed important projections from peristriate visual cortex, and weak but consistent projections from auditory cortex, we propose that SC is actually involved in multimodal sensory processing.
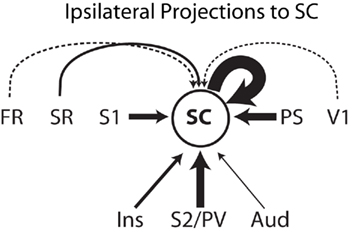
Figure 9. Schematics of the ipsilateral corticocortical inputs to area SC. Thickness of continuous arrows is proportional to the number of retrograde labeled neurons found after the anatomical tracer injection in area SC considering both cases 07-05 and 06-02 combined. The thickness of the two dashed arrows is not proportional to the number of labeled neurons, representing weak projections to SC (less than 2% of the labeled neurons each). Cortical projections to SC originate in somatosensory cortical areas SR, S1, and S2/PV. Projections from a region lateral and anterior to S2/PV identified as “insular cortex” are presumably somatosensory as well. SC receives a important visual projection from the peristriate cortex (PS), suggesting that SC is involved in multimodal processing. Weak connections to SC arise from auditory cortex (Aud), V1, and the cortex rostral to the orbital fissure (FR). See text for details.
The peristriate cortex (PS) of the Didelphis aurita opossum is located caudal to SC and anterior to the primary visual area (Sousa et al., 1978; Martinich et al., 2000). Based on architecture and connectional data, Martinich et al. (1990, 2000) demonstrated that the peristriate cortex in this species was constituted by two or more topographically organized visual areas. After our injections in the forepaw representation of SC, most of retrogradely labeled cells were located in the medial part of PS, which receives information from the lower visual field. This suggests that the medial PS projection to the forepaw representation in SC is relaying visual information about the forepaw and its immediate surroundings (Volchan et al., 2004). In SC this visual information can be integrated with somatosensory inputs from S1, S2/PV and other somatosensory fields, thus generating new information that can be used to guide visually oriented behaviors.
Similar projections from visual and anterior somatosensory cortical fields to a caudal somatosensory region were also identified in the brush-tailed possum by Elston and Manger (1999). In this Australian marsupial, two different fields were identified caudal to S1. First, there was a myelin sparse region, immediately caudal to and interdigitating S1 where neurons required stimulation of deep receptors in the periphery to elicit responses. Caudal to this region, Elston and Manger (1999) identified the PP cortex, located in-between somatosensory and visual peristriate (area 18) cortical fields. Similar to our results, tracer injections in both caudal fields of the brush-tailed possum revealed projections from all somatosensory cortical fields (including PP), and from the peristriate cortex (Elston and Manger, 1999). Different from our results, caudal somatosensory fields in the brush-tailed possum were devoid of projections from auditory cortex (Elston and Manger, 1999).
It is important to note that in our experiments many of the SC projecting neurons in auditory cortex were located in the anterior portion of this field where auditory cortex and area PV intermingles (Krubitzer et al., 1986; Beck et al., 1996). It is then feasible that these cells are rather relaying somatosensory information from the forepaw instead of sending actual auditory inputs. However, retrograde labeled cells in more caudal and lateral parts of the auditory field were also found. In this case, auditory information relayed to SC could be informing a system involved in generating a body-centered frame of reference to guide movements in space.
Finally, it is difficult to postulate whether the cortex immediately caudal to S1 in the opossum is composed of a single somatosensory area, area SC, or if there is an additional field, caudal to SC, the PP cortex, interposed between SC and the peristriate visual cortex. So far the attempts to record from the visual peristriate cortex in the opossum has failed, for only area V1 has been proved to be visually responsive in anesthetized preparations (Sousa et al., 1978; Martinich et al., 2000). Nevertheless, our connectional data indicate that the cortex immediately caudal to S1 receives projections from the peristriate cortex, suggesting a role in visual processing for this field. In addition, in the brush-tailed possum Elston and Manger (1999) were able to record visual responses in the cortex just caudal to S1. Altogether, these data suggest that in the opossum and, probably, in other marsupials as well, the cortex immediately caudal to S1 process information from somatosensory, visual, and possibly auditory information, being a multimodal field. This would support the notion that in smaller (and presumably more primitive) brains, cortex caudal to S1 would be homologous to the PP areas (areas 5 and 7) of higher mammals, and not to purely somatosensory fields, such as areas 1 and 2, that characterize the simian organization.
Conflict of Interest Statement
The authors declare that the research was conducted in the absence of any commercial or financial relationships that could be construed as a potential conflict of interest.
Acknowledgments
We would like to thank Dr. Jean-Christophe Houzel and Dr. Carlomagno Pacheco Bahia for help in some of our experiments, and to Mr. Luiz Salvador Bernardino for help in the histological processing. This work was supported by Fundação Carlos Chagas Filho de Amparo à Pesquisa do Estado do Rio de Janeiro – FAPERJ (Proc. no. E-26/170.818/2005 e E-26/110.360/2008), FAPERJ-Conselho Nacional de Desenvolvimento Científico e Tecnológico (CNPq) – Programa de Núcleos de Excelência (PRONEX) e Rede Instituto Brasileiro de Neurociência (IBN Net). This research is part of the Doctor in Science thesis of R. Anomal, supported by the Coordenação de Aperfeiçoamento de Pessoal de Nível Superior (CAPES) and developed as part of the Curso de Pós-Graduação em Ciências Biológicas (Fisiologia) of the Instituto de Biofísica Carlos Chagas Filho of the Universidade Federal do Rio de Janeiro – UFRJ. The authors would like to thank the Frontiers Research Foundation for granting the resources necessary for the publication of this manuscript.
References
Beck, P. D., Pospichal, M. W., and Kaas, J. H. (1996). Topography, architecture, and connections of somatosensory cortex in opossums: evidence for five somatosensory areas. J. Comp. Neurol. 366, 109–133.
Budinger, E., Heil, P., Hess, A., and Scheich, H. (2006). Multisensory processing via early cortical stages: connections of the primary auditory cortical field with other sensory systems. Neuroscience 143, 1065–1083.
Campi, K. L., Karlen, S. J., Bales, K. L., and Krubitzer, L. (2007). Organization of sensory neocortex in prairie voles (Microtus ochrogaster). J. Comp. Neurol. 502, 414–426.
Catania, K. C. (2007). “Organization of miniature cortex – what shrew brains suggest about mammalian evolution,” in Evolution of Nervous Systems. A Comprehensive Reference, Vol. 3, ed. J. H. Kaas (Amsterdam: Academic Press), 137–142.
Catania, K. C., Jain, N., Franca, J. G., Volchan, E., and Kaas, J. H. (2000). The organization of somatosensory cortex in the short-tailed opossum (Monodelphis domestica). Somatosens. Mot. Res. 17, 39–51.
Catania, K. C., Lyon, D. C., Mock, O. B., and Kaas, J. H. (1999). Cortical organization in shrews: evidence from five species. J. Comp. Neurol. 410, 55–72.
Cavada, C. (2001). The visual parietal areas in the macaque monkey: current structural knowledge and ignorance. Neuroimage 14, S21–S26.
Cerqueira, R. (1985). The distribution of Didelphis in South America (Polyprotodontia, Didelphidae). J. Biogeogr. 12, 135–145.
Cooke, D. F., and Graziano, M. S. (2003). Defensive movements evoked by air puff in monkeys. J. Neurophysiol. 90, 3317–3329.
Cooke, D. F., Taylor, C. S., Moore, T., and Graziano, M. S. (2003). Complex movements evoked by microstimulation of the ventral intraparietal area. Proc. Natl. Acad. Sci. U.S.A. 100, 6163–6168.
Ebner, F. F. (1978). “A proportional coordinate system for the localization of points and anatomical subdivisions in opossum neocortex: correlations of cytoarchitecture with thalamocortical projections,” in Opossum Neurobiology – The Opossum as an Experimental Model for the Study of the Mammalian Nervous System – a Symposium, eds C. E. Rocha-Miranda, and R. Lent (Rio de Janeiro: Academia Brasileira de Ciências), 67–90.
Elston, G. N., and Manger, P. R. (1999). The organization and connections of somatosensory cortex in the brush-tailed possum (Trichosurus vulpecula): evidence for multiple, topographically organized and interconnected representations in an Australian marsupial. Somatosens. Mot. Res. 16, 312–337.
Fang, P. C., Jain, N., and Kaas, J. H. (2002). Few intrinsic connections cross the hand-face border of area 3b of New World monkeys. J. Comp. Neurol. 454, 310–319.
Fogassi, L., and Luppino, G. (2005). Motor functions of the parietal lobe. Curr. Opin. Neurobiol. 15, 626–631.
Gallyas, F. (1979). Silver staining of myelin by means of physical development. Neurol. Res. 1, 203–209.
Gardner, A. L. (1973). The Systematics of the Genus Didelphis (Marsupialia: Didelphidae) in North and Middle America, Spec. Publ. Mus. Lubbock: Texas Tech University, 41–81.
Hayama, T., and Ogawa, H. (1997). Regional differences of callosal connections in the granular zones of the primary somatosensory cortex in rats. Brain Res. Bull. 43, 341–347.
Huffman, K. J., Nelson, J., Clarey, J., and Krubitzer, L. (1999). Organization of somatosensory cortex in three species of marsupials, Dasyurus hallucatus, Dactylopsila trivirgata, and Monodelphis domestica: neural correlates of morphological specializations. J. Comp. Neurol. 403, 5–32.
Jain, N., Catania, K. C., and Kaas, J. H. (1998). A histologically visible representation of the fingers and palm in primate area 3b and its immutability following long-term deafferentations. Cereb. Cortex 8, 227–236.
Jain, N., Qi, H.-X., Catania, K. C., and Kaas, J. H. (2001). Anatomic correlates of the face and oral cavity representations in the somatosensory cortical area 3b of monkeys. J. Comp. Neurol. 429, 455–468.
Jerison, H. J. (1990). “Fossil evidence on the evolution of the neocortex,” in Cerebral Cortex, vol. 8A: Comparative Structure and Evolution of Cerebral Cortex, Part I, eds E. G. Jones and A. Peters (New York: Plenum Press), 285–309.
Jerison, H. J. (2007). “What fossils tell us about the evolution of neocortex,” in Evolution of Nervous Systems. A Comprehensive Reference, Vol. 3, ed. J. H. Kaas (Amsterdam: Academic Press), 1–12.
Johnson, J. I. (1990). “Comparative development of somatic sensory cortex,” in Cerebral Cortex, Vol. 8B, Comparative Structure and Evolution of Cerebral Cortex, eds E. G. Jones and A. Peters (New York: Plenum Press), 335–449.
Kaas, J. H. (1983). What, if anything, is SI? Organization of first somatosensory area of cortex. Physiol. Rev. 63, 206–231.
Kaas, J. H. (2004). Evolution of somatosensory and motor cortex in primates. Anat. Rec. A Discov. Mol. Cell. Evol. Biol. 281, 1148–1156.
Kaas, J. H. (2008). The evolution of the complex sensory and motor systems of the human brain. Brain Res. Bull. 75, 384–390.
Kaas, J. H. (2011). Reconstructing the areal organization of the neocortex of the first mammals. Brain Behav. Evol. doi: 10.1159/000327316. [Published online].
Karlen, S. J., and Krubitzer, L. (2007). The functional and anatomical organization of marsupial neocortex: evidence for parallel evolution across mammals. Prog. Neurobiol. 82, 122–141.
Krubitzer, L., and Huffman, K. J. (2000). Arealization of the neocortex in mammals: genetic and epigenetic contributions to the phenotype. Brain Behav. Evol. 55, 322–336.
Krubitzer, L., and Hunt, D. M. (2007). “Captured in the net of space and time: understanding cortical field evolution,” in The Evolution of Nervous Systems in Mammals, Vol. IV, eds L. Krubitzer and J. H. Kaas (Oxford: Academic Press), 49–72.
Krubitzer, L., Kunzle, H., and Kaas, J. (1997). Organization of sensory cortex in a Madagascan insectivore, the tenrec (Echinops telfairi). J. Comp. Neurol. 379, 399–414.
Krubitzer, L. A., Sesma, M. A., and Kaas, J. H. (1986). Microelectrode maps, myeloarchitecture, and cortical connections of three somatotopically organized representations of the body surface in the parietal cortex of squirrels. J. Comp. Neurol. 250, 403–430.
Lende, R. A. (1963). Sensory representation in the cerebral cortex of the opossum (Didelphis virginiana). J. Comp. Neurol. 121, 395–403.
Magalhaes-Castro, B., and Saraiva, P. E. S. (1971). Sensory and motor representation in the cerebral cortex of the marsupial Didelphis azarae azarae. Brain Res. 34, 291–299.
Martinich, S., Pontes, M. N., and Rocha-Miranda, C. E. (2000). Patterns of corticocortical, corticotectal, and commissural connections in the opossum visual cortex. J. Comp. Neurol. 416, 224–244.
Martinich, S., Rosa, M. G. P., and Rocha-Miranda, C. E. (1990). Patterns of cytochrome oxidase activity in the visual cortex of a South American opossum (Didelphis marsupialis aurita). Braz. J. Med. Biol. Res. 23, 883–887.
Matelli, M., and Luppino, G. (2001). Parietofrontal circuits for action and space perception in the macaque monkey. Neuroimage 14, S27–S32.
Padberg, J., Disbrow, E., and Krubitzer, L. (2005). The organization and connections of anterior and posterior parietal cortex in titi monkeys: do New World monkeys have an area 2? Cereb. Cortex 15, 1938–1963.
Padberg, J., Franca, J. G., Cooke, D. F., Soares, J. G., Rosa, M. G., Fiorani, M. Jr., Gattass, R., and Krubitzer, L. (2007). Parallel evolution of cortical areas involved in skilled hand use. J. Neurosci. 27, 10106–10115.
Padberg, J., and Krubitzer, L. (2006). Thalamocortical connections of anterior and posterior parietal cortical areas in New World titi monkeys. J. Comp. Neurol. 497, 416–435.
Pubols, B. H., Pubols, L. M., DiPette, D. J., and Sheely, J. C. (1976). Opossum somatic sensory cortex: a microelectrode mapping study. J. Comp. Neurol. 165, 229–246.
Rocha-Miranda, C. E., and Lent, R. (1978). Opossum Neurobiology, 1st Edn. Rio de Janeiro: Academia Brasileira de Ciências, 1–291.
Santiago, L. F., Rocha, E. G., Freire, M. A., Dias, I. A., Lent, R., Houzel, J. C., Picanco-Diniz, C. W., Pereira, A. Jr., and Franca, J. G. (2007). The organizational variability of the rodent somatosensory cortex. Rev. Neurosci. 18, 283–294.
Slutsky, D. A., Manger, P. R., and Krubitzer, L. (2000). Multiple somatosensory areas in the anterior parietal cortex of the California ground squirrel (Spermophilus beecheyi). J. Comp. Neurol. 416, 521–539.
Sousa, A. P. B., Gattass, R., and Oswaldo-Cruz, E. (1978). The projection of the opossum’s visual field on the cerebral cortex. J. Comp. Neurol. 177, 569–588.
Stepniewska, I., Fang, P. C., and Kaas, J. H. (2005). Microstimulation reveals specialized subregions for different complex movements in posterior parietal cortex of prosimian galagos. Proc. Natl. Acad. Sci. U.S.A. 102, 4878–4883.
Stepniewska, I., Fang, P. C., and Kaas, J. H. (2009). Organization of the posterior parietal cortex in galagos: I. Functional zones identified by microstimulation. J. Comp. Neurol. 517, 765–782.
Volchan, E., Vargas, C. D., Franca, J. G., Pereira, A. Jr., and Rocha-Miranda, C. E. (2004). Tooled for the task: vision in the opossum. Bioscience 54, 189–194.
Wallace, M. T., Ramachandran, R., and Stein, B. E. (2004). A revised view of sensory cortical parcellation. Proc. Natl. Acad. Sci. U.S.A. 101, 2167–2162.
Weller, W. L. (1972). Barrels in somatic sensory neocortex of the marsupial Trichosurus vulpecula (brush-tailed possum). Brain Res. 43, 11–24.
Keywords: somatosensory cortex, brain evolution, cortical maps, marsupial
Citation: Anomal RF, Rocha-Rego V and Franca JG (2011) Topographic organization and corticocortical connections of the forepaw representation in areas S1 and SC of the opossum: evidence for a possible role of area SC in multimodal processing. Front. Neuroanat. 5:56. doi: 10.3389/fnana.2011.00056
Received: 23 May 2011;
Accepted: 10 August 2011;
Published online: 03 October 2011.
Edited by:
Kathleen S. Rockland, Massachusetts Institute of Technology, USAReviewed by:
Kathleen S. Rockland, Massachusetts Institute of Technology, USADavid C. Lyon, University of California, USA
Copyright: © 2011 Anomal, Rocha-Rego and Franca. This is an open-access article subject to a non-exclusive license between the authors and Frontiers Media SA, which permits use, distribution and reproduction in other forums, provided the original authors and source are credited and other Frontiers conditions are complied with.
*Correspondence: João G. Franca, Instituto de Biofísica Carlos Chagas Filho, Universidade Federal do Rio de Janeiro, CCS, Bloco G, Sala G2-025, Ilha do Fundão, 21941-902 Rio de Janeiro, Brazil. e-mail:amdmcmFuY2FAYmlvZi51ZnJqLmJy