

- Department of Biology, Brandeis University, Waltham, MA, USA
Previous research has suggested that the three physiologically defined relay cell-types in mammalian lateral geniculate nucleus (LGN)—called parvocellular (P), magnocellular (M), and koniocellular (K) cells in primates and X, Y, and W cells in other mammals—each express a unique combination of cell-type marker proteins. However, some of the relationships among physiological classification and protein expression found in primates, prosimians, and tree shrews do not apply to carnivores and murid rodents. It remains unknown whether these are exceptions to a common rule for all mammals, or whether these relationships vary over a wide range of species. To address this question, we examined protein expression in the gray squirrel (Sciurus carolinensis), a highly visual rodent. Unlike many rodents, squirrel LGN is well laminated, and the organization of X-like, Y-like, and W-like cells relative to the LGN layers has been characterized physiologically. We labeled tissue sections through visual thalamus with antibodies to calbindin and parvalbumin, the antibody Cat-301, and the lectin WFA. Calbindin expression was found in W-like cells in LGN layer 3, just adjacent to the optic tract. These results suggest that calbindin is a common marker for the konicellular pathway in mammals. However, while parvalbumin expression characterizes P and M cells in primates and X and Y cells in tree shrews, here it identifies only about half of the X-like cells in LGN layers 1 and 2. Putative Y/M cell markers did not differentiate relay cells in this animal. Together, these results suggest that protein expression patterns among LGN relay cell classes are variable across mammals.
Introduction
In all mammals, the lateral geniculate nucleus (LGN) receives direct input from retinal ganglion cells and relays those signals to primary visual cortex (V1). Anatomical and physiological studies have identified three classes of relay cells in several species, called parvocellular (P), magnocellular (M), and koniocellular (K) cells in primates (Kaas et al., 1978; Irvin et al., 1986), and X, Y, and W cells in other mammals (Enroth-Cugell and Robson, 1966; Stone and Fukuda, 1974; Stone, 1983; Holdefer and Norton, 1995; Van Hooser et al., 2003).
Previous studies have found that these three LGN cell classes exhibit common patterns of protein expression. In primates and the tree shrew, K/W cells express the calcium-binding protein calbindin (Jones and Hendry, 1989; Diamond et al., 1993; Johnson and Casagrande, 1995), while P and M cells (in primates) and X and Y cells (in tree shrew) express the calcium-binding protein parvalbumin (Jones and Hendry, 1989; Johnson and Casagrande, 1995). In addition, cat Y cells possess a non-phosphorylated epitope of the protein neurofilament H that is recognized by the antibody SMI-32 (Bickford et al., 1998). SMI-32 labels M cells more strongly than P cells in old world and new world primates (Gutierrez et al., 1995; Bickford et al., 1998; Soares et al., 2008), and both cat Y and monkey M cells are stained by Wisteria floribunda agglutinin (WFA), a plant lectin that targets chondroitin sulfate proteoglycans (CSPGs) (Preuss et al., 1998; Gray et al., 1999; Bickford et al., 2008). These results raise the possibility that there may be a typical mammalian plan for LGN cell protein expression: K/W cells express calbindin, P/M/X/Y cells express parvalbumin, and M/Y cells express targets of SMI-32 and WFA.
However, LGN protein expression patterns in some species differ from this putative framework. In cat, only GABAergic interneurons express parvalbumin (Demeulemeester et al., 1991), and parvalbumin expression is not found at all in rat and mouse LGN (Celio, 1990; Arai et al., 1994; Okoyama and Moriizumi, 2001; Grubb and Thompson, 2004). Cat Y cells express a non-glycosylated epitope on the CSPG aggrecan that is labeled by the antibody Cat-301 (Hockfield and Sur, 1990). Cat-301 also labels M cells more strongly than P cells in old world monkeys (Hendry et al., 1984), but Cat-301 staining is absent in new world monkeys and murid rodents (Hendry et al., 1988; Preuss et al., 1998; Gray et al., 1999). It is unclear if these cross species differences in LGN cell protein expression represent special cases that deviate from a typical mammalian pattern, or if LGN cell protein expression is simply highly variable.
To gain further insight into protein expression patterns in LGN neuron classes across species, we examined protein expression in LGN of a highly visual arboreal rodent, the gray squirrel. Among rodents, the squirrel is especially well suited to shed light on protein expression patterns of the three principle visual processing streams. Unlike LGN in murid rodents, squirrel LGN is organized into five well-defined layers, labeled 1, 2, 3a, 3b, and 3c (Kaas et al., 1972; Robson and Hall, 1976). In addition, the laminar organization of the three major LGN cell classes has been characterized physiologically: X-like cells are found in layers 1 and 2, while Y-like and W-like cells are found in layers 3abc (Van Hooser et al., 2003).
We observed calbindin expression in relay cells in layers 3abc but not in layers 1 and 2. This result is consistent with the idea that calbindin is a marker for W/K cells in most if not all mammals. Parvalbumin expression was strongest in layers 1 and 2 and was also found in layers 3abc; however, only about half of cells in these layers exhibited parvalbumin expression. Several additional proteins that are found only in specific neurons or layers in the LGN of other mammals were not present in squirrel or did not show differences across layers. Cat-301 staining was absent in squirrel LGN, and while WFA and SMI-32 labeling was present, it did not vary across the LGN layers. Our results suggest that, with the exception of calbindin, protein expression varies considerably across LGN cell classes from different mammalian species.
Materials and Methods
Animals
Seven adult gray squirrels (Sciurus carolinensis), of both sexes, were trapped locally. After spraying to remove fleas and ticks (Adams Flea and Tick Mist, Memphis, TN), the animals were housed with food and water up to one week before tissue collection. Six of the animals were first used for in vivo electrophysiological recordings (Heimel et al., 2005; Van Hooser et al., 2005) or given retrograde tracer injections for a separate study, described previously (Van Hooser et al., 2006). All procedures were approved by the animal care and use committee at Brandeis University.
Retrograde Tracer Injections
A 1.5×1.5 mm craniotomy was made over the monocular region of V1, at locations 3–5 mm lateral from the midline and 6–12 mm posterior from bregma. Glass pipettes filled with 1–2 μL of red latex microspheres (LumaFluor, Naples, FL) were inserted into the brain through the intact dura to depths ranging from 400–1400 μm, and 0.2–0.5 μL was pressure-injected by a PicoSpritzer II (General Valve, Fairfield, NJ). Pipettes were kept in place for 10 min and then removed. The skin was sutured and the animal was allowed to recover on a heated blanket. A complete analysis of data from these cortical injections has been performed for a separate study by Van Hooser et al. (2006), and three representative cortical injections are shown in Figures 1 and 3 of that report.
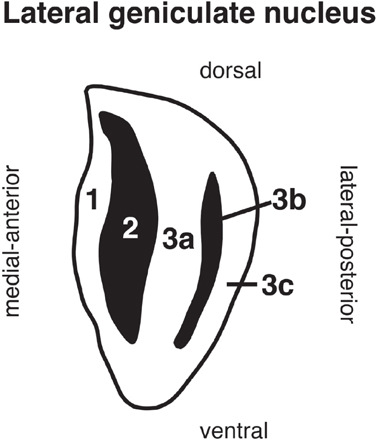
Figure 1. The arrangement of the five layers of the lateral geniculate nucleus in gray squirrel. Layers 1, 3a, and 3c receive input from the contralateral retina (white area) and layers 2 and 3b receive input from the ipsilateral retina (black area). The plane of section extends from medial-anterior to lateral-posterior through the nucleus (oblique orientation).
Tissue Preparation
After 1–2 days of survival post-injection or at the conclusion of an electrophysiology experiment, the animal was given a large dose of ketamine/acepromazine maleate or sodium thiopental and transcardially perfused with 0.1 M phosphate buffer (PB) or 0.9% saline, followed by 4% paraformaldehyde in 0.1 M PB. After its removal, the brain was stored in 4% paraformaldehyde in 0.1 M PB at 4°C.
In animals used for electrophysiology, only brain regions not involved in the recordings were selected. Each hemisphere was transferred to 30% sucrose in 0.1 M PB at 4°C and allowed to sink completely, blocked in 4% agar and cut into 3–5 mm blocks in the coronal plane. After removal of the hardened agar, the blocks were covered with TissueTek OTC compound (Sakura, Torrance, CA) and flash frozen in a slurry of dry ice and isopentane (−20°C) for 30–60 s.
Serial 30–50 μm-thick coronal sections were cut on a Leica CM3050 cryostat (Leica, Nussloch, Germany) and transferred to either 0.1 M PB for immunohistochemistry or 0.1 M Tris-buffered saline (TBS; pH 7.3) for lectin histochemistry.
Immunohistochemistry
At 40 μm-thick for chromogenic visualization and 30 μm-thick for fluorescence visualization, sets of adjacent sections were probed for parvalbumin, calbindin, and Cat-301 immunoreactivity. At regular intervals through the brain, sections were analyzed for cytoarchitecture—in single-labeling experiments every fourth section was mounted for later Nissl staining, and in fluorescence double-labeling experiments every third section was processed with mouse anti-neuronal-specific nuclear protein (NeuN; clone A60; MAB377, Chemicon International, Temecula, CA; prepared against purified cell nuclei from mouse brain).
Floating sections were first washed three times in 0.1 M PB. Permeabilization of the parvalbumin and calbindin sections was accomplished by incubation in 0.26% Trypsin in 0.1 M PB for 10 min at 37.5°C, followed by three additional rinses in 0.1 M PB. Endogenous peroxidase was quenched in the parvalbumin and calbindin sections with a solution of 1% hydrogen peroxide and 10% methanol in 0.1 M PB for 5 min, and in the Cat-301 sections with 1% hydrogen peroxide in 0.1 M PB for 5 min. After three rinses in 0.1 M PB, non-specific secondary antibody binding to the parvalbumin and calbindin sections was blocked with a solution of 10% normal goat serum (NGS; normal serum from the same species in which the secondary antibody was raised) in 0.1 M PB for 1 h; the solution for the Cat-301 sections also included 0.1% Triton X-100 for permeabilization. Triton X-100 was not applied to the parvalbumin and calbindin sections in these experiments because these sections were already well-permeabilized by the initial Trypsin incubation.
Sections were next incubated with primary antibody. Mouse anti-calbindin-D28K monoclonal IgG1 antibody (clone CL-300; ab9481, Abcam, Cambridge, MA; raised against purified Calbindin-D28K from chicken gut) was used at a dilution of 1:500, mouse anti-parvalbumin monoclonal IgG1 antibody (MAB1572, Chemicon International, Temecula, CA; lot 24040065; raised against parvalbumin purified from frog muscle; antibody is directed against an epitope at the first calcium-binding site and specifically stains the calcium-bound form of parvalbumin) was used at a dilution of 1:1000 (Diamond et al., 1993), and rabbit anti-parvalbumin polyclonal antibody (AB9312, Chemicon International, Temecula, CA; lot 0512016903; raised against rat muscle parvalbumin; antibody recognizes the calcium-bound and calcium-free forms of parvalbumin) was diluted to 1:500 with anti-calbindin in double-labeling experiments. For these primary antibodies dilutions were in 1% NGS in 0.1 M PB, for overnight incubation at 4°C. The same incubation conditions also applied to anti-NeuN sections, where the primary antibody dilution was 1:2000. Mouse anti-CSPG (brain) core protein monoclonal IgG1 antibody (clone Cat-301; MAB5284, Chemicon International, Temecula, CA; lot numbers 24070031, 24020644, 23040365; raised against fixed feline spinal cord gray matter) was used at a dilution of 1:3300, with 1% NGS and 0.1% Triton X-100 in 0.1 M PB for overnight incubation at 4°C.
After 3–6 rinses in 0.1 M PB, sections were transferred to incubation in a biotinylated secondary antibody, a fluorophore-conjugated secondary antibody, or a pair of fluorophore-conjugated secondary antibodies in 0.1 M PB for 1–2 h at room temperature. In single-immunolabeling experiments, biotinylated goat anti-mouse IgG (H + L chains; BA-9200, Vector Laboratories, Burlingame, CA) was diluted to 1:50 for calbindin and parvalbumin sections and to 1:1000 with 0.1% Triton X-100 for Cat-301 sections. For fluorescence double-labeling with the red retrograde tracer and either mouse anti-calbindin or mouse anti-parvalbumin, AlexaFluor488 goat anti-mouse IgG (H + L chains; A-11001, Invitrogen Corporation, Carlsbad, CA) was used at a 1:250 dilution with 5% NGS. The secondary antibody solution for fluorescence double-immunolabeling for calbindin and parvalbumin also included Texas Red goat anti-rabbit IgG (H + L chains; T-2767, Invitrogen Corporation, Carlsbad, CA) at a dilution of 1:1000. NeuN sections were incubated in a 1:400 dilution of AlexaFluor488 goat anti-mouse with 5% NGS.
All sections were then rinsed six times in 0.1 M PB, and those with fluorophore-conjugated secondary antibodies were mounted on glass slides and coverslipped with Fluoromount-G (0100–01, Southern Biotechnology Associates, Birmingham, AL) mounting medium. Sections with biotinylated secondary antibodies were further incubated in avidin: biotinylated peroxidase complex (ABC; VECTASTAIN Elite ABC Kit (Standard), PK-6100, Vector Laboratories, Burlingame, CA) for 90 min, and after thorough rinsing, in hydrogen peroxide and 3,3′-diaminobenizidine (DAB; DAB Substrate Kit, SK-4100, Vector Laboratories, Burlingame, CA) for 5 min. Reagents in the ABC and DAB solutions were used at the concentrations specified by the manufacturer. After rinsing in double-distilled water, the sections were mounted on slides and coverslipped with Fluoromount-G.
Antibody Characterization
We have chosen these primary antibodies from these manufacturers because they identify specific subclasses of neurons in a variety of other species. These calbindin, parvalbumin, and Cat-301 antibodies, from the same manufacturers, have been used in numerous comparative studies in LGN in carnivores, primates, rodents, and tree shrews, with specific studies cited in the discussion. The specificity of calbindin immunolabeling is supported by the close similarity between the pattern of neuroanatomical localization observed in our experiments and that described in preliminary experiments reported by Rodman and colleagues (Rodman and Dieguez, 2003). The specificity of parvalbumin immunolabeling, with both the mouse monoclonal and rabbit polyclonal antibodies, is demonstrated by the complete overlap between their immunofluorescence signals when these two primary antisera are used in double-labeling experiments and visualized with secondary antibodies that have separate excitation and emission spectra (data not shown).
SMI-32 Immunohistochemistry
Data on SMI-32 immunohistochemistry was obtained from sections processed by the Kaas Laboratory at Vanderbilt University, for a separate study reported elsewhere (Wong and Kaas, 2008), and kindly provided for us to examine. Briefly, animals were transcardially perfused first with 0.9% saline, then with 4% paraformaldehyde in 0.1 M PB, and finally with 4% paraformaldehyde and 10% sucrose in 0.1 M PB. After cryoprotection in 30% sucrose, 40 μm-thick sections were cut on a freezing microtome. Immunohistochemical processing began with blocking for 1 h in a solution of 5% normal horse serum and 0.5% Triton X-100 in 0.1 M PB (pH 7.2), at room temperature. Sections were then transferred to incubation in mouse anti-SMI-32 monoclonal antibody (Covance, Princeton, NJ; specific to a non-phosphorylated epitope on 200kDa Neurofilament-H), diluted 1:2000 in the blocking solution above, for 40–48 h at 4°C. Following rinses, sections entered secondary antibody incubation with biotinylated horse anti-mouse IgG, diluted 1:90 in the same blocker solution, for 90 min at room temperature. After a subsequent 90 min incubation in ABC solution, also a room temperature, visualization of SMI-32 immunoreactivity was achieved with the diaminobenzidine reaction, with 0.03% nickel ammonium sulfate.
Lectin Histochemistry
Lectin histochemistry was based on the methods of Preuss et al. (1998). 50 μm-thick sections were assayed for binding of WFA, a plant lectin, and alternate 50 μm-thick sections were mounted for later Nissl staining. The floating sections were washed three times in 0.1 M TBS (pH 7.3) and then incubated in a solution of 0.1% hydrogen peroxide, 2% bovine serum albumin, and 0.3% Triton X-100 in 0.1 M TBS for 30 min to quench endogenous peroxidase and block non-specific binding. Sections were immediately transferred to an incubation in 0.002% biotinylated-WFA (L1766, Sigma Chemical Co., St. Louis, MO) and 1% bovine serum albumin in 0.1 M TBS for 48 h at 4°C. The sections were rinsed three times in 0.1 M TBS and then incubated in ABC for 90 min. Following three rinses in 0.1 M TBS, the sections were moved to DAB for visualization. After three additional rinses in 0.1 M TBS, the sections were mounted on glass slides and coverslipped with Fluoromount-G.
Histology
Sections mounted for Nissl staining were dried overnight in a 55°C oven. Sections were then run through a dehydration sequence of 25, 50, 75, 95, 100, and 100% ethanol for 15 min each, 2 xylenes washes for 15 min each to remove the ethanol, and a rehydration sequence of 100, 100, 95, 70, 50, and 0% ethanol for 15 min each. Next, sections were stained with cresyl violet for 40 min, followed by color differentiation in 70% ethanol for 15–30 s, xylenes for 1 min, and coverslipping with DPX mounting medium (44581, Fluka BioChemika, Buchs, Switzerland).
Data from Images
Quantification of double-labeling patterns began with fluorescence signal detection and recording on a Leica TCS SP2 confocal scanning microscope (Leica Microsystems GmbH, Wetzlar, Germany). At 10X magnification, four line scans were averaged to record the red and green fluorescent channels into z-stacks of optical sections through the tissue, with ∼2.5 μm between each section in the stack. Maximum projections of the z-stacks were compiled in GIMP (GNU Image Manipulation Program). For double-labeling experiments with the red retrograde tracer, both channels' maximum projection images only included z-sections from positions in the stack where strong anti-calbindin or anti-parvalbumin signal was detectable. For double-labeling between anti-calbindin and anti-parvalbumin, the entire z-stack was compiled into the maximum projection image.
Overlap between the red and green channels was evaluated using the maximum projection images. An overlay between the red and green maximum projections was created in Adobe Illustrator (Adobe Systems Incorporated, San Jose, CA) and populations of single- and double-labeled cells were marked and counted. Double-labeling was confirmed by examining co-localization patterns in pairs of red and green fluorescent z-sections from identical positions in the respective stacks. To determine what percentage of projection neurons were immunoreactive for either calbindin or parvalbumin in each LGN layer, tracer-positive neurons in that layer were marked and immunopositive cells within that population were then identified. For a given LGN layer, sections throughout the extent of LGN were examined to identify those that contained retrogradely labeled relay cells, and all confocal z-sections containing a tracer-positive neuron were included in the image stack for analysis. Because the cortical injections of latex microspheres were performed at a single location on the cortical surface, we expected to label only those relay cells that projected to this single cortical location. As expected, the population of retrogradely labeled neurons formed a well-defined cluster in each of the layers examined. To assess overlap between calbindin and parvalbumin immunoreactivity, all members of both populations were marked and the number of double-labeled cells was expressed as a percentage of all immunoreactive cells.
Results
Our objective was to compare the localization of cells positive for each of several putative cell-type markers across the five laminae of the squirrel's LGN. As seen in Figure 1, layers 1, 2, 3a, 3b, and 3c are arranged in rostromedial to caudolateral order through the nucleus, with layer 1 at the rostromedial pole of the LGN and layer 3c at the caudolateral pole. Inputs from ipsilateral and contralateral retinal ganglion cells alternate between layers, such that layers 1, 3a, and 3c receive innervation from the contralateral retina and layers 2 and 3b receive innervation from the ipsilateral retina. As in other mammals, the left and right LGN convey information from their respective contralateral visual hemifields; the binocular region of both hemifields is 30° in squirrel (Kaas et al., 1972).
We labeled sections of gray squirrel thalamus and cortex with antibodies against two calcium-binding proteins, calbindin and parvalbumin, and one CSPG of the extracellular matrix, aggrecan, at the Cat-301–specific epitope on its polypeptide core (Matthews et al., 2002). We also used a plant lectin, WFA, to target the amino sugar N-acetylgalactosamine, one component of the disaccharide repeat that forms the characteristic chondroitin sulfate glycosaminoglycan (GAG) chains of all CSPGs. Peiyan Wong and Jon Kaas provided sections labeled with the antibody SMI-32, which is specific for a non-phosphorylated epitope on Neurofilament H. In some brains we labeled geniculocortical projection neurons with retrograde tracer injections into V1.
Calcium-Binding Proteins: Calbindin and Parvalbumin
These target proteins demonstrate a distinct neuroanatomical compartmentalization across LGN layers 1, 2, and 3. Figure 2A shows a coronal section through the LGN that is Nissl-stained to reveal all cell bodies and their laminar organization (Kaas et al., 1972). A comparison between this cytoarchitecture and Figure 2B indicates that the single, discreet band of calbindin immunoreactivity along the lateral border of the LGN, adjacent to the optic tract, maps onto layer 3 while the central and medial regions of the LGN that almost entirely lack calbindin immunoreactivity are layers 2 and 1, respectively. In Figures 2D1–2, high-magnification images of layers 1, 2, and 3 from the section in Figure 2B confirm that anti-calbindin labels a relatively uniform population of cells, as well as the neuropil, in layer 3 (Figure 2D3). These images also confirm almost a complete absence of anti-calbindin binding in layer 1 (Figure 2D1) and layer 2 (Figure 2D2).
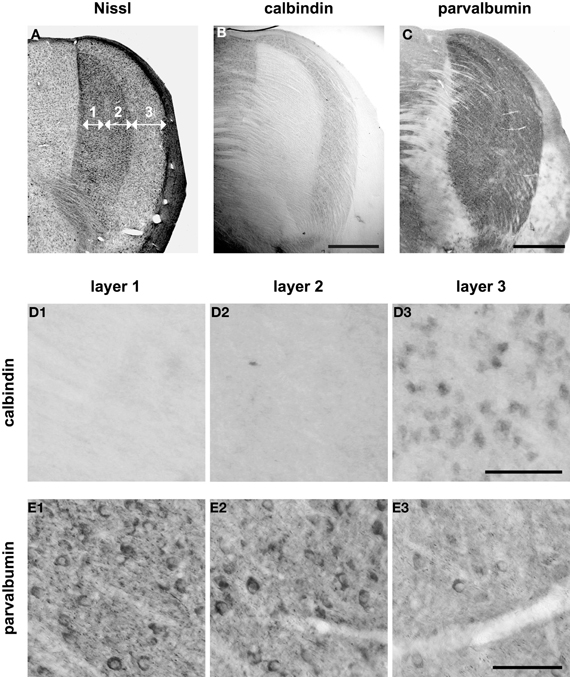
Figure 2. Calbindin-positive cells and parvalbumin-positive cells across the three laminae in squirrel lateral geniculate nucleus (LGN). (A) Coronal Nissl section through LGN, with numbers indicating the laminar cytoarchitecture. (B) Calbindin immunoreactivity is strongest adjacent to the optic tract, in layer 3. (C) Parvalbumin immunoreactivity is found in all layers, but is heaviest in layers 1 and 2. Scalebar = 1 mm. (D) Detailed images of the calbindin-labeled section (B) reveal cell-specific calbindin label in layer 3 (D3), but very little label in layer 1 (D1), and layer 2 (D2). Scalebar = 0.1 mm. (E) Higher magnification images of the parvalbumin-labeled section (C) show that parvalbumin-positive cells are denser in layer 1 (E1) and layer 2 (E2) than they are in layer 3 (E3). Scalebar = 0.1 mm.
Inspection of an adjacent section for the neuroanatomic localization of parvalbumin immunolabeling reveals that the laminar distribution of this staining pattern is quite different from the laminar distribution of calbindin immunoreactivity. With respect to the sub-nuclear structures seen in the Nissl stain (Figure 2A), Figure 2C indicates that parvalbumin immunoreactivity is most intense in the regions that correspond to layers 1 and 2, and is especially heavy across the ventral extent of layer 1 and at the lateral border of layer 2. At present, there is not thought to be any sublaminar organization in layer 2, but the dense parvalbumin staining at the lateral border of layer 2 raises this possibility. High-magnification views of layers 1, 2, and 3 (Figures 2E1–3) from the section above (Figure 2C) confirm that anti-parvalbumin localizes to cells and neuropil throughout the LGN, but that labeled cells are more dense in layer 1 (Figure 2E1) and layer 2 (Figure 2E2) than in layer 3 (Figure 2E3).
To determine whether the cells immunoreactive for the two calcium-binding proteins are relay cells, we labeled geniculocortical projection neurons by injecting red fluorescent latex microspheres, a retrograde tracer, into primary visual cortex, and looked for green fluorescence immunolabeling of tracer-positive cell somata in the LGN. Calbindin immunolabeling, detected here with the green fluorescent secondary antibody, is nearly absent in layers 1 and 2 (not shown) but clearly labels cells in layer 3 (Figure 3B). This localization is very similar to the result achieved with chromogenic visualization in Figures 2B, D1–3. When the green immunofluorescence signal is merged with the red fluorescent signal from the tracer in Figure 3C1, the overlay image reveals that a subset of retrogradely labeled projection neurons in layer 3 shows immunoreactivity for calbindin. The panels depicting parvalbumin immunoreactivity across the three layers (Figures 3B2–4) also recall the initial results of chromogenic visualization (Figures 2C, E1–3), such that parvalbumin immunopositive cells are more numerous in layers 1 (Figure 3B2) and 2 (Figure 3B3) than in layer 3 (Figure 3B2). In the row of merged images (Figures 3C2–4), in each layer we see that parvalbumin immunoreactivity occurs in some, but not all, geniculocortical projection neurons.
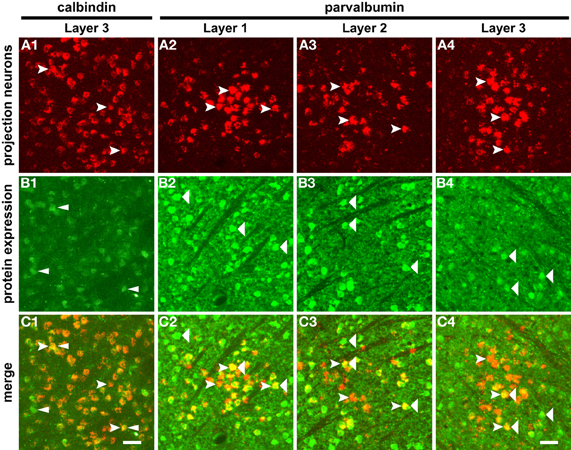
Figure 3. Calbindin immunoreactivity identifies a subset of projection neurons in LGN layer 3, and parvalbumin immunoreactivity identifies a subset of projection neurons in LGN layers 1, 2, and 3. Projection neurons retrogradely labeled by the latex microsphere injections into primary visual cortex are visible in all three laminae (A1–2; forked arrowheads). Calbindin immunolabeling characterizes layer 3 (B1; narrow arrowheads); this result is consistent with the laminar distribution seen in Figure 2D1–3. The merged image panel (C1) shows that layer 3 contains a subset of retrogradely labeled cells that is calbindin immunopositive. Parvalbumin immunoreactivity across the three layers (B2–4) exhibits the same pattern as in Figure 2E1–3, being more dense in layers 1 (B2) and 2 (B3) than in layer 3 (B4). Wide arrowheads indicate examples of parvalbumin immunoreactive cells. In each layer, the merged image panels (C2, C3, and C4) confirm that a subset of retrogradely labeled projection neurons is parvalbumin immunoreactive. Scalebar = 200 um.
We quantified the extent of calbindin single-labeling and parvalbumin single-labeling among the geniculocortical relay cells in each layer by identifying all retrogradely labeled neurons and then calculating the percentage of this sample that was both tracer- and immunopositive. As seen in Figure 4, calbindin immunoreactivity is present in zero of 276 projection neurons (0%) in layers 1 and 2, whereas 85 of 186 layer 3 projection neurons (45.7%) are calbindin immunoreactive. Parvalbumin immunoreactivity in layers 1, 2, and 3 exists in 28 of 59 (47.5%), 23 of 43 (53.5%), and 34 of 55 (61.8%) projection neurons, respectively.
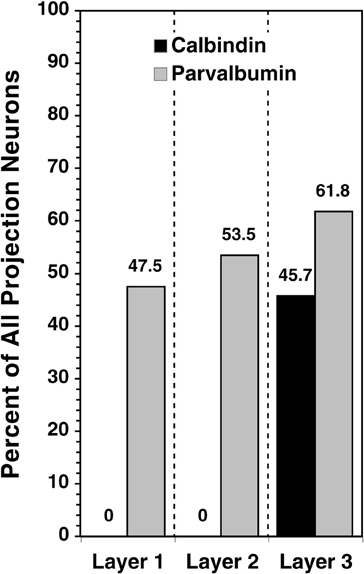
Figure 4. For retrogradely labeled cells in each layer, the gray column represents the proportion that is single-labeled by anti-calbindin and the black column represents the proportion that is single-labeled by anti-parvalbumin.
The percentage of retrogradely labeled projection neurons in layer 3 that are immunopositive for either calbindin or parvalbumin is close to 100%, raising the possibility that a population of layer 3 projection neurons expresses either calbindin or parvalbumin but not both. To examine this potential scenario, we performed a double-labeling experiment to see what fraction of LGN cells might co-express calbindin and parvalbumin. The top two panels in Figure 5 are images taken of the same region of tissue in layer 3–the top left panel shows immunolabeling of calbindin with a green fluorescent secondary antibody and the top right panel shows immunolabeling of parvalbumin with a red fluorescent secondary antibody. The polyclonal antibody against parvalbumin in these experiments yields a distribution of immunoreactivity that matches the pattern given by the monoclonal IgG1 in single-immunolabeling experiments (data not shown). At the bottom left of Figure 5, a merged view of the two fluorescent channels reveals that while some cells are immunopositive for only one of the two calcium-binding proteins, others are immunopositive for both. The graph at the bottom right gives the percentage of all immunopositive cells, in each layer, that is double-labeled for calbindin and parvalbumin. The last column shows that in layer 3, 144 of all 566 immunopositive cells (34.1%) are double-labeled. The few calbindin immunopositive cells seen in layers 1 and 2 were also included in the parvalbumin-positive population. These results suggest that it is possible for LGN cells to express both calbindin and parvalbumin. However, because this experiment was not performed on identified relay cells, the question of whether relay cells express both proteins remains unanswered.
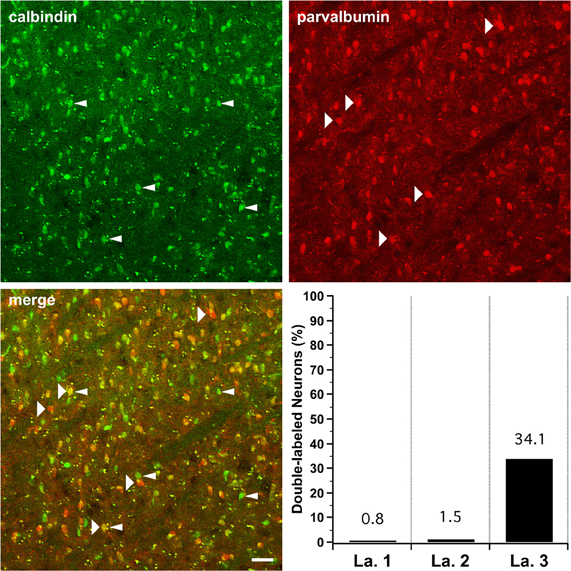
Figure 5. Partial co-localization between calbindin immunolabeling and parvalbumin immunolabeling in LGN layer 3. Top left: Calbindin immunoreactivity in squirrel LGN localizes to layer 3. Narrow arrowheads indicate calbindin immunoreactive cells. Top right: Parvalbumin immunoreactivity is also present in layer 3. Wide arrowheads indicate parvalbumin immunopositive cells. Bottom left: The merged image from layer 3 shows some cells that are immunopositive for calbindin alone or for parvalbumin alone and other cells that are immunoreactive to both antibodies. Bottom right: Columns for each layer represent the proportion of all cells immunoreactive for either mouse anti-calbindin or rabbit anti-parvalbumin that are positive for both antibodies. In layers 1 and 2, the few detectable calbindin immunopositive cells were also immunopositive for parvalbumin.
Extracellular Matrix Proteins: Aggrecan and Other CSPGs
The monoclonal antibody Cat-301, which targets the protein core of the CSPG aggrecan, fails to label cells in the LGN, although diffuse neuropil label is evident (data not shown).
Cat-301 is also ineffective as a selective marker of cells in the M layers of squirrel monkey LGN (Preuss et al., 1998; Gray et al., 1999). But because other laboratories have found that the plant lectin WFA, which recognizes the N-acetylgalactosamine sugar residue within CSPG GAG chains, binds with high selectivity to the extracellular matrices of cells in the same M layers of squirrel monkey LGN (Gray et al., 1999; Preuss et al., 1998), we wanted to test whether WFA also serves as an alternative cell-type-specific marker in the early visual system of gray squirrel. As shown in Figure 6A, WFA application produces uniform neuropil label, but not cell-specific label, in the LGN. This result closely resembles the pattern of Cat-301 labeling in this thalamic nucleus. In contrast, the presence of dark, WFA-positive cells in visual cortex (Figure 6B) demonstrates that this plant lectin does indeed recognize some particular population of cells in gray squirrel brain.
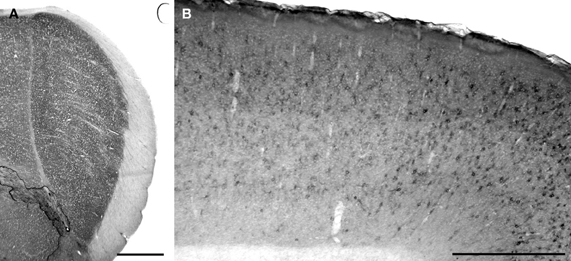
Figure 6. WFA does not label a population of relay cells in gray squirrel LGN. (A) WFA binding in the LGN is diffuse and does not identify individual cells. Scalebar = 1 mm. (B) WFA identifies discreet cells in primary visual cortex. Scalebar = 1 mm.
Neurofilament H
We were given the opportunity to inspect gray squirrel tissue labeled with SMI-32, generously provided by Jon Kaas and Peiyan Wong (Wong and Kaas, 2008). An examination of this tissue revealed that SMI-32 immunolabeling is evenly distributed across the three LGN laminae, as shown in Figure 7A. Higher magnification views (Figures 7B1–3) show that each layer contains both immunoreactive cell bodies and immunoreactive neuropil.
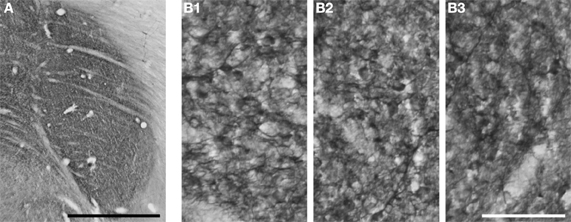
Figure 7. SMI-32 immunoreactivity labels both cell bodies and neuropil throughout the laminae of gray squirrel LGN. (A) Uniform SMI-32 labeling across LGN laminae. Scalebar = 1 mm. (B1–3) Higher-magnification views of SMI-32 immunoreactive cell bodies and processes in layer 1 (B1), layer 2 (B2), and layer 3 (B3). Scalebar = 0.1 mm.
Discussion
In a previous study, we examined receptive field properties of squirrel LGN cells as summarized in Table 1 (Van Hooser et al., 2003). In electrode penetrations, we were struck by the homogeneity of cells in layers 1/2: nearly all cells exhibited sustained responses to constant visual stimulation, center-surround receptive field organization, and reliable, highly stereotyped responses from trial to trial. We called these cells X-like cells because they were reminiscent of X cells in carnivores and rodents. Cells in layers 3abc were more heterogeneous. Most cells exhibited transient responses to constant stimulation, but only a subset, called Y-like cells, displayed a clear center-surround organization and reliable responses with short latencies. Other cells lacked a center-surround organization, had long response latencies, or exhibited unreliable or highly variable responses from trial to trial. Cells from any layer that exhibited these more unusual properties were called W-like cells because of their similarity to the heterogeneous W cell group in cats, tree shrews, and prosimians, and to the K group in primates (Stone and Fukuda, 1974; Stone, 1983; Irvin et al., 1986; Hendry and Reid, 2000).
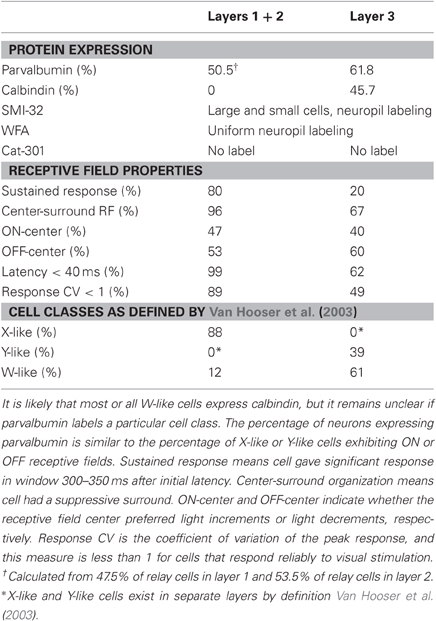
Table 1. Relationships among protein expression and receptive field properties in squirrel LGN.
There are now several lines of evidence to suggest that calbindin is a marker for at least some, if not all, W-like cells in the squirrel and in other species of Boreoeutheria, the branch of placental mammals that includes primates, carnivores, lagomorphs, and rodents, and which has been the focus of comparative studies of visual physiology. We observed strong calbindin expression among identified relay cells in layers 3abc, which is where the vast majority of W-like cells were found in our previous study of receptive field properties. As in squirrel, in other species examined the W-like or K cells receive projections from both retina and superior colliculus (Robson and Hall, 1976; Harting et al., 1991), project to superficial V1 (Leventhal, 1979; Fitzpatrick et al., 1983; Harting and Huerta, 1983; Conley et al., 1984; Usrey et al., 1992), and make smaller projections to extrastriate visual cortex (Rodman et al., 2001; Rodman and Dieguez, 2003; Sincich et al., 2004). By all of these anatomical criteria, W-like cells reside in layers 3abc in squirrel. In several mammalian species where W/K cells are restricted to discrete layers, such as in bush baby (Johnson and Casagrande, 1995), tree shrew (Diamond et al., 1993), and macaque (Jones and Hendry, 1989), these cells express calbindin and not parvalbumin (see Table 2). The LGN in the mouse is not well laminated, but nevertheless calbindin expression is present in cells located near to the optic tract, a common anatomical location for W/K cells in the other mammalian species from which there are data (Grubb and Thompson, 2004). Finally, one preliminary study in California ground squirrel identified a population of W/K cells in layers 3a and 3c by retrogradely labeling cells that project to extrastriate cortex. In double-labeling experiments, these W/K cells expressed calbindin (Rodman and Dieguez, 2003). In all examined species, W/K cells share afferent and efferent projection patterns, receptive field properties, and express calbindin, consistent with the idea that the W/K cells are homologous across Boreoeutherian mammals.
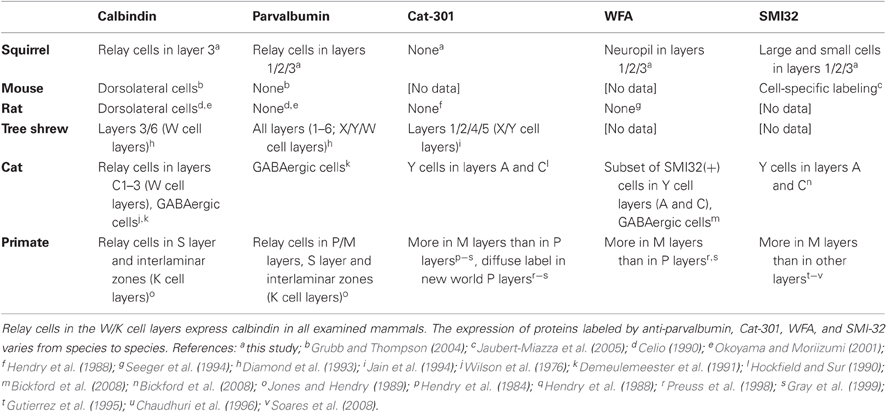
Table 2. Comparative analysis of putative cell-type marker proteins in the mammalian LGN.
The relationship between functional cell classes and parvalbumin is less clear. The laminar expression pattern of parvalbumin suggests that it is unlikely to be a general marker for X cells or Y cells in squirrel. If X and Y cells are truly segregated into layers 1/2 and layers 3abc, as suggested by our physiological study (Van Hooser et al., 2003), then the 88% of cells in layers 1/2 thought to be X cells do not correspond well to the 50.5% of relay cells that exhibit parvalbumin expression. It is also possible that there may be some Y cells in layers 1/2; if so, these cells probably correspond to the 20% of layer 1/2 cells with transient responses, which also does not match the percentage of parvalbumin-positive cells.
Given the remarkable homogeneity of receptive field properties in layers 1/2, it is surprising that parvalbumin is expressed in only a subset of these cells. This is apparently not the case in macaque monkey (Jones and Hendry, 1989) and bush baby (Johnson and Casagrande, 1995), where a large majority of confirmed relay neurons in the P and M layers express parvalbumin. Of all the physiological properties listed in Table 1, only the percentage of ON-center and OFF-center cells roughly match the percentage of parvalbumin-positive LGN neurons. It is possible that in squirrel parvalbumin is expressed in either the ON-center or OFF-center types of both X-type and Y-type cells. Alternatively, there may be differences among layer 1/2 cells that were not revealed by our study of receptive field properties. Recent recordings in cat LGN revealed that some receptive field properties of Y cells in the A laminae differ from Y cells in the C layers, suggesting that there are at least two distinct classes of Y cells (Yeh et al., 2003). It is possible that other known LGN cell classes also comprise more than one cell-type.
The pattern of parvalbumin expression varies from species to species, and only primates, tree shrews, and squirrels appear to exhibit robust parvalbumin expression in relay cells (see Table 2). In these species, parvalbumin expression is restricted to projection neurons found in layers that contain X/P and Y/M cells. It is possible that the presence of parvalbumin expression is more common in diurnal animals than nocturnal animals. With the exception of the prosimian galago, each of these species exhibits diurnal visual behavior and possesses cone-dominated retinas (West and Dowling, 1975; Wässle and Riemann, 1978; Long and Fisher, 1983; Immel and Fisher, 1985). The absence of parvalbumin expression by projection neurons in mouse, rat, and cat LGN is also consistent with a relationship between parvalbumin and diurnal vision. These latter species are either nocturnal or crepuscular and possess rod-dominated retinas suitable for visually guided behavior in low-light conditions (Wässle and Riemann, 1978; Sterling, 1990). Additionally, an examination of data from Euarchontoglires—the branch of Boreoeutherians including primates, tree shrews, and rodents—raises the possibility that the common ancestor for this lineage did express parvalbumin in its LGN neurons, but that in the recent evolution of murid rodents (rats and mice) parvalbumin expression in the LGN was lost.
Experiments with the antibodies Cat-301 and SMI-32 were unable to further differentiate the molecular organization of gray squirrel LGN. Cat-301 labels Y/M cells in mammals such as cat (Hockfield and Sur, 1990), tree shrew (Jain et al., 1994), and Old World monkeys (Hendry et al., 1988). The lack of cell-specific Cat-301 binding in gray squirrel LGN is congruent, however, with the absence of the Cat-301 epitope in other rodents, such as rat (Hendry et al., 1988). The same is true for cell-specific WFA binding. The absence of WFA-labeled extracellular matrices in gray squirrel LGN is consistent with similar results in rodents such as rat (Seeger et al., 1994) and mouse (Bruckner et al., 2000), but different from the selective WFA labeling of M cells in the LGNs of both Old World and New World monkeys (Preuss et al., 1998; Gray et al., 1999).
In conclusion, there is now a growing body of evidence that W/K cells are homologous across species evolved from the Boreoeutherian branch of placental mammals, and that in these animals calbindin expression is an effective marker of this cell population. The invariance of calbindin as a marker for W/K cells is remarkable given the wide range of LGN geometries and laminar locations of W/K cells. Expression patterns of other LGN cell markers vary considerably from species to species. These differences could reflect changes in homologous pathways that underlie the small differences in LGN response properties across mammals, or may indicate that LGN cell classes, although functionally similar, evolved independently.
Conflict of Interest Statement
The authors declare that the research was conducted in the absence of any commercial or financial relationships that could be construed as a potential conflict of interest.
Acknowledgments
This work was supported by National Institutes of Health Grant NS046881 to Stephen D. Van Hooser and National Eye Institute Grant EY11116 to Sacha B. Nelson. We are grateful to our advisor, Dr. Sacha B. Nelson, for mentorship. We thank Justine Barry, Keow Essig, and Roman Pavlyuk for expert technical assistance, Jon Kaas and Peiyan Wong at Vanderbilt University for sharing SMI-32 immunohistochemistry results, and the Fitzpatrick lab at Duke University for comments on the manuscript.
References
Arai, R., Jacobowitz, D. M., and Deura, S. (1994). Distribution of calretinin, calbindin-D28k, and parvalbumin in the rat thalamus. Brain Res. Bull. 33, 595–614.
Bickford, M. E., Guido, W., and Godwin, D. W. (1998). Neurofilament proteins in Y-cells of the cat lateral geniculate nucleus: normal expression and alteration with visual deprivation. J. Neurosci. 18, 6549–6557.
Bickford, M. E., Wei, H., Eisenback, M. A., Chomsung, R. D., Slusarczyk, A. S., and Dankowsi, A. B. (2008). Synaptic organization of thalamocortical axon collaterals in the perigeniculate nucleus and dorsal lateral geniculate nucleus. J. Comp. Neurol. 508, 264–285.
Bruckner, G., Grosche, J., Schmidt, S., Hartig, W., Margolis, R. U., Delpech, B., Seidenbecher, C. I., Czaniera, R., and Schachner, M. (2000). Postnatal development of perineuronal nets in wild-type mice and in a mutant deficient in tenascin-R. J. Comp. Neurol. 428, 616–629.
Celio, M. R. (1990). Calbindin D-28k and parvalbumin in the rat nervous system. Neuroscience 35, 375–475.
Chaudhuri, A., Zangenehpour, S., Matsubara, J. A., and Cynader, M. S. (1996). Differential expression of neurofilament protein in the visual system of the vervet monkey. Brain Res. 709, 17–26.
Conley, M., Fitzpatrick, D., and Diamond, I. T. (1984). The laminar organization of the lateral geniculate body and the striate cortex in the tree shrew (Tupaia glis). J. Neurosci. 4, 171–197.
Demeulemeester, H., Arckens, L., Vandesande, F., Orban, G. A., Heizmann, C. W., and Pochet, R. (1991). Calcium binding proteins as molecular markers for cat geniculate neurons. Exp. Brain Res. 83, 513–520.
Diamond, I. T., Fitzpatrick, D., and Schmechel, D. (1993). Calcium binding proteins distinguish large and small cells of the ventral posterior and lateral geniculate nuclei of the prosimian galago and the tree shrew (Tupaia belangeri). Proc. Natl. Acad. Sci. U.S.A. 90, 1425–1429.
Enroth-Cugell, C., and Robson, J. G. (1966). Contrast sensitivity of retinal ganglion cells of cat. J. Physiol. 187, 517–552.
Fitzpatrick, D., Itoh, K., and Diamond, I. T. (1983). The laminar organization of the lateral geniculate body and the striate cortex in the squirrel monkey (Saimiri sciureus). J. Neurosci. 3, 673–702.
Gray, D., Gutierrez, C., and Cusick, C. G. (1999). Neurochemical organization of inferior pulvinar complex in squirrel monkeys and macaques revealed by acetylcholinesterase histochemistry, calbindin and Cat-301 immunostaining, and Wisteria floribunda agglutinin binding. J. Comp. Neurol. 409, 452–468.
Grubb, M. S., and Thompson, I. D. (2004). Biochemical and anatomical subdivision of the dorsal lateral geniculate nucleus in normal mice and in mice lacking the beta2 subunit of the nicotinic acetylcholine receptor. Vision Res. 44, 3365–3376.
Gutierrez, C., Yaun, A., and Cusick, C. G. (1995). Neurochemical subdivisions of the inferior pulvinar in macaque monkeys. J. Comp. Neurol. 363, 545–562.
Harting, J. K., and Huerta, M. F. (1983). The geniculostriate projection in the grey squirrel: preliminary autoradiographic data. Brain Res. 272, 341–349.
Harting, J. K., Huerta, M. F., Hashikawa, T., and van Lieshout, D. P. (1991). Projection of the mammalian superior colliculus upon the dorsal lateral geniculate nucleus: organization of tectogeniculate pathways in nineteen species. J. Comp. Neurol. 304, 275–306.
Heimel, J. A., Van Hooser, S. D., and Nelson, S. B. (2005). Laminar organization of response properties in primary visual cortex of the gray squirrel (Sciurus carolinensis). J. Neurophysiol. 94, 3538–3554.
Hendry, S. H., Hockfield, S., Jones, E. G., and McKay, R. (1984). Monoclonal antibody that identifies subsets of neurones in the central visual system of monkey and cat. Nature 307, 267–269.
Hendry, S. H., Jones, E. G., Hockfield, S., and McKay, R. D. (1988). Neuronal populations stained with the monoclonal antibody Cat-301 in the mammalian cerebral cortex and thalamus. J. Neurosci. 8, 518–542.
Hendry, S. H., and Reid, R. C. (2000). The koniocellular pathway in primate vision. Annu. Rev. Neurosci. 23, 127–153.
Hockfield, S., and Sur, M. (1990). Monoclonal antibody Cat-301 identifies Y-cells in the dorsal lateral geniculate nucleus of the cat. J. Comp. Neurol. 300, 320–330.
Holdefer, R. N., and Norton, T. T. (1995). Laminar organization of receptive field properties in the dorsal lateral geniculate nucleus of the tree shrew (Tupaiaglis belangeri). J. Comp. Neurol. 358, 401–413.
Immel, J. H., and Fisher, S. K. (1985). Cone photoreceptor shedding in the tree shrew (Tupaia belangerii). Cell Tissue Res. 239, 667–675.
Irvin, G. E., Norton, T. T., Sesma, M. A., and Casagrande, V. A. (1986). W-like response properties of interlaminar zone cells in the lateral geniculate nucleus of a primate (Galago crassicaudatus). Brain Res. 362, 254–270.
Jain, N., Preuss, T. M., and Kaas, J. H. (1994). Subdivisions of the visual system labeled with the Cat-301 antibody in tree shrews. Vis. Neurosci. 11, 731–741.
Jaubert-Miazza, L., Green, E., Lo, F. S., Bui, K., Mills, J., and Guido, W. (2005). Structural and functional composition of the developing retinogeniculate pathway in the mouse. Vis. Neurosci. 22, 661–676.
Johnson, J. K., and Casagrande, V. A. (1995). Distribution of calcium-binding proteins within the parallel visual pathways of a primate (Galago crassicaudatus). J. Comp. Neurol. 356, 238–260.
Jones, E. G., and Hendry, S. H. (1989). Differential calcium binding protein immunoreactivity distinguishes classes of relay neurons in monkey thalamic nuclei. Eur. J. Neurosci. 1, 222–246.
Kaas, J. H., Guillery, R. W., and Allman, J. M. (1972). Some principles of organization in the dorsal lateral geniculate nucleus. Brain Behav. Evol. 6, 253–299.
Kaas, J. H., Huerta, M. F., Weber, J. T., and Harting, J. K. (1978). Patterns of retinal terminations and laminar organization of the lateral geniculate nucleus of primates. J. Comp. Neurol. 182, 517–553.
Leventhal, A. G. (1979). Evidence that the different classes of relay cells of the cat's lateral geniculate nucleus terminate in different layers of the striate cortex. Exp. Brain Res. 37, 349–372.
Long, K. O., and Fisher, S. K. (1983). The distributions of photoreceptors and ganglion cells in the California ground squirrel, Spermophilus beecheyi. J. Comp. Neurol. 221, 329–340.
Matthews, R. T., Kelly, G. M., Zerillo, C. A., Gray, G., Tiemeyer, M., and Hockfield, S. (2002). Aggrecan glycoforms contribute to the molecular heterogeneity of perineuronal nets. J. Neurosci. 22, 7536–7547.
Okoyama, S., and Moriizumi, T. (2001). Onset of calbindin-D 28K and parvalbumin expression in the lateral geniculate complex and olivary pretectal nucleus during postnatal development of the rat. Int. J. Dev. Neurosci. 19, 655–661.
Preuss, T. M., Gray, D., and Cusick, C. G. (1998). Subdivisions of the motor and somatosensory thalamus of primates revealed with Wisteria floribunda agglutinin histochemistry. Somatosens. Mot. Res. 15, 211–219.
Robson, J. A., and Hall, W. C. (1976). Projections from the superior colliculus to the dorsal lateral geniculate nucleus of the grey squirrel (Sciurus carolinensis). Brain Res. 113, 379–385.
Rodman, H. R., and Dieguez, D. (2003). The koniocellular pathway and the thalamo-cortical projection in the ground squirrel. Program No. 701.8. 2003 Neuroscience Meeting Planner. (New Orleans, LA: Society for Neuroscience). [Online].
Rodman, H. R., Sorenson, K. M., Shim, A. J., and Hexter, D. P. (2001). Calbindin immunoreactivity in the geniculo-extrastriate system of the macaque: implications for heterogeneity in the koniocellular pathway and recovery from cortical damage. J. Comp. Neurol. 431, 168–181.
Seeger, G., Brauer, K., Hartig, W., and Bruckner, G. (1994). Mapping of perineuronal nets in the rat brain stained by colloidal iron hydroxide histochemistry and lectin cytochemistry. Neuroscience 58, 371–388.
Sincich, L. C., Park, K. F., Wohlgemuth, M. J., and Horton, J. C. (2004). Bypassing V1: a direct geniculate input to area MT. Nat. Neurosci. 7, 1123–1128.
Soares, J. G., Rosado De Castro, P. H., Fiorani, M., Nascimento-Silva, S., and Gattass, R. (2008). Distribution of neurofilament proteins in the lateral geniculate nucleus, primary visual cortex, and area MT of adult Cebus monkeys. J. Comp. Neurol. 508, 605–614.
Sterling, P. (1990). “Retina,” in The Synaptic Organization of the Brain, ed G. M. Shepherd (New York, NY: Oxford University Press), 170–213.
Stone, J. (1983). Parallel Processing in the Visual System: The Classification of Retinal Ganglion Cells and its Impact on the Neurobiology of Vision. New York, NY: Plenum Press.
Stone, J., and Fukuda, Y. (1974). Properties of cat retinal ganglion cells: a comparison of W-cells with X- and Y-cells. J. Neurophysiol. 37, 722–748.
Usrey, W. M., Muly, E. C., and Fitzpatrick, D. (1992). Lateral geniculate projections to the superficial layers of visual cortex in the tree shrew. J. Comp. Neurol. 319, 159–171.
Van Hooser, S. D., Heimel, J. A., Chung, S., and Nelson, S. B. (2006). Lack of patchy horizontal connectivity in primary visual cortex of a mammal without orientation maps. J. Neurosci. 26, 7680–7692.
Van Hooser, S. D., Heimel, J. A., Chung, S., Nelson, S. B., and Toth, L. J. (2005). Orientation selectivity without orientation maps in visual cortex of a highly visual mammal. J. Neurosci. 25, 19–28.
Van Hooser, S. D., Heimel, J. A., and Nelson, S. B. (2003). Receptive field properties and laminar organization of lateral geniculate nucleus in the gray squirrel (Sciurus carolinensis). J. Neurophysiol. 90, 3398–3418.
Wässle, H., and Riemann, H. J. (1978). The mosaic of nerve cells in the mammalian retina. Proc. R. Soc. Lond. B Biol. Sci. 200, 441–461.
West, R. W., and Dowling, J. E. (1975). Anatomical evidence for cone and rod-like receptors in the gray squirrel, ground squirrel, and prairie dog retinas. J. Comp. Neurol. 159, 439–460.
Wilson, P. D., Rowe, M. H., and Stone, J. (1976). Properties of relay cells in cat's lateral geniculate nucleus: a comparison of W-cells with X- and Y-cells. J. Neurophysiol. 39, 1193–1209.
Wong, P., and Kaas, J. H. (2008). Achitectonic subdivisions of neocortex in the gray squirrel (Sciurus carolinensis). Anat. Rec. 291, 1301–1333.
Keywords: retrograde tracer, immunohistochemistry, cell classification, calbindin, parvalbumin, lateral geniculate nucleus, gray squirrel
Citation: Felch DL and VanHooser SD (2012) Molecular compartmentalization of lateral geniculate nucleus in the gray squirrel (Sciurus carolinensis). Front. Neuroanat. 6:12. doi: 10.3389/fnana.2012.00012
Received: 08 February 2012; Paper pending published: 08 March 2012;
Accepted: 25 March 2012; Published online: 10 April 2012.
Edited by:
Patrick R. Hof, Mount Sinai School of Medicine, USAReviewed by:
David C. Lyon, University of California, USAChet C. Sherwood, George Washington University, USA
Copyright: © 2012 Felch and Van Hooser. This is an open-access article distributed under the terms of the Creative Commons Attribution Non Commercial License, which permits non-commercial use, distribution, and reproduction in other forums, provided the original authors and source are credited.
*Correspondence: Daniel L. Felch, Box G-LN, Brown University, Providence, RI 02912, USA. e-mail:ZGFuaWVsX2ZlbGNoQGJyb3duLmVkdQ==
†Present address: Neuroscience Graduate Program, Brown University, Providence, RI, USA