 Carmen Díaz
 Nicanor Morales-Delgado
 Luis Puelles
- 1Department of Medical Sciences, School of Medicine and Institute for Research in Neurological Disabilities, University of Castilla-La Mancha, Albacete, Spain
- 2Department of Human Anatomy and Psychobiology, University of Murcia, School of Medicine and IMIB (Instituto Murciano de Investigación Biosanitaria), Murcia, Spain
During early development, the hypothalamic primordium undergoes anteroposterior and dorsoventral regionalization into diverse progenitor domains, each characterized by a differential gene expression code. The types of neurons produced selectively in each of these distinct progenitor domains are still poorly understood. Recent analysis of the ontogeny of peptidergic neuronal populations expressing Sst, Ghrh, Crh and Trh mRNAs in the mouse hypothalamus showed that these cell types originate from particular dorsoventral domains, characterized by specific combinations of gene markers. Such analysis implies that the differentiation of diverse peptidergic cell populations depends on the molecular environment where they are born. Moreover, a number of these peptidergic neurons were observed to migrate radially and/or tangentially, invading different adult locations, often intermingled with other cell types. This suggests that a developmental approach is absolutely necessary for the understanding of their adult distribution. In this essay, we examine comparatively the ontogenetic hypothalamic topography of twelve additional peptidergic populations documented in the Allen Developmental Mouse Brain Atlas, and discuss shared vs. variant aspects in their apparent origins, migrations and final distribution, in the context of the respective genoarchitectonic backgrounds. This analysis should aid ulterior attempts to explain causally the development of neuronal diversity in the hypothalamus, and contribute to our understanding of its topographic complexity in the adult.
Introduction
The hypothalamus is a complex forebrain structure that regulates vital processes and various visceral and somatic behavior. Numerous hypothalamic peptides are involved in modulating such functions. Advances on the molecular mechanisms associated to the ontogeny of peptidergic neurons are helping us to understand developmental defects that cause metabolic and neuroendocrine disorders (Michaud, 2001; Caqueret et al., 2005). Murine experimental studies in which some transcription factors were inactivated, showed that gene products such as GSH1, MASH1, SIM1, SIM2, ARNT2, BRN-2, and OTP are crucial for the differentiation of the parvicellular GHRH, SST, TRH, CRH neuroendocrine cell types, as well as the magnocellular OT and VP secreting neurons (Nakai et al., 1995; Schonemann et al., 1995; Li et al., 1996; Michaud et al., 1998; Acampora et al., 1999; Wang and Lufkin, 2000; Hosoya et al., 2001; Goshu et al., 2004; Caqueret et al., 2005; McNay et al., 2006; Szarek et al., 2010).
Furthermore, developmental gene expression patterns allowed a molecular characterization of specific areal subdivisions within the alar and basal regions of the hypothalamus. Such regional analysis produces genoarchitectonic maps (Ferran et al., 2009; Puelles and Ferran, 2012), which illuminate the variety of molecular mechanisms controlling the specification of differential neuronal fates at each particular hypothalamic subregion. Each neuroepithelial area of the hypothalamus becomes distinct by its unique gene expression profile. As a progenitor domain, it is capable of controlling differentially over time its proliferative and neurogenetic activity, producing specific neuronal populations, and simultaneously generating signals for axonal and neuronal navigation. Different neuron types may originate sequentially at the same domain, due to temporal changes in the local molecular profile. Some neurons migrate tangentially within the mantle layer, invading other hypothalamic domains before they finish developing their phenotype and acquire functional roles within particular circuits.
Tangential migrations from nearby forebrain areas into the hypothalamus, as well as internal migrations, are not exceptional during hypothalamic development (e.g., Keyser, 1972; Alvarez-Bolado et al., 2000; Skidmore et al., 2008; Zhao et al., 2008). Puelles et al. (2012) postulated several other tangential migrations, including distinct cell streams forming the ventromedial nucleus and the ventral premamillary nucleus. Our recent studies likewise suggested widespread tangential migrations of some peptidergic neurons (Morales-Delgado et al., 2011, 2014). As a result, a frequent feature of conventional hypothalamic nuclei is their content of mixed neuron types, using a variety of neuropeptides and neurotransmitters; this intermixing may be functionally relevant (Rhodes et al., 1981; Sofroniew and Glasmann, 1981; Markakis and Swanson, 1997; Broberger et al., 1998; Elias et al., 1998; Sawchenko, 1998; Broberger, 1999; Simmons and Swanson, 2009; Shimogori et al., 2010; Puelles et al., 2012; Tobet and McClellan, 2013).
Puelles et al. (LP, online reference atlases and ontology of the Allen Developing Mouse Brain Atlas, 2009; Puelles et al., 2012, 2013) recently updated the prosomeric model, particularly as regards the hypothalamus. It was defined as a bi-neuromeric rostral forebrain territory, lying in front of the diencephalon proper and ventral to the telencephalon (which can be seen as a part of it; Figure 1A). The Mash1/Dlx/Arx/Isl1-expressing preoptic area was ascribed to the subpallial telencephalon. The neighboring dorsal part of the alar hypothalamus—the paraventricular area- singularly expresses the genes Otp and Sim1. There is thus a clearcut molecular hypothalamo-telencephalic boundary, which is longitudinal (Shimogori et al., 2010; Puelles et al., 2012). At its ventral end, the hypothalamus is represented by the mamillary and retromamillary areas, which include at their median plane the rostral end of the forebrain floor plate. The hypothalamus has no rostral neighbor, since it represents the rostralmost part of the neural tube. As a consequence, the right and left lateral walls of the neural tube are here continuous one with another primarily (from neural plate stages onwards), creating an unique median alar + basal subregion recently named “acroterminal area” (Puelles et al., 2012). Terminal lamina, optic chiasma and tuberomamillary midline specializations (e.g., median eminence and neurohypophysis) develop there. The roof plate is telencephalic (partly choroidal and partly septocommissural), and ends at the anterior commissure.
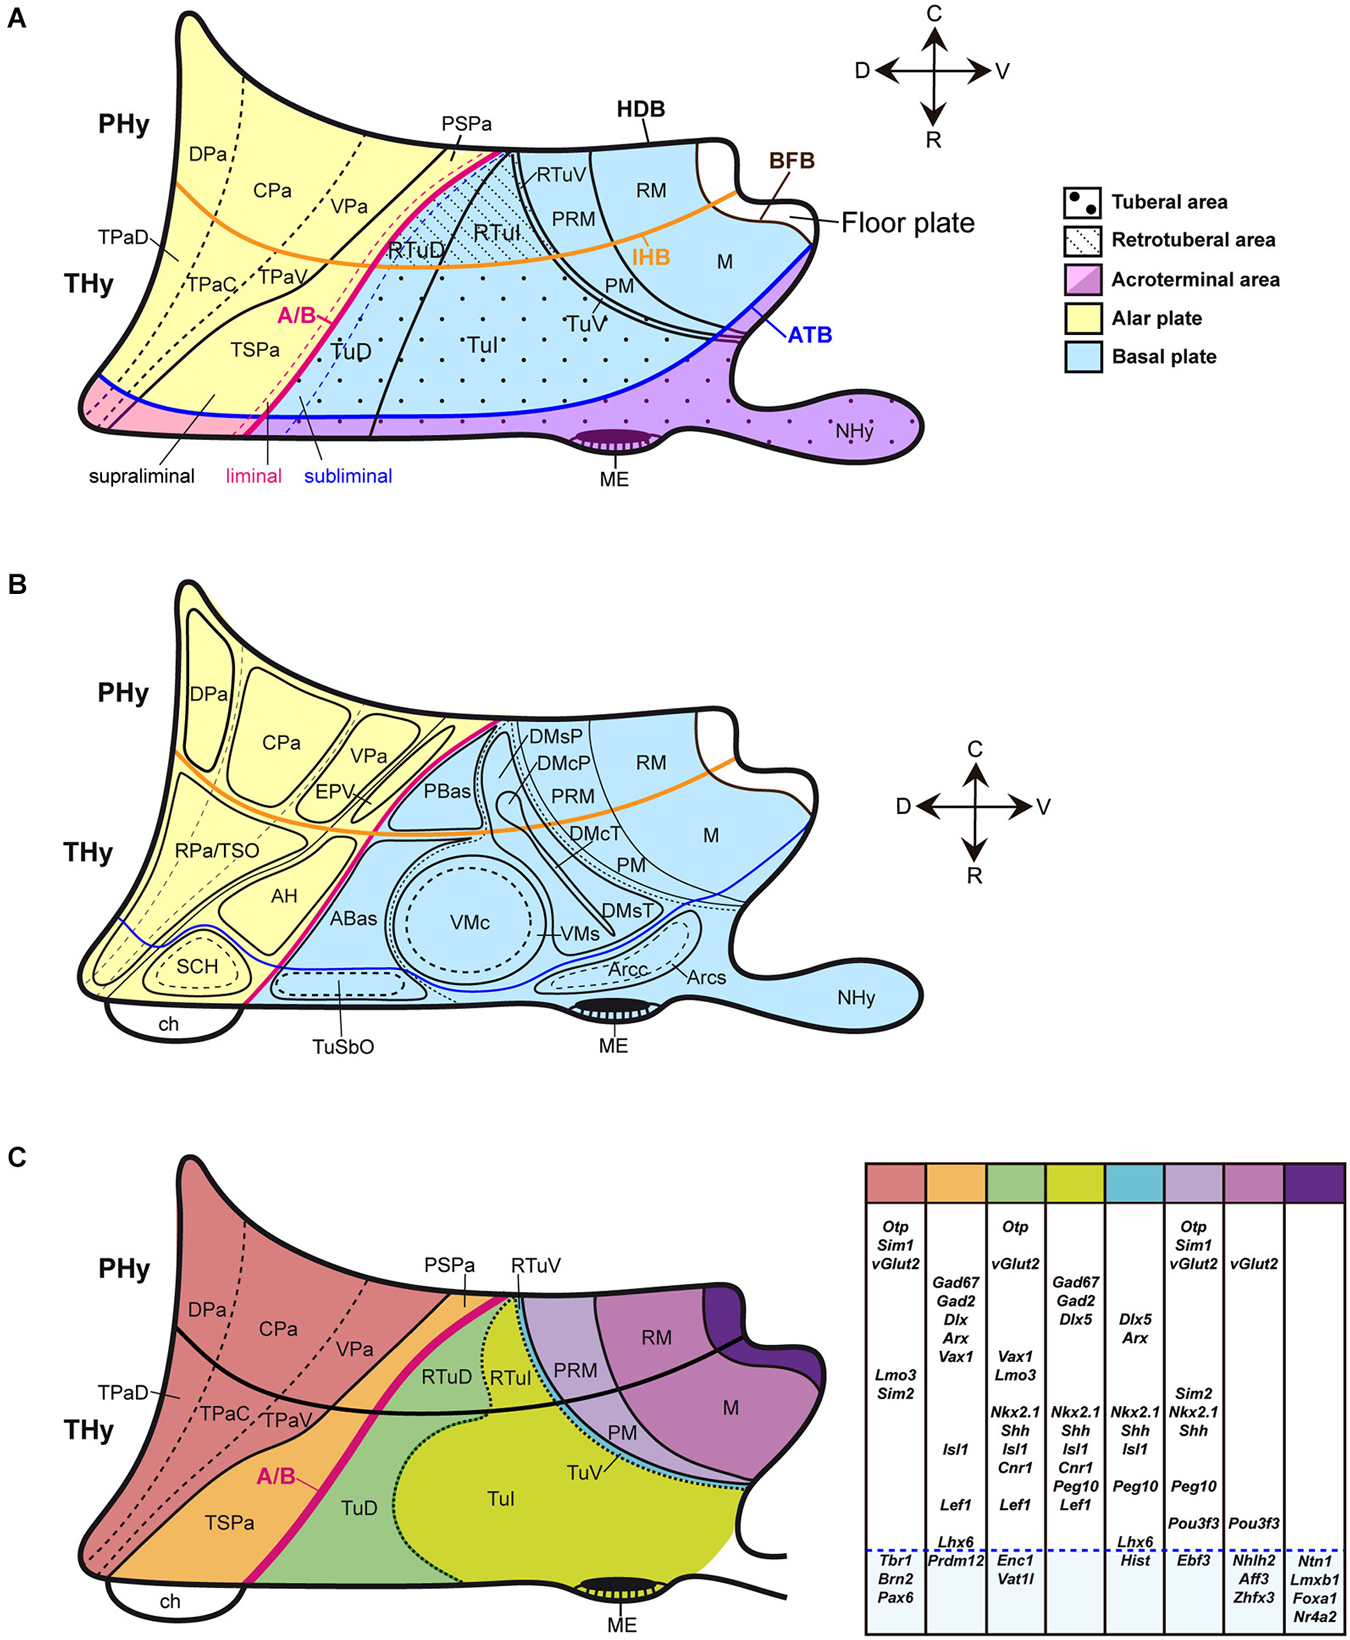
Figure 1. Schematic partial prosomeric model of the forebrain representing the general position, morphologic organization and principal nuclear and genoarchitectonic subdivisions of the hypothalamus. The rostrocaudal (R-C) and dorsoventral (D-V) spatial directions are indicated. (A) Schema of the main hypothalamic progenitor areas distributed across the dorsoventral and rostrocaudal dimensions. The longitudinal alar/basal boundary (A/B), and the intrahypothalamic (IHB) and acroterminal (ATB) boundaries are indicated respectively as thick pink, orange and blue lines. The hypothalamic area is subdivided rostrocaudally into neuromeric peduncular and terminal parts (PHy, THy). Alar territories are shown on the left (yellow) and basal territories on the right (blue). The alar hypothalamus is subdivided into the paraventricular (TPa/PPa) and subparaventricular (TSPa/PSPa) areas (each pair of areas refers to THy and PHy components of a longitudinal zone), plus corresponding acroterminal subregions. The paraventricular area shows a general tripartition into dorsal, central and ventral parts (TPaD, TPaC, TPaV, DPa, CPa, VPa). The subparaventricular area appears subdivided into supraliminal and liminal parts (referring to the alar-basal limit; the liminal domain expresses Nkx2.2). The basal hypothalamus is also divided dorsoventrally into the large tuberal/retrotuberal (Tu/RTu) area and the primary mamillary/retromamillary (M/RM) area, plus the corresponding acroterminal subregions. The THy/PHy parts of the hypothalamic floor lie underneath (white). Moreover, the Tu/RTu region is subdivided into three dorsoventral parts: TuD/RTuD, TuI/RTuI and TuV/RTuV. The TuD/RTuD contains a dorsal subliminal part (which also expresses Nkx2.2). The primary M/RM area is subdivided into a perimamillary/periretromamillary band (PM/PRM), and the underlying secondary M/RM complex proper. (B) Map of the main alar and basal hypothalamic nuclei represented upon the diagram shown in (C). (C) Schematic color-coded map of the gene expression patterns distributed across the main dorsoventral hypothalamic subdivisions of E13.5 mouse embryos. Varied combinations of gene markers create a characteristic molecular profile for each territory, as represented in tabular form on the right. Genes expressed in more than one dorsoventral domain are grouped in the white area and genes expressed in an unique domain are shown in the blue area. For abbreviations, see the list.
The Figures 1A–C illustrate the hypothalamic progenitor domains defined within the prosomeric model, with correlative major derived nuclei, and basic genoarchitectonic patterns. Additional such data will be provided below, as each domain is considered. There is a rostrocaudal partition of the hypothalamus and attached telencephalon into two transverse (neuromeric) parts (hypothalamic prosomeres 1 and 2, or hp1/hp2; Pombal et al., 2009; Nieuwenhuys, 2009; Puelles et al., 2012). To avoid confusion with older terminologies, the resulting two transverse parts of the hypothalamus were renamed as terminal and peduncular hypothalamus (THy, PHy), referring to the terminal rostral position of the former and to the association of the latter with the course of peduncular telencephalic fibers (Puelles et al., 2012; for genoarchitectonic analysis of these rostrocaudal hypothalamic divisions, see Ferran et al., under review).
THy and PHy are both divided dorsoventrally into longitudinal alar, basal and floor territories, which display differential molecular profiles and various microzonal subdivisions. These longitudinal zones are continuous caudally with diencephalic counterparts, being a result of shared dorsoventral patterning. The alar hypothalamus is divided into the paraventricular area (continuous with the prethalamic eminence and the prethalamic reticular nucleus), and the subparaventricular area (continuous with the prethalamic zona incerta) (TPa, PPa; TSPa, PSPa; Figures 1A–C; Puelles et al., 2012). The narrow TPa contains the eye vesicle, the optic stalk and the chiasma. The SPa contains subpially the optic tract.
The basal hypothalamus largely corresponds to the classical tuberal and mamillary hypothalamic regions. However, these two regions belong exclusively to the voluminous basal THy. The new terms retrotuberal and retromamillary regions are needed for the corresponding PHy basal territories; accordingly, the tuberal and retrotuberal domains compose a hypothalamic longitudinal column, and the mamillary and retromamillary domains another (Tu/RTu; M/RM; Figures 1A–C; note “retromamillary” substitutes for the older “supramamillary” term). Tu/RTu further subdivides dorsoventrally into dorsal, intermediate and ventral longitudinal microzonal domains (TuD/RTuD, TuI/RTuI, TuV/RTuV; Figures 1A–C). The TuD/RTuD domain corresponds to the classic, precociously differentiated “hypothalamic cell cord’ (Gilbert, 1935; Keyser, 1972). The TuI/RTuI contains the ventromedial, dorsomedial and arcuate nuclei, whereas the narrow TuV/RTuV produces the hypothalamic histaminergic neurons (Puelles et al., 2012). The underlying mamillary/retromamillary basal territory also shows a molecularly distinct dorsal microzonal subdivision, the perimamillary/periretromamillary domain (PM, PRM; Figures 1A–C; Bardet et al., 2008; Puelles et al., 2012; Morales-Delgado et al., 2014; Allen Developing Mouse Brain Atlas).
This anteroposterior and dorsoventral map of the hypothalamus provides a scenario where the genoarchitectonically characterized progenitor domains of specific peptidergic neuron groups can be precisely identified (Figures 1C, 2). Moreover, jointly with results from knockout and other transgenic mice, this modern hypothalamic scenario potentiates the analysis of patterning mechanisms implicated in neuronal type specification.
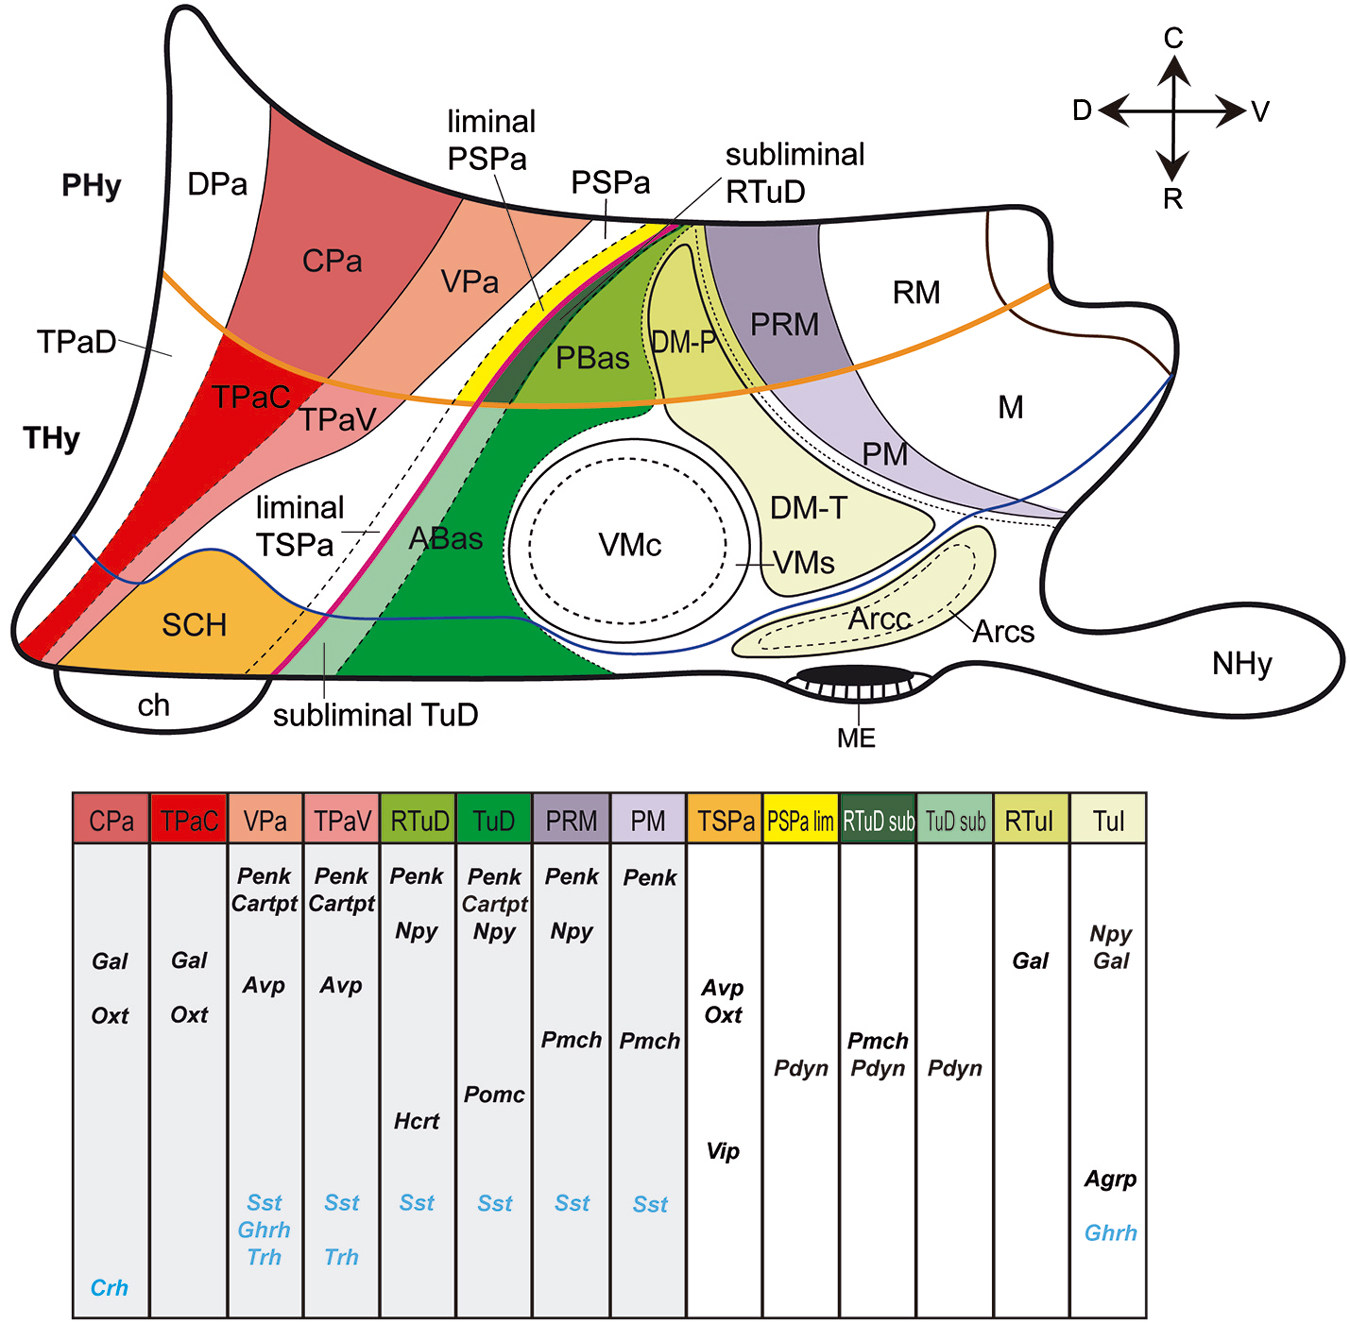
Figure 2. Schematic color-coded prosomeric map illustrating the main prenatal and early postnatal progenitor areas where peptidergic cell populations originate in the mouse hypothalamus. Specific peptidergic transcripts generated at each source area are represented in tabular form; each column corresponds to a progenitor area identified by a color in the upper schema. For abbreviations, see the list.
Material
We examined the development of twelve peptidergic cell populations (Agrp, Avp, Cartpt, Gal, Hcrt, Npy, Oxt, Penk, Pdyn, Pmch, Pomc, Vip; Table 1), analyzed from in situ hybridization images downloaded from the Allen Developing Mouse Brain Atlas.1 These are mostly sagittal sections; while this section plane is appropriate for the analysis of potential dorsoventral and anteroposterior tangential migrations, the visualization of some anatomic landmarks may be compromised. We recurred to careful analysis of all sagittal (eventually also coronal) section planes shown at the Allen Atlas, as well as to our extensive experience with multiple planes of sections through the mouse hypothalamus. We correlated the positions of peptidergic cells at the time points available at the Allen Atlas (embryonic days E11.5, E13.5, E15.5 and E18.5, and postnatal day P4) with the genoarchitectonically distinct areas (Figure 1C) and conventional nuclei (Figure 1B), following the model of Puelles et al. (2012). We also recorded aspects of areal heterochrony (Table 2), and apparent tangential migrations (Table 3; Figures 3–5). Note that any interpretations of “migration” extracted from our descriptive material are necessarily hypothetic, open to experimental testing, though we hold that these conclusions momentarily represent the most parsimonious interpretations of the data. For overview, we added the similar data on Sst, Ghrh, Trh and Crh neurons of Morales-Delgado et al. (2011, 2014) in our present Figure 2; Tables 2, 3. Our discussion accordingly contemplates sixteen peptidergic cell types, allowing some general conclusions.
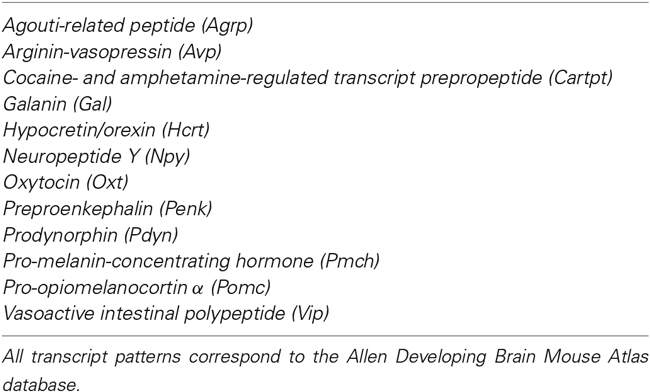
Table 1. Peptide mRNAs mapped in this work.
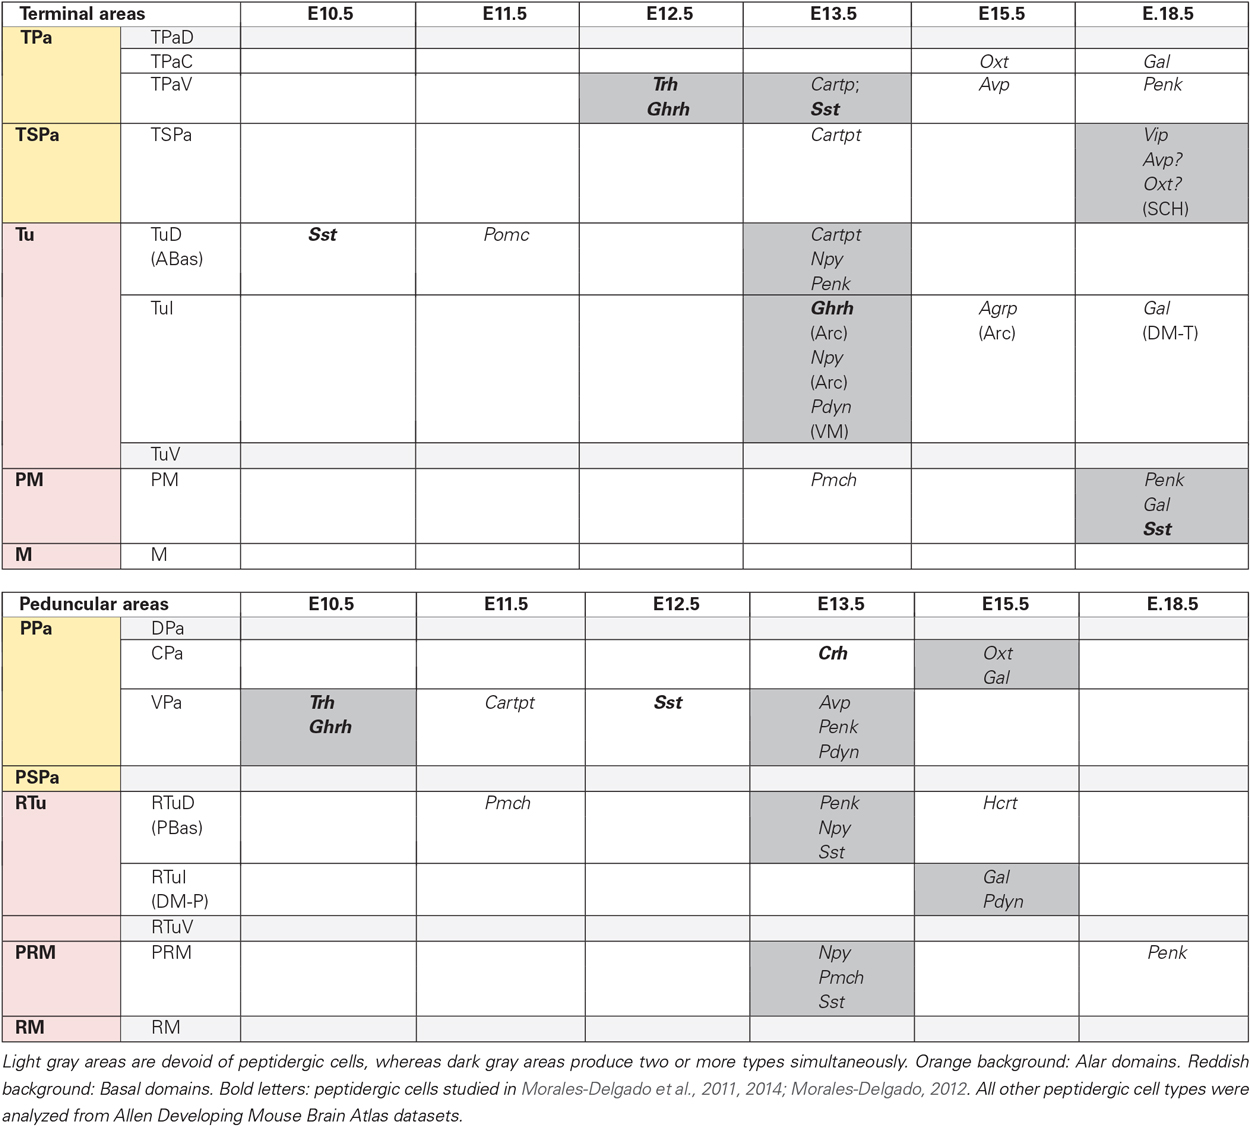
Table 2. Timing of earliest differentiation of the studied peptidergic cell types within particular hypothalamic progenitor areas.
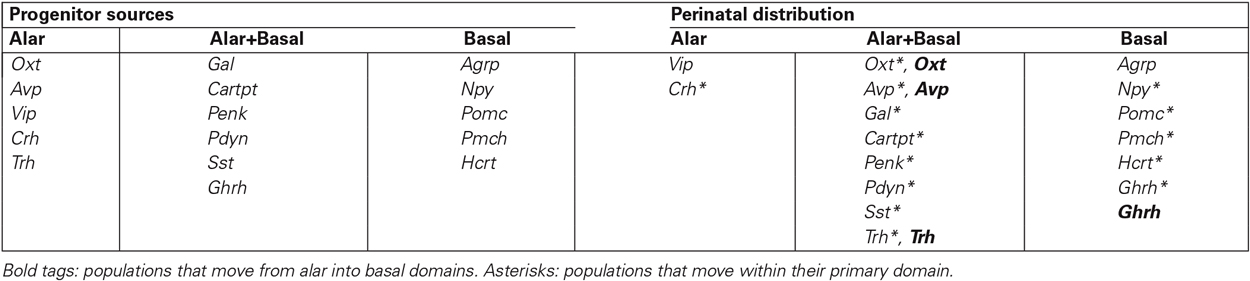
Table 3. Alar/basal topography of the different peptidergic cell populations, according to their primary progenitor sources and their perinatal distribution, after tangential migration.
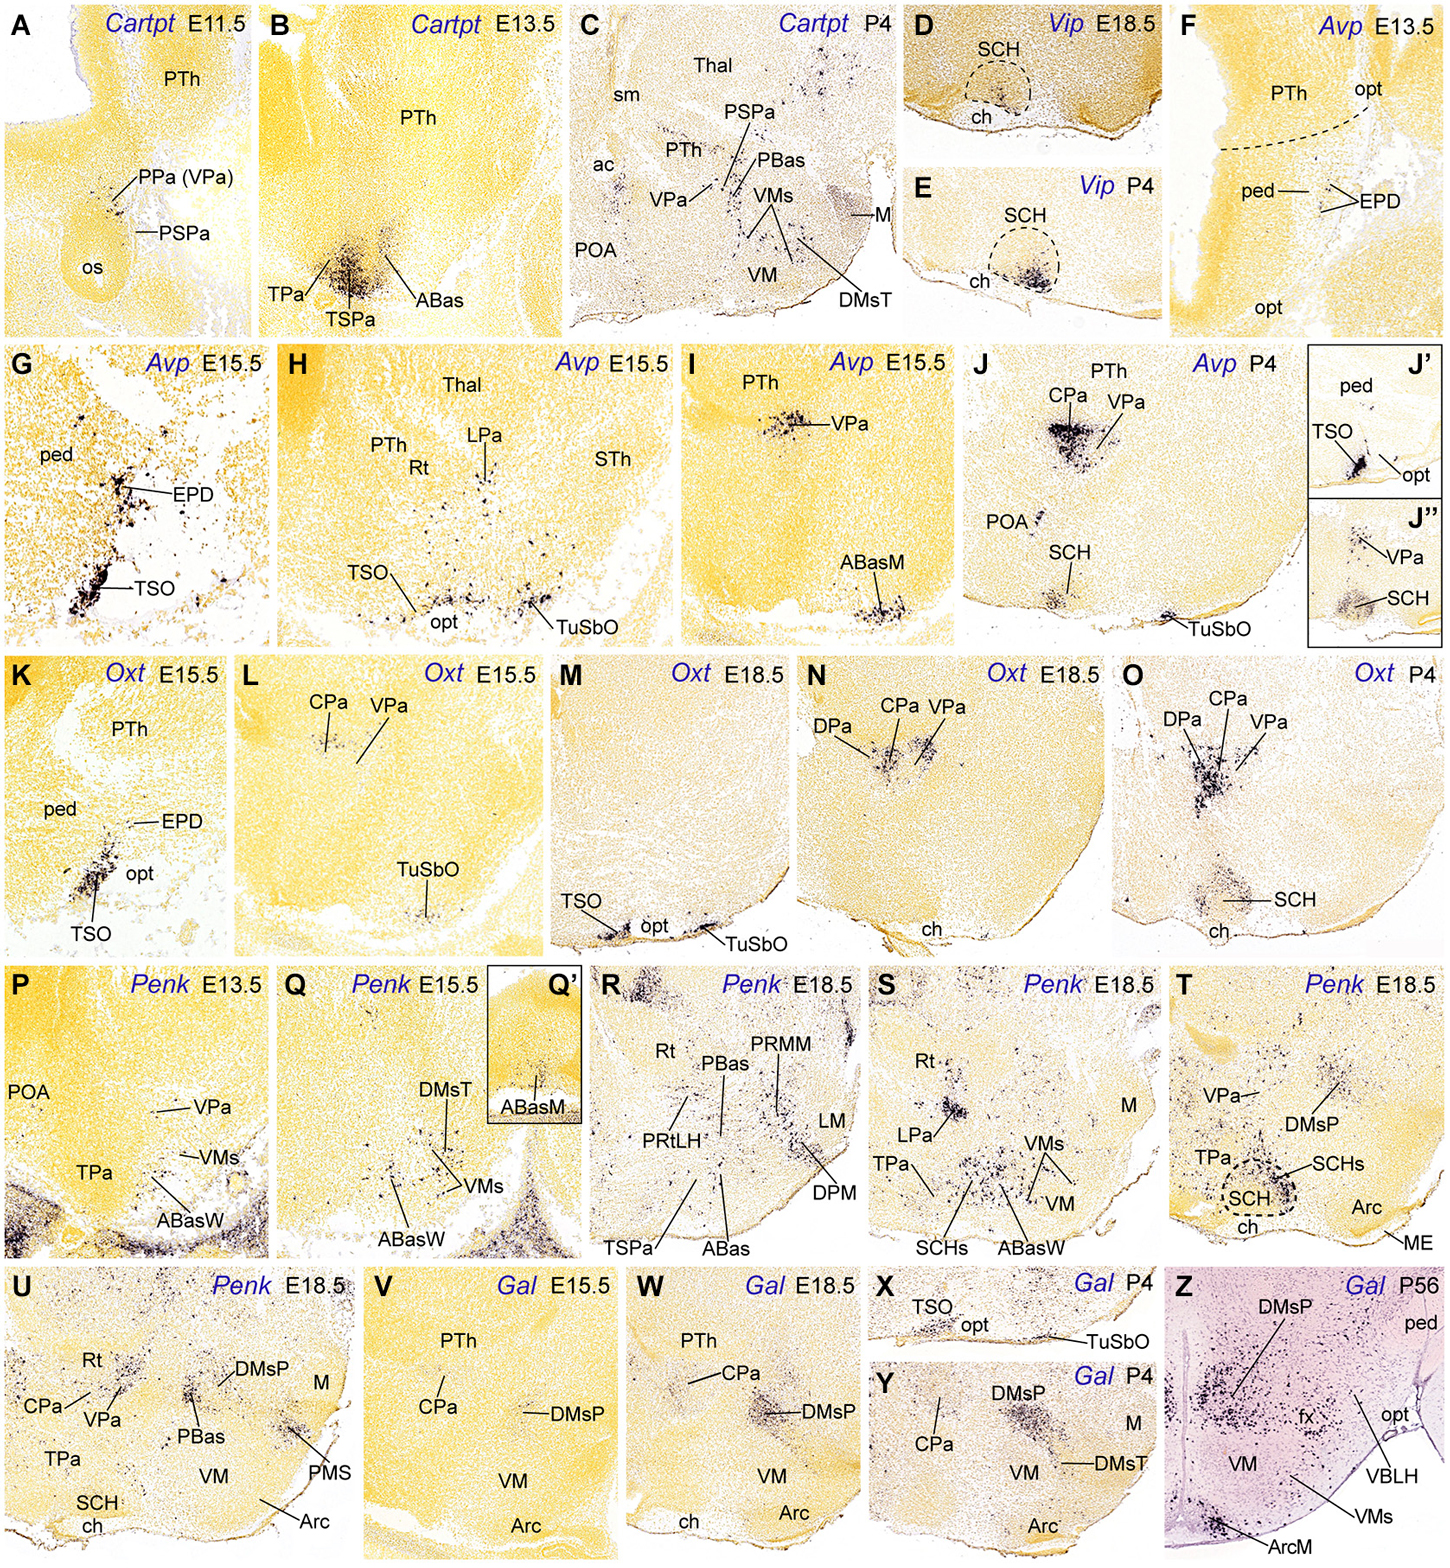
Figure 3. Sagittal sections through the mouse hypothalamus at embryonic and postnatal days (A–Y), plus a transverse section at an adult stage (P56, Z), showing relevant examples of the hypothalamic expression of Cartpt, Vip, Avp, Oxt, Penk and Gal mRNas. (A–C) Cartpt. (D,E) Vip. (F–J”) Avp. (K–O) Oxt. (P–U) Penk. (V–Z) Gal. All images were downloaded from the Allen Developing Mouse Brain Atlas.2 For abbreviations, see the list.
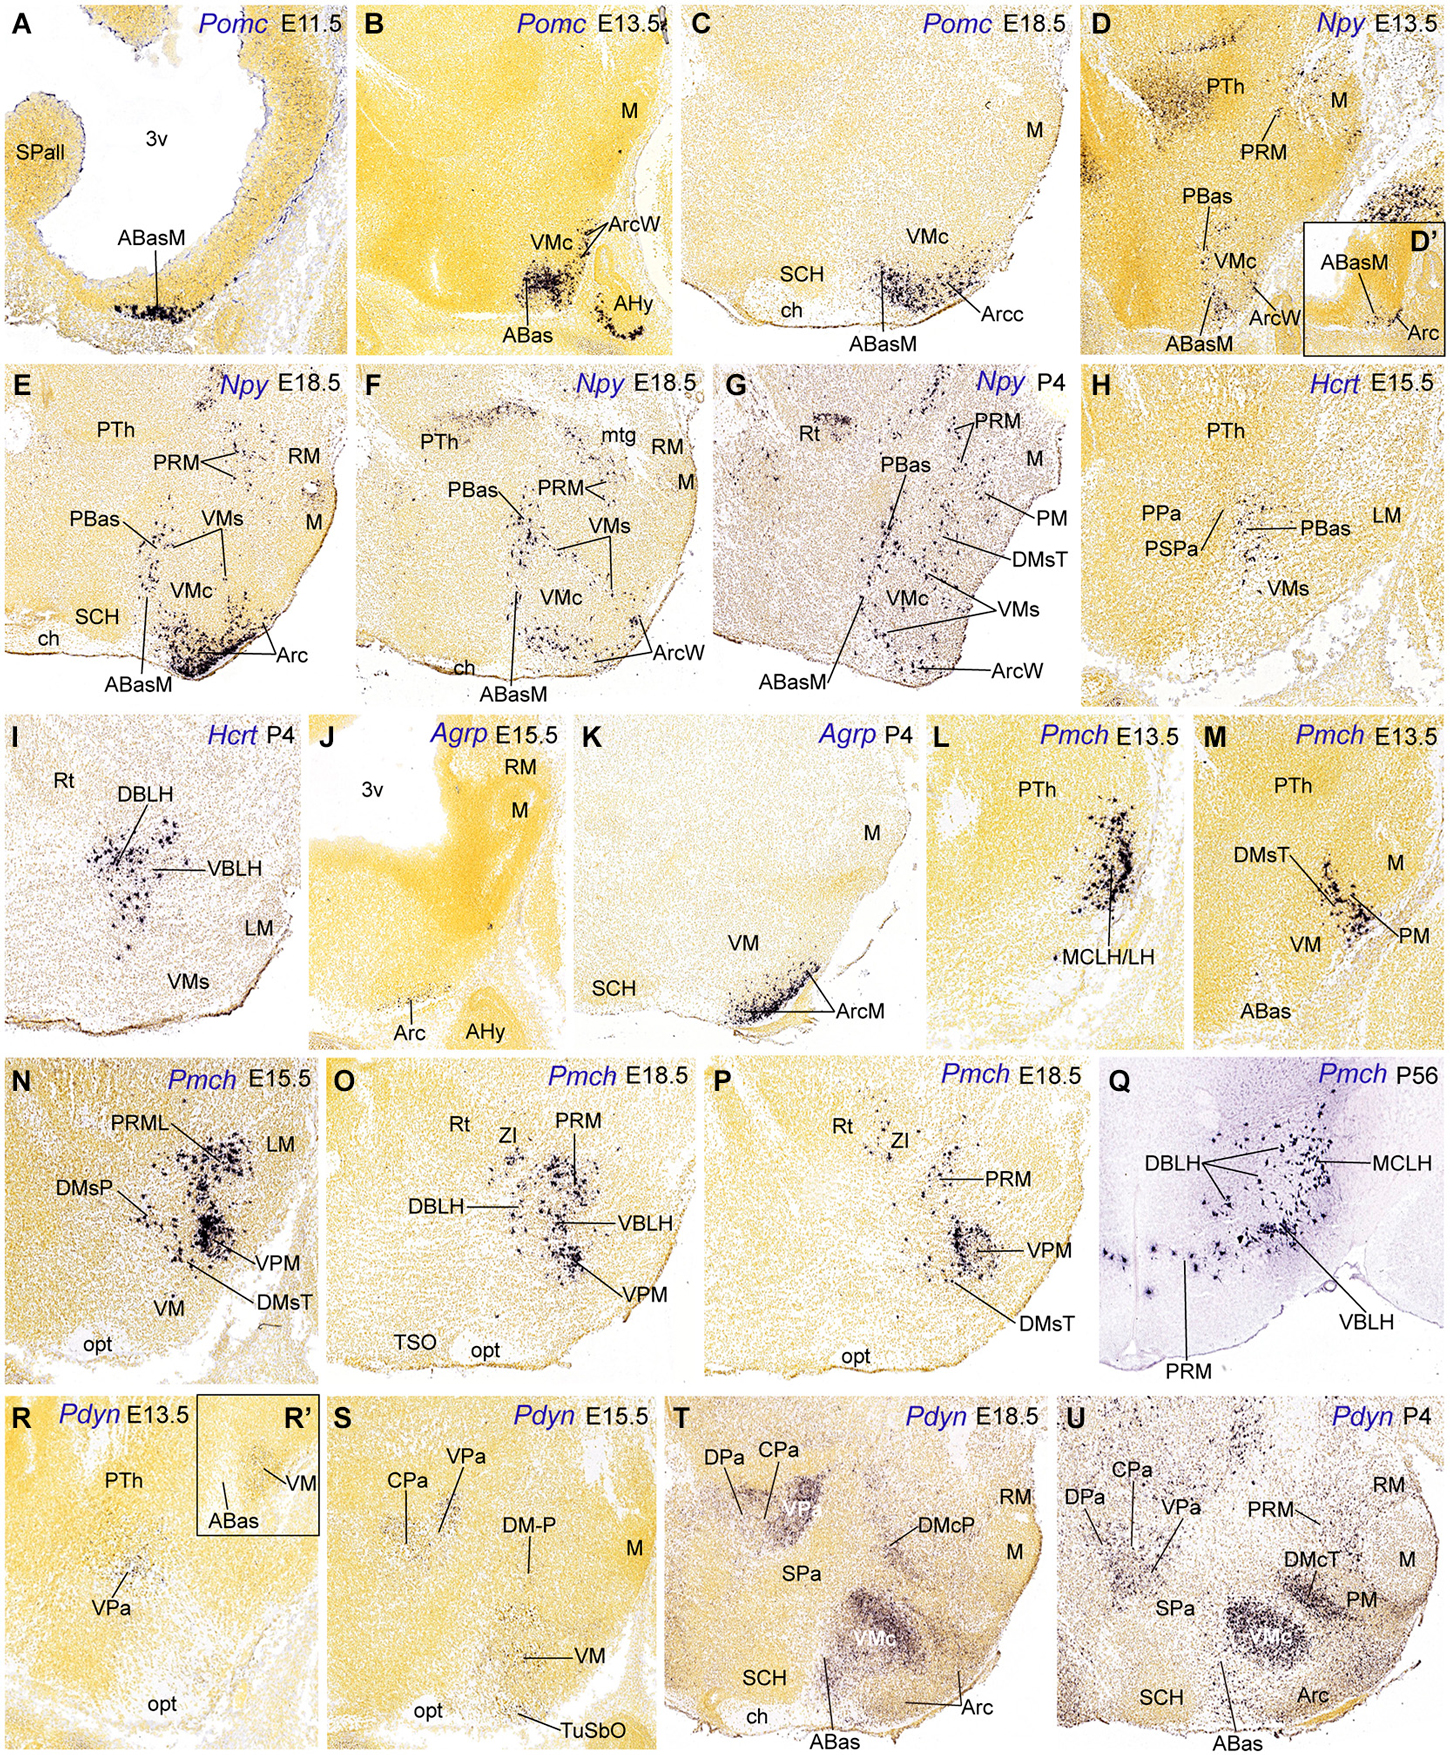
Figure 4. Parasagittal (A–P, D’, R–U, R’) and transverse (Q) sections through the hypothalamus at embryonic and postnatal stages, showing relevant examples of the spatiotemporal expression of Pomc (A–C), Npy (D–G), Hcrt (H–I), Agrp (J–K), Pmch (M–Q) and Pdyn (R–U). All images were downloaded from the Allen Developing Mouse Brain Atlas.3 For abbreviations, see the list.
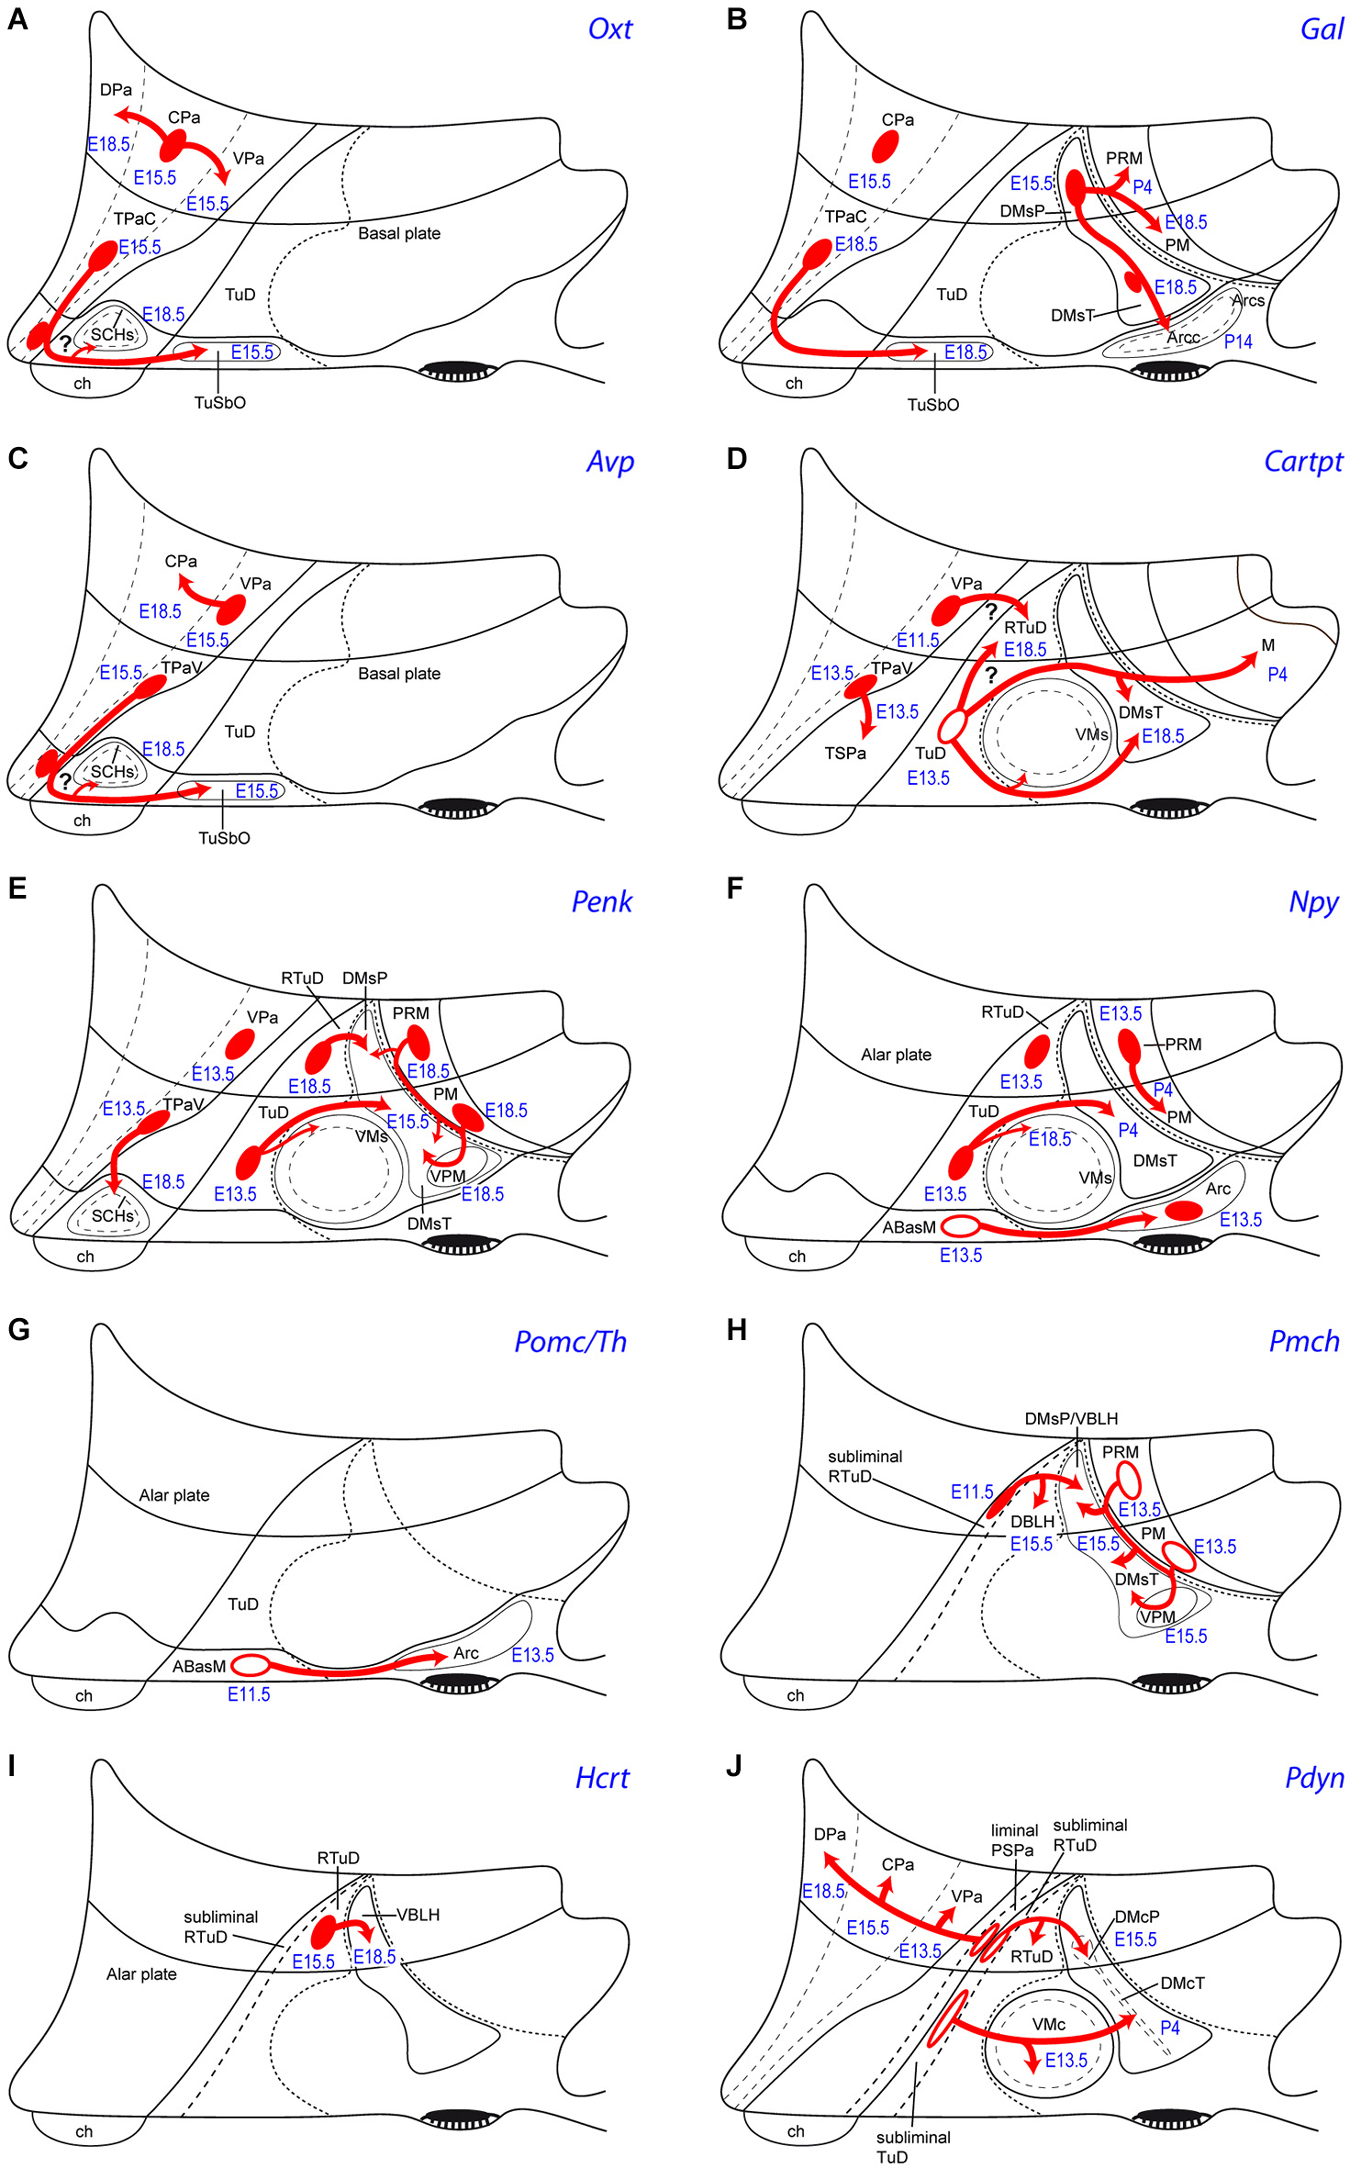
Figure 5. Schemata of the apparent tangential migration routes (red arrows) of the Otx (A), Gal (B), Avp (C), Cartpt (D), Penk (E), Npy (F), Pomc/Th (G), Pmch (H), Hcrt (I) and Pdyn (J) cell populations, highlighting the source areas (red ovals) and the apparent recipient areas (named areas next to arrow tips). Uncertain postulated migrations are indicated with a question mark. Filled red ovals identify progenitor areas where the relevant peptidergic cells persist and accumulate radially (see manuscript for details). Empty red ovals mark instead the progenitor areas whose mapped peptidergic population entirely moves tangentially into the indicated recipient areas (devoid of the cell type in the adult). The schemata also show the recorded embryonic/postnatal stages of first appearance of a particular peptidergic population at its source, as well as at individual recipient areas. For abbreviations, see the list.
Results and Discussion
Figure 2 maps the locations where the different peptide markers listed in Table 1 first appear expressed, adding the results of Morales-Delgado et al. (2011, 2014) and Morales-Delgado (2012). It reveals that given dorsoventrally disposed longitudinal zones dominate as major sources of neuropeptidic populations. These are the Pa area in the alar hypothalamus and the TuD/RTuD and PM/PRM areas in the basal hypothalamus. It is also apparent that multiple peptidergic cell types emerge within these domains, and, remarkably, some cell types appear independently in two or all three of them. A shared characteristic of the molecular profiles of these three areas is the expression of the transcription factor Otp (Figure 1C; Morales-Delgado et al., 2011, 2014; Morales-Delgado, 2012; Puelles et al., 2012). This was already shown to be required for the differentiation of a number of peptidergic cell types (Acampora et al., 1999; Wang and Lufkin, 2000). A few other progenitor domains, such as SCH within the acroterminal part of alar TSPa, and DM-P, DM-T, and Arc within the basal hypothalamus, give rise to other peptidergic derivatives, in a more restricted mode. On the other hand, there are hypothalamic progenitor domains that so far do not represent sources of peptidergic neurons. These results are also represented in tabular form within Figure 2 and in Table 2.
Alar Hypothalamic Sources: the Paraventricular Area
This area consists of a large, triangular peduncular paraventricular subarea (PPa) defined by diverse deep populations of the main paraventricular nucleus (Pa), and a thin terminal paraventricular subarea (TPa), which develops the deep rostral paraventricular nucleus (RPa; the conventional “anterior paraventricular area”, or aPV), and the subpial supraoptic nucleus (PPa; TPa; RPa; TSO; Figure 1A). The main Pa is subdivided into dorsal, central, and ventral parts (DPa, CPa, VPa; Figure 1B). Puelles et al. (2012) showed that the PPa/TPa essentially contains glutamatergic cells.
The paraventricular area originates peptidergic cell types expressing Gal, Penk, Cartpt, Avp and Oxt (present data) as well as Sst, Trh, Ghrh, or Crh cells (Figure 2; Jing et al., 1998; Morales-Delgado et al., 2011, 2014), with timing differences between the peduncular and terminal sectors. Some peptides may coexist in the same neurons (Swanson, 1987). OXT and GAL, e.g., co-localize in neurons of the adult paraventricular and supraoptic nuclei (Landry et al., 1991; see Rossmanith et al., 1996; Foradori et al., 2006; Furutani et al., 2013, and Bartzen-Sprauer et al., 2014 for other examples). As regards its molecular profile, this domain co-expresses Otp and interactive Sim1/Arnt2 genes, within a Pax6-positive and Dlx/Arx/Shh/Nkx2.1-negative background (Figure 1C; Puelles et al., 2012). Mice lacking Otp or Sim1/Arnt2 functions lost the differentiation of OXT, AVP, SST, CRH, and TRH neurons at the paraventricular and supraoptic nuclei, as well as at the RPa (Michaud et al., 1998; Acampora et al., 1999; Wang and Lufkin, 2000; Michaud, 2001; Caqueret et al., 2005). Unfortunately, Gal, Penk, Cartpt and Ghrh cell types were not studied in these reports. Ghrh cells possibly were disregarded because in the adult this phenotype largely seems restricted to the arcuate nucleus. However, Ghrh cells separately originate at the basal Arc area, and the alar peduncular Pa, whose derivatives secondarily invade massively the basal plate (Figure 2; Morales-Delgado et al., 2014). In Otp null mice, Ghrh cells were apparently absent in the basal areas that receive tangentially migrated alar Ghrh elements, while the intrinsic Ghrh cells at the tuberal Arc were not affected.
The topographic and rostrocaudal distribution of Trh-, Ghrh-, Cartpt-, Sst-, Avp-, Penk, Crh-, Oxt- and Gal-expressing cells within the Pa highlights dorsoventral microzonal differences, which are most evident at the main peduncular Pa (DPa, CPa, VPa; TPaD, TPaC, TPaV; Figure 2). The earliest differentiated paraventricular Trh, Ghrh, Cartpt, Sst, Avp and Penk cells are circumscribed to the VPa/TPaV subdomains, whereas the earliest Crh, Oxt and Gal cells appear restricted to the CPa/TPaC subdomains (Figures 3A,B,F,G,I,K,L,P,V; Table 2; see also Morales-Delgado et al., 2011, 2014). Curiously, none of the analyzed peptidergic populations arises primarily in the DPa/TPaD subdomains, though these are secondarily invaded by some of them. A rostrocaudal peculiarity of the distribution of these paraventricular cells is that the peduncular populations (CPa, VPa sources) largely remain close to the ventricle, forming the Pa complex (Figures 3I,J,L,N,O,U–W,Y), though there are relatively more superficial elements in the LPa nucleus (radially superficial to VPa) and in the dorsal entopeduncular nucleus (EPD; interstitial within the cerebral peduncle) (Figures 3F,G,S). In contrast, the terminal paraventricular derivatives (TPaC, TPaV sources) largely eschew the deep RPa (aPV), excepting the Sst cells, which are abundant there, and mostly aggregate instead within the subpial terminal supraoptic nucleus (TSO; Figures 3G,H,J’,K,M,X). Others incorporate into a conspicuous cell stream that migrates early on into the tuberal area, forming the subpial tuberal suboptic nucleus (TuSbO; this new term corrects the misleading one “tuberal supraoptic nucleus”; Puelles et al., 2012), and the related deeper tuber cinereum (TCi) cell population (Figures 3H,J,L,M,X; see TuSbO and TCi in Puelles et al., 2012; their Figures 8.27, 8.32, 8.33).
Trh cells first appear in the VPa at E10.5, and later are found also in the TPaV (E12.5), as well as in the CPa and DPa subnuclei. In the adult rat Trh cells were recently described likewise in the tuberal lateral hypothalamus (Horjales-Araujo et al., 2014). Ghrh cells also have early E10.5 origins in the VPa and appear in the TPaV at E12.5 (Table 2; Morales-Delgado et al., 2014). Some of these Ghrh and Trh elements then move tangentially ventralwards into basal territories, such as the PBas/ABas, the TuSbO nucleus, and the shells of the VM and DM-P nuclei (Morales-Delgado et al., 2014; their Figure 13). Cartpt cells were first identified at VPa at E11.5 (where they persist at P4) and appeared at the TPaV at E13.5 (Figures 3A,B; Table 2). Some peduncular elements disperse into neighboring domains underneath, such as the alar PSPa and the basal PBas (compare Figures 3A,C), while terminal elements seem to migrate into the alar TSPa (Figures 3B, 5D). In newborn mice, Cartpt-expressing cells were described as associated to Lhx6 expression in a population at the ventral part of the PSPa (Shimogori et al., 2010); these might correspond to our migrated Cartpt elements.
Sst cells emerge within VPa at E12.5 and within TPaV at E13.5, where they largely remain visible, though the deep elements of the terminal RPa possibly disperse partly into TPaC and TPaD (Morales-Delgado et al., 2011; Allen Developing Mouse Brain Atlas). Singularly, Avp cells were first observed at the superficial LPa/EPD nuclei (peduncular Pa domain) at E13.5; deeper cells appear at the VPa and TPaV at E15.5 (Figures 3F–I; Table 2). Later, Avp cells move from VPa into CPa, where they subsequently predominate (Figures 3J, 5C; Allen Developing Mouse Brain Atlas), and from the TPaV (E15.5) into the shell of the suprachiasmatic nucleus (SCH) and the TuSbO; in this case, Avp cells nearly disappear from their ventral paraventricular sources postnatally (Figures 3H,J,J”, 5C; Table 2). Penk cells likewise appear in VPa at E13.5 and TPaV at E18.5 (Figures 3P,R); the VPa ones remain at this location thereafter, whereas the TPaV counterparts seem to invade the SCH shell (Figures 3S,T, 5E).
On the other hand, among the peptidergic populations originated at the central portion of the peduncular Pa, Crh cells were first detected there at E13.5 (Morales-Delgado et al., 2014), whereas Oxt and Gal cells made their earliest appearance at E15.5 (Figures 3L,V; Table 2). At the usually retarded TPaC area, similar Oxt cells emerge at E15.5 and Gal cells were seen at E18.5. From E18.5 onwards some peduncular Oxt cells appear also in the VPa (and the LPa cell group, which appears radially displaced relative to the VPa), and other cells seem to enter the DPa (compare Figures 3L,N,O, 5A); terminal Oxt cells become ventrally displaced into the SCH shell and the TuSbO nucleus (Figures 3L,M,O, 5A), jointly with some terminal Gal cells (Figures 3X, 5B). Oxt cells also appeared at the TSO at E15.5, while a less dense Gal cell population was found there from E18.5 onwards (Figures 3K,M,X, 5A,B; Table 2; Jing et al., 1998). The body of terminal paraventricular cells migrating into the TuSbO is observable as a characteristic cellular arch passing dorsoventrally deep to the optic tract, extending from the alar TSO into the basal TuSbO between E11.5 and E13.5. We only illustrate it for Avp cells (Figures 3H, 5C). In the adult hypothalamus, Gal and Crh transcripts in mice (and CRH peptide in rats) are still concentrated mainly at the CPa, with a minority of cells dispersed into VPa and DPa and the cited basal areas; this indicates that migratory dispersion of these elements is limited (Allen Developing Mouse Brain Atlas; compare Figure 10 of Swanson, 1987, and Figure 4 of Simmons and Swanson, 2009; note these authors use the old columnar axis ending in the telencephalon; they accordingly describe as “rostral” and “caudal” our prosomeric “dorsal Pa” and “ventral Pa” positions; Puelles et al., 2012).
We mentioned above that the transcriptional functions of Otp and Sim1/Arnt2 are required for the development of at least some of these paraventricular peptidergic neuron types (Michaud et al., 1998; Acampora et al., 1999; Wang and Lufkin, 2000; Michaud, 2001; Goshu et al., 2004). However, the partially overlapping domains of expression of these genes across the peduncular and terminal Pa area do not seem sufficient to explain the above described dorsoventral dissociation of central and ventral paraventricular progenitor subdomains in the paraventricular complex. Some of these differential effects can perhaps be attributed to the Brain-2 (Brn2), and Sim2 genes, which seem likewise involved in the differential specification of peptidergic cell lineages in this region. See below for data on Sim2. The Brn2 and Sim1 expression domains selectively overlap within the CPa domain at E12.5 and E13.5, whereas VPa only expresses Brn2, and DPa only displays Sim1 signal (Figure 7 of Michaud et al., 1998; note their columnar rostrocaudal axis again corresponds to our prosomeric dorsoventral axis).
The reported observation that Cartpt cells are diminished in number in Sim1−/− mice at E12.5 (Caqueret et al., 2006) is difficult to understand, since these cells apparently originate at the VPa, where Sim1 is not expressed. Moreover, in newborn mice, BRN2 protein co-localizes with Crh-, Avp- and Oxt-expressing cells, which occupy CPa, but not significantly with Trh cells, which are produced at the selectively Brn2-expressing VPa area (Schonemann et al., 1995; Morales-Delgado et al., 2014). These two apparently inconsistent results may be explained by our earlier (Morales-Delgado et al., 2014) and present data indicating that the Trh and Cartpt cells born at the VPa normally migrate into the retrotuberal basal plate. The reported absence of Cartpt cells in the Pa complex of Sim1−/− mice (Caqueret et al., 2006) may be spurious, if these cells were produced normally (no Sim1 normally at the VPa), and simply migrated away. The same interpretive error perhaps occurred with Trh cells with co-localized BRN2 protein, which probably were not searched for where they lie after migration. Moreover, in Brn2-null mice, no Crh, Avp and Oxt cells were detected in the Pa and TSO nuclei, while the Sst and Trh mRNA expression in VPa/TPaV was unaffected (Schonemann et al., 1995).
Conversely, Trh and SST cells coincide with the alar expression domain of Sim2, which is largely restricted to VPa/TPaV, while there is no topographic correlation between the Sim2-expressing domain and Crh-, Avp- and Oxt-positive cells in neonatal mice (Goshu et al., 2004). As expected, the number of Trh and SST cells was reduced in Sim2 null mice, whereas Crh-, Avp- and Oxt-expressing cells were not affected (Goshu et al., 2004).
In summary, the development of Crh, Oxt and Avp cells within CPa seems to occur under control of Otp and Sim1/Arnt2, probably associated to maintained Brn2 expression. In contrast, Trh and Sst cells, and probably also Cartpt cells, emerge in the VPa/TPaV, controlled by overlapping signals of Otp, Brn2 and Sim2 (in absence of Sim1). Unfortunately, no experimental data are available with respect to the possible defects in the distribution of alar Ghrh, Cartpt, Penk or Gal cells in the Otp, Sim1, Sim2 and Brn2 mutants.
Additional spatially restricted signals possibly are also implicated in the fate determination of these and other peptidergic cell lineages in the paraventricular area. For instance, CPa strongly expresses Dickkopf 3 (Dkk3) from E11.5 onwards (see Allen Developing Mouse Brain Atlas), making this transcription factor another candidate bearing on the differentiation of CRH, galanin and/or OXT cells.
Alar Hypothalamic Sources: the Subparaventricular Area
The subparaventricular domain (TSPa/PSPa; Puelles et al., 2012) is primarily negative for Otp/Sim1, and positive for Dlx, Arx, Isl1, Lhx6 and Vax1 (Figure 1C; Shimogori et al., 2010; Puelles et al., 2012); the early expression of Arx is subsequently downregulated, whereas Dlx family signals remain expressed into perinatal stages, associated to the differentiation of gabaergic neurons in the entire domain (Hallonet et al., 1998; Shimogori et al., 2010; Puelles et al., 2012; Allen Developing Mouse Brain Atlas). This domain produces the classic anterior hypothalamus (massively developed at the TSPa, compared to the thin PSPa); the derivatives include the periventricular subparaventricular nucleus, the anterior hypothalamic nucleus, and the acroterminal suprachiasmatic nucleus (Figure 1B; Puelles et al., 2012). The latter selectively shows Vip-, Avp- and Oxt-expressing cells (Figure 2), detected from E18.5 onwards (SCH; Figures 3D,E,J,J’,O; Table 2; Allen Developing Mouse Brain Atlas). Jing et al. (1998) and VanDunk et al. (2011) reported Avp mRNA at the mouse SCH already at E16.5 and E17.5, respectively. At P4, Avp and Oxt cells were more abundant than Vip cells, the latter being restricted to a superficial SCH locus (SCHs; Figure 3T). In the adult, VIP cells largely aggregate at the gabaergic SCH core (Moore and Speh, 1993; Castel and Morris, 2000), while the VP/OXT cells lie within the glutamatergic SCH shell (Silverman and Pickard, 1983; Sofroniew, 1985; VanDunk et al., 2011; Puelles et al., 2012; Allen Developing Mouse Brain Atlas).
Due to its acroterminal topography, the SCH primordium is distinct from its nearby subparaventricular neighbor, the anterior hypothalamic nucleus, in that it selectively expresses Six3, Six6, Rorα and Lhx1, a profile that persists in the adult mouse SCH, with Rorα in the shell and Lhx1 in the core; transient selective expression of Nkx6.2, Fzd5 and Rx occurs as well in this area (Conte et al., 2005; Shimogori et al., 2010; VanDunk et al., 2011; Puelles et al., 2012). Differential programming of neurogenesis at this rostral SPa locus is therefore to be expected. Rorα signal progressively becomes restricted to the SCH shell postnatally, with a distribution overlapping that of Avp/Oxt cells. However, neither Avp or Vip expression was affected in Rorα null mice (VanDunk et al., 2011). With respect to Six3, this gene first appears widely expressed in the rostral neural plate, down to the prospective isthmo/mesencephalic border (Oliver et al., 1995; Bovolenta et al., 1998; Kobayashi et al., 2001; Sánchez-Arrones et al., 2009; Dutra de Oliveira Melo, 2011; VanDunk et al., 2011). Afterwards, Six3 is progressively downregulated at its caudal end; from E11.5 onwards, Six3 appears restricted to the terminal hypothalamic prosomere (hp2; Puelles et al., 2012) (Allen Developing Mouse Brain Atlas; Dutra de Oliveira Melo, 2011; VanDunk et al., 2011). Complete Six3 inactivation stunts the whole rostral prosencephalon (telencephalon and hypothalamus; Carl et al., 2002; Lagutin et al., 2003; Lavado et al., 2008). A recent study using a Nestin-Cre transgenic line to limit floxed Six3 loss to neural progenitors produced unexplained variable results at E15.5–E19.5. Some specimens showed absence of Rorα and Avp expression specifically at the SCH, while Avp expression continued to be present in the neighboring RPa and the supraoptic nucleus (TPa derivatives) (VanDunk et al., 2011).
The recent developmental study of VanDunk et al. (2011) clearly represented a significant advance in our understanding of this specialized area. We argue nevertheless that their columnar descriptions would benefit from a translation into prosomeric terms, in so far as prosomeric theory allows fine dorsoventral and anteroposterior regionalization and description of the hypothalamus, whereas columnar theory does not; that is, there is no precise columnar answer to the question ¿which part of the hypothalamic primordium is occupied by the suprachiasmatic nucleus? In contrast, its position within the prosomeric genoarchitectonic map and the framework of possible signaling mechanisms is clearcut in Figure 1B. In spite of the VanDunk et al. (2011) analysis, the cascade of regulators involved in the local differentiation of Avp and Oxt cell lineages remains unclear (in comparison with the origin of such cells in an Otp-expressing molecular background), and so does the mechanism that segregates Avp/Oxt cells into the SCH shell (whose glutamatergic profile surprises within the SPa); Vip cells unproblematically settle within the SCH gabaergic core. Though VanDunk et al. (2011) concluded there is a single neuroepithelial source for all SCH neurons, experience accrued so far elsewhere in the brain suggests that the same progenitors normally do not produce both glutamatergic and gabaergic cells, leaving apart exceptional observations of neurons displaying both neurotransmitters, whose progenitor mechanisms remain unknown (e.g., Jarvie and Hentges, 2012). Parallel sources for these two components, at the TPa or ABasM, and the TSPa, respectively, should perhaps be considered.
Puelles et al. (2012) conjectured that the vasopressinergic and oxytocinergic cell types (and other glutamatergic cells) of the SCH shell might originate in the suprajacent acroterminal TPa progenitor area, which also expresses Six3, and is characterized by Otp/Sim1/Brn2 expression (plausibly a necessary genetic background for these peptidergic phenotypes; note the underlying ABasM area also expresses Otp in conjunction with basal markers). According to this hypothesis, prospective Rorα, Avp and Oxt shell components might migrate tangentially at early stages from the acroterminal TPa into the subjacent SCH primordium within TSPa (Figures 5A,C). Rorα expression is most dense next to the TPa/TSPa boundary in sagittal sections, and the early Rorα cells form a marginal stratum covering early Lhx1 cells, supporting such a nearby source and migration mechanism (Figures 2B, 4 of VanDunk et al., 2011). The variant hypothesis may be contemplated that prospective SCH Avp/Oxt cells are produced within the TPa, and a combination of Six3 with specific SPa markers (Dlx genes, Arx, Isl1, Vax1) and/or selective SCH regional markers (Six6, Rorα, Lhx1, Nkx6.2, Fzd5, Rx) defines a SCH domain that selectively attracts these Avp/Oxt cells from the TPa into the incipient SCH shell subregion (question marks in Figures 5A,C).
Basal Hypothalamic Peptidergic Cell Sources
As mentioned above, the basal hypothalamus is primarily divided dorsoventrally into the tuberal/retrotuberal (Tu/RTu) and the primary mamillary/retromamillary (M/RM) regions (Figure 1). The Tu/RTu territory is subdivided into dorsal, intermediate and ventral subdomains (TuD/RTuD; TuI/RTuI; TuV/RTuV; Puelles et al., 2012). The TuD/RTuD produces glutamatergic cells for the periventricular anterobasal and posterobasal nuclei (ABas, PBas), plus some intermediate populations such as the nucleus of the TCi, the magnocellular lateral hypothalamic nucleus (MCLH), and several ventralwards migrating populations, including the massive ventromedial nucleus (VM; Puelles et al., 2012); ABas can be further subdivided into acroterminal/median—AbasM- and wing—AbasW- portions. Leaving apart the migrated ventromedial nucleus, the TuI/RTuI contains intrinsic gabaergic populations belonging to the terminal and peduncular parts of the dorsomedial nucleus shell domains (DMsT, DMsP), as well as to the acroterminal arcuate nucleus shell (Arcs); these formations all have glutamatergic core cell aggregates whose presumptive migratory origins are under study (Puelles et al., 2012). In addition, there exists the glutamatergic ventral premamillary nucleus, which migrates from the retromamillary area into DMsT (VPM; Figure 1B; Puelles et al., 2012). The remaining thin TuV/RTuV domain is related to production of the hypothalamic histaminergic neurons (Puelles et al., 2012). On the other hand, the primary M/RM area subdivides into the Otp/Sim1-positive perimamillary/periretromamillary band, and the secondary M/RM complex proper, both of which produce exclusively glutamatergic neurons.
Basal Hypothalamic Sources: the Dorsal Tuberal and Retrotuberal Areas
The acroterminal part of the anterobasal area (ABasM; TuD), where Six3 is selectively expressed, develops an early Otp-positive cell population, some of whose elements differentiate into diverse peptidergic cell types (e.g., Morales-Delgado et al., 2011). Jointly with the peduncular RTuD, the TuD subdomain is characterized molecularly by the expression of general basal markers such as Shh and Nkx2.1, and more restricted expression of other markers such as Vax1, Lmo3, Enc1, Vat1l, and Cnr1 (Figure 1C; Allen Developing Mouse Brain Atlas). A subliminal dorsal section of this domain also expresses Nkx2.2 (Puelles et al., 2012; their Figure 8.14B).
The first peptidergic cell types detected at the ABasM are Sst and Pomc cells, first detected at E10.5 and E11.5, respectively (ABasM; Figure 4A; Table 2; present data; McNay et al., 2006; Morales-Delgado et al., 2011). Cartpt-, Penk- and Npy-expressing cells next appear throughout ABas at E13.5 (ABasM and ABasW; TuD; Figures 3B,P, 4D; Table 2), whereas Pmch cells first appear at E11.5 at the PBas (RTuD; not shown; see Allen Developing Mouse Brain Atlas; Croizier et al., 2011), and Sst, Penk, Npy and Hcrt cells next emerge there between E13.5 and E15.5 (Figures 4D,H; Table 2). The peptidergic cell types mentioned at the ABas differentiate as subtypes within the preexistent abundant population of Otp/Nkx2.1-positive postmitotic neurons, whereas, in contrast, the peduncular PBas area contains few Otp/Nkx2.1 cells (Figures 1C, 2; Morales-Delgado et al., 2014). At subsequent stages, peptidergic cells like those of the ABas appear to invade the subjacent tuberal (acroterminal) arcuate nucleus, as well as the shell of the migrated VM nucleus, which also originates from the TuD area (Figures 5D–G; Morales-Delgado et al., 2011; Puelles et al., 2012). As is further discussed below, we conclude that ABas is the source of these topographically tuberal Sst, Cartpt, Penk, Pomc, and Npy cells (which also are accompanied by migrated Otp-positive cells). In Otp-null mice, cells expressing Sst mRNA or producing SST peptide were absent in the Arc and in an “adjacent area”, probably the VM shell (Acampora et al., 1999; Wang and Lufkin, 2000). It would be interesting to analyze the other peptidergic cell populations originated at ABas/PBas in these mice, in order to check their dependency on Otp expression and function.
The ABas domain expresses additionally Nr5a1 (SF1) at E9.5–E11.5 (Figure 7 of Ikeda et al., 2001), coinciding with the appearance of the earliest Sst and Pomc cells (Table 2; Shimogori et al., 2010; Morales-Delgado et al., 2011). SF1- and POMC-immunoreactive neurons overlap at the acroterminal ABasM at E10.5 (Figure 1C of McNay et al., 2006; these authors identified it as “retrochiasmatic nucleus”, which is a classic synonym for ABas). Subsequently, at 13.5, Nr5a1 (SF1) labels also the AbasW, as well as a VM subpopulation that moves massively ventralwards into TuI (see Allen Developing Mouse Brain Atlas; Puelles et al., 2012). Separately, Pomc labels since E12.5 a parallel dorsoventral migration from the acroterminal ABasM into the acroterminal Arc area (Figures 4B,C, 5G; Shimogori et al., 2010; Puelles et al., 2012; Allen Developing Mouse Brain Atlas). These migrations thus start selectively at the dorsal tuberal ABasW and ABasM subareas, respectively. A number of Cartpt, Sst/Otp and Npy cells accompany both migrations, and thus reach as a common terminus the VM and Arc shell regions (TuI; Figures 3C, 4D’,E–G, 5D,F; Morales-Delgado et al., 2011). In murine Nr5a1 knockout mutants, the distribution of cells expressing NPY, GAL and estrogen receptor α was altered, but the differentiation of these phenotypes was unaffected (Dellovade et al., 2000). The VM nucleus itself appeared subtly altered in this mutant, with partial fading of its normally sharp boundary, allowing some intermixing of peripheral GAD67 cells, as well as disgregated GFP-labeled SF1−/− neurons and redistribution of other components (e.g., ISL1, BDNF, NKX2.1, NPY immunoreactive cells; Dellovade et al., 2000; Tran et al., 2003; Davis et al., 2004). On the whole, these studies suggest that the final topography of the diverse peptidergic or non-peptidergic neuronal types within and surrounding the VM is altered as a consequence of the dismorphogenesis caused by Nr5a1 mutation. It may be speculated that other peptidergic cell types originated at the ABas may be also partially relocated in the Nr5a1-null phenotype.
In the adult rat, NPY cells are generally ascribed to the Arc, plus transient Npy expression at other sites. Our data in the mouse indicate there is in addition early appearance of Npy cells within the ABas and PBas areas at E13.5 (Figures 4D,D’). Subsequently some of these Npy cells migrate into the intermediate tuberal and retrotuberal areas, targeting the Arc and DM nuclei, and the shell of VM (Figures 4E–G, 5F). These migrated elements may correspond with the reported rat dorsomedial, perifornical and lateral hypothalamic Npy cells (Singer et al., 2000; Grove et al., 2001).
Cartpt cells first appeared at ABas at E13.5, with an apparent later expansion of the source into the peduncular PBas, and subsequent dispersion into terminal and peduncular Tu/RTu regions such as the VM shell and the DM shell (Figures 3B,C, 5D), consistently with Koylu et al. (1997), Broberger (1999), Vrang et al. (1999), and Elias et al. (2001). Cartpt cells were first observed at the Arc at P14. We also observed Cartpt-positive cells in the mammillary area from P4 to P56, a localization which was not previously reported (M; Figures 3C, 5D; Allen Developing Mouse Brain Atlas). This late Cartpt cell population may be interpreted either as due to cell dispersion from TuI, with a more dorsal origin (TuD), or as late timing of the expression of the marker.
Mash1 (Ascl1) codes a transcription factor, whose expression generally overlaps and parallels in regional intensity that of Dlx genes (SPa ventricular and mantle zones in the alar hypothalamus, and the ventricular zone of the whole basal Tu/RTu region). In the absence of Mash1 function, a general reduction of cell numbers was observed at the VM and Arc nuclei, affecting the POMC, NPY, GHRH and dopaminergic lineages (McNay et al., 2006). At E10.5 there is already a dramatic reduction in the number of SF1/MASH1 and POMC cells at the ABas, whereas at later stages migrated SF1 (Nr5a1) cells in the VM, as well as migrated NPY cells and intrinsic dopaminergic neurons in the Arc are significantly reduced (McNay et al., 2006). As regards the differentiation of GHRH cells at the Arc, see comments below on requirement of Msh1 and Gsh1 functions.
The early restricted expression of Pomc at the ABasM (acroterminal TuD) without any additional expression at the ABasW and PBas may be related to the local restricted signal of Six3 (or other genes mentioned above) within the acroterminal area. Six3 is reportedly necessary for Shh activation in the terminal hypothalamus (Geng et al., 2008). General basal Shh and Nkx2.1 expression is necessary for the development of the tuberal hypothalamic regions, though, curiously, the ABas itself is not affected in mice lacking Nkx2.1 function, whereas the Arc and VM nuclei are absent or abnormal (Kimura et al., 1996). Moreover, the Neurog3 (Ngn3) gene is expressed selectively at ABas as early as E9.5 (described as “Arc/VM region of the hypothalamus” by Pelling et al., 2011). Mash1 apparently acts upstream of Ngn3 to regulate neurogenesis in the basal hypothalamus (McNay et al., 2006). Pelling et al. (2011) showed in Ngn3-Cre mice that a set of POMC, NPY, TH and SF1 cells originate from Ngn3 progenitors, presumably at the ABas area. This result suggests that the arcuate TH-positive population of dopaminergic cells may also migrate tangentially down from the ABas domain (an idea never proposed before, but presently corroborated by our finding of ABas Th-expressing cells at E11.5 (Allen Developing Mouse Brain Atlas). Moreover, loss of Ngn3 function leads to a significant reduction of POMC cells, combined with an increase of TH and NPY cells (Pelling et al., 2011), implying that this factor promotes the POMC phenotype but represses the NPY and TH fates.
Basal Pmch cells were already present superficially at E11.5, restricted to the subliminal dorsal retrotuberal PBas area (not shown; Allen Developing Mouse Brain Atlas); we identified this population according to Puelles et al. (2012) as the conventional magnocellular lateral hypothalamic nucleus (MCLH; Figure 4L); similar cells were included in the lateral hypothalamus by Croizier et al. (2011). Additional PBas Pmch cells later disperse between E15.5 and P4 within the dorsobasal and ventrobasal sectors of the lateral hypothalamus, deep to the lateral forebrain bundle (see these sectors in Puelles et al., 2012; their Figure 8.32), deep to the migrated subthalamic nucleus. Some of these elements also invade the DM-P shell and the dorsobasal/ventrobasal perifornical nuclei (MCLH, LH, DBLH, VBLH; Figures 4N–P, 5H; see P56: Figure 4Q).
The Pmch cells found in the adult rat lateral hypothalamus, including the MCLH, were labelled by acute BrdU at E10-E11 (Brischoux et al., 2001; Croizier et al. (2011). The latter authors mapped the earliest MCH neurons in rat embryos, compared their positions with relevant regional molecular markers (emphasizing their origin within a Nkx2.2/Nkx2.1/Shh-positive band), and studied the course of their efferent axons. We are essentially in agreement with their primary data, but qualify the interpretation given by these authors about the molecular environment of the early Pmch cells. This is partly because we use the more elaborated model of molecularly distinct progenitor domains reported by Puelles et al. (2012), which was not available to these authors. Croizier et al. (2011) convincingly showed in E14 rat embryos that the early Pmch cells occupy a restricted posterior sector of the classical longitudinal hypothalamic cell cord, which is formed by precociously differentiating basal neurons (Gilbert, 1935; Keyser, 1972; His, 1892; see also Puelles et al., 1987, 2014). Consistently with this interpretation, this band expresses Shh and Nkx2.1 (typical overall basal plate markers), as well as Nkx2.2 (an early longitudinal marker expressed across the alar-basal boundary, thus labeling a subliminal part of the hypothalamic cell cord, as well as a liminal part of the overlying subparaventricular area in the alar plate; Figure 1A; Puelles and Rubenstein, 2003; Puelles et al., 2004, 2012; Figure 8.14B of the 2012 reference). Within our model, the basal subliminal band falls specifically within the TuD/RTuD progenitor area. The restricted peduncular position of the early Pmch cells, corroborated by our present mouse results, jointly with the molecular environment provided by Croizier et al. (2011), is consistent with a subliminal PBas (RTuD) origin, a site with selective expression of Lhx9 (Figures 1, 5H; Shimogori et al., 2010).
However, Croizier et al. (2011) assumed that the early basal cell cord is identical with the “intrahypothalamic diagonal” of Shimogori et al. (2010), thinking it correlates with the longitudinal band that expresses Nkx2.2. This interpretation seems wrong in two ways. First, the Nkx2.2 band has alar and basal parts (as contemplated in Puelles et al., 2004, 2012), and the differentiating MCH cells are restricted to the basal component, as was clearly indicated by the overlapping expression of basal markers such as Shh and Nkx2.1 (Croizier et al., 2011; their Figures 3K–P). Second, these authors apparently misinterpreted the description of the molecular profile of the intrahypothalamic diagonal given by Shimogori et al. (2010), insofar as these authors did not identify their diagonal area as expressing Shh and Nkx2.1. The intrahypothalamic diagonal is the distinct alar longitudinal SPa territory that overlies the basal hypothalamic cell cord (TuD/RTuD); it expresses Dlx/Arx/Vax1/Isl1 transcripts and some Lhx genes, but lacks significant Shh or Nkx2.1 signal (Shimogori et al., 2010; Puelles et al., 2012; Figure 1C). A ventral part of this area—the liminal SPa subarea- shows Nkx2.2 signal on top of the cited molecular profile (Puelles et al., 2012; see their Figure 8.14B). The Pmch cells clearly lie under it (Croizier et al., 2011; their Figures 3K–P), within the underlying Nkx2.1/Nkx2.2-positive subliminal TuD/RTuD basal domain, which corresponds to the true hypothalamic cell cord.
Hypothalamic Hcrt/orexin cells also differentiate selectively within the peduncular dorsal retrotuberal region, though later, at E15.5 (Figures 2, 4H). We think that this occurs specifically within the ventral PBas subarea that does not express Nkx2.2 (present data). Progressively, most Hcrt/orexin neurons disperse radially and tangentially into the (retrotuberal) ventrobasal sector of the lateral hypothalamus, where Nkx2.2 is not expressed (VBLH; Figures 4H,I, 5I; compare Figure 8.29 of Puelles et al., 2012), though some remain more dorsally, within their source area PBas. In the adult rat brain, Hcrt cells were found just rostral to the zona incerta, within the “lateral and dorsal hypothalamus” and the “perifornical nucleus” (Peyron et al., 1998; their Figures 3, 8 and 14; compare Figure 1). This location lies just dorsally to our PRM area, pinpointing the RTuI, or ventrobasal, part of the LH. The singularity of PBas as a cell source, as opposed to the terminal ABas domain, might be due to its distinctive genoarchitectonic properties, such as the lack of Nr5a1 expression (Puelles et al., 2012; present data) and the coincidence with selective Lhx9 expression (Shimogori et al., 2010). The latter authors reported that Lhx9 is co-expressed with Hcrt and partially also with Gal cells in newborn mice. In conditional Shh mutant mice in which Shh was selectively abolished in the basal hypothalamus, the entire Tu/RTu region was very reduced, and Hcrt cells were not detected (Szabó et al., 2009); on the whole, this supports our conclusion of a restricted basal Hcrt source at the ventral part of PBas. In contrast, Zhao et al. (2008) suggested an alar prethalamic origin of at least some Hcrt cells, based on the presence of a few LH hypocretin /orexin-expressing cells that coincide with Foxb1-derived progeny in newborn mice. This possibility needs additional analysis, since it postulates both a caudorostral (prethalamo-hypothalamic) and dorsoventral (alar-basal) translocation of such cells, which would need to be distinguished from alternative Foxb1-derived progeny potentially produced at the basal mamillary domain, some of which move into periretromamillary positions, just under the VBLH (Zhao et al., 2008).
Basal Hypothalamic Sources: the Intermediate Tuberal and Retrotuberal Areas
This section centers on the arcuate and dorsomedial domains. The tuberal arcuate nucleus, an acroterminal basal locus characterized by overlapping Nkx2.1/Dlx/Six3 markers, combined with early downregulation of its initial basal Shh expression (Manning et al., 2006), is an important source of some peptidergic neurons, such as Ghrh (Morales-Delgado et al., 2014) and Agrp cells (present data). We postulated above that the adult local dopaminergic (Th), and Pomc cell types originate more dorsally at the Ngn3-expressing ABas domain (ArcM, ArcW; Figure 5G; Pelling et al., 2011). It is less clear whether Npy cells are included in the same migratory pathway. Such cells do appear first at the ABas area, and later at the Arc. It was established that most adult POMC cells are not gabaergic cells (consistently with the postulated ABas origin), whereas a majority of NPY neurons are gabaergic, which suggests instead a local Arc origin, though they may be complemented with some migrated cells (Horvath et al., 1997; Ovesjö et al., 2001; Hentges et al., 2004; Puelles et al., 2012). Significantly, about one quarter of the mature NPY neurons in the Arc share a common progenitor with POMC cells (Padilla et al., 2010). Accordingly, two subgroups of Arc NPY cells probably exist: 25% is glutamatergic, originated at the Ngn3/Nr5a1/Six3-positive ABas locus, and a majority (75%) gabaergic population is generated within the Arc, in clear correspondence with local Dlx and Gad67 expression (Yee et al., 2009; Puelles et al., 2012; Figure 5F).
Dispersed Ghrh cells first appear at E13.5 at the wing (non-acroterminal) part of the arcuate nucleus, extending later into the median acroterminal Arc (ArcM) where they form an important Ghrh cell population (ArcW, ArcM; Table 2; Morales-Delgado et al., 2014; Allen Developing Mouse Brain Atlas). On the other hand, Agrp cells first develop at the median part of the arcuate nucleus (ArcM) somewhat later, from E15.5 onwards. Agrp cells thereafter remain fully restricted to the Arc during postnatal development (Figures 4J,K; Nilsson et al., 2005). Some of the genes expressed at the Arc locus, such as Six3, Nkx2.1, Mash1, Hmx2, Hmx3, Gsh1, Aldh1a2, and Isl1 were implicated in the differentiation of GHRH cells. Nkx2.1 is expressed throughout the mantle of the hypothalamic basal plate at prenatal stages, and conditional Nkx2.1 mutants are defective in the Arc derivatives (Mastronardi et al., 2006). The NKX2.1 transcription factor acts upstream of Mash1, Hmx2/Hmx3 and Gsh1 (Caqueret et al., 2005). Mash1 and Hmx2/Hmx3 control of Gsh1 expression, which is required for the specification of GHRH neurons (Wang et al., 2004; McNay et al., 2006). Unfortunately, these studies did not explore the role of those genes in the differentiation of Agrp cells. Interestingly, Agrp cells were unaffected in null mutants of Ngn3 (Arai et al., 2010), a transcript restricted to ABas, consistently with their apparent Arc origin.
Caudal to the Arc, the intermediate Tu/RTu subregion shows the mutually similar DM-T and DM-P areas, which share Shh, Dlx, Nkx2.1, Isl1, Cnr1, Peg10 and Lef1 expression, in absence of Lhx9/Lhx6 signals (DM-T, DM-P; Figures 1B,C). Both DM portions (as well as the Arc) are subdivided into core (glutamatergic) and shell (gabaergic) portions; the core cells were suspected of migrating into these areas from a neighboring origin, probably the TuD/RTuD, whereas the gabaergic shell elements are intrinsic, consistently with local Dlx family genes and Gad67 (Puelles et al., 2012).
Interestingly, the DM-P domain is a major source of Gal cells; the latter were first identified there at E15.5 (Figure 3V; Allen Atlas data). Similar early Gal cells were reported to appear in a vaguely defined “precursor hypothalamic region” at E16 in the rat, which we estimate to be peduncular and retrotuberal (RTuI) in topography (Figure 1A of Gundlach et al., 2001). Starting at E18.5, a less important Gal population appears likewise at the DM-T area, jointly with a possibly migrated perimamillary subpopulation (not shown; see Allen Atlas data). Postnatally these cells concentrate at the DM shell domains (Puelles et al., 2012), a pattern that suggests a local origin within TuI/RTuI and a gabaergic nature (DMsP, DMsT, Figures 3V,W,Y,Z, 5B; Table 2; Puelles et al., 2012). Additional Gal cells appear at the Arc and the ventrobasal lateral hypothalamus postnatally (VBLH; Figures 3Z, 5B; compare Melander et al., 1986). This suggests partial migratory dispersion of DM-P/DM-T Gal cells into the PM, Arc and VBLH areas (Figure 5B).
Basal Hypothalamic Sources: the Perimamillary and Periretromamillary Areas
Another basal progenitor domain producing peptidergic cell types is the arc-shaped perimamillary/periretromamillary area (PM/PRM), which lies ventral to the linear Nkx2.1/Dlx/Arx/Lhx6/Wnt8b-expressing TuV/RTuV domain (tuberomamillary terminal of Shimogori et al., 2010), where histaminergic neurons selectively originate (Puelles et al., 2012; Figure 1C). The PRM/PM area represents a domain with precocious neurogenesis, comparable in this regard to the hypothalamic cell cord (TuD/RTuD; see Puelles et al., 2014). It is molecularly distinct from the retarded retromamillary and mamillary areas by its selective expression of Otp and Sim1, in curious parallelism with the alar paraventricular area (Figure 1C; Puelles et al., 2012). Sst, Penk, Npy and Pmch phenotypes seem to originate from both the peduncular (PRM) and terminal (PM) subdivisions of this domain, in each case with a particular temporal sequence (Figure 2; Table 2; Morales-Delgado et al., 2011). It is unclear whether the PM/PRM Gal cells interpreted above as migrated from the DM-P area might originate instead locally (this point can be decided by examining their gabaergic vs. glutamatergic nature, since PM/PRM produces only the latter type; Puelles et al., 2012). Sst and Npy cells appeared selectively at the PRM at E13.5 and were detected only at E18.5 and P4, respectively, within the PM; this delay raises the possibility of their tangential translocation from PRM into PM (Figures 4D–G, 5F; Table 2; Morales-Delgado et al., 2011; Morales-Delgado, 2012). Penk cells were not found at E15.5, but were already well represented at both PRM and PM at E18.5 (Figure 3R), which suggests an earlier appearance. At the later stage, as well as postnatally, the medial PRM nucleus (PRMM; Figure 3R) and the dorsal premamillary nucleus (DPM; Figure 3R; this is the main PM derivative) show massive Penk cell populations, and additional Penk cells were found at a previously undescribed rounded perimamillary cell aggregate superficial to the DPM, named here superficial perimamillary nucleus (PMS; Figure 3U; see also the Allen Developing Mouse Brain Atlas, transversal P56 series [64881286], section 61, for DPM and PMS). The neighboring ventral premamillary nucleus (VPM) also contains Penk-positive cells; however, it lies in the TuI area, intercalated between the ventromedial nucleus and the PM band (not shown; see the P56 Allen image cited above). Though these tuberal cells might have a different, more dorsal basal origin (see above results on ABas/PBas Penk cells), we mention them here because of the possibility that these VPM cells may have migrated either from the underlying PM area or from the more distant PRM area, accompanying the migration of RM cells into VPM (Figure 5E; Puelles et al., 2012).
Medial hypothalamic Pmch cells were also clearly identified along the characteristic PRM/PM band from E13.5 onwards (Figures 1, 2, 4M–P; Table 2). A neighboring Pmch cell group forms a shell around the migrated ventral premamillary nucleus (TuI area) from E15.5 onwards (VPM; Figures 4N–P). Remarkably, at postnatal stages few Pmch cells remain visible at the PRM/PM locus, suggesting an earlier translocation into the suprajacent TuI/RTuI areas, mainly the DM-P and DM-T nuclei, as well as the mentioned VPM shell neighborhood, where they increasingly become visible (Figures 4N–P, 5H). The PRM/PM Pmch cells seem unrelated to the more dorsal and precocious ones described above, which contribute to the MCLH and LH populations (see Figures 4Q, 5H). While Croizier et al. (2011) did not identify this separate set of PM/PRM MCH cells, (Brischoux et al. (2001); their Figure 5E; compare with our Figure 1) showed a drawing of a sagittal section, in which rat Pmch cells at E18.5 clearly occupy a band that does not agree in shape and position with any part of the basal hypothalamic cell cord (TuD/RTuD), but agrees with our PRM/PM area.
Otp and Sim1/2 are potential key genes in the differentiation of the mentioned PRM/PM peptidergic lineages, since they are selectively co-expressed very early at this locus (supplementary figures of Shimogori et al., 2010; Morales-Delgado et al., 2011, 2014; Puelles et al., 2012; Allen Developing Mouse Brain Atlas); however, this hypothesis was not tested so far. Other genes expressed at the PRM/PM domain, such as Shh, Nkx2.1, Pou3f3 (Brn1), Ebf3 and Peg10 (Figure 1C), might be also involved in the neurogenesis and/or differentiation of the peptidergic cell types originated in this territory.
Prodynorphin Progenitor Areas
We also studied Pdyn cells, which may be a singular case of delayed appearance of the peptidic marker expression in neurons that previously migrated tangentially. Pdyn cells first appear at E13.5 within the alar VPa area (peduncular hypothalamus); later they invade the overlying CPa and DPa areas at E15.5 and E18.5, respectively (Figures 4R–U, 5J; Table 2). Basal Pdyn-expressing cells were first observed at the DM-P and migrated (terminal) VM from E13.5 onwards, and at the DM-T at P4 (Figures 4R’,S–U, 5J). At perinatal stages, the basal elements became progressively concentrated within the core domains of these nuclei, known to be glutamatergic (e.g., VMc; DMcT in Figures 4T,U). Puelles et al., 2012 argued that there might be a relationship of Pdyn cells with Nkx2.2-expressing immature migrating elements, which all arise from the longitudinal band mentioned above, which overlaps the alar-basal boundary; this band divides into a liminal alar sub-band and a subliminal basal sub-band, whose derivatives co-express differential alar vs. basal gene markers (Figures 1A,C, 2). Puelles et al. (2012) showed that, from E10.5 onwards, peduncular liminal Nkx2.2-positive neurons selectively migrate dorsalwards into the VPa nucleus, from where some of them later move into the LPa, CPa and DPa nuclei. This sequential pattern recalls our present data on early peduncular Pdyn cells, though these are first detected at the VPa at E13.5, and not at the Nkx2.2 band (Table 2). If they are identical with the earlier migrating Nkx2.2-positive cells, then they apparently start to express Pdyn in a delayed manner, after their initial migration into VPa ends. In that case, their proper origin would not be the VPa area, but the underlying liminal PSPa subarea (Figure 5J). Co-expression and lineage studies are needed to resolve this issue; Nkx2.2 continues being expressed in the paraventricular complex even in the adult mouse (Puelles, unpublished observations). It is also relevant to check the potential gabaergic vs. glutamatergic phenotype of these Pdyn cells, since local VPa cells are expected to be glutamatergic, whereas PSPa cells are held to be gabaergic (Puelles et al., 2012, note their Figure 8.18 shows gabaergic cells at the VPa and DPa nuclei).
On the other hand, terminal subliminal (basal) Nkx2.2-positive cells (from the upper TuD area) migrate between E13.5 and E15.5 ventralwards into the VM nucleus, constituting one of its diverse migrated subpopulations (Puelles et al., 2012; their Figure 8.26 and text; Figure 5J). In this case, we see Pdyn cells emerging at the VM locus at E13.5 (Figure 4R’), possibly representing migrated subliminal Nkx2.2 cells that again express the peptidic marker in a delayed manner, after migration. This interpretation is supported by the fact that all other known populations of the VM migrate from the overlying TuD area. Accordingly, the latter may be suspected to be the true origin of these VM Pdyn cells.
The Pdyn cells emerging at the DM-P may correlate likewise with peduncular subliminal Nkx2.2-positive cells (from the upper RTuD area), since some of them also migrate ventralwards a short distance into the DM-P area at E14.5 (Puelles et al., 2012; their Figure 8.26F). This is where we saw Pdyn cells at E15.5, possibly again due to delayed differentiation (Figure 4S; Table 2). Unfortunately, the Allen Atlas lacks clearcut data on Nkx2.2 expression at this locus at later embryonic stages (few labelled cells appeared at the DM-P locus at E18.5), or postnatally (no significant signal). Contrarily, Pdyn cells become increasingly visible postnatally at the TuI/RTuI area, largely aggregated within the developing core portions of the DM-P and DM-T nuclei, as shown here at E18.5 and P4 (Figures 4T,U, 5J; note that due to its obliquity at 45 degrees relative to the ventricle, the DMcP appears in more lateral sections than the DMcT, which is parallel to the ventricle). We likewise lack evidence that any Nkx2.2-expressing cells invade the TuI area where the DMcT Pdyn cells emerge postnatally. In defense of the migratory hypothesis, it may be conjectured that migration of such cells into the DM areas might imply downregulation of Nkx2.2 before the Pdyn signal appears. Lineage studies are thus needed to test our conjecture that Pdyn cells derive systematically from either alar or basal Nkx2.2-espressing progenitors. Note the potential origin of the DM Pdyn cells at the overlying TuD/RTuD area would explain their glutamatergic phenotype within the gabaergic DM shell environment (Puelles et al., 2012).
Conclusive Comments
Table 2 summarizes our findings about the earliest topography of the different hypothalamic peptides, separated into terminal and peduncular progenitor areas. We subsumed under the terminal progenitor domains the rostral specialized acroterminal areas (Figure 1B; Puelles et al., 2012), which nevertheless show some independent behavior (e.g., SCH, Arc, as indicated in parentheses in Table 2).
1. Peptidergic neurons (PN) originate independently in many areas: It is readily apparent that peptidergic neurons originate independently in many areas of the terminal and peduncular parts of hypothalamus, across both alar and basal territories.
2. The same PN type can originate in two or more separate areas: Importantly, the same peptidergic type (with the caveat that cells expressing a given peptide may represent different cell types if they co-express differentially other markers) can be produced separately in two or more alar and/or basal areas (another caveat is that whenever adjacent areas show the same cell type in a close temporal sequence the issue is raised whether the retarded area was invaded by cells from the other).
3. Not all progenitor areas generate PN: In any case, peptidergic cell production doesn’t seem to be a general feature of the whole hypothalamus, since some alar and basal progenitor areas did not produce any of the studied cell types (areas marked with a light gray background; Table 2).
4. Most PN-producing areas generate several types sequentially: An interesting feature is that most progenitor areas that do produce peptidergic neurons generate several types over time (left to right in Table 2); however, in some cases this pattern is an artefact of our simplified table, since the varied cell production occurred in distinct subareas; for instance, at the TSPa area, the early Cartpt cells appear aligned with the prospective anterior hypothalamic nucleus, whereas the later Vip, Avp and Oxt cells emerge at the neighboring acroterminal suprachiasmatic nucleus; moreover, the Avp/Oxt types have a question mark in Table 2, because we suspect these elements may come from the overlying TPa area (see text above). A sequential pattern nevertheless is truly present in other areas; this implies a general fate regulatory mechanism that is heterochronic and position-sensitive (i.e., at a given locus, different cell types are generated over time); moreover, the same cell type may differentiate sooner or later in different areas.
5. One single progenitor area can generate simultaneously 2 or 3 types of PN: A repeated special case is represented by the results indicating simultaneous production of two or more peptidergic cell types at given areas, mostly from E13.5 onwards (items marked with a darker gray background; Table 2). We conjecture this implies the existence of an additional salt-and-pepper regulatory mechanism, probably residing in the postmitotic neurons (via mutual lateral inhibition).
6. No PN migrate from basal to alar: In general, the basal plate seems to attract several alar populations, whereas there are no cells moving from basal into alar domains. The latter conclusion is consistent with data on Shh lineage reported by Alvarez-Bolado et al. (2012), who noted restriction of migrated basal derivatives to the basal plate territory.
7. The sequential topography of most PN can be parsimoniously explained by the hypothesis of tangential migration: We grouped in Table 3 the cell types according to their single or mixed alar vs. basal origins (this does not exclude common aspects in the respective molecular backgrounds). This table also shows the respective topographies of these cell populations mapped at perinatal stages, highlighting in bold the cell types that apparently moved from alar origins into basal positions, and marking with an asterisk the populations that apparently moved tangentially within their original alar or basal territories. We conclude that most hypothalamic peptidergic populations can be postulated to migrate tangentially, with few exceptions (e.g., Vip, Agrp and some Npy cells). For clarity, the deduced tangential migrations are each illustrated graphically in Figure 5, indicating the main tangential targets and the respective timings. These migration hypotheses will no doubt be subjected to experimental testing in the near future.
Conflict of Interest Statement
The authors declare that the research was conducted in the absence of any commercial or financial relationships that could be construed as a potential conflict of interest.
Acknowledgments
This work was funded by the Local Government of Castilla-La Mancha grant PII1I09-0065-8194 to CD, the Spanish Ministry of Economy and Competitiveness grant BFU2008-04156 and the SENECA Foundation 04548/GERM/06 (no. 10891) to LP. Infrastructure support provided by the University of Castilla-La Mancha and the University of Murcia is also acknowledged.
Abbreviations
3v, Third ventricle; A/B, Alar-basal boundary; ac, Anterior commissure; ABas, Anterobasal nucleus; ABasM, Median acroterminal ABas; ABasW, Wing (terminal) portion of ABas; Agrp, Agouti-related peptide; AH, hypothalamic nucleus; AHy, Adenohypophysis; Arc, Arcuate nucleus; Arcc, Core portion of the Arc; ArcM, Median acroterminal arcuate nucleus; Arcs, Shell portion of the Arc; ArcW, Wing (terminal) portion of Arc; Avp, Arginin-vasopressin; ATB, Acroterminal border; BFB, Basal-floor boundary; Cartpt, Cocaine- and amphetamine-regulated transcript prepropeptide; ch, Optic chiasm; CPa, Central portion of the peduncular paraventricular area; Crh, Corticotrophin-releasing hormone; DBLH, Dorsobasal lateral hypothalamic area; DM, Dorsomedial hypothalamic nucleus; DM-P, Peduncular DM; DMcP, Core portion of the peduncular DM; DMcT, Core portion of the terminal DM; DMsP, Shell of the peduncular DM; DMsT, Shell portion of the terminal DM; DM-T, Terminal DM; DPa, Dorsal portion of the peduncular paraventricular area; DPM, Dorsal premamillary nucleus; EPD, Dorsal entopeduncular nucleus; EPV, Ventral entopeduncular nucleus; fx, Fornix tract; Gal, Galanin; Ghrh, Growth hormone-releasing hormone; HDB, Hypothalamo-diencephalic boundary; Hcrt, Hypocretin/orexin; IHB, Intrahypothalamic boundary; LH, Lateral hypothalamus; LM, Lateral mamillary nucleus; LPa, Lateral paraventricular nucleus; M, Mamillary region; MCLH, Magnocellular lateral hypothalamic nucleus; ME, Median eminence; mtg, Mamillotegmental tract; NHy, Neurohypophysis; Npy, Neuropeptide Y; opt, Optic tract; os, Optic stalk; Oxt, Oxytocin; Pa, Paraventricular hypothalamic complex; PBas, Posterobasal area and nucleus; Pdyn, Prodynorphin; ped, Peduncle (lateral and medial forebrain bundles); Penk, Preproenkephalin; PHy, Peduncular hypothalamus; PM, Perimamillary area; Pmch, Pro-melanin-concentrating hormone; PMS, Superficial perimamillary nucleus; POA, Preoptic area; Pomc, Pro-opiomelanocortin α; PPa, Peduncular part of Pa; PRM, Periretromamillary area; PRML, Lateral part of PRM; PRMM, Medial part of PRM; PRtLH, Prereticular lateral hypothalamus; PSPa, Peduncular part of SPa; PSPa lim, Liminal subarea of PSPa; PTh, Prethalamus; PThE, Prethalamic eminence; RM, Retromamillary region; RPa, Rostral paraventricular nucleus; Rt, Reticular nucleus of prethalamus; RTu, Retrotuberal area; RTuD, Dorsal retrotuberal domain; RTuD sub, Subliminal subarea of RTuD; RTuI, Intermediate retrotuberal domain; RTuV, Ventral retrotuberal domain; SCH, Suprachiasmatic nucleus; SCHs, Shell of SCH; sm, Stria medullaris; SPa, Subparaventricular area; SPall, Subpallium; Sst, Somatostatin; STh, Subthalamic nucleus; Th, Tyrosine hydroxylase; Thal, Thalamus; THy, Terminal hypothalamus; TPa, Terminal part of Pa; TPaC, Central portion of TPa; TPaD, Dorsal portion of TPa; TPaV, Ventral portion of TPa; Trh, Thyrotrophin-releasing hormone; TSO, Terminal supraoptic nucleus; TSPa, Terminal part of SPa; Tu, Tuberal region; TuD, Dorsal tuberal domain; TuD sub, Subliminal subarea of TuD; TuI, Intermediate tuberal domain; TuSbO, Tuberal suboptic nucleus; TuV, Ventral tuberal domain; VBLH, Ventrobasal lateral hypothalamic area; Vip, Vasoactive intestinal polypeptide; VM, Ventromedial hypothalamic nucleus; VMc, Core portion of the VM; VMs, Shell portion of the VM; VPa, Ventral portion of the peduncular paraventricular area; VPM, Ventral premamillary nucleus; ZI, Prethalamic zona incerta.
Footnotes
References
Acampora, D., Postiglione, M. P., Avantaggiato, V., Di Bonito, M., Vaccarino, F. M., Michaud, J., et al. (1999). Progressive impairment of developing neuroendocrine cell lineages in the hypothalamus of mice lacking the Orthopedia gene. Genes Dev. 13, 2787–2800. doi: 10.1101/gad.13.21.2787
Pubmed Abstract | Pubmed Full Text | CrossRef Full Text | Google Scholar
Alvarez-Bolado, G., Paul, F. A., and Blaess, S. (2012). Sonic hedgehog lineage in the mouse hypothalamus: from progenitor domains to hypothalamic regions. Neural Dev. 7:4. doi: 10.1186/1749-8104-7-4
Pubmed Abstract | Pubmed Full Text | CrossRef Full Text | Google Scholar
Alvarez-Bolado, G., Zhou, X., Cecconi, F., and Gruss, P. (2000). Expression of Foxb1 reveals two strategies for the formation of nuclei in the developing ventral diencephalon. Dev. Neurosci. 22, 197–206. doi: 10.1159/000017442
Arai, Y., Gradwohl, G., and Kameda, Y. (2010). Expression of neuropeptide Y and agouti-related peptide in the hypothalamic arcuate nucleus of newborn neurogenin3 null mutant mice. Cell Tissue Res. 340, 137–145. doi: 10.1007/s00441-009-0925-4
Pubmed Abstract | Pubmed Full Text | CrossRef Full Text | Google Scholar
Bardet, S. M., Martinez-de-la-Torre, M., Northcutt, R. G., Rubenstein, J. L., and Puelles, L. (2008). Conserved pattern of OTP-positive cells in the paraventricular nucleus and other hypothalamic sites of tetrapods. Brain Res. Bull. 75, 231–235. doi: 10.1016/j.brainresbull.2007.10.037
Pubmed Abstract | Pubmed Full Text | CrossRef Full Text | Google Scholar
Bartzen-Sprauer, J., Klosen, P., Ciofi, P., Mikkelsen, J. D., and Simonneaux, V. (2014). Photoperiodic co-regulation of kisspeptin, neurokinin B and dynorphin in the hypothalamus of a seasonal rodent. J. Neuroendocrinol. 26, 510–520. doi: 10.1111/jne.12171
Pubmed Abstract | Pubmed Full Text | CrossRef Full Text | Google Scholar
Bovolenta, P., Mallamaci, A., Puelles, L., and Boncinelli, E. (1998). Expression pattern of cSix3, a member of the Six/sine oculis family of transcription factors. Mech. Dev. 70, 201–203. doi: 10.1016/s0925-4773(97)00183-4
Pubmed Abstract | Pubmed Full Text | CrossRef Full Text | Google Scholar
Brischoux, F., Fellmann, D., and Risold, P. Y. (2001). Ontogenetic development of the diencephalic MCH neurons: a hypothalamic ‘MCH area’ hypothesis. Eur. J. Neurosci. 13, 1733–1744. doi: 10.1046/j.0953-816x.2001.01552.x
Pubmed Abstract | Pubmed Full Text | CrossRef Full Text | Google Scholar
Broberger, C. (1999). Hypothalamic cocaine- and amphetamine-regulated transcript (CART) neurons: histochemical relationship to thyrotropin-releasing hormone, melanin-concentrating hormone, orexin/hypocretin and neuropeptide Y. Brain Res. 848, 101–113. doi: 10.1016/s0006-8993(99)01977-0
Pubmed Abstract | Pubmed Full Text | CrossRef Full Text | Google Scholar
Broberger, C., De Lecea, L., Sutcliffe, J. G., and Hökfelt, T. (1998). Hypocretin/orexin- and melanin-concentrating hormone-expressing cells form distinct populations in the rodent lateral hypothalamus: relationship to the neuropeptide Y and agouti gene-related protein systems. J. Comp. Neurol. 402, 460–474. doi: 10.1002/(sici)1096-9861(19981228)402:4<460::aid-cne3>3.3.co;2-j
Pubmed Abstract | Pubmed Full Text | CrossRef Full Text | Google Scholar
Caqueret, A., Boucher, F., and Michaud, J. L. (2006). Laminar organization of the early developing anterior hypothalamus. Dev. Biol. 298, 95–106. doi: 10.1016/j.ydbio.2006.06.019
Pubmed Abstract | Pubmed Full Text | CrossRef Full Text | Google Scholar
Caqueret, A., Yang, C., Duplan, S., Boucher, F., and Michaud, J. L. (2005). Looking for trouble: a search for developmental defects of the hypothalamus. Horm. Res. 64, 222–230. doi: 10.1159/000088977
Pubmed Abstract | Pubmed Full Text | CrossRef Full Text | Google Scholar
Carl, M., Loosli, F., and Wittbrodt, J. (2002). Six3 inactivation reveals its essential role for the formation and patterning of the vertebrate eye. Development 129, 4057–4063.
Castel, M., and Morris, J. F. (2000). Morphological heterogeneity of the GABAergic network in the suprachiasmatic nucleus, the brain’s circadian pacemaker. J. Anat. 196, 1–13. doi: 10.1046/j.1469-7580.2000.19610001.x
Pubmed Abstract | Pubmed Full Text | CrossRef Full Text | Google Scholar
Conte, I., Morcillo, J., and Bovolenta, P. (2005). Comparative analysis of Six 3 and Six 6 distribution in the developing and adult mouse brain. Dev. Dyn. 234, 718–725. doi: 10.1002/dvdy.20463
Pubmed Abstract | Pubmed Full Text | CrossRef Full Text | Google Scholar
Croizier, S., Amiot, C., Chen, X., Presse, F., Nahon, J. L., Wu, J. Y., et al. (2011). Development of posterior hypothalamic neurons enlightens a switch in the prosencephalic basic plan. PLoS One 6:e28574. doi: 10.1371/journal.pone.0028574
Pubmed Abstract | Pubmed Full Text | CrossRef Full Text | Google Scholar
Davis, A. M., Seney, M. L., Stallings, N. R., Zhao, L., Parker, K. L., and Tobet, S. A. (2004). Loss of steroidogenic factor 1 alters cellular topography in the mouse ventromedial nucleus of the hypothalamus. J. Neurobiol. 60, 424–436. doi: 10.1002/neu.20030
Pubmed Abstract | Pubmed Full Text | CrossRef Full Text | Google Scholar
Dellovade, T. L., Young, M., Ross, E. P., Henderson, R., Caron, K., Parke, R. K., et al. (2000). Disruption of the gene encoding SF-1 alters the distribution of hypothalamic neuronal phenotypes. J. Comp. Neurol. 423, 579–589. doi: 10.1002/1096-9861(20000807)423:4<579::aid-cne4>3.0.co;2-#
Pubmed Abstract | Pubmed Full Text | CrossRef Full Text | Google Scholar
Dutra de Oliveira Melo, E. (2011). Estudio del Patrón de Expresión del gen Homeobox Six3 en el Cerebro Embrionario de pollo y ratón: Análisis en Relación al Modelo Prosomérico. Doctoral Dissertation. España: Universidad de Castilla-La Mancha.
Elias, C. F., Lee, C. E., Kelly, J. F., Ahima, R. S., Kuhar, M., Saper, C. B., et al. (2001). Characterization of CART neurons in the rat and human hypothalamus. J. Comp. Neurol. 432, 1–19. doi: 10.1002/cne.1085
Pubmed Abstract | Pubmed Full Text | CrossRef Full Text | Google Scholar
Elias, C. F., Saper, C. B., Maratos-Flier, E., Tritos, N. A., Lee, C., Kelly, J., et al. (1998). Chemically defined projections linking the mediobasal hypothalamus and the lateral hypothalamic area. J. Comp. Neurol. 402, 442–459. doi: 10.1002/(sici)1096-9861(19981228)402:4<442::aid-cne2>3.3.co;2-i
Pubmed Abstract | Pubmed Full Text | CrossRef Full Text | Google Scholar
Ferran, J. L., de Oliveira, E. D., Merchán, P., Sandoval, J. E., Sánchez-Arrones, L., Martínez-De-La-Torre, M., et al. (2009). Genoarchitectonic profile of developing nuclear groups in the chicken pretectum. J. Comp. Neurol. 517, 405–451. doi: 10.1002/cne.22115
Pubmed Abstract | Pubmed Full Text | CrossRef Full Text | Google Scholar
Foradori, C. D., Amstalden, M., Goodman, R. L., and Lehman, M. N. (2006). Colocalisation of dynorphin a and neurokinin B immunoreactivity in the arcuate nucleus and median eminence of the sheep. J. Neuroendocrinol. 18, 534–541. doi: 10.1111/j.1365-2826.2006.01445.x
Pubmed Abstract | Pubmed Full Text | CrossRef Full Text | Google Scholar
Furutani, N., Hondo, M., Kageyama, H., Tsujino, N., Mieda, M., Yanagisawa, M., et al. (2013). Neurotensin co-expressed in Orexin-producing neurons in the lateral Hypothalamus plays an important role in regulation of sleep/wakefulness states. PLoS One 8:e62391. doi: 10.1371/journal.pone.0062391
Pubmed Abstract | Pubmed Full Text | CrossRef Full Text | Google Scholar
Geng, X., Speirs, C., Lagutin, O., Inbal, A., Liu, W., Solnica-Kreze, L. L., et al. (2008). Haploinsufficiency of Six3 fails to activate Sonic hedgehog expression in the ventral forebrain and causes holoprosencephaly. Dev. Cell 15, 236–247. doi: 10.1016/j.devcel.2008.07.003
Pubmed Abstract | Pubmed Full Text | CrossRef Full Text | Google Scholar
Gilbert, M. S. (1935). The early development of the human diencephalon. J. Comp. Neurol. 62, 81–115. doi: 10.1002/cne.900620105
Goshu, E., Jin, H., Lovejoy, J., Marion, J.-F., Michaud, J. L., and Fan, C.-M. (2004). Sim2 contributes to neuroendocrine hormone gene expression in the anterior hypothalamus. Mol. Endocrinol. 18, 1251–1262. doi: 10.1210/me.2003-0372
Pubmed Abstract | Pubmed Full Text | CrossRef Full Text | Google Scholar
Grove, K. L., Brogan, R. S., and Smith, M. S. (2001). Novel expression of neuropeptide Y (NPY) mRNA in hypothalamic regions during development: region-specific effects of maternal deprivation on NPY and Agouti-related protein mRNA. Endocrinology 142, 4771–4776. doi: 10.1210/en.142.11.4771
Pubmed Abstract | Pubmed Full Text | CrossRef Full Text | Google Scholar
Gundlach, A. L., Burazin, T. C., and Larm, J. A. (2001). Distribution, regulation and role of hypothalamic galanin systems: renewed interest in a pleiotropic peptide family. Clin. Exp. Pharmacol. Physiol. 28, 100–105. doi: 10.1046/j.1440-1681.2001.03411.x
Pubmed Abstract | Pubmed Full Text | CrossRef Full Text | Google Scholar
Hallonet, M., Hollemann, T., Wehr, R., Jenkins, N. A., Copeland, N. G., Pieler, T., et al. (1998). Vax1 is a novel homeobox-containing gene expressed in the developing anterior ventral forebrain. Development 125, 2599–2610.
Hentges, S. T., Nishiyama, M., Overstreet, L. S., Stenzel-Poore, M., Williams, J. T., and Low, M. J. (2004). GABA release from proopiomelanocortin neurons. J. Neurosci. 24, 1578–1583. doi: 10.1523/jneurosci.3952-03.2004
Pubmed Abstract | Pubmed Full Text | CrossRef Full Text | Google Scholar
His, W. (1892). Zur allgemeine Morphologie des Gehirns. Arch. Anat. Physiol. Anat. Abth. 16, 346–383.
Horjales-Araujo, E., Hellysaz, A., and Broberger, C. (2014). Lateral hypothalamic thyrotropin-releasing hormone neurons: distribution and relationship to histochemically defined cell populations in the rat. Neuroscience 277, 87–102. doi: 10.1016/j.neuroscience.2014.06.043
Pubmed Abstract | Pubmed Full Text | CrossRef Full Text | Google Scholar
Horvath, T. L., Bechmann, I., Naftolin, F., Kalra, S. P., and Leranth, C. (1997). Heterogeneity in the neuropeptide Y-containing neurons of the rat arcuate nucleus: GABAergic and non-GABAergic subpopulations. Brain Res. 756, 283–286. doi: 10.1016/s0006-8993(97)00184-4
Pubmed Abstract | Pubmed Full Text | CrossRef Full Text | Google Scholar
Hosoya, T., Oda, Y., Takahashi, S., Morita, M., Kawauchi, S., Ema, M., et al. (2001). Defective development of secretory neurons in the hypothalamus of Arnt2-knockout mice. Genes Cells 6, 361–374. doi: 10.1046/j.1365-2443.2001.00421.x
Pubmed Abstract | Pubmed Full Text | CrossRef Full Text | Google Scholar
Ikeda, Y., Takeda, Y., Shikayama, T., Mukai, T., Hisano, S., and Morohashi, K. I. (2001). Comparative localization of Dax-1 and Ad4BP/SF-1 during development of the hypothalamic-pituitary-gonadal axis suggests their closely related and distinct functions. Dev. Dyn. 220, 363–376. doi: 10.1002/dvdy.1116
Pubmed Abstract | Pubmed Full Text | CrossRef Full Text | Google Scholar
Jarvie, B. C., and Hentges, S. T. (2012). Expression of GABAergic and glutamatergic phenotypic markers in hypothalamic proopiomelanocortin neurons. J. Comp. Neurol. 520, 3863–3876. doi: 10.1002/cne.23127
Pubmed Abstract | Pubmed Full Text | CrossRef Full Text | Google Scholar
Jing, X., Ratty, A. K., and Murphy, D. (1998). Ontogeny of the vasopressin and oxytocin RNAs in the mouse hypothalamus. Neurosci. Res. 30, 343–349. doi: 10.1016/s0168-0102(98)00017-0
Pubmed Abstract | Pubmed Full Text | CrossRef Full Text | Google Scholar
Keyser, A. (1972). The development of the diencephalon of the chinese hamster: an investigation of the validity of the criteria of subdivisions of the brain. Acta Anat. Suppl. (Basel) 59, 1–178.
Kimura, S., Hara, Y., Pineau, T., Fernandez-Salguero, P., Fox, C. H., Ward, J. M., et al. (1996). The T/ebp null mouse: thyroid-specific enhancer-binding protein is essential for the organogenesis of the thyroid, lung, ventral forebrain and pituitary. Genes Dev. 10, 60–69. doi: 10.1101/gad.10.1.60
Pubmed Abstract | Pubmed Full Text | CrossRef Full Text | Google Scholar
Kobayashi, M., Nishikawa, K., Suzuki, T., and Yamamoto, M. (2001). The homeobox protein Six3 interacts with the Groucho corepressor and acts as a transcriptional repressor in eye and forebrain formation. Dev. Biol. 232, 315–326. doi: 10.1006/dbio.2001.0185
Pubmed Abstract | Pubmed Full Text | CrossRef Full Text | Google Scholar
Koylu, E. O., Couceyro, P. R., Lambert, P. D., Ling, N. C., DeSouza, E. B., and Kuhar, M. J. (1997). Immunohistochemical localization of novel CART peptides in rat hypothalamus, pituitary and adrenal gland. J. Neuroendocrinol. 9, 823–833. doi: 10.1046/j.1365-2826.1997.00651.x
Pubmed Abstract | Pubmed Full Text | CrossRef Full Text | Google Scholar
Lagutin, O. V., Zhu, C. C., Kobayashi, D., Topczewski, J., Shimamura, K., Puelles, L., et al. (2003). Six3 repression of Wnt signaling in the anterior neuroectoderm is essential for vertebrate forebrain development. Genes Dev. 17, 368–379. doi: 10.1101/gad.1059403
Pubmed Abstract | Pubmed Full Text | CrossRef Full Text | Google Scholar
Landry, M., Trembleau, A., Arai, R., and Calas, A. (1991). Evidence for a colocalization of oxytocin mRNA and galanin in magnocellular hypothalamic neurons: a study combining in situ hybridization and immunohistochemistry. Brain Res. Mol. Brain Res. 10, 91–95. doi: 10.1016/0169-328x(91)90060-b
Pubmed Abstract | Pubmed Full Text | CrossRef Full Text | Google Scholar
Lavado, A., Lagutin, O. V., and Oliver, G. (2008). Six3 inactivation causes progressive caudalization and aberrant patterning of the mammalian diencephalon. Development 135, 441–450. doi: 10.1242/dev.010082
Pubmed Abstract | Pubmed Full Text | CrossRef Full Text | Google Scholar
Li, H., Zeitler, P. S., Valerius, M. T., Small, K., and Potter, S. S. (1996). Gsh-1, an orphan Hox gene, is required for normal pituitary development. EMBO J. 15, 714–724.
Manning, L., Ohyama, K., Saeger, B., Hatano, O., Wilson, S. A., Logan, M., et al. (2006). Regional morphogenesis in the hypothalamus: a BMP-Tbx2 pathway coordinates fate and proliferation through Shh downregulation. Dev. Cell 11, 873–885. doi: 10.1016/j.devcel.2006.09.021
Pubmed Abstract | Pubmed Full Text | CrossRef Full Text | Google Scholar
Markakis, E. A., and Swanson, L. W. (1997). Spatiotemporal patterns of secretomotor neuron generation in the parvicellular neuroendocrine system. Brain Res. Brain Res. Rev. 24, 255–291. doi: 10.1016/s0165-0173(97)00006-4
Pubmed Abstract | Pubmed Full Text | CrossRef Full Text | Google Scholar
Mastronardi, C., Smiley, G. G., Raber, J., Kusakabe, T., Kawaguchi, A., Matagne, V., et al. (2006). Deletion of the Ttf1 gene in differentiated neurons disrupts female reproduction without impairing basal ganglia function. J. Neurosci. 26, 13167–13179. doi: 10.1523/jneurosci.4238-06.2006
Pubmed Abstract | Pubmed Full Text | CrossRef Full Text | Google Scholar
McNay, D. E. G., Pelling, M., Claxton, S., Guillemot, F., and Ang, S.-L. (2006). Mash1 is required for generic and subtype differentiation of hypothalamic neuroendocrine cells. Mol. Endocrinol. 20, 1623–1632. doi: 10.1210/me.2005-0518
Pubmed Abstract | Pubmed Full Text | CrossRef Full Text | Google Scholar
Melander, T., Hökfelt, T., and Rökaeus, A. (1986). Distribution of galaninlike immunoreactivity in the rat central nervous system. J. Comp. Neurol. 248, 475–517. doi: 10.1002/cne.902480404
Pubmed Abstract | Pubmed Full Text | CrossRef Full Text | Google Scholar
Michaud, J. L. (2001). The developmental program of the hypothalamus and its disorders. Clin. Genet. 60, 255–263. doi: 10.1034/j.1399-0004.2001.600402.x
Pubmed Abstract | Pubmed Full Text | CrossRef Full Text | Google Scholar
Michaud, J. L., Rosenquist, T., May, N. R., and Fan, C.-M. (1998). Development of neuroendocrine lineages requires the bHLH-PAS transcription factor SIM1. Genes Dev. 12, 3264–3275. doi: 10.1101/gad.12.20.3264
Pubmed Abstract | Pubmed Full Text | CrossRef Full Text | Google Scholar
Moore, R. Y., and Speh, J. C. (1993). GABA is the principal neurotransmitter of the circadian system. Neurosci. Lett. 150, 112–116. doi: 10.1016/0304-3940(93)90120-a
Pubmed Abstract | Pubmed Full Text | CrossRef Full Text | Google Scholar
Morales-Delgado, N. (2012). Diferenciación de Neuronas Peptidérgicas en Relación a la Organización Genoarquitectónica del Hipotálamo en el ratoón. PhD Diss., España: Universidad de Castilla-La Mancha.
Morales-Delgado, N., Castro-Robles, B., Ferrán, J. L., Martinez-de-la-Torre, M., Puelles, L., and Díaz, C. (2014). Regionalized differentiation of CRH, TRH and GHRH peptidergic neurons in the mouse hypothalamus. Brain Struct. Funct. 219, 1083–1111. doi: 10.1007/s00429-013-0554-2
Pubmed Abstract | Pubmed Full Text | CrossRef Full Text | Google Scholar
Morales-Delgado, N., Merchan, P., Bardet, S. M., Ferran, J. L., Puelles, L., and Díaz, C. (2011). Topography of somatostatin gene expression relative to molecular progenitor domains during ontogeny of the mouse hypothalamus. Front. Neuroanat. 5:10. doi: 10.3389/fnana.2011.00010
Pubmed Abstract | Pubmed Full Text | CrossRef Full Text | Google Scholar
Nakai, S., Kawano, H., Yudate, T., Nishi, M., Kuno, J., Nagata, A., et al. (1995). The POU domain transcription factor Brn-2 is required for the determination of specific neuronal lineages in the hypothalamus of the mouse. Genes Dev. 9, 3109–3121. doi: 10.1101/gad.9.24.3109
Pubmed Abstract | Pubmed Full Text | CrossRef Full Text | Google Scholar
Nieuwenhuys, R. (2009). The structural organization of the forebrain: a commentary on the papers presented at the 20th Annual Karger Workshop ‘Forebrain Evolution in Fishes’. Brain Behav. Evol. 74, 77–85. doi: 10.1159/000229014
Nilsson, I., Johansen, J. E., Schalling, M., Hökfelt, T., and Fetissov, S. O. (2005). Maturation of the hypothalamic arcuate agouti-related protein system during postnatal development in the mouse. Brain Res. Dev. Brain Res. 155, 147–154. doi: 10.1016/j.devbrainres.2005.01.009
Pubmed Abstract | Pubmed Full Text | CrossRef Full Text | Google Scholar
Oliver, G., Mailhos, A., Wehr, R., Copeland, N. G., Jenkins, N. A., and Gruss, P. (1995). Six3, a murine homologue of the sine oculis gene, demarcates the most anterior border of the developing neural plate and is expressed during eye development. Development 121, 4045–4055.
Ovesjö, M. L., Gamstedt, M., Collin, M., and Meister, B. (2001). GABAergic nature of hypothalamic leptin target neurones in the ventromedial arcuate nucleus. J. Neuroendocrinol. 13, 505–516. doi: 10.1046/j.1365-2826.2001.00662.x
Pubmed Abstract | Pubmed Full Text | CrossRef Full Text | Google Scholar
Padilla, S. L., Carmody, J. S., and Zeltser, L. M. (2010). Pomc-expressing progenitors give rise to antagonistic neuronal populations in hypothalamic feeding circuits. Nat. Med. 16, 403–405. doi: 10.1038/nm.2126
Pubmed Abstract | Pubmed Full Text | CrossRef Full Text | Google Scholar
Pelling, M., Anthwal, N., McNay, D., Gradwohl, G., Leiter, A. B., Guillemot, F., et al. (2011). Differential requirements for neurogenin 3 in the development of POMC and NPY neurons in the hypothalamus. Dev. Biol. 349, 406–416. doi: 10.1016/j.ydbio.2010.11.007
Pubmed Abstract | Pubmed Full Text | CrossRef Full Text | Google Scholar
Peyron, C., Tighe, D. K., van den Pol, A. N., de Lecea, L., Heller, H. C., Sutcliffe, J. G., et al. (1998). Neurons containing hypocretin (orexin) project to multiple neuronal systems. J. Neurosci. 18, 9996–10015.
Pombal, M. A., Megías, M., Bardet, S. M., and Puelles, L. (2009). New and old thoughts on the segmental organization of the forebrain in lampreys. Brain Behav. Evol. 74, 7–19. doi: 10.1159/000229009
Puelles, L., Amat, J. A., and Martínez-de-la-Torre, M. (1987). Segment-related, mosaic neurogenetic pattern in the forebrain and mesencephalon of early chick embryos: I. Topography of AChE-positive neuroblasts up to stage HH18. J. Comp. Neurol. 266, 247–268. doi: 10.1002/cne.902660210
Pubmed Abstract | Pubmed Full Text | CrossRef Full Text | Google Scholar
Puelles, L., Fernández, B., and Martinez-de-la-Torre, M. (2014). “Neuromeric landmarks in the rat midbrain, diencephalon and hypothalamus, compared with acetylcholinesterase histochemistry,” Chapter 2 in The Rat Nervous System, ed G. Paxinos 4th Edn. (New York: Academic Press/Elsevier), 25–43.
Puelles, L., and Ferran, J. L. (2012). Concept of neural genoarchitecture and its genomic fundament. Front. Neuroanat. 6:47. doi: 10.3389/fnana.2012.00047
Pubmed Abstract | Pubmed Full Text | CrossRef Full Text | Google Scholar
Puelles, L., Harrison, M., Paxinos, G., and Watson, C. (2013). A developmental ontology for the mammalian brain based on the prosomeric model. Trends Neurosci. 36, 570–578. doi: 10.1016/j.tins.2013.06.004
Pubmed Abstract | Pubmed Full Text | CrossRef Full Text | Google Scholar
Puelles, L., Martínez, S., Martinez-de-la-Torre, M., and Rubenstein, J. L. R. (2004). “Gene maps and related histogenetic domains in the forebrain and midbrain,” in The Rat Nervous System, ed G. Paxinos 3rd Edn. (San Diego: Elsevier), 3–25.
Puelles, L., Martínez-de-la-Torre, M., Bardet, S., and Rubenstein, J. L. R. (2012). “Hypothalamus,” in The Mouse Nervous System, eds C. Watson, G. Paxinos, L. Puelles (San Diego: Elsevier Academic Press), 221–312.
Puelles, L., and Rubenstein, J. L. (2003). Forebrain gene expression domains and the evolving prosomeric model. Trends Neurosci. 26, 469–476. doi: 10.1016/s0166-2236(03)00234-0
Pubmed Abstract | Pubmed Full Text | CrossRef Full Text | Google Scholar
Rhodes, C. H., Morrell, J. I., and Pfaff, D. W. (1981). Immunohistochemical analysis of magnocellular elements in rat hypothalamus: distribution and numbers of cells containing neurophysin, oxytocin and vasopressin. J. Comp. Neurol. 198, 45–64. doi: 10.1002/cne.901980106
Pubmed Abstract | Pubmed Full Text | CrossRef Full Text | Google Scholar
Rossmanith, W. G., Clifton, D. K., and Steiner, R. A. (1996). Galanin gene expression in hypothalamic GnRH-containing neurons of the rat: a model for autocrine regulation. Horm. Metab. Res. 28, 257–266. doi: 10.1055/s-2007-979180
Pubmed Abstract | Pubmed Full Text | CrossRef Full Text | Google Scholar
Sánchez-Arrones, L., Ferrán, J. L., Rodríguez-Gallardo, L., and Puelles, L. (2009). Incipient forebrain boundaries traced by differential gene expression and fate mapping in the chick neural plate. Dev. Biol. 335, 43–65. doi: 10.1016/j.ydbio.2009.08.012
Pubmed Abstract | Pubmed Full Text | CrossRef Full Text | Google Scholar
Sawchenko, P. E. (1998). Toward a new neurobiology of energy balance, appetite and obesity: the anatomists weigh in. J. Comp. Neurol. 402, 435–441. doi: 10.1002/(sici)1096-9861(19981228)402:4<435::aid-cne1>3.3.co;2-d
Pubmed Abstract | Pubmed Full Text | CrossRef Full Text | Google Scholar
Schonemann, M. D., Ryan, A. K., McEvilly, R. J., O’Connell, S. M., Arias, C. A., Kalla, K. A., et al. (1995). Development and survival of the endocrine hypothalamus and posterior pituitary gland requires the neuronal POU domain factor BRN2. Genes Dev. 9, 3122–3135. doi: 10.1101/gad.9.24.3122
Pubmed Abstract | Pubmed Full Text | CrossRef Full Text | Google Scholar
Shimogori, T., Lee, D. A., Miranda-Angulo, A., Yang, Y., Wang, H., Jiang, L., et al. (2010). A genomic atlas of mouse hypothalamic development. Nat. Neurosci. 13, 767–775. doi: 10.1038/nn.2545
Pubmed Abstract | Pubmed Full Text | CrossRef Full Text | Google Scholar
Silverman, A., and Pickard, G. E. (1983). “The hypothalamus,” in Chemical Neuroanatomy, ed P. C. Emson (New York: Raven Press), 295–336.
Simmons, D. M., and Swanson, L. W. (2009). Comparison of the spatial distribution of seven types of neuroendocrine neurons in the rat paraventricular nucleus: toward a global 3D model. J. Comp. Neurol. 516, 423–441. doi: 10.1002/cne.22126
Pubmed Abstract | Pubmed Full Text | CrossRef Full Text | Google Scholar
Singer, L. K., Kuper, J., Brogan, R. S., Smith, M. S., and Grove, K. L. (2000). Novel expression of hypothalamic neuropeptide Y during postnatal development in the rat. Neuroreport 11, 1075–1080. doi: 10.1097/00001756-200004070-00034
Pubmed Abstract | Pubmed Full Text | CrossRef Full Text | Google Scholar
Skidmore, J. M., Cramer, J. D., Martin, J. F., and Martin, D. M. (2008). Cre fate mapping reveals lineage specific defects in neuronal migration with loss of Pitx2 function in the developing mouse hypothalamus and subthalamic nucleus. Mol. Cell. Neurosci. 37, 696–707. doi: 10.1016/j.mcn.2007.12.015
Pubmed Abstract | Pubmed Full Text | CrossRef Full Text | Google Scholar
Sofroniew, M. V. (1985). “Vasopressin, oxytocin and their related neurophysins,” in “Handbook of Chemical Neuroanatomy”. Vol.4. GABA and Neuropeptides in the CNS, eds A. Björklund and T. Hökfelt (Amsterdam: Elsevier), 93–165.
Sofroniew, M. V., and Glasmann, W. (1981). Golgi-like immunoperoxidase staining of hypothalamic magnocellular neurons that contain vasopressin, oxytocin or neurophysin in the rat. Neuroscience 6, 619–643. doi: 10.1016/0306-4522(81)90147-0
Pubmed Abstract | Pubmed Full Text | CrossRef Full Text | Google Scholar
Swanson, L. W. (1987). “The hypothalamus,” in Handbook of Chemical Neuroanatomy. Vol.5. Integrated Systems of the CNS, Part I: Hypothalamus, Hippocampus, Amygdala, Retina, eds A. Björklund, T. Hökfelt and L. W. Swanson (Amsterdam: New York, Oxford, Elsevier), 1–124.
Szabó, N. E., Zhao, T., Cankaya, M., Theil, T., Zhou, X., and Alvarez-Bolado, G. (2009). Role of neuroepithelial Sonic hedgehog in hypothalamic patterning. J. Neurosci. 29, 6989–7002. doi: 10.1523/JNEUROSCI.1089-09.2009
Pubmed Abstract | Pubmed Full Text | CrossRef Full Text | Google Scholar
Szarek, E., Cheah, P. S., Schwartz, J., and Thomas, P. (2010). Molecular genetics of the developing neuroendocrine hypothalamus. Mol. Cell. Endocrinol. 323, 115–123. doi: 10.1016/j.mce.2010.04.002
Pubmed Abstract | Pubmed Full Text | CrossRef Full Text | Google Scholar
Tobet, S. A., and McClellan, K. (2013). “Development of the Hypothalamus,” in Colloquium Series in the Developing Brain #10, ed M. M. McCarthy (University of Maryland School of Medicine: Morgan and Claypool Life Sciences), 1–57. doi: 10.4199/C00079ED1V01Y201303DBR010
Tran, P. V., Lee, M. B., Marín, O., Xu, B., Jones, K. R., Reichardt, L. F., et al. (2003). Requirement of the orphan nuclear receptor SF-1 in terminal differentiation of ventromedial hypothalamic neurons. Mol. Cell. Neurosci. 22, 441–453. doi: 10.1016/s1044-7431(03)00027-7
Pubmed Abstract | Pubmed Full Text | CrossRef Full Text | Google Scholar
VanDunk, C., Hunter, L. A., and Gray, P. A. (2011). Development, maturation and necessity of transcription factors in the mouse suprachiasmatic nucleus. J. Neurosci. 31, 6457–6467. doi: 10.1523/JNEUROSCI.5385-10.2011
Pubmed Abstract | Pubmed Full Text | CrossRef Full Text | Google Scholar
Vrang, N., Larsen, P. J., Clausen, J. T., and Kristensen, P. (1999). Neurochemical characterization of hypothalamic cocaine- amphetamine-regulated transcript neurons. J. Neurosci. 19, RC5, 1–8.
Wang, W., Grimmer, J. F., Van De Water, T. R., and Lufkin, T. (2004). Hmx2 and Hmx3 homeobox genes direct development of the murine inner ear and hypothalamus and can be functionally replaced by Drosophila Hmx. Dev. Cell 7, 439–453. doi: 10.1016/j.devcel.2004.06.016
Pubmed Abstract | Pubmed Full Text | CrossRef Full Text | Google Scholar
Wang, W., and Lufkin, T. (2000). The murine Otp homeobox gene plays an essential role in the specification of neuronal cell lineages in the developing hypothalamus. Dev. Biol. 227, 432–449. doi: 10.1006/dbio.2000.9902
Pubmed Abstract | Pubmed Full Text | CrossRef Full Text | Google Scholar
Yee, C. L., Wang, Y., Anderson, S., Ekker, M., and Rubenstein, J. L. R. (2009). Arcuate nucleus expression of NKX2.1 and DLX and lineages expressing these transcription factors in neuropeptide Y (+), proopiomelanocortin (+) and tyrosine hydroxylase (+) neurons in neonatal and adult mice. J. Comp. Neurol. 517, 37–50. doi: 10.1002/cne.22132
Pubmed Abstract | Pubmed Full Text | CrossRef Full Text | Google Scholar
Zhao, T., Szabó, N., Ma, J., Luo, L., Zhou, X., and Alvarez-Bolado, G. (2008). Genetic mapping of Foxb1-cell lineage shows migration from caudal diencephalon to telencephalon and lateral hypothalamus. Eur. J. Neurosci. 28, 1941–1955. doi: 10.1111/j.1460-9568.2008.06503.x
Pubmed Abstract | Pubmed Full Text | CrossRef Full Text | Google Scholar
Keywords: hypothalamus, neuropeptides, genoarchitecture, progenitor areas, migrations
Citation: Díaz C, Morales-Delgado N and Puelles L (2015) Ontogenesis of peptidergic neurons within the genoarchitectonic map of the mouse hypothalamus. Front. Neuroanat. 8:162. doi: 10.3389/fnana.2014.00162
Received: 30 October 2014; Accepted: 12 December 2014;
Published online: 12 January 2015.
Edited by:
Gonzalo Alvarez-Bolado, University of Heidelberg, GermanyReviewed by:
Stuart Tobet, Colorado State University, USAGonzalo Alvarez-Bolado, University of Heidelberg, Germany
Copyright © 2015 Díaz, Morales-Delgado and Puelles. This is an open-access article distributed under the terms of the Creative Commons Attribution License (CC BY). The use, distribution and reproduction in other forums is permitted, provided the original author(s) or licensor are credited and that the original publication in this journal is cited, in accordance with accepted academic practice. No use, distribution or reproduction is permitted which does not comply with these terms.
*Correspondence: Carmen Díaz, Department of Medical Sciences, School of Medicine and Institute for Research in Neurological Disabilities, University of Castilla-La Mancha Almansa Street, 14 Albacete 02006, Spain e-mail:Q2FybWVuLkRpYXpAdWNsbS5lcw==