 Xavier Vasques
 Laurent Vanel2
 Guillaume Villette
 Laura Cif
- 1Laboratoire de Recherche en Neurosciences Cliniques, Saint-André-de-Sangonis, France
- 2International Business Machines Corporation Systems, Paris, France
- 3Département de Neurochirurgie, Hôpital Gui de Chauliac, Centre Hospitalier Régional Universitaire de Montpellier, Montpellier, France
- 4Université de Montpellier 1, Montpellier, France
Classification and quantitative characterization of neuronal morphologies from histological neuronal reconstruction is challenging since it is still unclear how to delineate a neuronal cell class and which are the best features to define them by. The morphological neuron characterization represents a primary source to address anatomical comparisons, morphometric analysis of cells, or brain modeling. The objectives of this paper are (i) to develop and integrate a pipeline that goes from morphological feature extraction to classification and (ii) to assess and compare the accuracy of machine learning algorithms to classify neuron morphologies. The algorithms were trained on 430 digitally reconstructed neurons subjectively classified into layers and/or m-types using young and/or adult development state population of the somatosensory cortex in rats. For supervised algorithms, linear discriminant analysis provided better classification results in comparison with others. For unsupervised algorithms, the affinity propagation and the Ward algorithms provided slightly better results.
Introduction
The quantitative characterization of neuronal morphologies from histological digital neuronal reconstructions represents a primary resource to investigate anatomical comparisons and morphometric analysis of cells (Kalisman et al., 2003; Ascoli et al., 2007; Scorcioni et al., 2008; Schmitz et al., 2011; Ramaswamy et al., 2012; Oswald et al., 2013; Muralidhar et al., 2014). It often represents the basis of modeling efforts to study the impact of a cell’s morphology on its electrical behavior (Insel et al., 2004; Druckmann et al., 2012; Gidon and Segev, 2012; Bar-Ilan et al., 2013) and on the network it is embedded in (Hill et al., 2012). Many different frameworks, tools and analysis have been developed to contribute to this effort (Schierwagen and Grantyn, 1986; Ascoli et al., 2001, 2007; Ascoli, 2002a,b, 2006; van Pelt and Schierwagen, 2004; Halavi et al., 2008; Scorcioni et al., 2008; Cuntz et al., 2011; Guerra et al., 2011; Schmitz et al., 2011; Hill et al., 2012), such as the Carmen project, framework focusing on neural activity (Jessop et al., 2010), NeuroMorpho.org, repository of digitally reconstructed neurons (Halavi et al., 2008) or the TREES toolbox for morphological modeling (Cuntz et al., 2011).
In spite of over a century of research on cortical circuits, it is still unclear how many classes of cortical neurons exist. Neuronal classification remains a challenging topic since it is unclear how to designate a neuronal cell class and what are the best features to define them by (DeFelipe et al., 2013). Recently, quantitative methods using supervised and unsupervised classifiers have become standard for neuronal classification based on morphological, physiological, or molecular characteristics. They provide quantitative and unbiased identification of distinct neuronal subtypes, when applied to selected datasets (Cauli et al., 1997; Karube et al., 2004; Ma, 2006; Helmstaedter et al., 2008; Karagiannis et al., 2009; McGarry et al., 2010; DeFelipe et al., 2013).
However, more robust classification methods are needed for increasingly complex and larger datasets. As an example, traditional cluster analysis using Ward’s method has been effective, but has drawbacks that need to be overcome using more constrained algorithms. More recent methodologies such as affinity propagation (Santana et al., 2013) outperformed Ward’s method but on a limited number of classes with a set of interneurons belonging to four subtypes. One important aspect of classifiers is the assessment of the algorithms, crucial for the robustness (Rosenberg and Hirschberg, 2007), particularly for unsupervised clustering. The limitations of morphological classification (Polavaram et al., 2014) are several: the geometry of individual neurons that varies significantly within the same class, the different techniques used to extract morphologies such as imaging, histology, and reconstruction techniques that impact the measures; but also inter-laboratory variability (Scorcioni et al., 2004). Neuroinformatics tools, computational approaches, and openly available data such as that provided by NeuroMorpho.org enable development and comparison of techniques and accuracy improvement.
The objectives of this paper were to improve our knowledge on automatic classification of neurons and to develop and integrate, based on existing tools, a pipeline that goes from morphological features extraction using l-measure (Scorcioni et al., 2008) to cell classification. The accuracy of machine learning classification algorithms was assessed and compared. Algorithms were trained on 430 digitally reconstructed neurons from NeuroMorpho.org (Ascoli et al., 2007), subjectively classified into layers and/or m-types using young and/or adult development state population of the somatosensory cortex in rats. This study shows the results of applying unsupervised and supervised classification techniques to neuron classification using morphological features as predictors.
Materials and Methods
Data Sample
The classification algorithms have been trained on 430 digitally reconstructed neurons (Figures 1 and 2) classified into a maximum of 22 distinct layers and/or m-types of the somatosensory cortex in rats (Supplementary Datasheet S1), obtained from NeuroMorpho.org (Halavi et al., 2008) searched by Species (Rat), Development (Adult and/or Young) and Brain Region (Neocortex, Somatosensory, Layer 2/3, Layer 4, Layer 5, and Layer 6). Established morphological criteria and nomenclature created in the last century were used. In some cases, the m-type names reflect a semantic convergence of multiple given names for the same morphology. We added a prefix to the established names to distinguish the layer of origin (e.g., a Layer 4 Pyramidal Cell is labeled L4_PC). Forty-three morphological features1 were extracted for each neuron using L-Measure tool (Scorcioni et al., 2008) that provide extraction of quantitative morphological measurements from neuronal reconstructions.
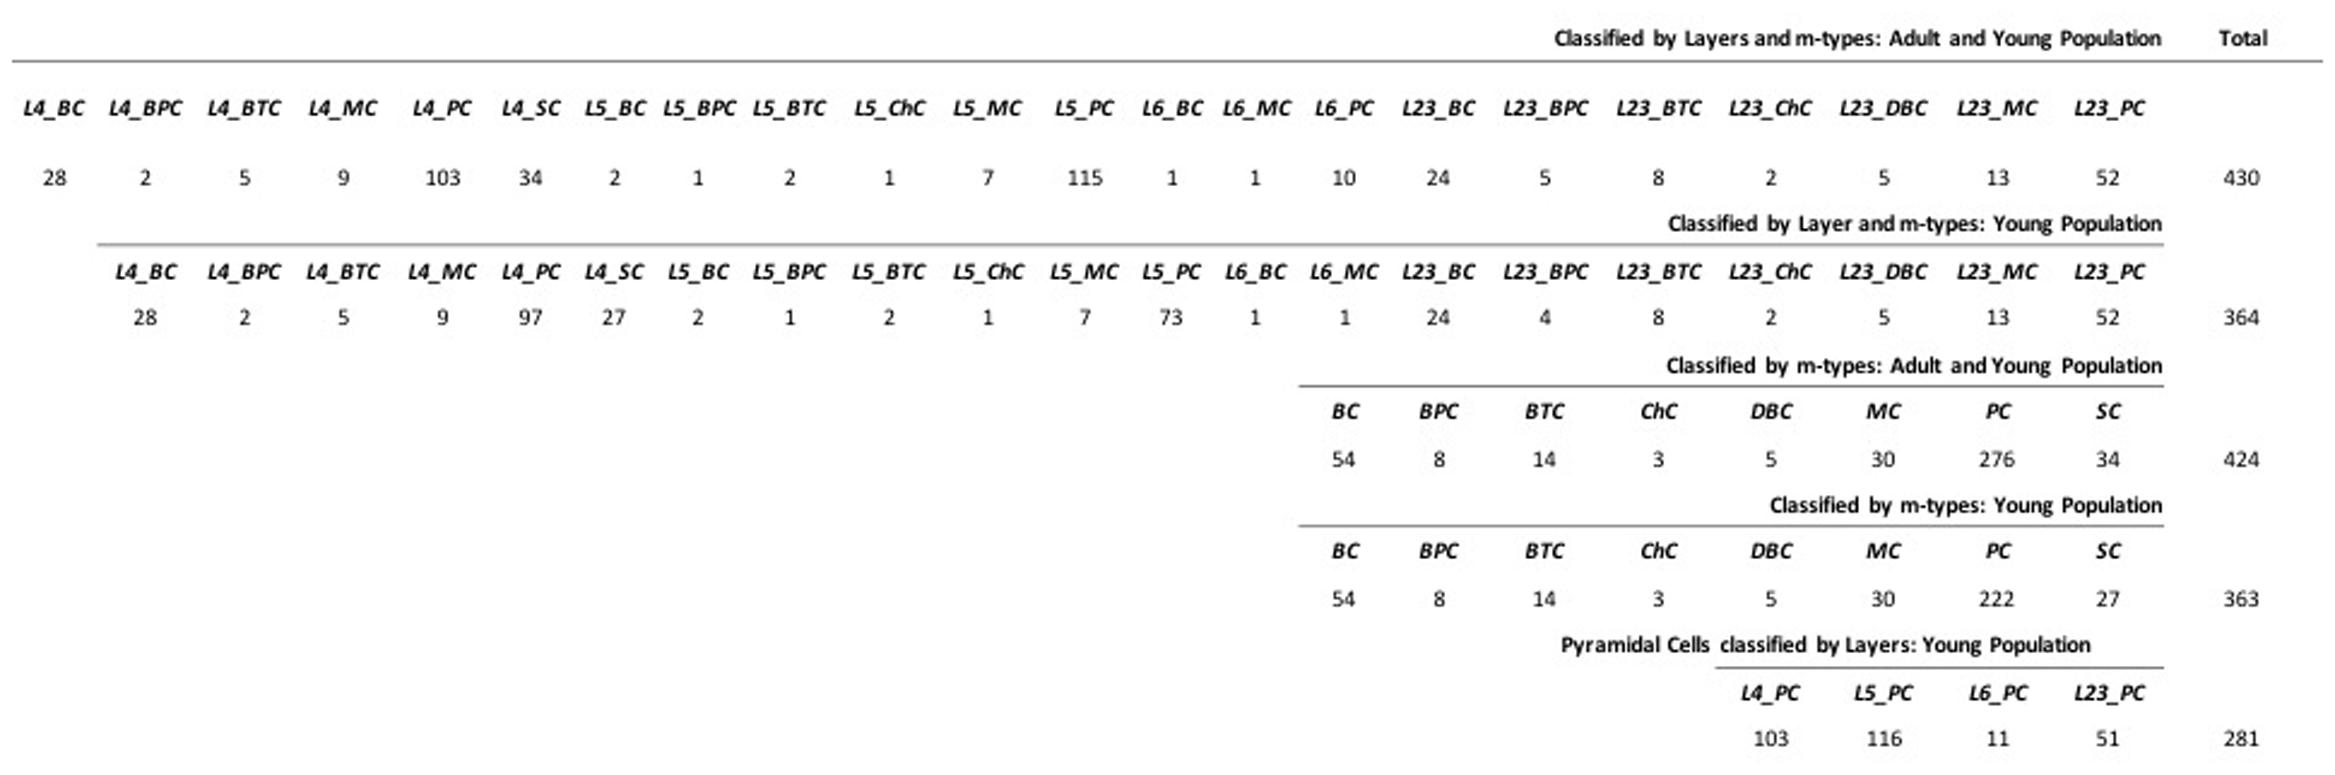
FIGURE 1. Data Sample of the 430 neurons with Layer 2/3, 4, 5 and 6 as L23, L4, L5 and L6 and m-type Basket, Bipolar, Bitufted, Chandelier, Double Bouquet, Martinotti, Pyramidal, and Stellate cells as BC, BPC, BTC, ChC, DBC, MC, PC, and SC.
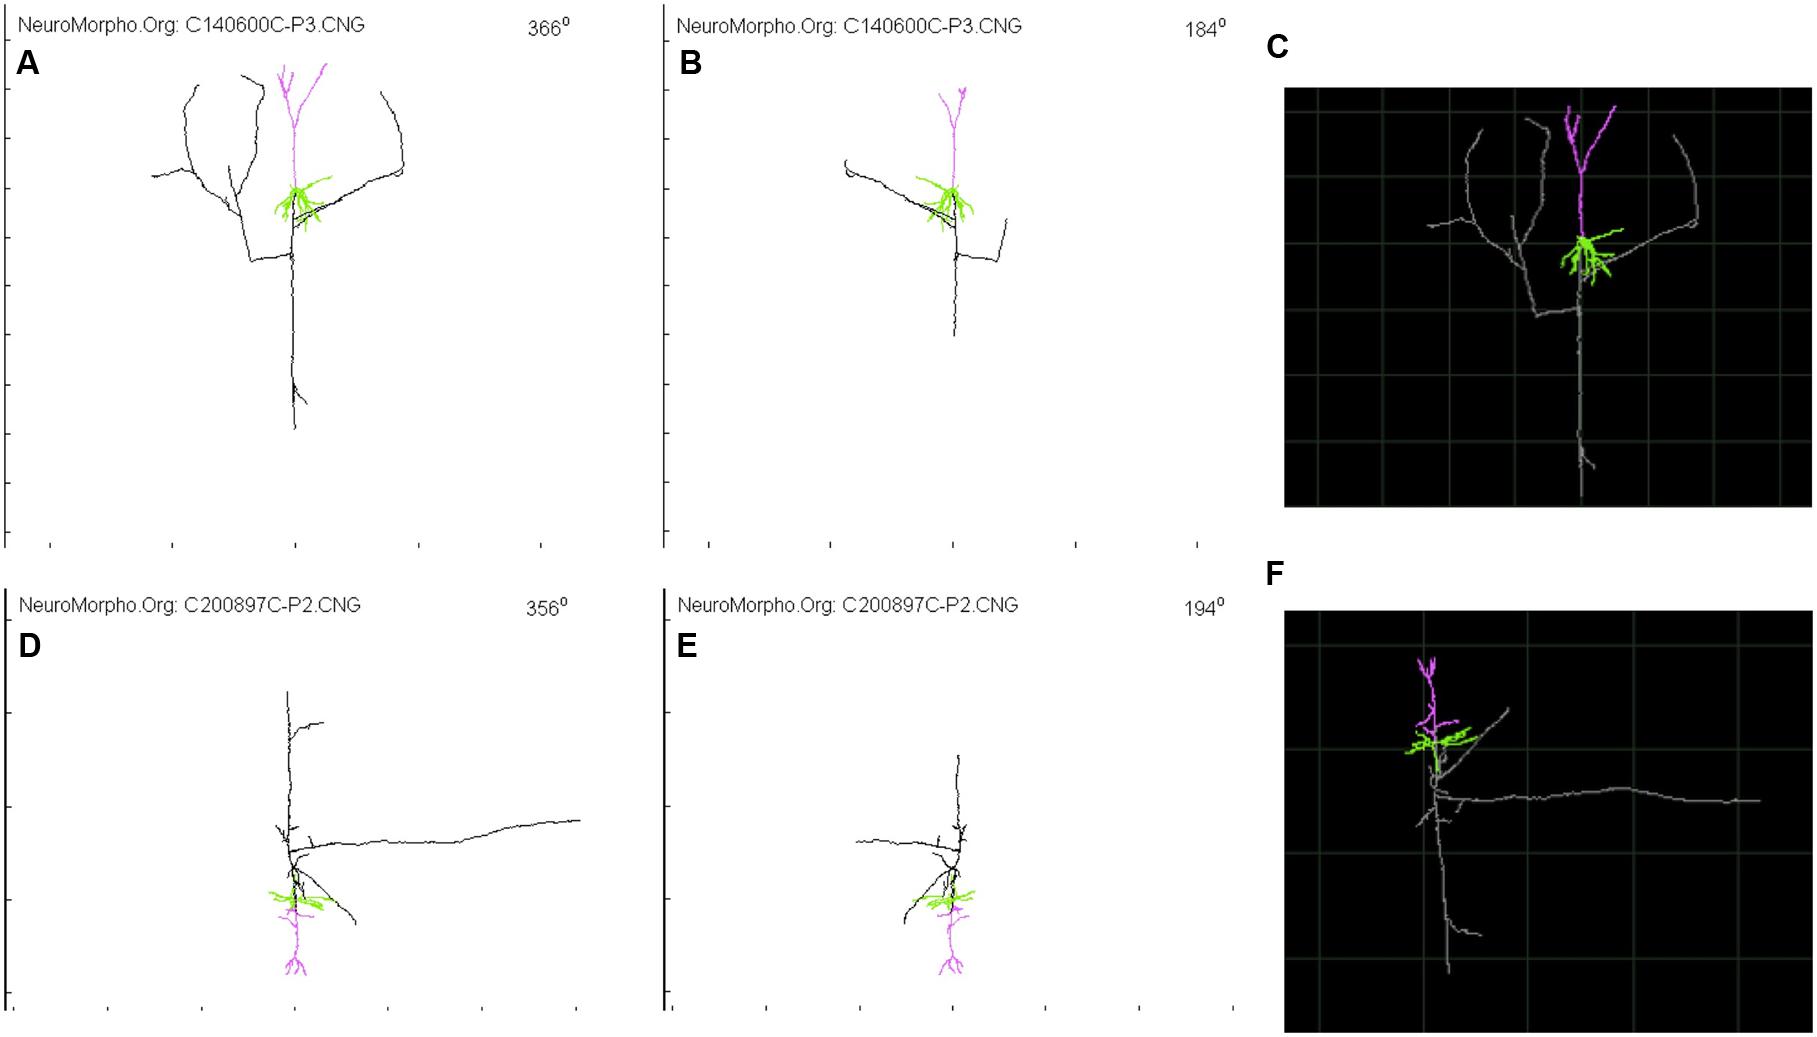
FIGURE 2. Glimpse of two Layer 4 Pyramidal Cell from NeuroMorpho.org provided by Wang et al. (Wang et al., 2002) and visualized through the animation tool provided by neurophormo.org with neuron C140600C-P3 (A) 366°, (B) 184°, and (C) standard image; and with neuron C200897C-P2 (D) 356°, (E) 194°, and (F) standard image.
Data Preprocessing
The datasets were preprocessed (Supplementary Figure S1) in order to deal with missing values, often encoded as blanks, NaNs or other placeholders. All the missing values were replaced using the mean value of the processed feature for a given class. Categorical features such as morphology types were encoded transforming each categorical feature with m possible values into m binary features. The algorithms were implemented using different normalization methods depending on the algorithm used. They encompass for scaling feature values to lie between 0 and 1 in order to include robustness to very small standard deviations of features and preserving zero entries in sparse data, normalizing the data using the l2 norm [-1,1] and standardizing the data along any axis.
Supervised Learning
In supervised learning, the neuron feature measurements (training data) are accompanied by the name of the associated neuron type indicating the class of the observations. The new data are classified based on the training set (Vapnik, 1995). The supervised learning algorithms which have been compared are the following:
– Naive Bayes (Rish, 2001; Russell and Norvig, 2003a,b) with Gaussian Naïve Bayes algorithm (GNB) and Multinomial Naïve Bayes (MNB)
– k-Nearest Neighbors (Cover and Hart, 1967; Hart, 1968; Coomans and Massart, 1982; Altman, 1992; Terrell and Scott, 1992; Wu et al., 2008)
– Radius Nearest Neighbors (Bentley et al., 1977)
– Nearest centroid classifier (NCC) (Tibshirani et al., 2002; Manning, 2008; Sharma and Paliwal, 2010)
– Linear discriminant analysis (LDA) (Fisher, 1936; Friedman, 1989; Martinez and Kak, 2001; Demir and Ozmehmet, 2005; Albanese et al., 2012; Aliyari Ghassabeh et al., 2015)
– Support vector machines (SVM) (Boser et al., 1992; Guyon et al., 1993; Cortes and Vapnik, 1995; Vapnik, 1995; Ferris and Munson, 2002; Meyer et al., 2003; Lee et al., 2004; Duan and Keerthi, 2005) including C-Support Vector Classification (SVC) with linear and radial basis functions (RBF) kernels (SVC-linear and SVC–RBF)
– Stochastic Gradient Descent (SGD) (Ferguson, 1982; Kiwiel, 2001; Machine Learning Summer School and Machine Learning Summer School, 2004)
– Decision Tree (DT) (Kass, 1980; Quinlan, 1983, 1987; Rokach, 2008)
– Random forests classifier2 (Ho, 1995, 1998; Breiman, 2001)
– Extremely randomized trees2 (Shi et al., 2005; Geurts et al., 2006, Shi and Horvath, 2006; Prinzie and Van den Poel, 2008)
– Neural Network (McCulloch and Pitts, 1943; Farley and Clark, 1954; Rochester et al., 1956; Fukushima, 1980; Dominic et al., 1991; Hoskins and Himmelblau, 1992) : Multilayer perceptron (MLP) (Auer et al., 2008) and Radial Basis Function network (Park and Sandberg, 1991; Schwenker et al., 2001)
– Classification and Regression Tree (C&R Tree) (Breiman et al., 1984)
– CHi-squared Automatic Interaction Detector (CHAID) (Kass, 1980)
– Exhaustive CHAID (Biggs et al., 1991)
– C5.0 (Patil et al., 2012).
The algorithm for neuron classification using supervised classifier is shown in Algorithm 1.
Algorithm 1: Neuron supervised classification
1. Normalize each of the neuron feature values
2. Instantiate the estimator
3. Fit the model according to the given training data and parameters
4. Assign to all neurons the class determined by its exemplar
5. Compute the classification accuracy (cf. classification assessment)
The normalization has been chosen regarding the requirements of the classification methods and/or providing the best results.
Unsupervised Learning
Ten unsupervised (clustering and dimension reduction) algorithms were implemented and assessed. In unsupervised learning classification, the class labels of training data are unknown and the aim is to establish the existence of classes or clusters in the data given a set of measurements. The unsupervised learning algorithms which were compared are the following:
– K-Means (MacQueen, 1967; Lloyd, 1982; Duda, 2001; Kanungo et al., 2002; MacKay, 2003; Jain, 2010; Vattani, 2011; Cordeiro de Amorim and Mirkin, 2012; de Amorim and Hennig, 2015)
– Mini Batch K-Means (Sculley, 2010)
– The K-Means algorithm has been also used on PCA-reduced data (Ding and He, 2004)
– Ward (Ward, 1963; Everitt, 2001; de Amorim, 2015) with and without connectivity constraints
– Mean Shift (Fukunaga and Hostetler, 1975; Cheng, 1995; Comaniciu and Meer, 2002)
The algorithm for the classifiers described above is shown in Algorithm 2.
Algorithm 2: Unsupervised classification
1. Normalize each of the neuron feature values using the l2 norm [-1,1]
2. Instantiate the estimator
3. Fit the model according to the given training data and parameters
4. Assign to all neurons the corresponding cluster number
5. Algorithm Assessment (cf. classification assessment)
We also used the Affinity propagation algorithm (Frey and Dueck, 2007; Vlasblom and Wodak, 2009; Santana et al., 2013) which creates clusters by sending messages between pairs of samples until convergence. Two affinity propagation algorithms have been computed. The first one is based on the Spearman distance, i.e., the Spearman Rank Correlation measures the correlation between two sequences of values. The second one is based on the Euclidian distance. For both, the similarity measure is computed as the opposite of the distance or equality. The best output was kept. The preference value for all points is computed as the median value of the similarity values. Several preference values have been tested including the minimum and mean value. The parameters of the algorithm were chosen in order to provide the closest approximation between the number of clusters from the output and the true classes.
The affinity propagation algorithm is shown in Algorithm 3.
Algorithm 3: Affinity Propagation
1. Normalize each of the neuron feature values to values [0,1]
2. Similarity values between pairs of morphologies using Spearman/Euclidian distance
3. Calculate the preference values for each morphology
4. Affinity propagation clustering of morphologies
5. Assign to all neurons the corresponding copy number
6. Algorithm Assessment (cf. classification assessment)
For all the clustering algorithms, the exemplar/centroids/cluster number determines the label of all points in the cluster, which is then compared with the true class of the morphology.
Principal Component Analysis (PCA; Hotelling, 1933; Abdi and Williams, 2010; Albanese et al., 2012) has been also tested.
Hardware and Software
The algorithms were implemented in Python 2.73 using the Scikit-learn4 open source python library. Scikit-learn is an open source tool for data mining and data analysis built on NumPy, a package for scientific computing with Python5 and Scipy, an open source software package for mathematics, science and engineering6. Morphological features7 were extracted for each neuron using L-Measure tool (Scorcioni et al., 2008) allowing extracting quantitative morphological measurements from neuronal reconstructions. The pipeline described above, featuring extraction with l-measure and classification algorithms, was implemented and tested on Power 8 from IBM (S822LC+GPU (8335-GTA), 3.8 GHz, RHEL 7.2). The code of the pipeline is avalaible in GitHub at https://github.com/xaviervasques/Neuron_Morpho_Classification_ML.git.
Classification Assessment
For supervised algorithm assessment, accuracy statistics have been computed for each algorithm:
The accuracy ranges from 0 to 1, with 1 being optimal. In order to measure prediction performance, also known as model validation, we computed a 10 times cross validation test using a randomly chosen subset of 30% of the data set and calculated the mean accuracy. This gives a more accurate indication on how well the model is performing. Supervised algorithms were tested on neurons gathered by layers and m-types in young and adult population, by layers and m-types in young population, by m-types in young and adult population, by m-types in young population, and by layers of Pyramidal Cells in young population. We also performed the tests by varying the percentage of train to test the ratio of samples from 1 to 80%. We provided the respective standard deviations. We included in the python code not only the accuracy code which is shown in this study but also the recall score, the precision score and the F-measure scores. We also built miss-classification matrices for the algorithm providing the best accuracy for each of the categories with the true value and predicted value with the associated percentage of accuracy. In order to assess clustering algorithm, the V-measure score was used (Rosenberg and Hirschberg, 2007). The V-measure is actually equivalent to the normalized mutual information (NMI) normalized by the sum of the label entropies (Vinh et al., 2009; Becker, 2011). It is a conditional entropy-based external cluster measure, providing an elegant solution to many problems that affects previously defined cluster evaluation measures. The V-measure is also based upon two criteria, homogeneity and completeness (Rosenberg and Hirschberg, 2007) since it is computed as the harmonic mean of distinct homogeneity and completeness scores. The V-measure has been chosen as our main index to assess the unsupervised algorithm. However, in order to facilitate the comparison between supervised and unsupervised algorithms, we computed additional types of scores4 including:
– Homogeneity: each cluster contains only members of a single class.
– Completeness, all members of a given class are assigned to the same cluster.
– Silhouette Coefficient: used when truth labels are not known, which is not our case, and which evaluates the model itself, where a higher Silhouette Coefficient score relates to a model with better defined clusters.
– Adjusted Rand Index: given the knowledge of the ground truth class assignments and our clustering algorithm assignments of the same samples, the adjusted Rand index is a function that measures the similarity of the two assignments, ignoring permutations and including chance normalization.
– Adjusted Mutual Information: given the knowledge of the ground truth class assignments and our clustering algorithm assignments of the same samples, the Mutual Information is a function that measures the agreement of the two assignments, ignoring permutations. We used specifically Adjusted Mutual Information.
The PCA have been assessed using the explained variance ratio.
Results
Supervised Algorithms Assessment
The assessment of the supervised algorithms is shown in Figure 3. The results showed that LDA is the algorithm providing the best results in all categories when classifying neurons according to layers and m-types with adult and young population (Accuracy score of 0.9 ± 0.02 meaning 90% ± 2% of well classified neurons), layers and m-type with young population (0.89 ± 0.03), m-types with adult and young population (0.96 ± 0.02), m-types with young population (0.95 ± 0.01), and layers on pyramidal cells with young population (0.99 ± 0.01). Comparing the means between LDA algorithm and all the other algorithms using t-test showed a significant difference (p < 0.001) and also for C&R Tree algorithm using the Wilcoxon statistical test (p < 0.005). We also performed the tests by varying the percentage of train to test the ratio of samples from 1 to 80% showing a relative stability of the LDA algorithm through its accuracy scores and respective standard deviations (Figure 4). Table 1 shows mean precision, recall and F-Scores of the LDA algorithm with their standard deviations for all the categories tested. We also built miss-classification matrices for the LDA algorithm which provided the best accuracy for each of the categories (Figure 5).
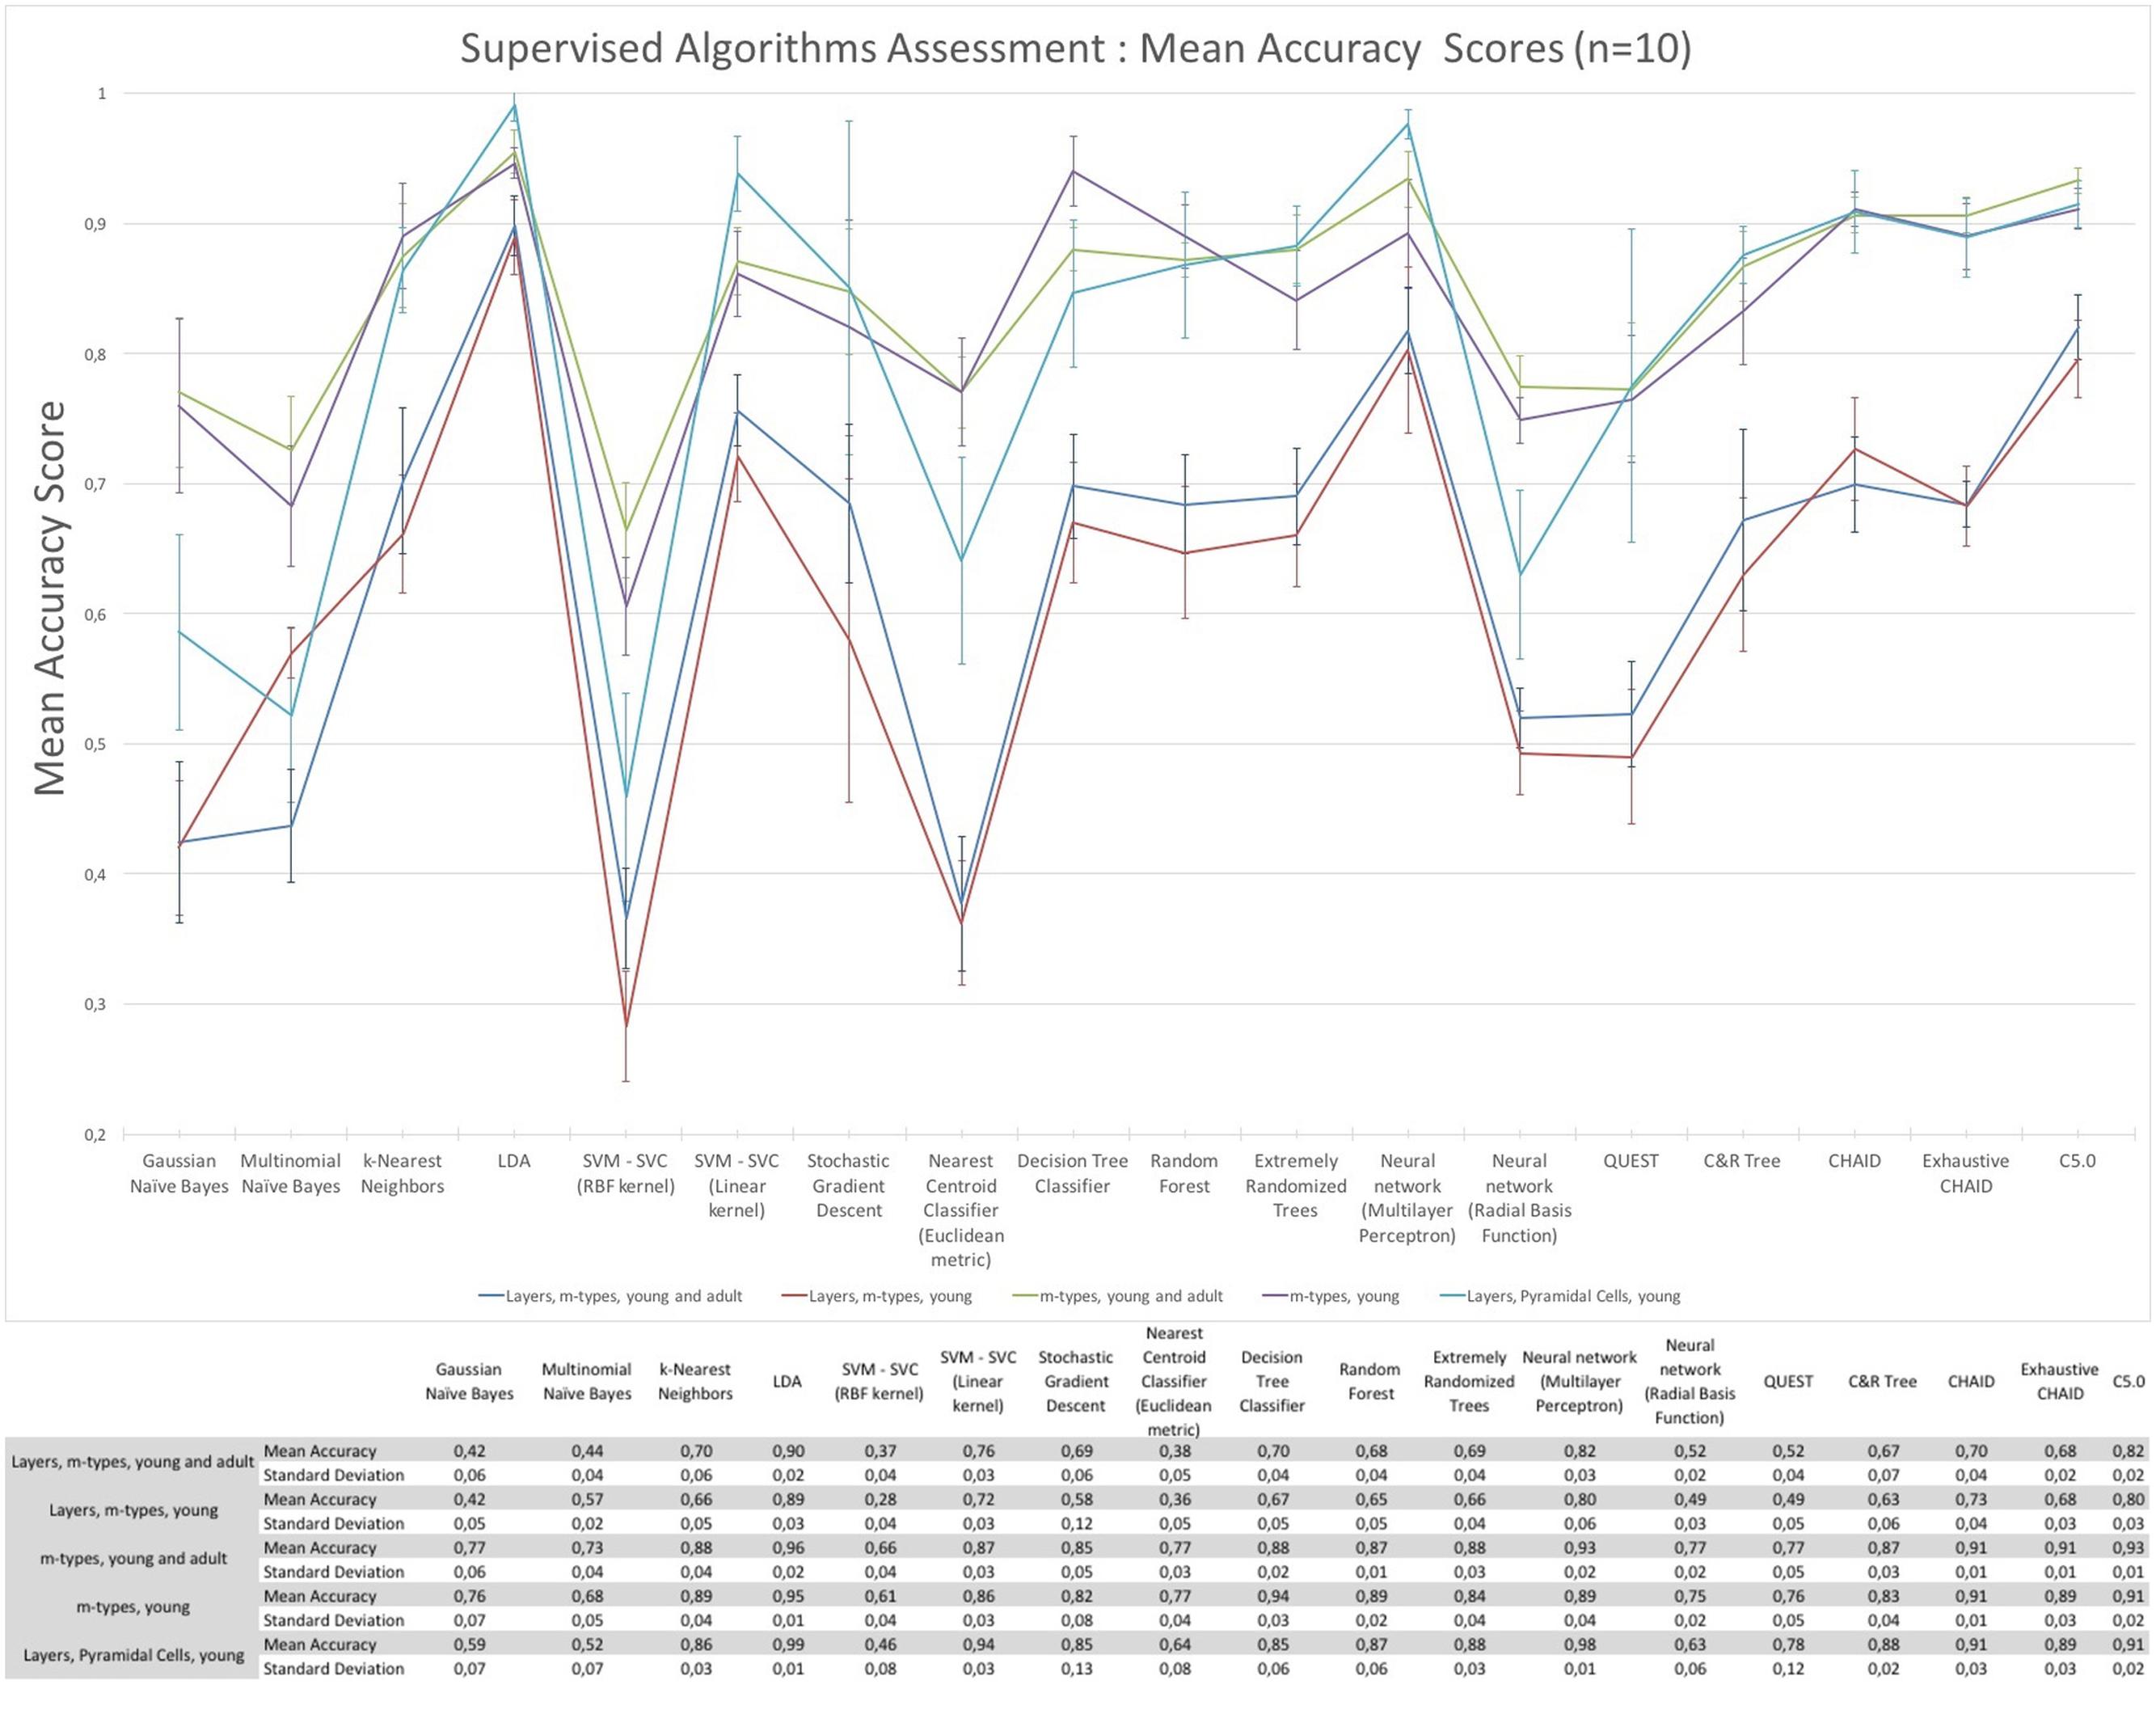
FIGURE 3. The mean accuracy scores with their respective standard deviation of the supervised algorithms. The mean accuracy scores have been computed 10 times using a randomly chosen 30% data subset to classify morphologies according to layers and m-types, m-types, and layers only.
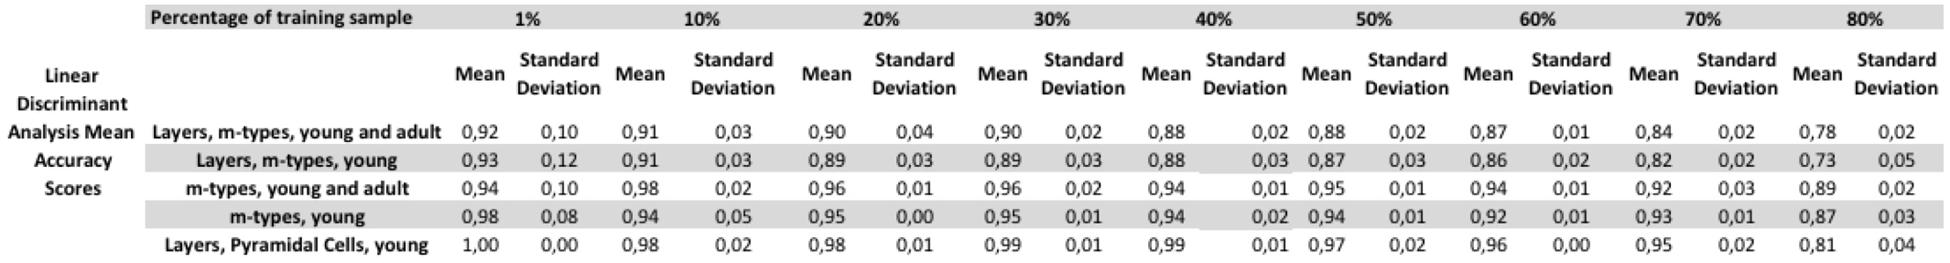
FIGURE 4. Tests varying the percentage of train to test the ratio of samples from 1 to 80% showing a relative stability of the linear discriminant analysis (LDA) algorithm. The figure shows the mean accuracy scores with their respective standard deviation for each of the category tested.
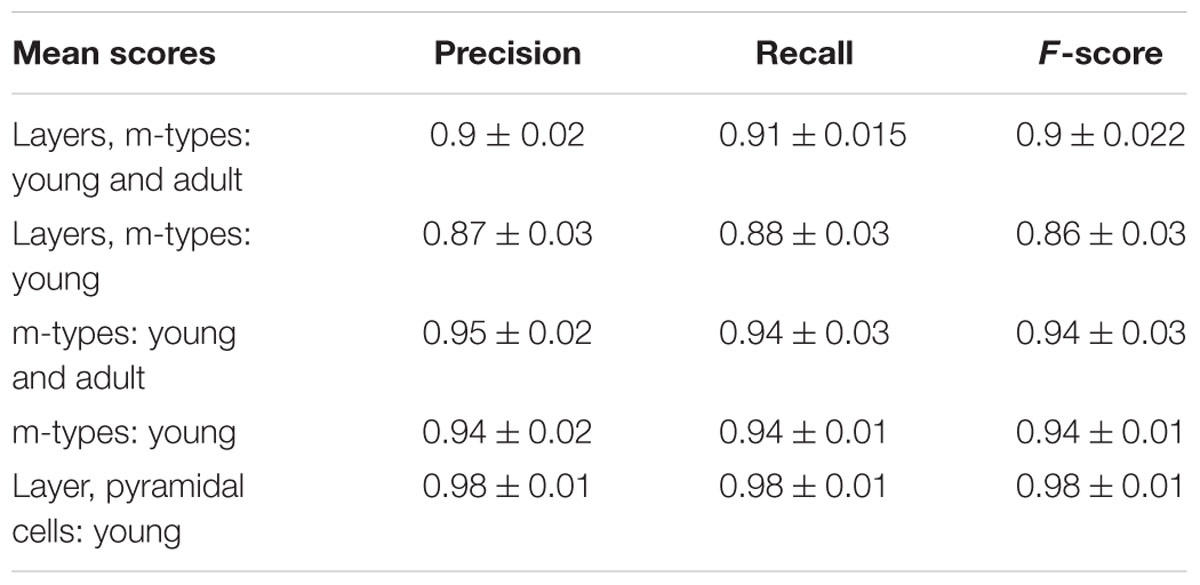
TABLE 1. Mean precision, recall and F-scores of the linear discriminant analysis (LDA) algorithm with their respective standard deviations for all the categories tested.
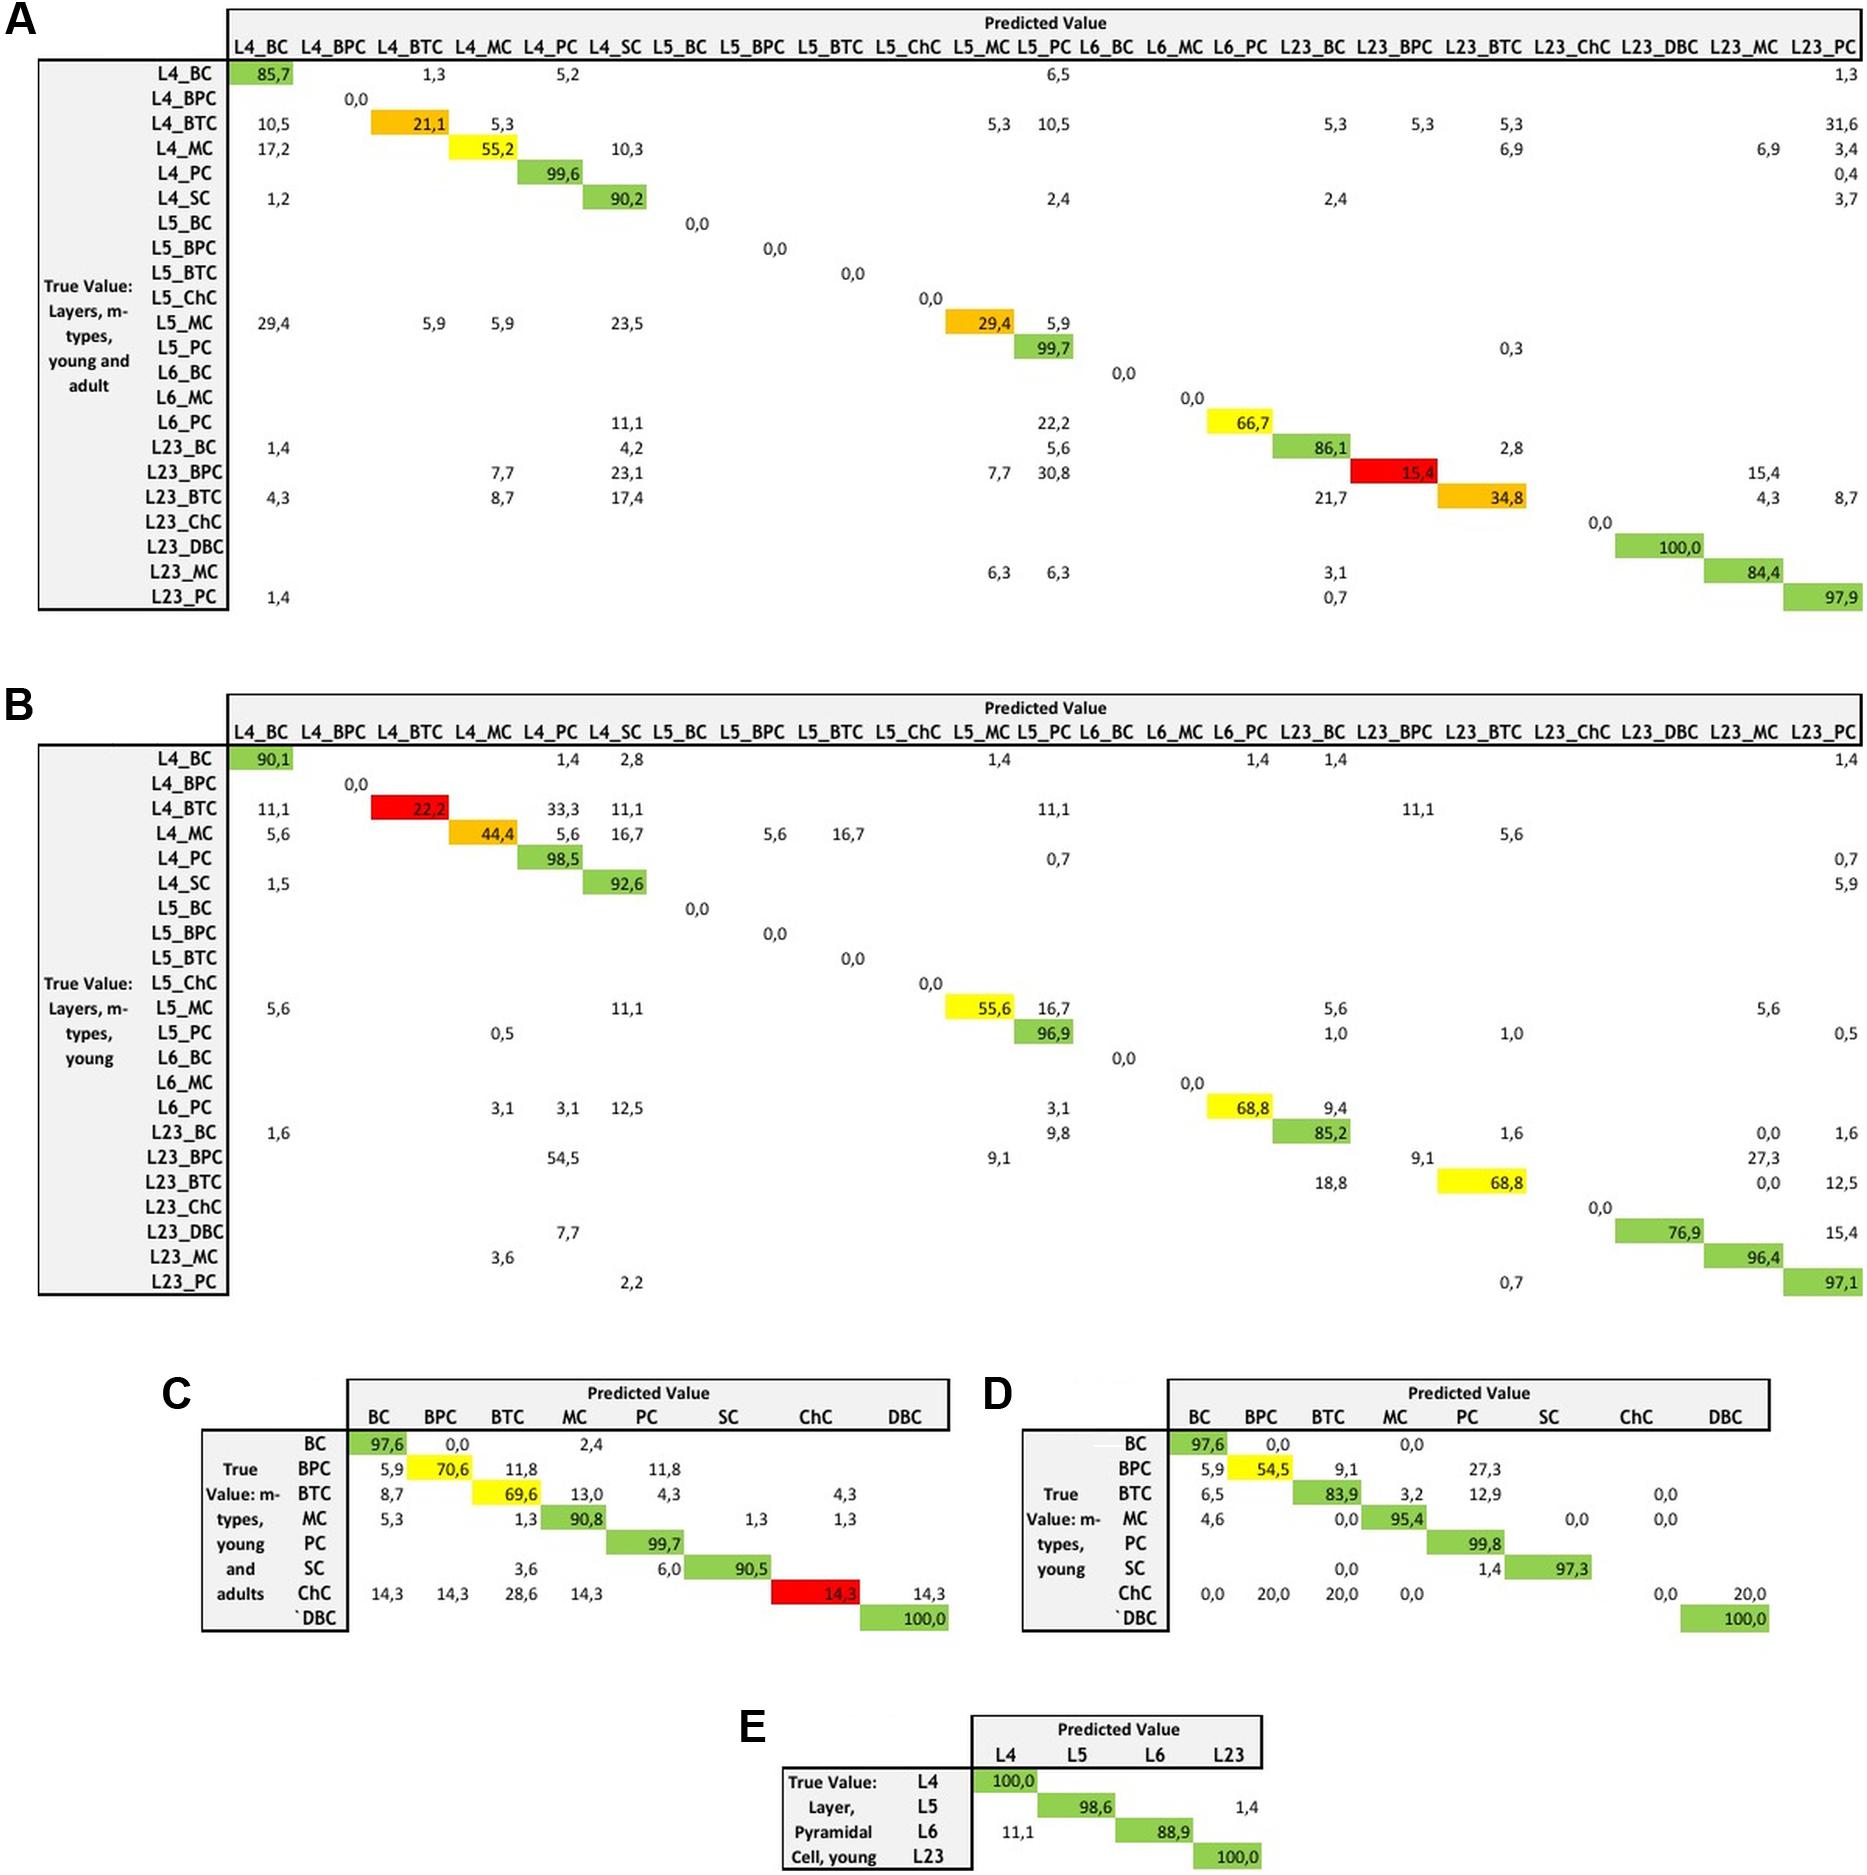
FIGURE 5. Miss-classification matrices for the LDA algorithm providing the best accuracy for each of the categories with the true value and predicted value and the associated percentage of accuracy for the following categories: (A) combined layers and m-types in young and adult population, (B) combined layers and m-types in young population, (C) m-types in young and adult population, (D) m-types in young population, and (E) layers and pyramidal cells in young population.
Unsupervised Algorithms Assessment
The results of the unsupervised clustering algorithm assessment are shown in Figure 6. The algorithms providing slightly better results are the affinity propagation (spearman) and the Ward. The results showed that affinity propagation with Spearman distance is the algorithm providing the best results in neurons classified according to layers and m-types with young and adult population (V-measure of 0.44, 36 clusters), layers on pyramidal cells with young population (V-measure of 0.385, 22 clusters) and also layers and m-types with young population (V-measure of 0.458, 28 clusters). The results showed that Ward algorithms provide the best results on two categories, namely the classification of morphologies according to m-types with young and adult population (V-measure of 0.562, 8 clusters), and m-types with young population (V-measure 0.503, 8 clusters). Affinity propagation with Euclidean distance has been the second best for all the categories except neurons classified according to Layers and m-types with young and adult population.
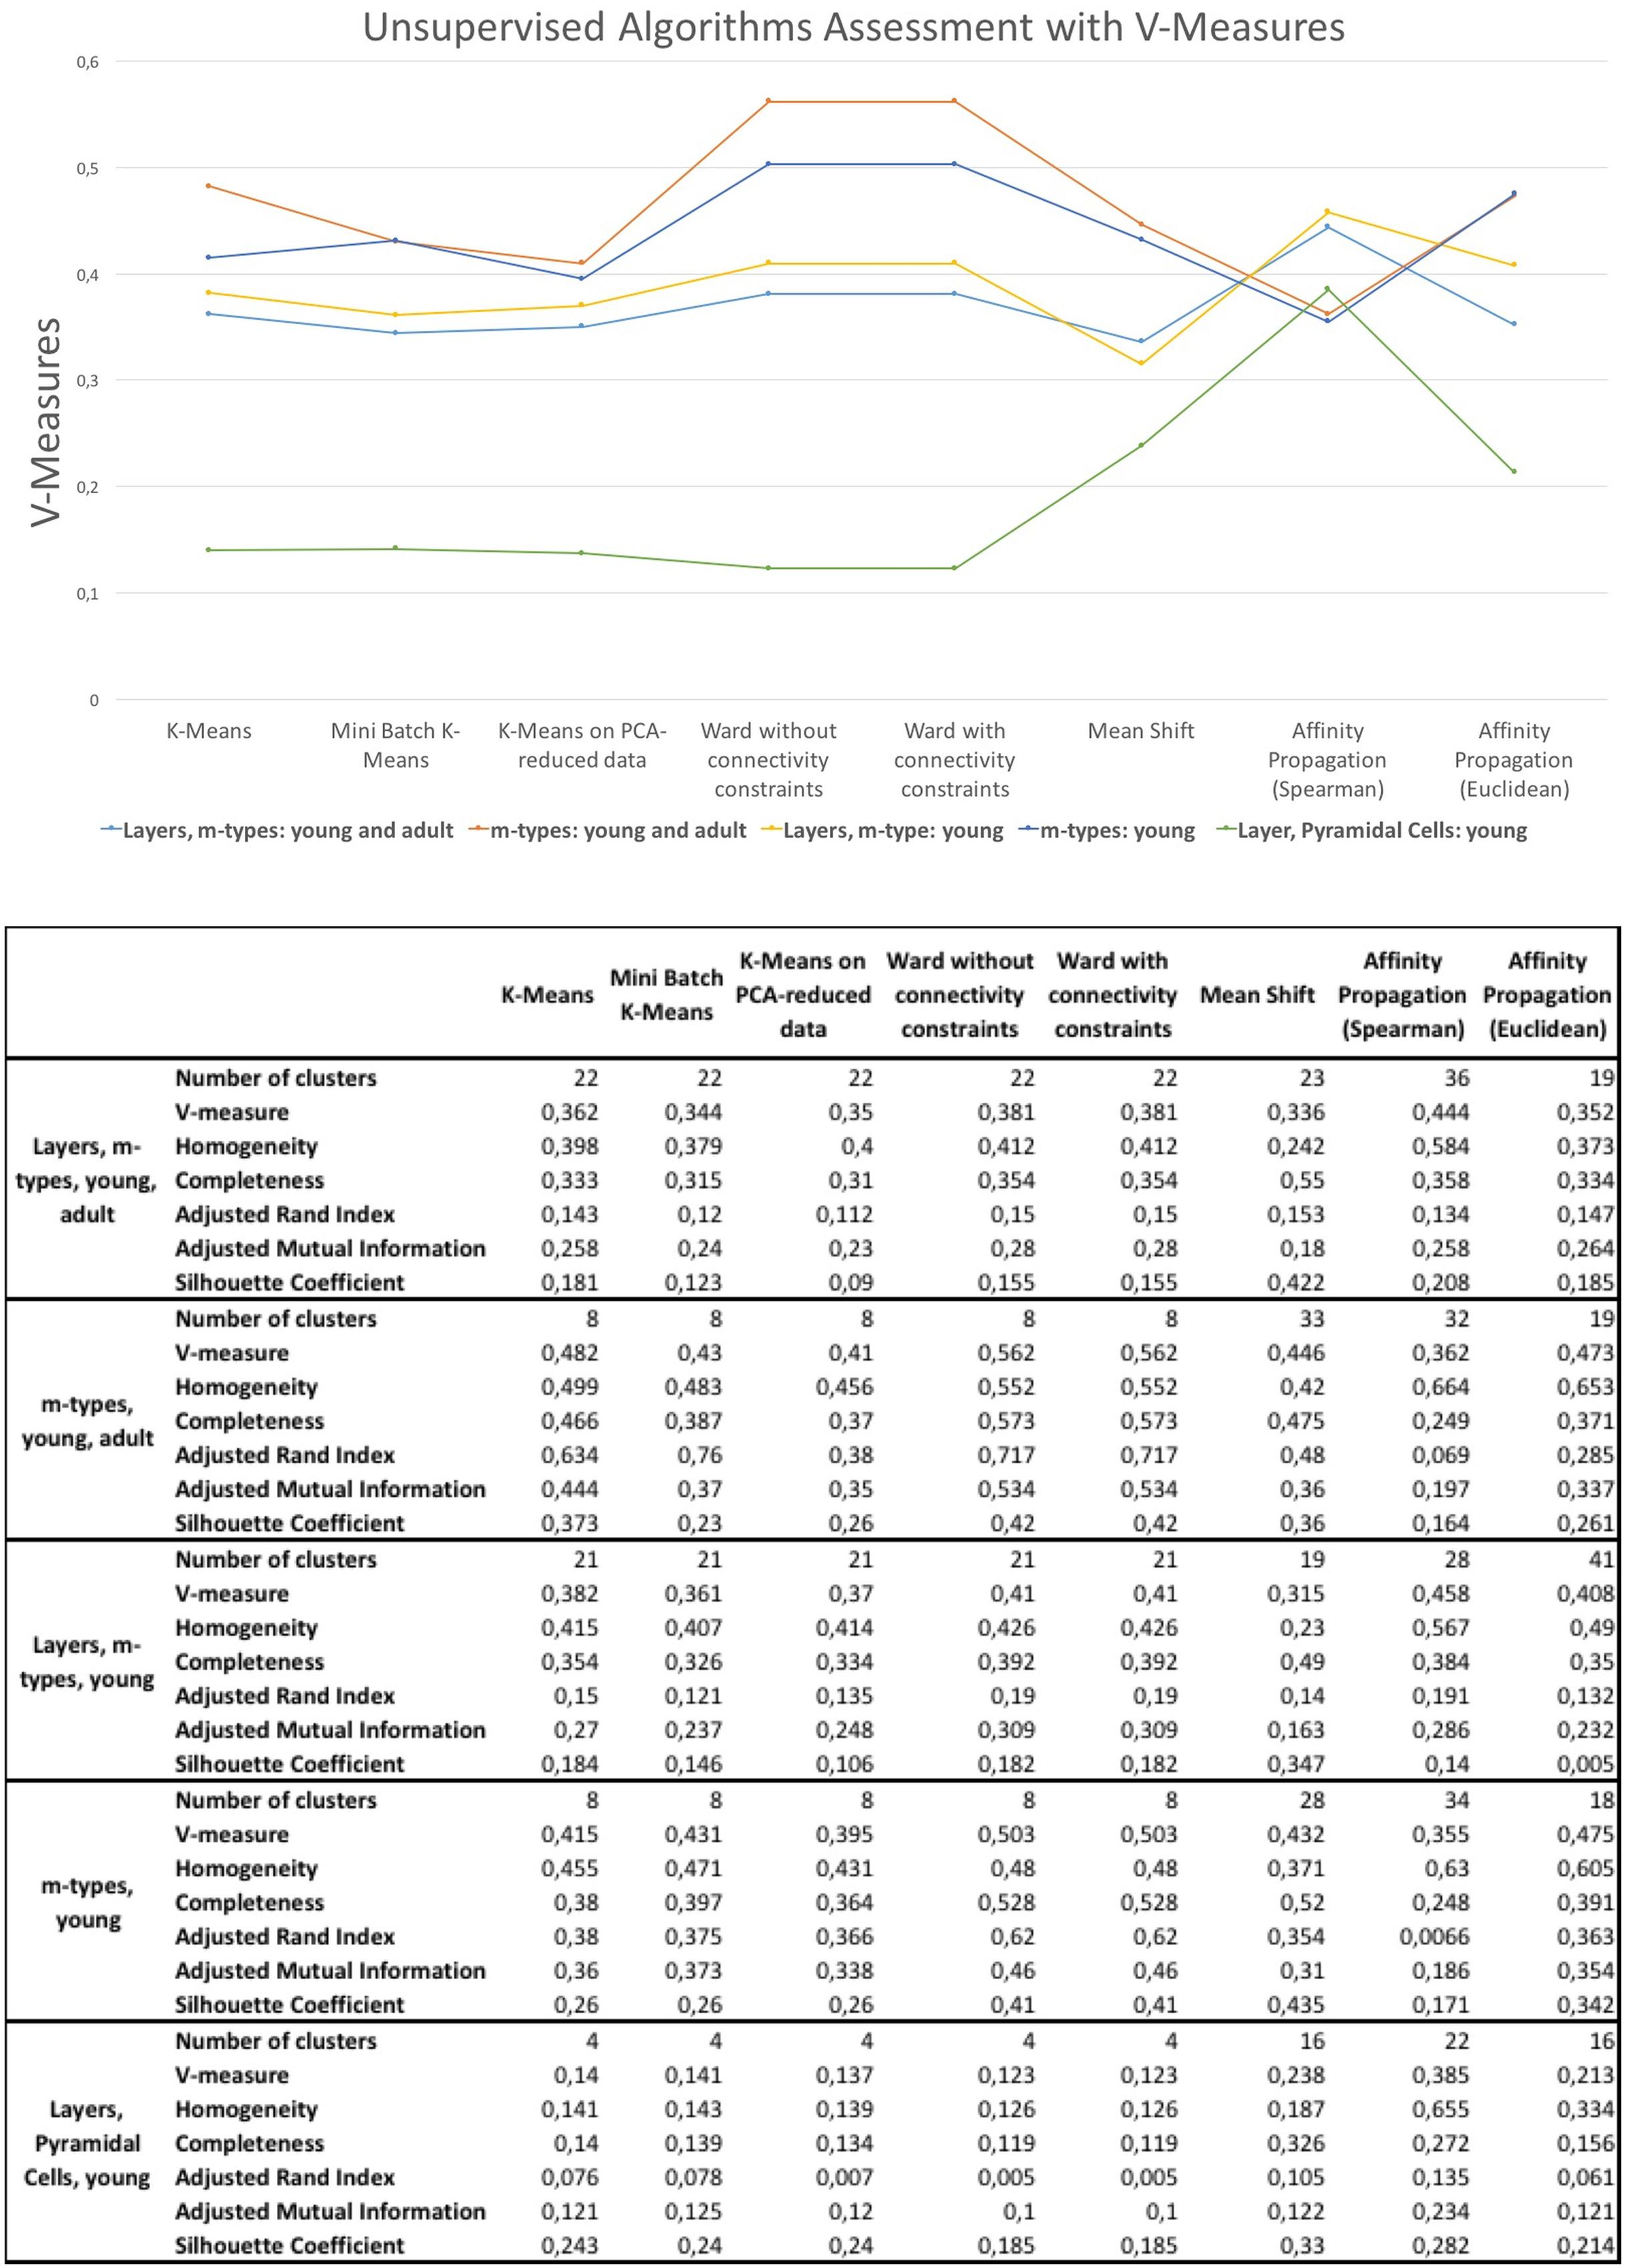
FIGURE 6. V-measures comparison of the unsupervised clustering algorithms classifying morphologies according to layer and m-type, m-type and layer in young an/or adult population. The figure shows also homogeneity scores, completeness scores, adjusted rand index, adjusted mutual information, and silhouette coefficient.
Discussion
Neuron classification remains a challenging topic. However, increasing amounts of morphological, electrophysiological (Sills et al., 2012) and molecular data will help researchers to develop better classifiers by finding clear descriptors throughout a large amount of data and increasing statistical significance. In line with this statement, data sharing and standardized approaches are crucial. Neuroinformatics plays a key role by working on gathering multi-modal data and developing methods and tools allowing users to enhance data analysis and by promoting data sharing and collaboration such as the Human Brain Project (HBP) and the Blue Brain Project (BBP; Markram, 2012, 2013). One of the HBP’s objectives, in particular the Neuroinformatics Platform, is to make it easier for scientists to organize and access data such as neuron morphologies, and the knowledge and tools produced by the neuroscience community.
On the other hand, neuron classification is an example of data increase rendering classification efforts harder rather than easier (DeFelipe et al., 2013). Nowadays, different investigators use their own tools and assign different names for classification of the same neuron rendering classification processes difficult, despite existing initiatives for nomenclature consensus (DeFelipe et al., 2013).
Recently, quantitative methods using supervised and unsupervised classifiers have become standard for classification of neurons based on morphological, physiological, or molecular characteristics. Unsupervised classifications using cluster analysis, notably based on morphological features, provide quantitative and unbiased identification of distinct neuronal subtypes when applied to selected datasets. Recently, Santana et al. (2013) explored the use of an affinity propagation algorithm applied to 109 morphologies of interneurons belonging to four subtypes of neocortical GABAergic neurons (31 BC, 23 ChC, 33 MC, and 22 non-MC) in a blind and non-supervised manner. The results showed an accuracy score of 0.7374 for the affinity propagation and 0.5859 for Ward’s method. McGarry et al. (2010) classified somatostatin-positive neocortical interneurons into three interneuron subtypes using 59 GFP-positive interneurons from mouse. They used unsupervised classification methods with PCA and K-means clustering assessed by the silhouette analysis measures of quality. Tsiola et al. (2003) used PCA and cluster analysis using Euclidean distance by Ward’s method on 158 neurons of Layer 5 neurons from Mouse Primary Visual Cortex. Muralidhar et al. (2014) and Markram et al. (2015) applied classification methodologies on Layer 1 DAC (16), HAC(19), SAC (14), LAC (11), and NGC (17 NGC-DA and 16 NGC-SA) using objective (PCA and LDA), supervised and unsupervised methodologies on the developing rat’s somatosensory cortex using multi-neuron patch-clamp and 3D morphology reconstructions. The study suggested that objective unsupervised classification (using PCA) of neuronal morphologies is currently not possible based on any single independent feature of neuronal morphology of layer 1. The LDA is a supervised method that performs better to classify the L1 morphologies where cell classes were distinctly separated. Additional algorithms can be included in the pipeline presented in our study such as nearest neighbor methods, feature decisions based methods, or those using metric learning that might be more robust for the given problem in low numbers of training samples.
The algorithms in the literature are often applied to small amounts of data, few classes and are often specific to a layer. In our study, we assess and compare accuracy of different classification algorithms and classified neurons according to layer and/or m-type with young and/or adult development state in an important training sample size of neurons. We confirm that supervised with LDA is an excellent classifier showing that quality data are mandatory to predict the class of the morphology to be classified. Subjective classification by a neuroscientist is crucial to improve models on curated data. The limitations of morphological classification (Polavaram et al., 2014) are well known, such as the morphometric differences between laboratories, making the classification harder. Further challenges are the geometry of individual neurons which varies significantly within the same class, the different techniques used to extract morphologies (such as imaging, histology, and reconstruction techniques) which impact the measures, and finally,inter-laboratory variability (Scorcioni et al., 2004). Neuroinformatic tools, computational approaches and their open availability, and data such as NeuroMorpho.org make it possible to develop and compare techniques and improve accuracy.
All unsupervised algorithms applied to a larger number of neurons showed, as expected, lower results. One limitation of these algorithms is that results are strongly linked to parameters of the algorithm that are very sensible. The current form of affinity propagation suffers from a number of drawbacks such as robustness limitations or cluster-shape regularity (Leone et al., 2007), leading to suboptimal performance. PCA gives poor results confirming the conclusion of Muralidhar et al. (2014) that PCA could not generate any meaningful clusters with a poor explained variance in the first principal component. Objective unsupervised classification of neuronal morphologies is currently tricky even using similar unsupervised methods.
Supervised classification seems the best way to classify neurons according to previous subjective classification of neurons. Data curation is critically important. Brain modeling efforts will require huge volumes of standardized, curated data on the brain’s different levels of organization as well as standardized tools for handling them.
One important aspect of classifiers is the evaluation of the algorithms to assess the robustness of classification methods (Rosenberg and Hirschberg, 2007), especially for unsupervised clustering. The silhouette analysis measure of quality (Rousseeuw, 1987) is one of them. More recently, the use of V-measure, an external entropy based cluster evaluation measure, provides an elegant solution to many problems that affect previously defined cluster evaluation measures (Rosenberg and Hirschberg, 2007). Features selection would show important features to classify morphologies. Taking into account only the significant features to classify morphologies will increase the accuracy of classification algorithms. Features selection is a compromise between running time by selecting the minimum sized subset of features and classification accuracy (Tang et al., 2014). The combination of different types of descriptors is crucial and can serve to both sharpen and validate the distinction between different neurons (Helmstaedter et al., 2008, 2009; Druckmann et al., 2012). We propose that the appropriate strategy is to first consider each type of descriptor separately, and then to combine them, one by one, as the data set increases. Independently analyzing different types of descriptors allows their statistical power to be clearly examined. A next step of this work will be to combine morphology data with other types of data such as electrophysiology and select the significant features which help improve classification algorithms with curated data.
The understanding of any neural circuit requires the identification and characterization of all its components (Tsiola et al., 2003). Neuronal complexity makes their study challenging as illustrated by their classification and nomenclature (Bota and Swanson, 2007; DeFelipe et al., 2013), still subject to intense debate. While this study deals with morphologies obtainable in optic microscope it would be useful to know how the electron microscopic features can also be exploited. Integrating and analyzing key datasets, models and insights into the fabric of current knowledge will help the neuroscience community to face these challenges (Markram, 2012, 2013; Kandel et al., 2013). Gathering multimodal data is a way of improving statistical models and can provide useful insights by comparing data on a large scale, including cross-species comparisons and cross datasets from different layers of the brain including electrophysiology (Menendez de la Prida et al., 2003; Czanner et al., 2008), transcriptome, protein, chromosome, or synaptic (Kalisman et al., 2003; Hill et al., 2012; Wichterle et al., 2013).
Author Contributions
XV is the main contributor of the article from the development of the code to results, study of the results, and writing article. LC supervised and wrote the article. LV and GV did code optimization.
Conflict of Interest Statement
The authors declare that the research was conducted in the absence of any commercial or financial relationships that could be construed as a potential conflict of interest.
Acknowledgment
We acknowledge Alliance France Dystonie and IBM France (Corporate Citizenship and Corporate Affairs) for their support.
Supplementary Material
The Supplementary Material for this article can be found online at: http://journal.frontiersin.org/article/10.3389/fnana.2016.00102/full#supplementary-material
FIGURE S1 | Block Diagram of the python pipeline.
DATASHEET S1 | File containing all the name of the neurons (Neuron_ID.xlsx) from which the particular neurons can be identified and inspected.
Footnotes
- ^ http://cng.gmu.edu:8080/Lm/help/index.htm
- ^ http://scikit-learn.org
- ^ http://www.python.org, 2012
- ^ http://scikit-learn.org/stable/
- ^ http://www.numpy.org
- ^ http://scipy.org
- ^ http://cng.gmu.edu:8080/Lm/help/index.htm
References
Abdi, H., and Williams, L. J. (2010). Principal component analysis. Wiley Interdiscip. Rev. Comput. Stat. 2, 433–459. doi: 10.1002/wics.101
Albanese, D., Visintainer, R., Merler, S., Riccadonna, S., Jurman, G., and Furlanello, C. (2012). Mlpy: machine learning python. arXiv.
Aliyari Ghassabeh, Y., Rudzicz, F., and Moghaddam, H. A. (2015). Fast incremental LDA feature extraction. Pattern Recognit. 48, 1999–2012. doi: 10.1016/j.patcog.2014.12.012
Altman, N. S. (1992). An introduction to kernel and nearest-neighbor nonparametric regression. Am. Stat. 46, 175–185. doi: 10.1080/00031305.1992.10475879
Ascoli, G. A. (2002a). Computational Neuroanatomy, Principles and Methods. Totawa, NJ: Humana Press.
Ascoli, G. A. (2002b). Neuroanatomical algorithms for dendritic modelling. Network 13, 247–260. doi: 10.1088/0954-898X_13_3_301
Ascoli, G. A. (2006). Mobilizing the base of neuroscience data: the case of neuronal morphologies. Nat. Rev. Neurosci. 7, 318–324. doi: 10.1038/nrn1885
Ascoli, G. A., Donohue, D. E., and Halavi, M. (2007). NeuroMorpho.Org: a central resource for neuronal morphologies. J. Neurosci. 27, 9247–9251. doi: 10.1523/JNEUROSCI.2055-07.2007
Ascoli, G. A., Krichmar, J. L., Nasuto, S. J., and Senft, S. L. (2001). Generation, description and storage of dendritic morphology data. Philos. Trans. R. Soc. B Biol. Sci. 356, 1131–1145. doi: 10.1098/rstb.2001.0905
Auer, P., Burgsteiner, H., and Maass, W. (2008). A learning rule for very simple universal approximators consisting of a single layer of perceptrons. Neural Netw. 21, 786–795. doi: 10.1016/j.neunet.2007.12.036
Bar-Ilan, L., Gidon, A., and Segev, I. (2013). The role of dendritic inhibition in shaping the plasticity of excitatory synapses. Front. Neural Circuits 6:118. doi: 10.3389/fncir.2012.00118
Becker, H. (2011). Identication and Characterization of Events in Social Media. Ph.D. thesis, Columbia University, New York, NY.
Bentley, J. L., Stanat, D. F., and Williams, E. H. (1977). The complexity of finding fixed-radius near neighbors. Inform. Process. Lett. 6, 209–212. doi: 10.1016/0020-0190(77)90070-9
Biggs, D., De Ville, B., and Suen, E. (1991). A method of choosing multiway partitions for classification and decision trees. J. Appl. Stat. 18, 49–62. doi: 10.1080/02664769100000005
Boser, B. E., Guyon, I. M., and Vapnik, V. N. (1992). “A training algorithm for optimal margin classifiers,” in Proceedings of the Fifth Annual Workshop on Computational Learning Theory (New York, NY: ACM Press), 144–152.
Bota, M., and Swanson, L. W. (2007). The neuron classification problem. Brain Res. Rev. 56, 79–88. doi: 10.1016/j.brainresrev.2007.05.005
Breiman, L., Friedman, J. H., Olshen, R. A., and Stone, C. J. (1984). Classification and Regression Trees. Monterey, CA: Wadsworth & Brooks/Cole Advanced Books & Software.
Cauli, B., Audinat, E., Lambolez, B., Angulo, M. C., Ropert, N., Tsuzuki, K., et al. (1997). Molecular and physiological diversity of cortical nonpyramidal cells. J. Neurosci. 17, 3894–3906.
Cheng, Y. (1995). Mean shift, mode seeking, and clustering. IEEE Trans. Pattern Anal. Mach. Intell. 17, 790–799. doi: 10.1109/34.400568
Comaniciu, D., and Meer, P. (2002). Mean shift: a robust approach toward feature space analysis. IEEE Trans. Pattern Anal. Mach. Intell. 24, 603–619. doi: 10.1109/34.1000236
Coomans, D., and Massart, D. L. (1982). Alternative k-nearest neighbour rules in supervised pattern recognition. Anal. Chim. Acta 136, 15–27. doi: 10.1016/S0003-2670(01)95359-0
Cordeiro de Amorim, R., and Mirkin, B. (2012). Minkowski metric, feature weighting and anomalous cluster initializing in K-Means clustering. Pattern Recognit. 45, 1061–1075. doi: 10.1016/j.patcog.2011.08.012
Cover, T., and Hart, P. (1967). Nearest neighbor pattern classification. IEEE Trans. Inf. Theory 13, 21–27. doi: 10.1109/TIT.1967.1053964
Cuntz, H., Forstner, F., Borst, A., and Häusser, M. (2011). The Trees Toolbox—Probing the basis of axonal and dendritic branching. Neuroinformatics 9, 91–96. doi: 10.1007/s12021-010-9093-7
Czanner, G., Eden, U. T., Wirth, S., Yanike, M., Suzuki, W. A., and Brown, E. N. (2008). Analysis of between-trial and within-trial neural spiking dynamics. J. Neurophysiol. 99, 2672–2693. doi: 10.1152/jn.00343.2007
de Amorim, R. C. (2015). Feature relevance in ward’s hierarchical clustering using the Lp norm. J. Classif. 32, 46–62. doi: 10.1007/s00357-015-9167-1
de Amorim, R. C., and Hennig, C. (2015). Recovering the number of clusters in data sets with noise features using feature rescaling factors. Inform. Sci. 324, 126–145. doi: 10.1016/j.ins.2015.06.039
DeFelipe, J., López-Cruz, P. L., Benavides-Piccione, R., Bielza, C., Larrañaga, P., Anderson, S., et al. (2013). New insights into the classification and nomenclature of cortical GABAergic interneurons. Nat. Rev. Neurosci. 14, 202–216. doi: 10.1038/nrn3444
Demir, G. K., and Ozmehmet, K. (2005). Online local learning algorithms for linear discriminant analysis. Pattern Recognit. Lett. 26, 421–431. doi: 10.1016/j.patrec.2004.08.005
Ding, C., and He, X. (2004). “K-means clustering via principal component analysis,” in Proceedings of the 21 st International Conference on Machine Learning, Banff, AB.
Dominic, S., Das, R., Whitley, D., and Anderson, C. (1991). “Genetic reinforcement learning for neural networks,” in Proceedings of the IJCNN-91-Seattle International Joint Conference on Neural Networks (Seattle, WA: IEEE), 71–76. doi: 10.1109/IJCNN.1991.155315
Druckmann, S., Hill, S., Schurmann, F., Markram, H., and Segev, I. (2012). A hierarchical structure of cortical interneuron electrical diversity revealed by automated statistical analysis. Cereb. Cortex 23, 2994–3006. doi: 10.1093/cercor/bhs290
Duan, K.-B., and Keerthi, S. S. (2005). “Which is the best multiclass SVM method? An empirical study,” in Multiple Classifier Systems, eds N. C. Oza, R. Polikar, J. Kittler, and F. Roli (Berlin: Springer), 278–285.
Farley, B., and Clark, W. (1954). Simulation of self-organizing systems by digital computer. Trans. IRE Profess. Group Inform. Theory 4, 76–84. doi: 10.1109/TIT.1954.1057468
Ferguson, T. S. (1982). An inconsistent maximum likelihood estimate. J. Am. Stat. Assoc. 77, 831–834. doi: 10.1080/01621459.1982.10477894
Ferris, M. C., and Munson, T. S. (2002). Interior-point methods for massive support vector machines. SIAM J. Optim. 13, 783–804. doi: 10.1137/S1052623400374379
Fisher, R. A. (1936). The use of multiple measurements in taxonomic problems. Ann. Eugen. 7, 179–188. doi: 10.1111/j.1469-1809.1936.tb02137.x
Frey, B. J., and Dueck, D. (2007). Clustering by passing messages between data points. Science 315, 972–976. doi: 10.1126/science.1136800
Friedman, J. H. (1989). Regularized discriminant analysis. J. Am. Stat. Assoc. 84:165. doi: 10.2307/2289860
Fukunaga, K., and Hostetler, L. (1975). The estimation of the gradient of a density function, with applications in pattern recognition. IEEE Trans. Inform. Theory 21, 32–40. doi: 10.1109/TIT.1975.1055330
Fukushima, K. (1980). Neocognitron: a self organizing neural network model for a mechanism of pattern recognition unaffected by shift in position. Biol. Cybern. 36, 193–202. doi: 10.1007/BF00344251
Gidon, A., and Segev, I. (2012). Principles governing the operation of synaptic inhibition in dendrites. Neuron 75, 330–341. doi: 10.1016/j.neuron.2012.05.015
Guerra, L., McGarry, L. M., Robles, V., Bielza, C., Larrañaga, P., and Yuste, R. (2011). Comparison between supervised and unsupervised classifications of neuronal cell types: a case study. Dev. Neurobiol. 71, 71–82. doi: 10.1002/dneu.20809
Guyon, I., Boser, B., and Vapnik, V. (1993). Automatic capacity tuning of very large VC-dimension classifiers. Adv. Neural Inform. Process. 5, 147–155.
Halavi, M., Polavaram, S., Donohue, D. E., Hamilton, G., Hoyt, J., Smith, K. P., et al. (2008). NeuroMorpho.Org implementation of digital neuroscience: dense coverage and integration with the NIF. Neuroinformatics 6, 241–252. doi: 10.1007/s12021-008-9030-1
Hart, P. (1968). The condensed nearest neighbor rule (Corresp.). IEEE Trans. Inform. Theory 14, 515–516. doi: 10.1109/TIT.1968.1054155
Helmstaedter, M., Sakmann, B., and Feldmeyer, D. (2008). L2/3 interneuron groups defined by multiparameter analysis of axonal projection, dendritic geometry, and electrical excitability. Cereb. Cortex 19, 951–962. doi: 10.1093/cercor/bhn130
Helmstaedter, M., Sakmann, B., and Feldmeyer, D. (2009). The relation between dendritic geometry, electrical excitability, and axonal projections of L2/3 interneurons in rat barrel cortex. Cereb. Cortex 19, 938–950. doi: 10.1093/cercor/bhn138
Hill, S. L., Wang, Y., Riachi, I., Schurmann, F., and Markram, H. (2012). Statistical connectivity provides a sufficient foundation for specific functional connectivity in neocortical neural microcircuits. Proc. Natl. Acad. Sci. U.S.A. 109, E2885–E2894. doi: 10.1073/pnas.1202128109
Ho, T. K. (1995). “Random decision forests,” in Proceedings of the 3rd International Conference Document Analyse Recognition, Vol. 1, Piscataway, NJ, 278–282.
Ho, T. K. (1998). The random subspace method for constructing decision forests. IEEE Trans. Pattern Anal. Mach. Intell. 20, 832–844. doi: 10.1109/34.709601
Hoskins, J. C., and Himmelblau, D. M. (1992). Process control via artificial neural networks and reinforcement learning. Comput. Chem. Eng. 16, 241–251. doi: 10.1016/0098-1354(92)80045-B
Hotelling, H. (1933). Analysis of a complex of statistical variables into principal components. J. Educ. Psychol. 24, 417–441. doi: 10.1037/h0071325
Insel, T. R., Volkow, N. D., Landis, S. C., Li, T.-K., Battey, J. F., and Sieving, P. (2004). Limits to growth: why neuroscience needs large-scale science. Nat. Neurosci. 7, 426–427. doi: 10.1038/nn0504-426
Jain, A. K. (2010). Data clustering: 50 years beyond K-means. Pattern Recognit. Lett. 31, 651–666. doi: 10.1016/j.patrec.2009.09.011
Jessop, M., Weeks, M., and Austin, J. (2010). CARMEN: a practical approach to metadata management. Philos. Trans. R. Soc. Math. Phys. Eng. Sci. 368, 4147–4159. doi: 10.1098/rsta.2010.0147
Kalisman, N., Silberberg, G., and Markram, H. (2003). Deriving physical connectivity from neuronal morphology. Biol. Cybern. 88, 210–218. doi: 10.1007/s00422-002-0377-3
Kandel, E. R., Markram, H., Matthews, P. M., Yuste, R., and Koch, C. (2013). Neuroscience thinks big (and collaboratively). Nat. Rev. Neurosci. 14, 659–664. doi: 10.1038/nrn3578
Kanungo, T., Mount, D. M., Netanyahu, N. S., Piatko, C. D., Silverman, R., and Wu, A. Y. (2002). An efficient k-means clustering algorithm: analysis and implementation. IEEE Trans. Pattern Anal. Mach. Intell. 24, 881–892. doi: 10.1109/TPAMI.2002.1017616
Karagiannis, A., Gallopin, T., David, C., Battaglia, D., Geoffroy, H., Rossier, J., et al. (2009). Classification of NPY-expressing neocortical interneurons. J. Neurosci. 29, 3642–3659. doi: 10.1523/JNEUROSCI.0058-09.2009
Karube, F., Kubota, Y., and Kawaguchi, Y. (2004). Axon branching and synaptic bouton phenotypes in GABAergic nonpyramidal cell subtypes. J. Neurosci. 24, 2853–2865. doi: 10.1523/JNEUROSCI.4814-03.2004
Kass, G. V. (1980). An exploratory technique for investigating large quantities of categorical data. Appl. Stat. 29, 119. doi: 10.2307/2986296
Kiwiel, K. C. (2001). Convergence and efficiency of subgradient methods for quasiconvex minimization. Math. Program. 90, 1–25. doi: 10.1007/PL00011414
Lee, Y., Lin, Y., and Wahba, G. (2004). Multicategory support vector machines: theory and application to the classification of microarray data and satellite radiance data. J. Am. Stat. Assoc. 99, 67–81. doi: 10.1198/016214504000000098
Leone, M., Sumedha, and Weigt, M. (2007). Clustering by soft-constraint affinity propagation: applications to gene-expression data. Bioinformatics 23, 2708–2715. doi: 10.1093/bioinformatics/btm414
Lloyd, S. (1982). Least squares quantization in PCM. IEEE Trans. Inform. Theory 28, 129–137. doi: 10.1109/TIT.1982.1056489
Ma, Y. (2006). Distinct subtypes of somatostatin-containing neocortical interneurons revealed in transgenic mice. J. Neurosci. 26, 5069–5082. doi: 10.1523/JNEUROSCI.0661-06.2006
Machine Learning Summer School and Machine Learning Summer School (2004). Advanced Lectures on Machine Learning: ML Summer Schools 2003, Canberra, Australia, February 2-14, 2003 [and] Tübingen, Germany, August 4-16, 2003: Revised Lectures, eds O. Bousquet, U. von Luxburg, and G. Rätsch. New York, NY: Springer.
MacKay, D. J. C. (2003). Information Theory, Inference, and Learning Algorithms. Cambridge: Cambridge University Press.
MacQueen, J. B. (1967). Some methods for classification and analysis of multivariate observations,” in Proceedings of the 5th Berkeley Symposium on Mathematical Statistics and Probability, Vol. 1 (Berkeley, CA: University of California Press), 281–297.
Manning, C. D. (2008). Introduction to Information Retrieval. New York, NY: Cambridge University Press.
Markram, H. (2012). The human brain project. Sci. Am. 306, 50–55. doi: 10.1038/scientificamerican0612-50
Markram, H., Muller, E., Ramaswamy, S., Reimann, M. W., Abdellah, M., Sanchez, C. A., et al. (2015). Reconstruction and simulation of neocortical microcircuitry. Cell 163, 456–492. doi: 10.1016/j.cell.2015.09.029
Martinez, A. M., and Kak, A. C. (2001). PCA versus LDA. IEEE Trans. Pattern Anal. Mach. Intell. 23, 1274–1286. doi: 10.1109/34.908974
McCulloch, W. S., and Pitts, W. (1943). A logical calculus of the ideas immanent in nervous activity. Bull. Math. Biophys. 5, 115–133. doi: 10.1007/BF02478259
McGarry, L. M., Packer, A. M., Fino, E., Nikolenko, V., Sippy, T., and Yuste, R. (2010). Quantitative classification of somatostatin-positive neocortical interneurons identifies three interneuron subtypes. Front. Neural Circuits. 4:12. doi: 10.3389/fncir.2010.00012
Menendez de la Prida, L., Suarez, F., and Pozo, M. A. (2003). Electrophysiological and morphological diversity of neurons from the rat subicular complex in vitro. Hippocampus 13, 728–744. doi: 10.1002/hipo.10123
Meyer, D., Leisch, F., and Hornik, K. (2003). The support vector machine under test. Neurocomputing 55, 169–186. doi: 10.1016/S0925-2312(03)00431-4
Muralidhar, S., Wang, Y., and Markram, H. (2014). Synaptic and cellular organization of layer 1 of the developing rat somatosensory cortex. Front. Neuroanat. 7:52. doi: 10.3389/fnana.2013.00052
Oswald, M. J., Tantirigama, M. L. S., Sonntag, I., Hughes, S. M., and Empson, R. M. (2013). Diversity of layer 5 projection neurons in the mouse motor cortex. Front. Cell. Neurosci. 7:174. doi: 10.3389/fncel.2013.00174
Park, J., and Sandberg, I. W. (1991). Universal approximation using radial-basis-function networks. Neural Comput. 3, 246–257. doi: 10.1162/neco.1991.3.2.246
Patil, N., Lathi, R., and Chitre, V. (2012). Comparison of C5.0 & CART Classification algorithms using pruning technique. Int. J. Eng. Res. Technol. 1, 1–5.
Polavaram, S., Gillette, T. A., Parekh, R., and Ascoli, G. A. (2014). Statistical analysis and data mining of digital reconstructions of dendritic morphologies. Front. Neuroanat. 8:138. doi: 10.3389/fnana.2014.00138
Prinzie, A., and Van den Poel, D. (2008). Random forests for multiclass classification: random multinomial logit. Expert Syst. Appl. 34, 1721–1732. doi: 10.1016/j.eswa.2007.01.029
Quinlan, J. R. (1983). “Learning efficient classification procedures and their application to chess end games,” in Machine Learning, eds R. S. Michalski, J. G. Carbonell, and T. M. Mitchell (Berlin: Springer), 463–482.
Quinlan, J. R. (1987). Simplifying decision trees. Int. J. Man-Mach. Stud. 27, 221–234. doi: 10.1016/S0020-7373(87)80053-6
Ramaswamy, S., Hill, S. L., King, J. G., Schürmann, F., Wang, Y., and Markram, H. (2012). Intrinsic morphological diversity of thick-tufted layer 5 pyramidal neurons ensures robust and invariant properties of in silico synaptic connections: comparison of in vitro and in silico TTL5 synaptic connections. J. Physiol. 590, 737–752. doi: 10.1113/jphysiol.2011.219576
Rish, I. (2001). An empirical study of the naive Bayes classifier. IBM Res. Rep. Comput. Sci. 3, 41–46.
Rochester, N., Holland, J., Haibt, L., and Duda, W. (1956). Tests on a cell assembly theory of the action of the brain, using a large digital computer. IEEE Trans. Inform. Theory 2, 80–93. doi: 10.1109/TIT.1956.1056810
Rokach, L. (2008). Data Mining with Decision Trees: Theroy and Applications. Hackensack, NJ: World Scientific.
Rosenberg, A., and Hirschberg, J. (2007). “V-Measure: a conditional entropy-based external cluster evaluation measure,” in Proceedings of the 2007 Joint Conference Empirical Methods Natural Language Processing Computational Natural Language Learning EMNLP-CoNLL (Stroudsburg PA: Association for Computational Linguistics), 410–420.
Rousseeuw, P. J. (1987). Silhouettes: a graphical aid to the interpretation and validation of cluster analysis. J. Comput. Appl. Math. 20, 53–65. doi: 10.1016/0377-0427(87)90125-7
Russell, S. J., and Norvig, P. (2003a). Artificial Intelligence: A Modern Approach; [The Intelligent Agent Book], 2 Edn. Upper Saddle River, NJ: Prentice Hall.
Russell, S. J., and Norvig, P. (2003b). ““idiot Bayes” as well as the general definition of the naive bayes model and its independence assumptions,” in Artificial Intelligence: A Modern Approach, 2 Edn (Upper Saddle River: Pearson Education), 499.
Santana, R., McGarry, L. M., Bielza, C., Larrañaga, P., and Yuste, R. (2013). Classification of neocortical interneurons using affinity propagation. Front. Neural Circuits 7:185. doi: 10.3389/fncir.2013.00185
Schierwagen, A., and Grantyn, R. (1986). Quantitative morphological analysis of deep superior colliculus neurons stained intracellularly with HRP in the cat. J. Hirnforsch. 27, 611–623.
Schmitz, S. K., Hjorth, J. J. J., Joemai, R. M. S., Wijntjes, R., Eijgenraam, S., de Bruijn, P., et al. (2011). Automated analysis of neuronal morphology, synapse number and synaptic recruitment. J. Neurosci. Methods 195, 185–193. doi: 10.1016/j.jneumeth.2010.12.011
Schwenker, F., Kestler, H. A., and Palm, G. (2001). Three learning phases for radial-basis-function networks. Neural Netw. 14, 439–458. doi: 10.1016/S0893-6080(01)00027-2
Scorcioni, R., Lazarewicz, M. T., and Ascoli, G. A. (2004). Quantitative morphometry of hippocampal pyramidal cells: differences between anatomical classes and reconstructing laboratories. J. Comp. Neurol. 473, 177–193. doi: 10.1002/cne.20067
Scorcioni, R., Polavaram, S., and Ascoli, G. A. (2008). L-Measure: a web-accessible tool for the analysis, comparison and search of digital reconstructions of neuronal morphologies. Nat. Protoc. 3, 866–876. doi: 10.1038/nprot.2008.51
Sculley, D. (2010). “Web-scale k-means clustering,” in Proceedings of the 19th international Conference on World Wide Web, Pages, (New York, NY: ACM), 1177–1178.
Sharma, A., and Paliwal, K. K. (2010). Improved nearest centroid classifier with shrunken distance measure for null LDA method on cancer classification problem. Electron. Lett. 46, 1251–1252. doi: 10.1049/el.2010.1927
Shi, T., and Horvath, S. (2006). Unsupervised learning with random forest predictors. J. Comput. Graph. Stat. 15, 118–138. doi: 10.1198/106186006X94072
Shi, T., Seligson, D., Belldegrun, A. S., Palotie, A., and Horvath, S. (2005). Tumor classification by tissue microarray profiling: random forest clustering applied to renal cell carcinoma. Mod. Pathol. 18, 547–557. doi: 10.1038/modpathol.3800322
Sills, J. B., Connors, B. W., and Burwell, R. D. (2012). Electrophysiological and morphological properties of neurons in layer 5 of the rat postrhinal cortex. Hippocampus 22, 1912–1922. doi: 10.1002/hipo.22026
Tang, J., Alelyani, S., and Liu, H. (2014). “Feature selection for classification: a review,” in Data Classification: Algorithms and Applications, Chap. 2, ed. C. C. Aggarwal (Boca Raton, FL: CRC Press), 37–64.
Terrell, G. R., and Scott, D. W. (1992). Variable kernel density estimation. Ann. Stat. 20, 1236–1265. doi: 10.1214/aos/1176348768
Tibshirani, R., Hastie, T., Narasimhan, B., and Chu, G. (2002). Diagnosis of multiple cancer types by shrunken centroids of gene expression. Proc. Natl. Acad. Sci. U.S.A. 99, 6567–6572. doi: 10.1073/pnas.082099299
Tsiola, A., Hamzei-Sichani, F., Peterlin, Z., and Yuste, R. (2003). Quantitative morphologic classification of layer 5 neurons from mouse primary visual cortex. J. Comp. Neurol. 461, 415–428. doi: 10.1002/cne.10628
van Pelt, J., and Schierwagen, A. (2004). Morphological analysis and modeling of neuronal dendrites. Math. Biosci. 188, 147–155. doi: 10.1016/j.mbs.2003.08.006
Vattani, A. (2011). k-means requires exponentially many iterations even in the plane. Discrete Comput. Geom. 45, 596–616. doi: 10.1007/s00454-011-9340-1
Vinh, N. X., Epps, J., and Bailey, J. (2009). “Information theoretic measures for clusterings comparison: is a correction for chance necessary?,” in Proceedings, Twenty-sixth International Conference on Machine Learning, ed. B. L. International Conference on Machine Learning Madison (St, Madison, WI: Omnipress).
Vlasblom, J., and Wodak, S. J. (2009). Markov clustering versus affinity propagation for the partitioning of protein interaction graphs. BMC Bioinformatics 10:99. doi: 10.1186/1471-2105-10-99
Wang, Y., Gupta, A., Toledo-Rodriguez, M., Wu, C. Z., and Markram, H. (2002). Anatomical, physiological, molecular and circuit properties of nest basket cells in the developing somatosensory cortex. Cereb. Cortex 12, 395–410. doi: 10.1093/cercor/12.4.395
Ward, J. H. (1963). Hierarchical grouping to optimize an objective function. J. Am. Stat. Assoc. 58, 236–244. doi: 10.1080/01621459.1963.10500845
Wichterle, H., Gifford, D., and Mazzoni, E. (2013). Mapping neuronal diversity one cell at a time. Science 341, 726–727. doi: 10.1126/science.1235884
Keywords: neurons, morphologies, classification, machine learning, supervised learning, unsupervised learning
Citation: Vasques X, Vanel L, Vilette G and Cif L (2016) Morphological Neuron Classification Using Machine Learning. Front. Neuroanat. 10:102. doi: 10.3389/fnana.2016.00102
Received: 01 May 2016; Accepted: 07 October 2016;
Published: 01 November 2016.
Edited by:
Alberto Munoz, Complutense University of Madrid, SpainReviewed by:
Alex Pappachen James, Nazarbayev University, KazakhstanZoltan F. Kisvarday, University of Debrecen, Hungary
Copyright © 2016 Vasques, Vanel, Vilette and Cif. This is an open-access article distributed under the terms of the Creative Commons Attribution License (CC BY). The use, distribution or reproduction in other forums is permitted, provided the original author(s) or licensor are credited and that the original publication in this journal is cited, in accordance with accepted academic practice. No use, distribution or reproduction is permitted which does not comply with these terms.
*Correspondence: Xavier Vasques, eGF2aWVydmFzcXVlc0BscmVuYy5vcmc=