 Ken Miya
 Kazuko Keino-Masu
 Takuya Okada
 Kenta Kobayashi
 Masayuki Masu
- 1Graduate School of Comprehensive Human Sciences, University of Tsukuba, Tsukuba, Japan
- 2Department of Molecular Neurobiology, Division of Biomedical Science, Faculty of Medicine, University of Tsukuba, Tsukuba, Japan
- 3Section of Viral Vector Development, Center for Genetic Analysis of Behavior, National Institute for Physiological Sciences, National Institutes of Natural Sciences, Okazaki, Japan
The heparan sulfate 6-O-endosulfatases, Sulfatase 1 (Sulf1), and Sulfatase 2 (Sulf2), are extracellular enzymes that regulate cellular signaling by removing 6-O-sulfate from the heparan sulfate chain. Although previous studies have revealed that Sulfs are essential for normal development, their functions in the adult brain remain largely unknown. To gain insight into their neural functions, we used in situ hybridization to systematically examine Sulf1/2 mRNA expression in the adult mouse brain. Sulf1 and Sulf2 mRNAs showed distinct expression patterns, which is in contrast to their overlapping expression in the embryonic brain. In addition, we found that Sulf1 was distinctly expressed in the nucleus accumbens shell, the posterior tail of the striatum, layer 6 of the cerebral cortex, and the paraventricular nucleus of the thalamus, all of which are target areas of dopaminergic projections. Using double-labeling techniques, we showed that Sulf1-expressing cells in the above regions coincided with cells expressing the dopamine D1 and/or D2 receptor. These findings implicate possible roles of Sulf1 in modulation of dopaminergic transmission and dopamine-mediated behaviors.
Introduction
Heparan sulfate proteoglycans (HSPGs) are glycoproteins present on the cell surface and in the extracellular matrix (ECM) of all animal cells. In the nervous system, they play critical roles in neuron growth, differentiation, migration, axon guidance, synapse formation, and synaptic plasticity (Holt and Dickson, 2005; Condomitti and de Wit, 2018; Kamimura and Maeda, 2021). HSPGs are composed of a core protein and covalently attached heparan sulfate (HS) chains. HSPGs exert a wide variety of biological functions via the interactions among HS and growth factors, morphogens, ECM molecules, and enzymes (Perrimon and Bernfield, 2000; Bishop et al., 2007). During their biosynthesis, HS chains undergo a series of modifications including deacetylation, epimerization, and sulfation, which together generate the enormous structural heterogeneity of HS (Perrimon and Bernfield, 2000; Bishop et al., 2007). In addition, further processing can occur by the HS 6-O-endosulfatases, Sulfatase 1 (Sulf1), and Sulfatase 2 (Sulf2). Sulfs remove 6-O-sulfate from HS extracellularly, thereby regulating various cellular signaling pathways positively or negatively (Morimoto-Tomita et al., 2002; Lamanna et al., 2007; Vivès et al., 2014; El Masri et al., 2017). For example, cell signaling by heparin-binding growth factors, such as fibroblast growth factor and vascular endothelial growth factor, is attenuated by Sulf-mediated HS desulfation (Wang et al., 2004; Narita et al., 2006). Conversely, Sulfs promote canonical Wnt signaling by releasing Wnt ligands as a result of the decrease in Wnt–HS interaction (Dhoot et al., 2001; Ai et al., 2003). Thus, Sulfs are considered to be essential for fine-tuning of HS functions under normal physiological conditions and their dysfunction leads to pathological consequences such as carcinogenesis and developmental abnormalities.
Accumulating evidence from animal studies has revealed the functional significance of Sulf genes in vivo. Sulf1/2 knockout mice showed skeletal, renal, lung, inner ear, and neuronal defects during development (Holst et al., 2007; Lum et al., 2007; Ratzka et al., 2008; Freeman et al., 2015). In the development of the nervous system, Sulfs are implicated in specification of oligodendrocyte precursors (Danesin et al., 2006; Touahri et al., 2012; Jiang et al., 2017), esophageal innervation (Ai et al., 2007), neurite outgrowth and migration of cerebellar neurons (Kalus et al., 2015), and axon guidance in the corticospinal tract (Okada et al., 2017). Although the roles of Sulfs in development have been extensively studied, their significance in adult brain functions remains largely unknown. Given that HSPGs are key components of synapse-organizing protein complexes and the well-known presynaptic organizers Neurexins are synthesized as HSPGs, it is possible that Sulfs are involved in synapse assembly, maturation, and plasticity through HS modification (Condomitti and de Wit, 2018; Zhang et al., 2018; Kamimura and Maeda, 2021). Previously, we reported that in the adult rat brain, Sulf1 mRNA is expressed in the cerebral cortex, olfactory tubercle, hypothalamus, and choroid plexus (Ohto et al., 2002), and Sulf2 mRNA, in the cerebral cortex, hippocampus CA3 region, and medial habenula (Nagamine et al., 2005). However, their expression patterns throughout the entire brain and the types of cells expressing Sulfs have not been studied in detail. Therefore, to gain insight into their neural functions, we used in situ hybridization to examine their mRNA expression patterns in the adult mouse brain. We found that Sulf1 and Sulf2 exhibit spatially distinct expression patterns. In addition, we found that Sulf1-expressing cells coincided with the cells expressing the dopamine D1/D2 receptors. These data will provide a clue for elucidating the roles of Sulf genes in higher brain functions.
Materials and Methods
Mice
Sulf1 and Sulf2 knockout (KO) mice were generated as previously described (Nagamine et al., 2012). Both Sulf1 and Sulf2 genes were independently disrupted by inserting a cassette of stop-IRES-lacZ-polyA into their exons using homologous recombination in ES cells. The offspring of mice backcrossed to C57BL/6N for 10 and 14 successive generations for Sulf1 and Sulf2, respectively, were used. Two transgenic lines, Tg(Drd1-cre)EY262Gsat/Mmucd (Drd1-Cre) and Tg(Drd2-cre)ER44Gsat/Mmucd (Drd2-Cre), were obtained from the Mutant Mouse Resource and Research Centers (MMRRC). These mice, originally generated in the FVB/N strain (Gong et al., 2003; Heintz, 2004), were maintained in the C57BL/6J background in the MMRRC and further backcrossed to C57BL/6N for 10 successive generations in our laboratory. Two other yellow-fluorescent-protein (YFP) transgenic lines (Nagai et al., 2016), C57BL/6J-Tg(mDrd1-YFP)680-1Koba (Drd1-YFP) and B6.Cg-Tg(Drd2-YFP)364-5 (Drd2-YFP), were obtained from the RIKEN BioResource Research Center (Tsukuba, Ibaraki, Japan). Genotypes were determined by means of PCR using genomic DNA isolated from mouse tails. All animal experiments were approved by and performed according to the guidelines of the Animal Care and Use Committee of the University of Tsukuba.
In situ Hybridization
Adult male mice (8–12 weeks old, total seven mice) were transcardially perfused with 4% paraformaldehyde (PFA)/phosphate-buffered saline (PBS) while under deep anesthesia induced by intraperitoneal injection of overdose of pentobarbital sodium. The brains were extracted and postfixed with 4% PFA/PBS at 4°C overnight. After cryoprotection with 30% sucrose in PBS, the brains were embedded in Tissue-Tek OCT compound (Sakura Finetek Japan, Tokyo, Japan), frozen, and stored at –25°C. The brains were cut with a cryostat (CM 1850; Leica Biosystems, Wetzlar, Germany) into 50-μm coronal or sagittal slices, collected in 2-ml tubes filled with a cryoprotectant solution (30% glycerol, 30% ethylene glycol, 40% PBS), and stored at –25°C until use. Immediately before hybridization, the slices were washed with PBS with 0.1% Tween-20 (PBST), treated with Proteinase K (1 μg/ml) at 37°C for 5 min, washed with PBST for 1 min three times, and fixed in 4% PFA/PBST for 20 min. After being washed with PBST for 1 min three times, the slices were hybridized with a digoxigenin (DIG)-labeled RNA probe (1 μg/ml) in hybridization solution (50% formamide, 5 × saline-sodium citrate buffer [SSC] pH 4.5, 1% sodium dodecyl sulfate [SDS], 50 μg/ml heparin, 50 μg/ml yeast RNA) at 65°C overnight. After being washed with 50% formamide, 5 × SSC pH 4.5, 1% SDS at 65°C for 30 min; with 50% formamide, 2 × SSC pH 4.5 at 65°C for 30 min three times; and with Tris-buffered saline with 0.1% Tween-20 (TBST) for 5 min three times, the slices were incubated with TBST containing 0.5% blocking reagent (Roche Diagnostics, Mannheim, Germany) for 60 min at room temperature, and then with alkaline phosphatase-conjugated anti-DIG antibody (1:2000; Roche Diagnostics) in TBST containing 0.5% blocking reagent at 4°C overnight. After being washed with TBST for 20 min three times, and then with 100 mM NaCl, 50 mM MgCl2, 100 mM Tris-HCl pH 9.5, 0.1% Tween-20 for 5 min, signals were detected with BM purple (Roche Diagnostics) in the presence of 2 mM levamisole (Sigma-Aldrich, St. Louis, MO, United States) at room temperature for 24 h. The probe contained the sequence 2,810–3,730 for Sulf1 (NM_001198565.1) and the sequence 1,743–2,390 for Sulf2 (NM_028072.5). The slices were washed and mounted on MAS-coated slide glasses (Matsunami Glass Industry, Osaka, Japan), and the coverslips were mounted using Fluoromount-G (Southern Biotech, Birmingham, AL, United States). Images were recorded using a digital microscope (Biozero BZ-8000; Keyence, Osaka, Japan) and a microscope (Axioplan 2; Carl Zeiss, Jena, Germany). Sulf1 or Sulf2 KO mice were used as negative controls. Brain regions were identified by reference to The Mouse Brain in Stereotaxic Coordinates by Franklin and Paxinos (2008) and to the Allen Brain Atlas1.
Stereotactic Surgery
Adeno-associated virus (AAV) vectors were packaged using the AAV Helper Free Expression System (Cell Biolabs, San Diego, CA, United States). Briefly, the packaging plasmids (pAAV-RC5 and pHelper) and pAAV-hSyn-DIO-mCherry were transfected into HEK293T cells by means of the calcium phosphate method (Sano et al., 2020). A crude lysate was purified by means of serial ultracentrifugation with cesium chloride. The purified virus particles were dialyzed and concentrated with an Amicon 10K MWCO filter (Merck Millipore, Darmstadt, Germany). The copy number of the viral genome was determined by means of real-time PCR (approximately 1.1 × 10¹³ viral genome/ml).
Adult male mice (9–38 weeks old, total 10 mice) were used for viral injection. The mice were anesthetized with a mixture of midazolam, medetomidine, and butorphanol (4, 0.75, and 5 mg/kg body weight) and head-fixed on a stereotaxic frame (David Kopf Instruments, Tujunga, CA, United States). After craniotomy, an AAV vector was injected using Micro-Hematocrit Capillary Tubes (Fisher Scientific, Pittsburgh, PA, United States) and a pressure microinjector (KDS 101; Muromachi, Tokyo, Japan) at a rate of 100 nl/min. The stereotactic coordinates and injection volumes were as follows: for the nucleus accumbens shell (NAcSh), anterior-posterior (AP) 1.6 mm, medial-lateral (ML) 0.6 mm, dorsal-ventral (DV) 4.0 mm, 1 μl; for the posterior tail of the striatum (TS), AP −1.0 mm, ML 3.2 mm, DV 3.2 mm, 500 nl; for the prefrontal cortex (PFC), AP 2.0 mm, ML 0.4 mm, DV 2.4 mm, 500 nl; and for the paraventricular nucleus of the thalamus (PVT), AP−1.2 mm, ML 0.45 mm, DV 3.2 mm with a 10° angle toward the midline, 500 nl. The injection needle was withdrawn 5 min after the end of the injection. The mice were fixed by perfusion 2 weeks after the injection.
Immunohistochemistry
Adult male mice (8–40 weeks old, total 21 mice) were transcardially perfused with 4% PFA/PBS while under deep anesthesia induced by intraperitoneal injection of overdose of pentobarbital sodium. The extracted brains were postfixed with 4% PFA/PBS at 4°C overnight. The brains were cut into 50-μm coronal slices by use of a vibratome (VT1000 S; Leica Biosystems). After the slices were serially dehydrated through 25–80% methanol/PBST and then serially rehydrated into PBST, they were incubated with primary antibodies in PBST containing 0.5% blocking reagent (Roche Diagnostics) at room temperature overnight. The slices were washed with PBST for 15 min three times, and then incubated with secondary antibodies in PBST containing 0.5% blocking reagent at room temperature for 2 h. The primary antibodies used were anti-green fluorescent protein (GFP) (A11122, 1:1000 dilution; Molecular Probes, Eugene, OR, United States), anti-β-galactosidase (4600-1409, 1:1000 dilution; Biogenesis, Poole, United Kingdom), anti-NeuN (MAB377, 1:500 dilution; Chemicon International, Temecula, CA, United States), and anti-S100 beta (ab41548, 1:1000 dilution; Abcam, Cambridge, United Kingdom). The secondary antibodies used were Alexa Fluor Plus 488- or Alexa Fluor Plus 594-conjugated donkey anti-goat IgG (A32814/A32758, 1:500 dilution; Invitrogen, Rockford, IL, United States), Alexa Fluor 488-conjugated donkey anti-rabbit IgG (A21206, 1:500 dilution; Molecular Probes), Cy3-conjugated donkey anti-mouse IgG (715-165-150, 1:200 dilution; Jackson ImmunoResearch, West Grove, PA, United States), and Cy3-conjugated donkey anti-rabbit IgG (AP182C, 1:200 dilution; Chemicon International). Nissl staining was done by incubation of the slices with NeuroTrace 530/615 Red Fluorescent Nissl Stain (Molecular Probes) diluted at 1:200 in PBST for 20 min after anti-β-galactosidase staining.
Image Acquisition and Analysis
The fluorescently labeled brain slices were observed and photographed using laser scanning confocal microscopy (LSM 700; Carl Zeiss, Jena, Germany). Low magnification images were acquired using a 10x objective lens. For each region of interest (ROI), a series of z-stack fluorescence images (1-μm intervals) were recorded using a 20x objective lens. Cells positive for β-galactosidase and GFP (or mCherry) in each ROI were counted. Briefly, Imaris software (Bitplane, Zurich, Switzerland) was used to mark cells positive for β-galactosidase with spheres in 1 layer and cells positive for GFP (or mCherry) with squares in a different layer. After independent marking, the two layers were overlaid, and cells that were doubly or singly marked with spheres and squares were counted (see Supplementary Figure 3).
Results
Specificity of the Probes
To examine the expression of Sulf1 and Sulf2 mRNA in the adult mouse brain, in situ hybridization was performed using digoxigenin-labeled antisense RNA probes specific to each sequence and a chromogenic substrate, BM purple. As summarized in Table 1, the Sulf1 signals were abundant in the neocortex, limbic cortex, basal ganglia, and some thalamic and hypothalamic nuclei, whereas the Sulf2 signals were seen in the neocortex, limbic cortex, septum, habenula, hypothalamus, and lower brainstem. Largely, if not entirely, Sulf1 and Sulf2 showed distinct expression patterns (Supplementary Figure 1), indicating no cross hybridization. More importantly, the Sulf1 and Sulf2 signals were completely abolished in the Sulf1 KO and Sulf2 KO mice, respectively (Supplementary Figure 1), indicating the specificity of the probes. The expression patterns of Sulf1 and Sulf2 are described in greater detail in the following sections.
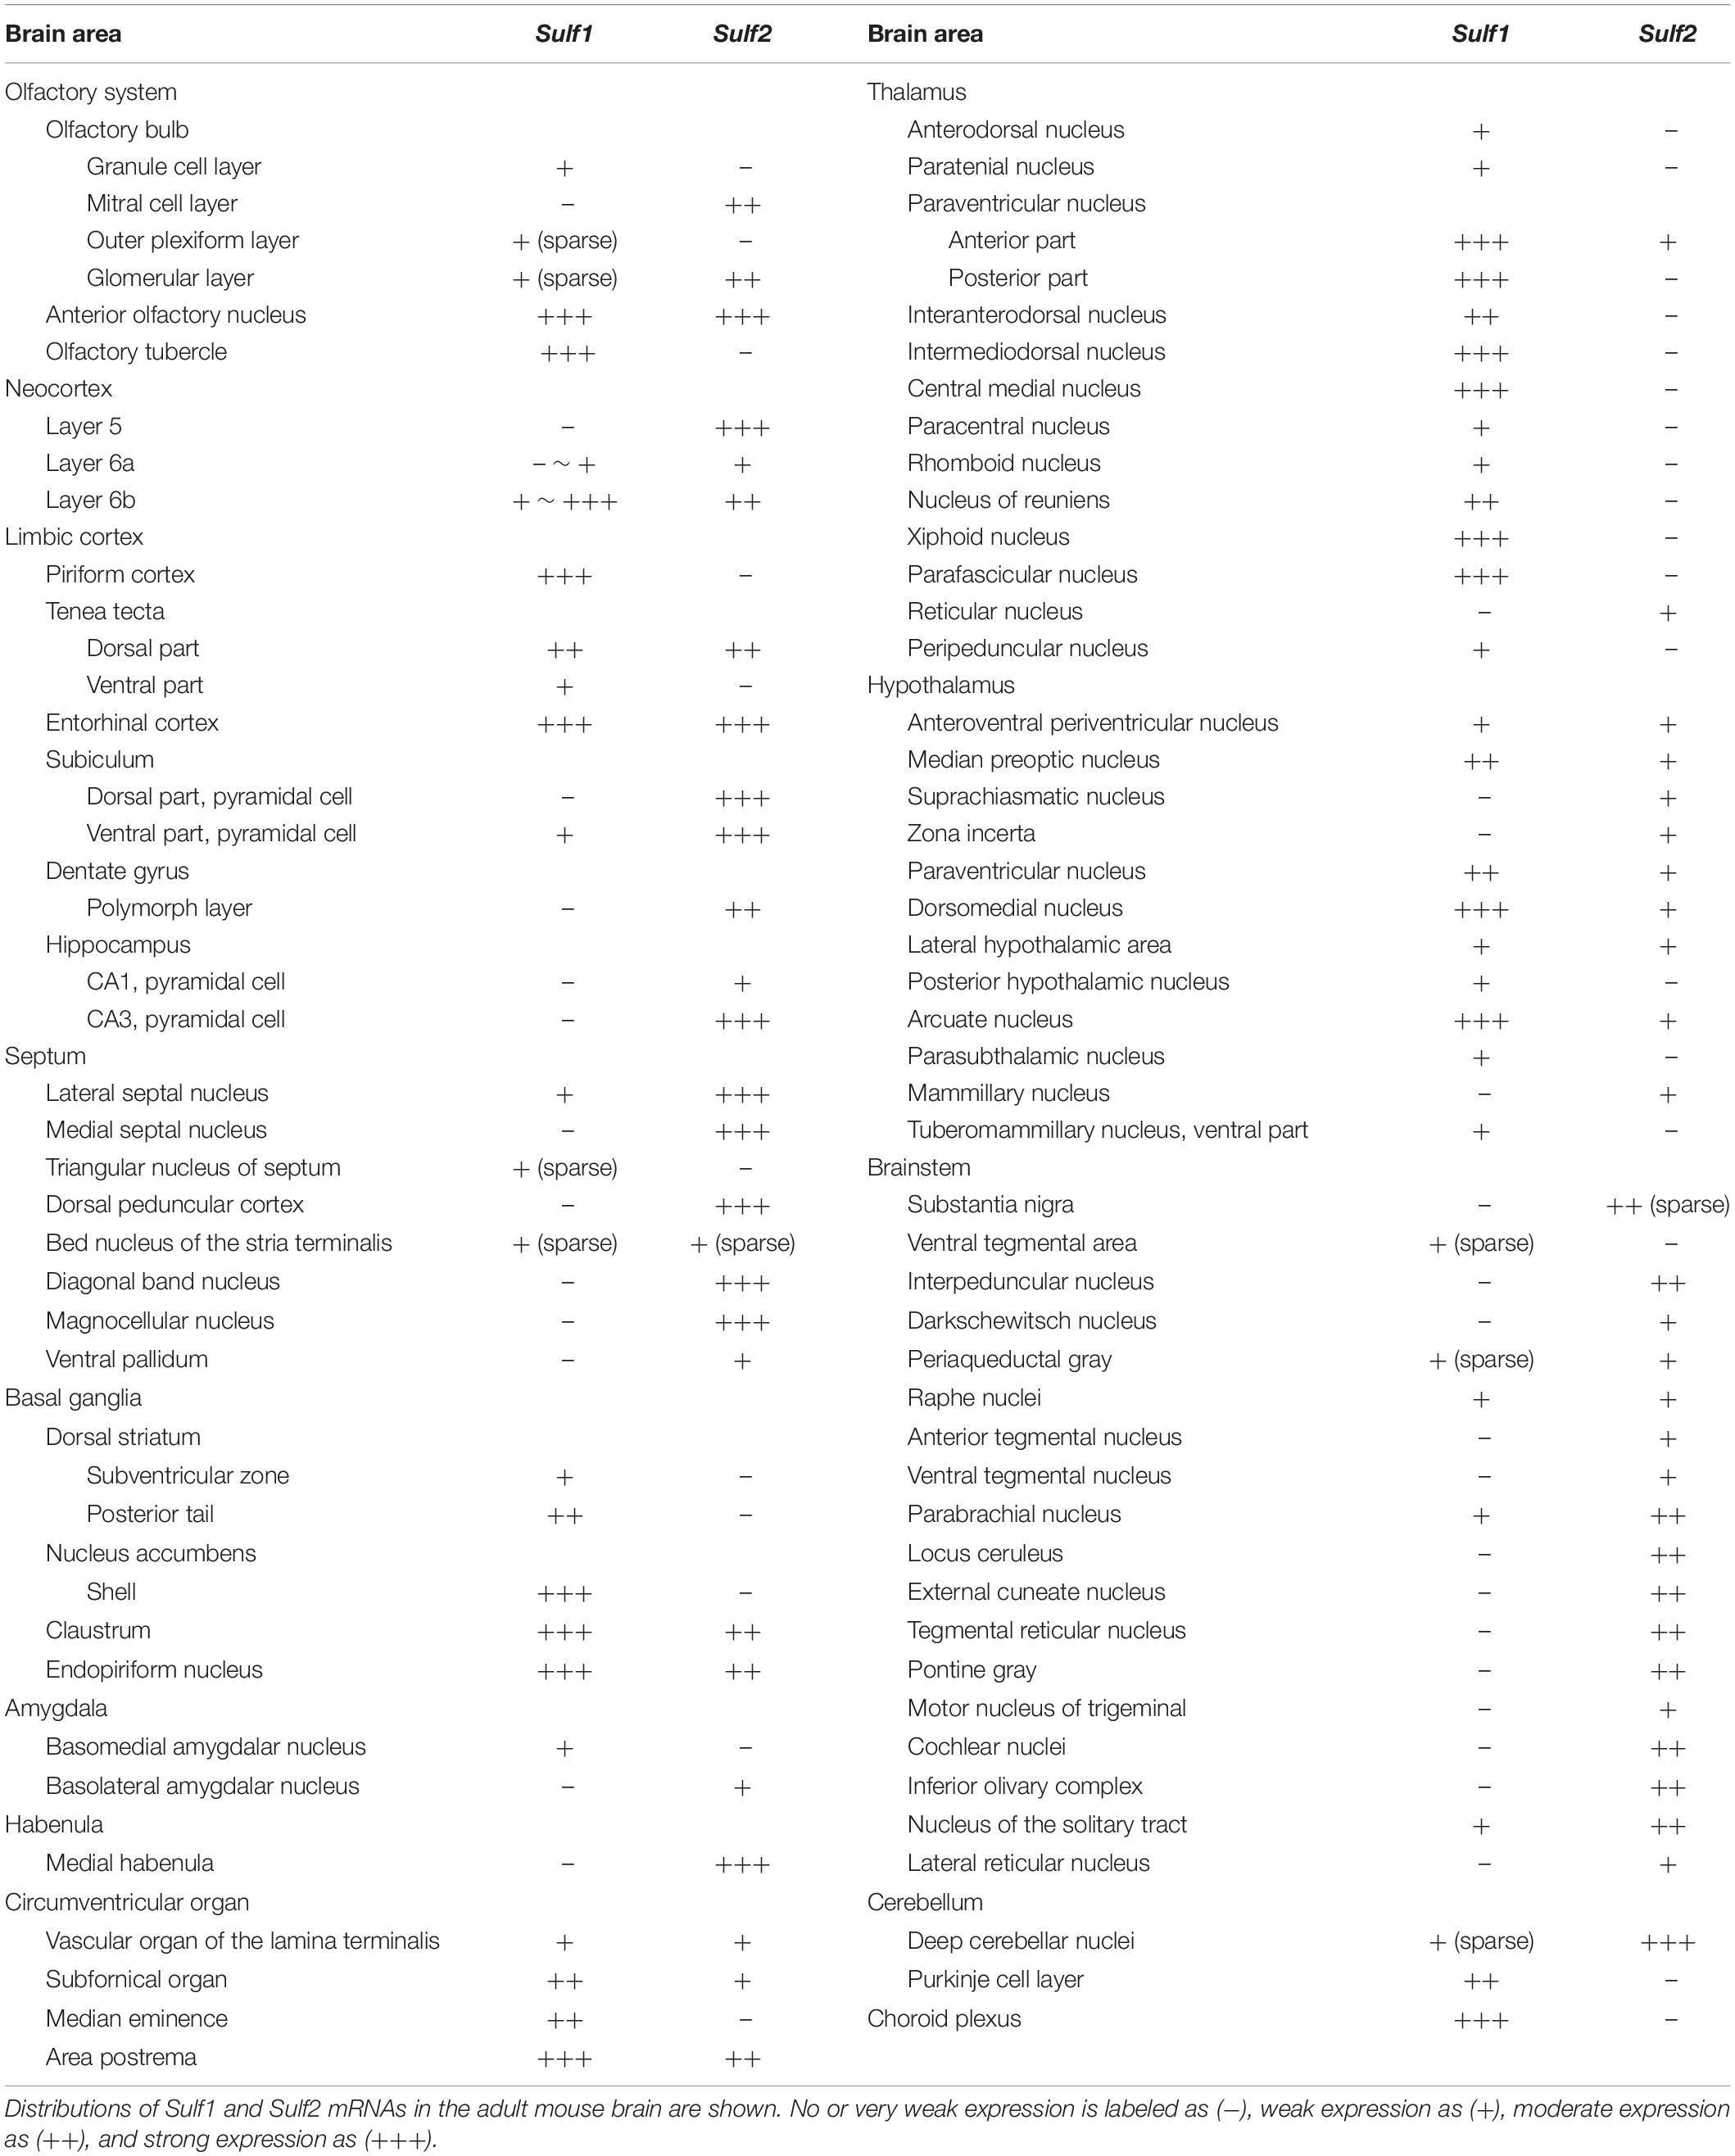
Table 1. Expression of Sulf1 and Sulf2 in the adult mouse brain.
Sulf1 Expression in the Olfactory System and Striatum
In the olfactory system, Sulf1 mRNA was detected in the anterior olfactory nucleus, tenia tecta, olfactory tubercle, piriform cortex, and lateral entorhinal cortex (Figure 1). Sulf1 expression was observed through the entire length of the olfactory tubercle and piriform cortex along the rostrocaudal axis.
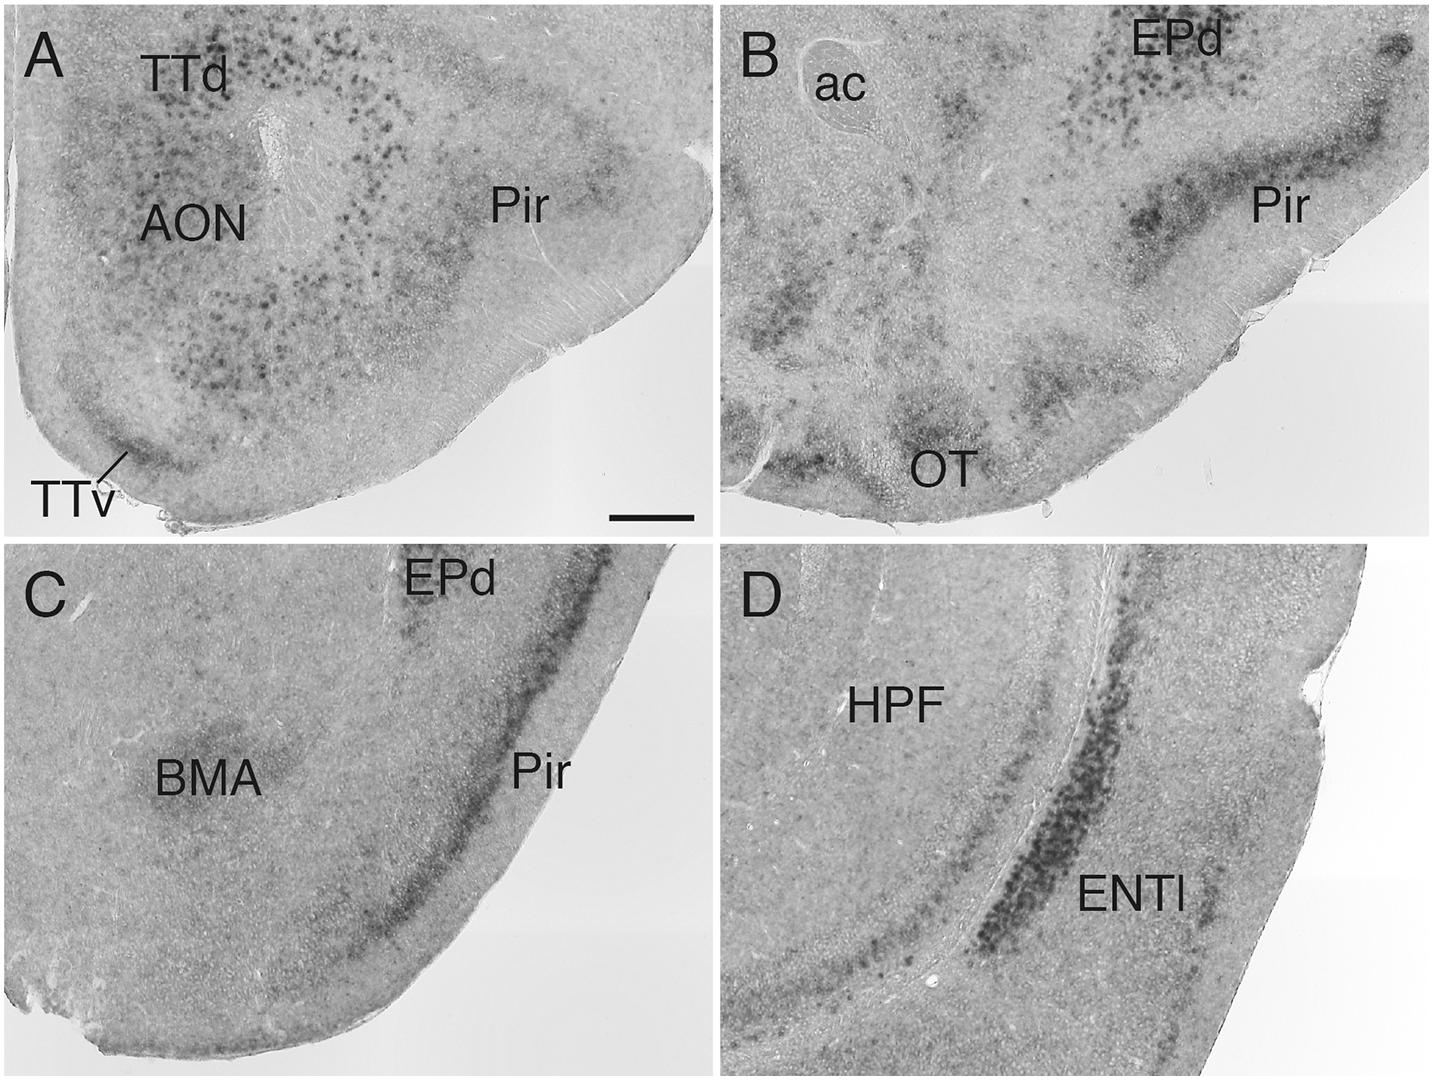
Figure 1. Sulf1 mRNA expression in the olfactory cortex. (A–D) Sulf1 was expressed in the anterior olfactory nucleus (AON), tenia tecta (TTd, TTv), olfactory tubercle (OT), piriform cortex (Pir), dorsal endopiriform nucleus (EPd), and lateral entorhinal cortex (ENTl). ac, anterior commissure; BMA, basomedial amygdalar nucleus; HPF, hippocampal formation. The scale bar indicates 250 μm. Approximate AP levels from the bregma (in mm) are 2.5 (A), 1.0 (B), –1.5 (C), and −3.0 (D).
In the striatum, Sulf1 was highly expressed in the shell, but not core, of the nucleus accumbens (NAc): Sulf1 expression was high in the medial shell and low in the lateral shell (Figure 2A). Sulf1 was undetectable in the dorsal striatum except for in the following regions: the subventricular zone facing the lateral ventricle (Figure 2B) and the most caudal part of the dorsal striatum, which corresponds to the posterior tail of the striatum (TS; Figure 2C).
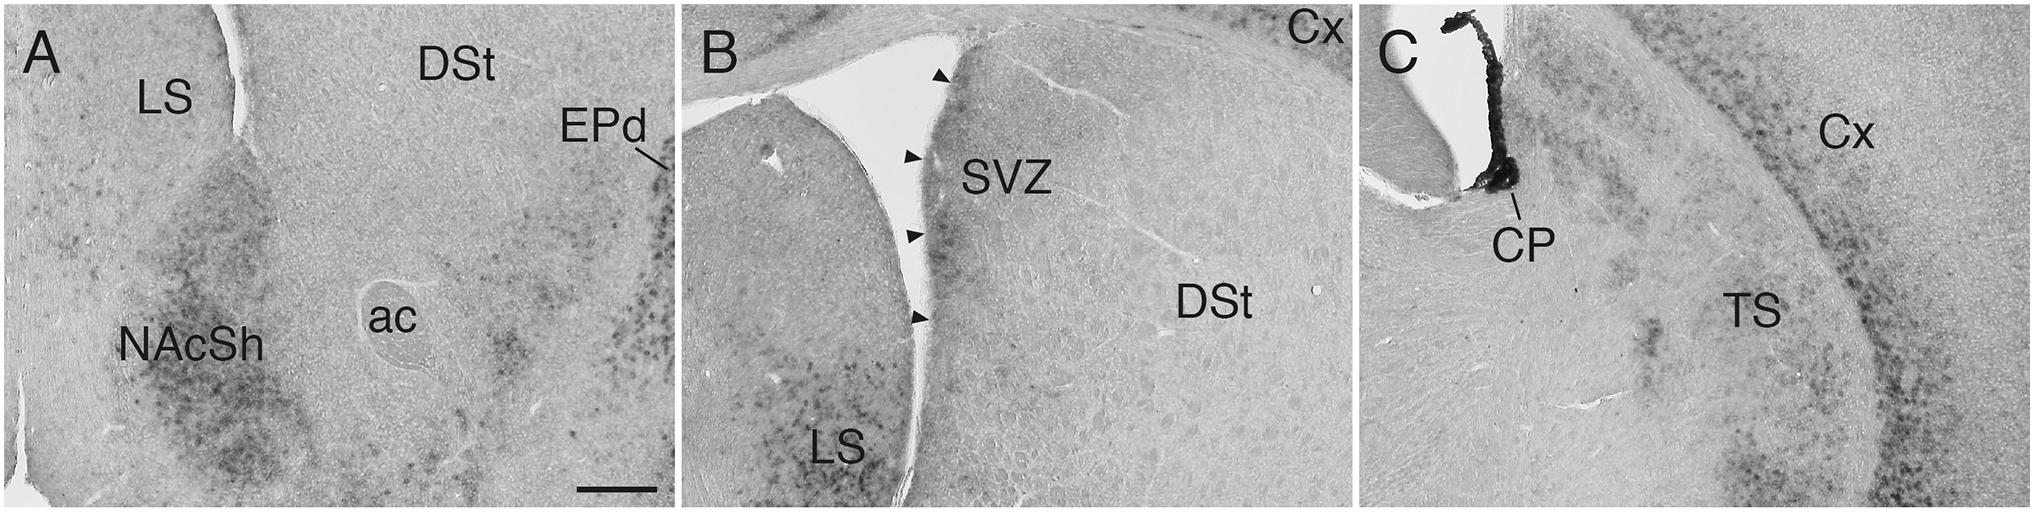
Figure 2. Sulf1 mRNA expression in the striatum. (A) Sulf1 was expressed in the nucleus accumbens shell (NAcSh). (B) Sulf1 was detected in the subventricular zone (SVZ) of the lateral ventricle (arrowheads) and the ventral part of the lateral septal nucleus (LS). (C) Sulf1 was observed in the posterior tail of the striatum (TS) and layer 6 of the cerebral cortex (Cx). The strongest Sulf1 expression was observed in the choroid plexus (CP). ac, anterior commissure; DSt, dorsal striatum; EPd, endopiriform nucleus dorsal part. The scale bar indicates 250 μm. Approximate AP levels from the bregma (in mm) are 1.0 (A), 0 (B), and –1.0 (C).
Sulf1 Expression in the Cerebral Cortex and Subcortical Regions of the Forebrain
Sulf1 mRNA was detected throughout the cerebral cortex (Figures 3A–D), and its expression had a high-rostral to low-caudal gradient (Figure 3E and Supplementary Figure 2). More specifically, in the cerebral cortex, the most prominent expression was observed in the prefrontal cortex (PFC), and weaker expression was seen in the caudal cortex (Figures 3A–D and Supplementary Figure 2). In all of these areas, the expression was confined to layers 6: strong in layer 6b and weaker in layer 6a (Figures 2–4 and Supplementary Figure 2).
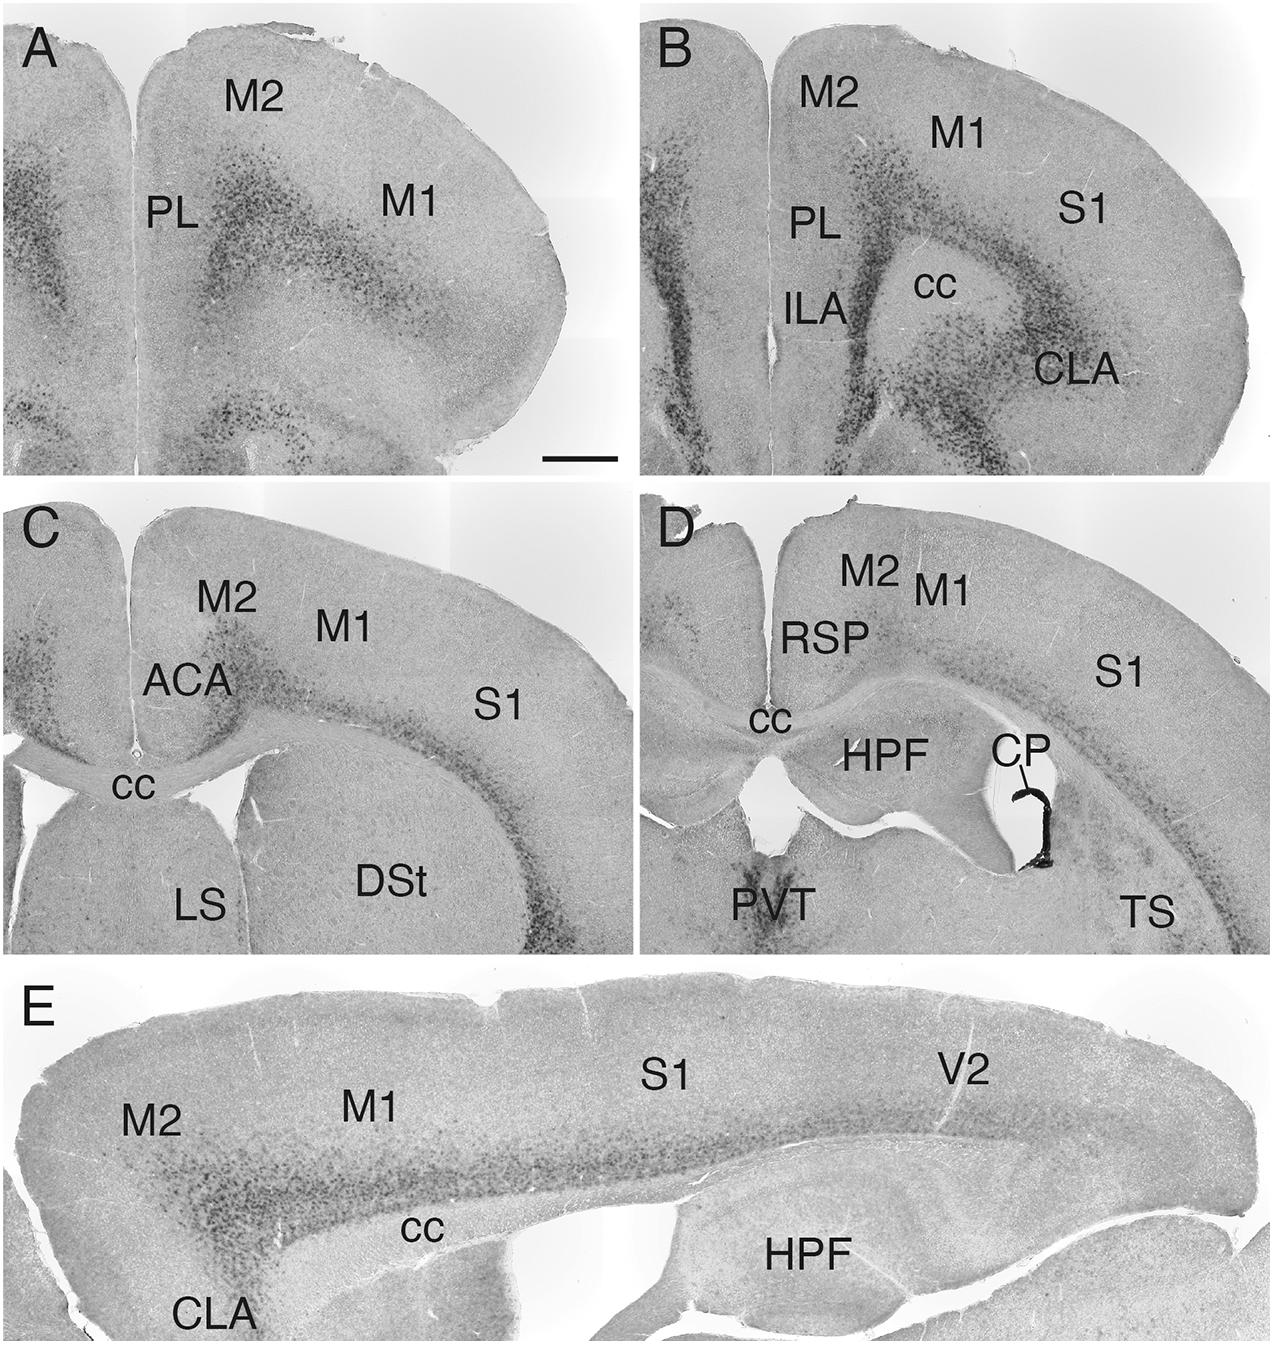
Figure 3. Sulf1 mRNA expression in the cerebral cortex. (A–D) Sulf1 was expressed in layer 6 of the cerebral cortex. Coronal sections from the rostral (A) to the caudal (D) levels are shown. (E) Sagittal section showing the Sulf1 expression in the cerebral cortex throughout the rostrocaudal axis. The expression showed a high-rostral to low-caudal gradient. ACA, anterior cingulate area; cc, corpus callosum; CLA, claustrum; CP, choroid plexus; DSt, dorsal striatum; HPF, hippocampal formation; ILA, infralimbic area; LS, lateral septal nucleus; M1, primary motor area; M2, secondary motor area; PL, prelimbic area; PVT, paraventricular nucleus of the thalamus; RSP, retrosplenial area; S1, primary somatosensory area; TS, posterior tail of the striatum; V2, secondary visual cortex. The scale bars indicate 500 μm (A–D) and 400 μm (E). Approximate AP levels from the bregma (in mm) are 2.5 (A), 2.0 (B), 0.5 (C), and –1.0 (D). The approximate ML level from the midline (in mm) is 1.0 (E).
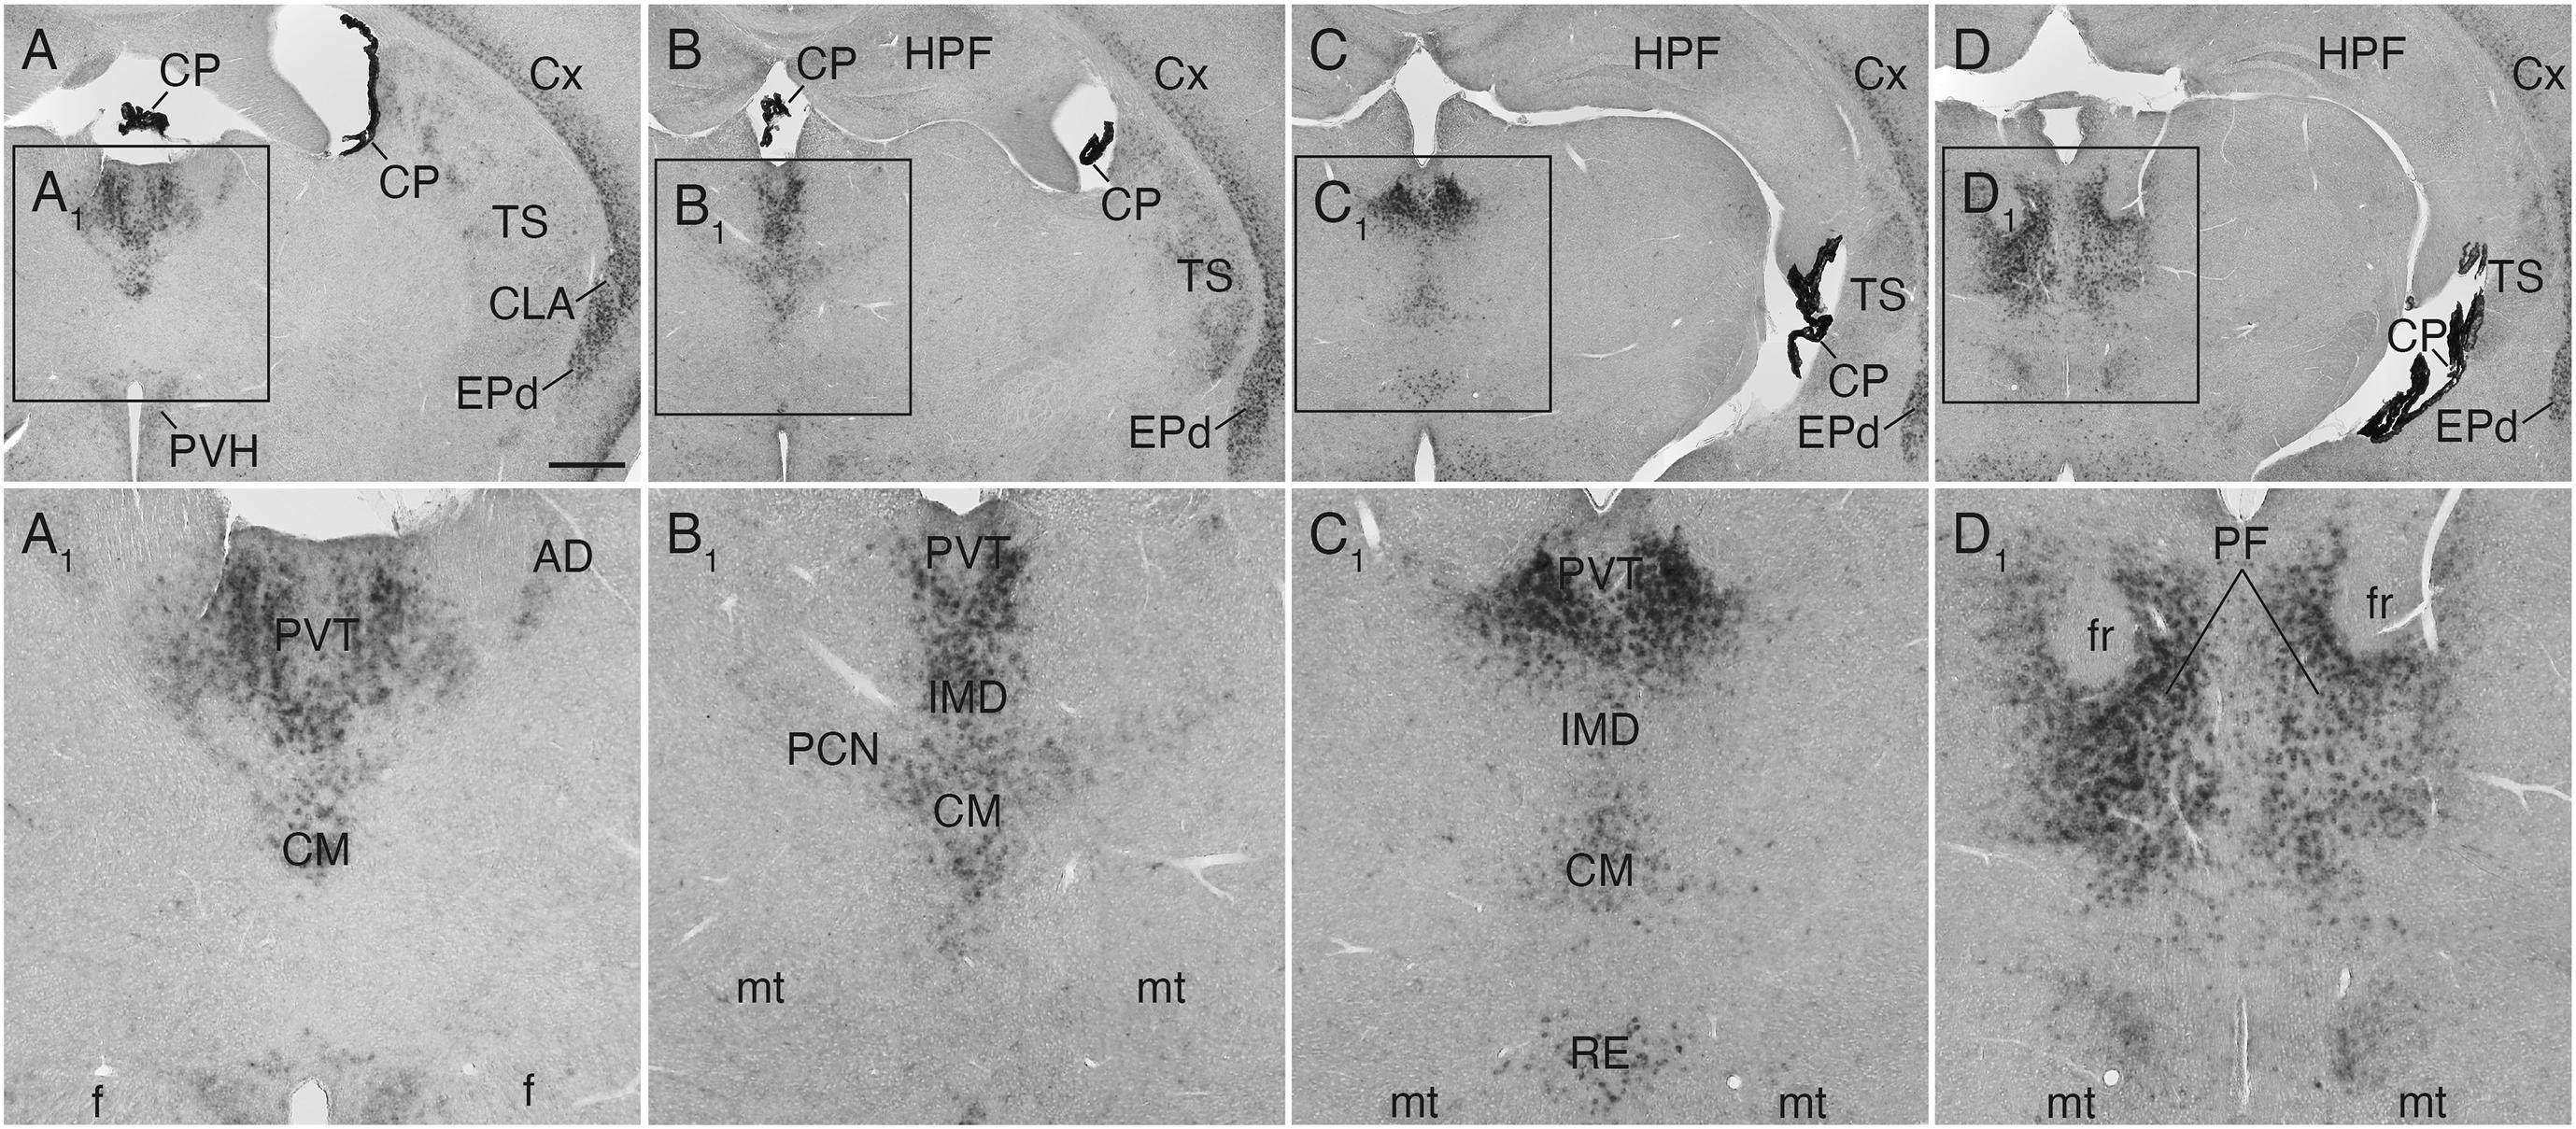
Figure 4. Sulf1 mRNA expression in the thalamus. (A–D) Sulf1 was detected in the midline thalamic nuclei, including the paraventricular (PVT), intermediodorsal (IMD), and reuniens (RE) nuclei. It was also seen in the intralaminar nuclei, including the central medial (CM), paracentral (PCN), and parafascicular (PF) nuclei. (A1−D1) Show the enlarged images in the boxed areas in (A–D), respectively. AD, anterodorsal nucleus; CLA, claustrum; CP, choroid plexus; Cx, cerebral cortex; EPd, endopiriform nucleus dorsal part; f, fornix; fr, fasciculus retroflexus; HPF, hippocampal formation; mt, mammillothalamic tract; PVH, paraventricular hypothalamic nucleus; TS, posterior tail of the striatum. The scale bars indicate 500 μm (A–D) and 200 μm (A1–D1). Approximate AP levels from the bregma (in mm) are –0.5 (A), –1.0 (B), –2.0 (C), and –2.5 (D).
In the thalamus, Sulf1 was highly and selectively expressed in the midline group including the paraventricular, intermediodorsal, and reuniens nuclei (Figures 4A–C,A1–C1), and in the intralaminar group including the central medial, paracentral, and parafascicular nuclei (Figures 4A–D,A1–D1). Sulf1 expression was observed from the anterior parts to the posterior parts of the paraventricular nucleus of the thalamus (PVT; Figures 4A–C,A1–C1). Sulf1 was also strongly expressed in the claustrum and dorsal endopiriform nucleus (Figures 1B,C, 2A, 3B,E, 4A–D,A1–D1). The strongest Sulf1 expression in the brain was observed in the choroid plexus (Figures 2–4).
Sulf1 Expression in the Septum and Hypothalamus
In the septal area, Sulf1 was expressed in the ventral part of the lateral septal nucleus (Figure 5A). In the hypothalamus, moderate expression was found in the median preoptic and paraventricular nuclei (Figures 5B,D), and strong expression, in the dorsomedial and arcuate nuclei (Figures 5E,F). Furthermore, very strong Sulf1 expression was observed in the single-layered cells facing the ventral portion of the third ventricle (Figures 5F,F1). On the basis of the location, this signal seems to reflect the expression in tanycytes, which are highly specialized ependymal cells (Prevot et al., 2018).
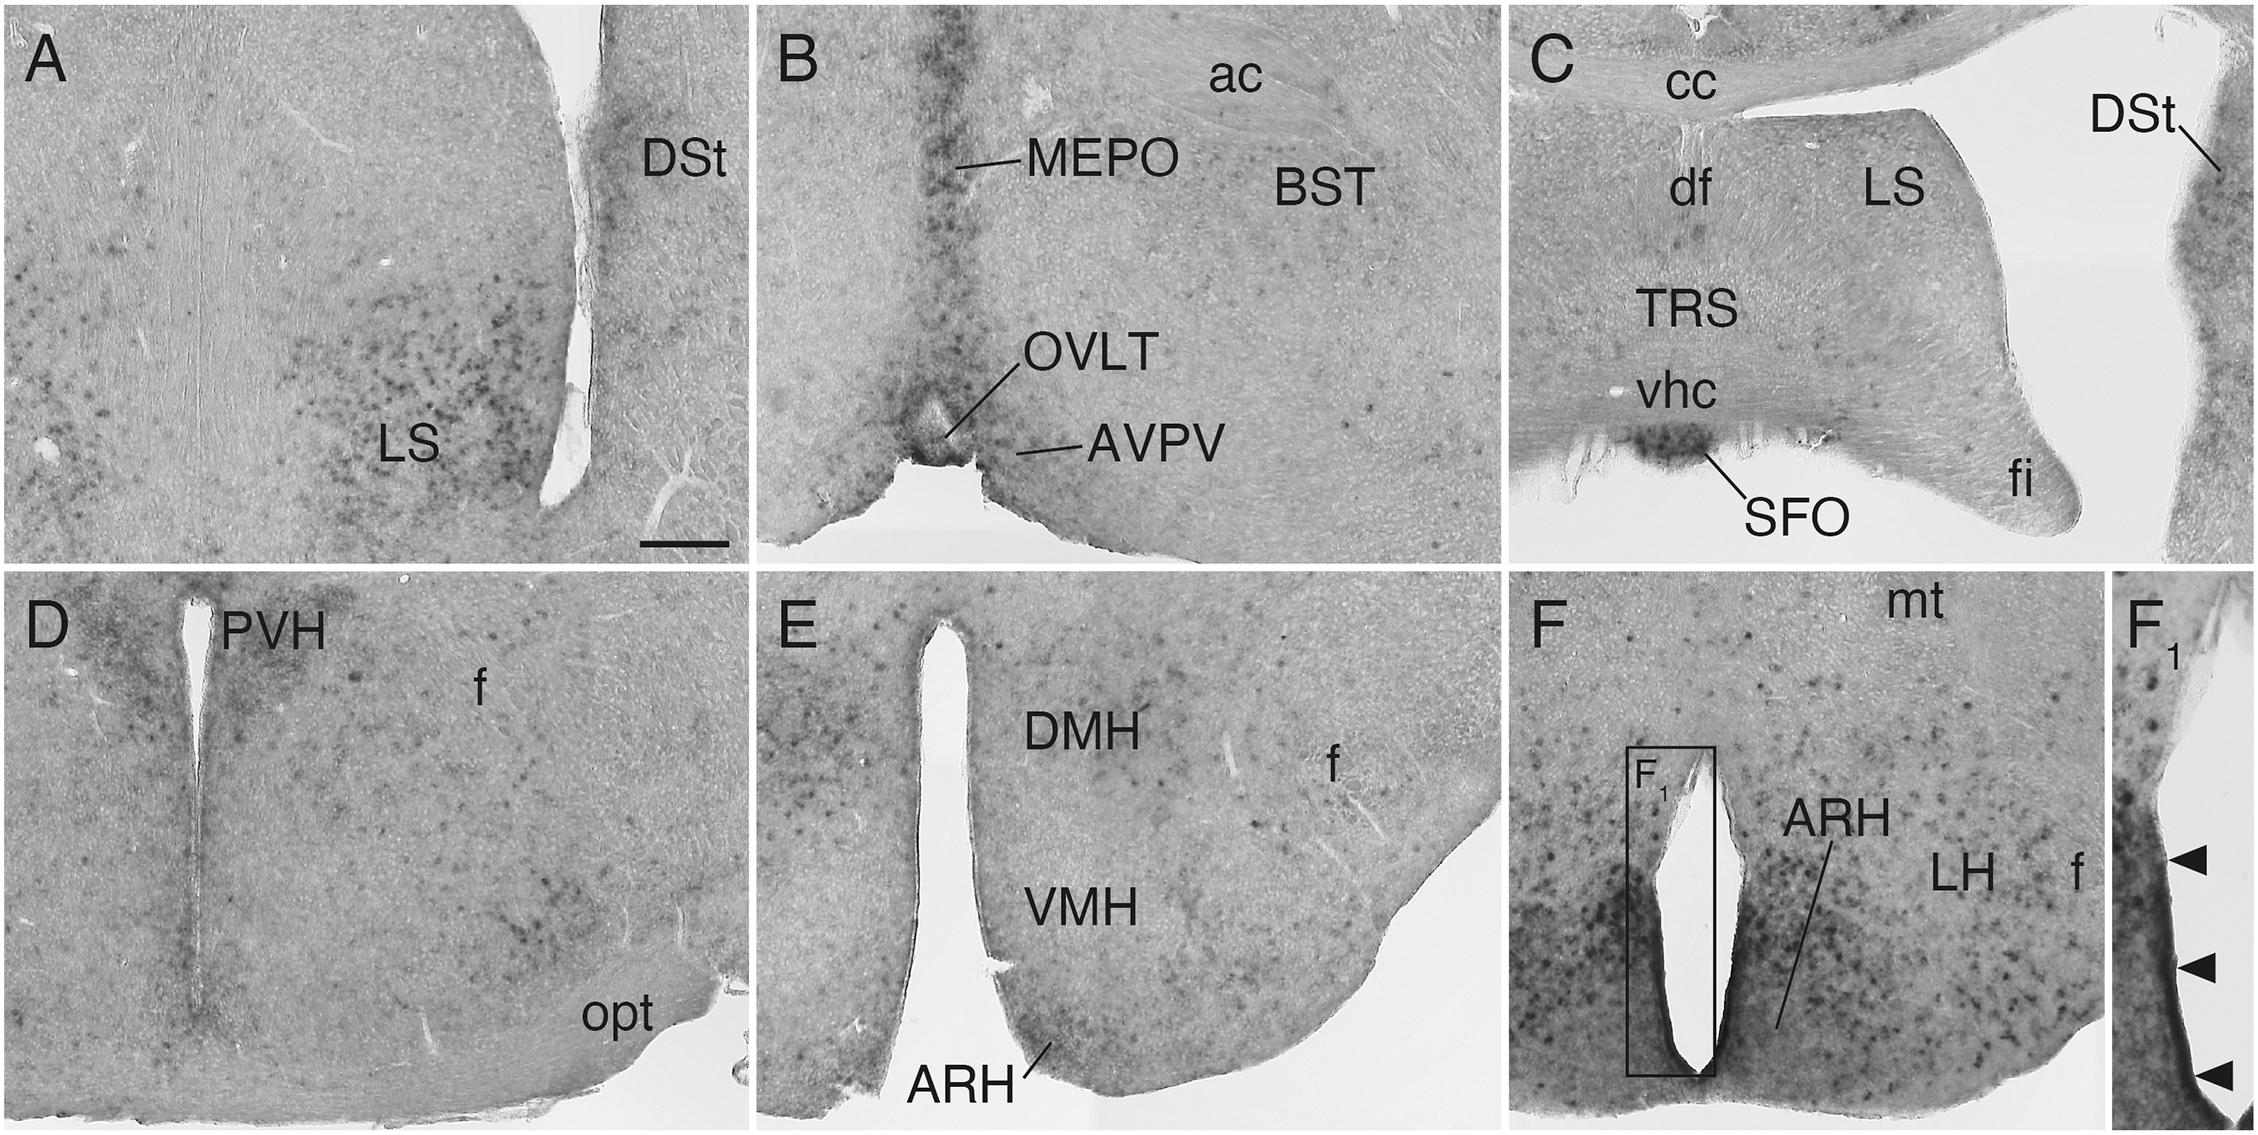
Figure 5. Sulf1 mRNA expression in the septum and hypothalamus. (A,B) Sulf1 was expressed in the ventral part of the lateral septal nucleus (LS), median preoptic nucleus (MEPO), and organum vasculosum of the lamina terminalis (OVLT). (C) Sulf1 was detected in the subfornical organ (SFO). (D–F) In the hypothalamus, Sulf1 was expressed in the paraventricular (PVH), dorsomedial (DMH), and arcuate (ARH) nuclei and in the lateral hypothalamic area (LH). (F1) Shows the enlarged image in the boxed area in (F). The arrowheads in (F1) indicate strong Sulf1 expression in the cells facing the ventral portion of the third ventricle. ac, anterior commissure; AVPV, anteroventral periventricular nucleus; BST, bed nucleus of the stria terminalis; cc, corpus callosum; df, dorsal fornix; DSt, dorsal striatum; f, fornix; fi, fimbria; mt, mammillothalamic tract; opt, optic tract; TRS, triangular nucleus of septum; vhc, ventral hippocampal commissure; VMH, ventromedial nucleus of the hypothalamus. The scale bars indicate 200 μm (A–F) and 120 μm (F1). Approximate AP levels from the bregma (in mm) are 0.5 (A,B), –0.5 (C), –1.0 (D), –2.0 (E), and –2.5 (F).
Sulf1 Expression in the Midbrain, Cerebellum, and Lower Brainstem
In the lower brainstem, Sulf1 expression was found sparsely in the ventral tegmental area (VTA), midbrain raphe nuclei, and periaqueductal gray (Figures 6A,A1,B,B1). In the cerebellum, Sulf1 mRNA was detected in the Purkinje cell layer throughout the cortex (Figures 6C,C1). It should also be noted that Sulf1 was observed in the circumventricular organs including the organum vasculosum of the lamina terminalis (Figure 5B), the subfornical organ (Figure 5C), and the area postrema (Figures 6D,D1).
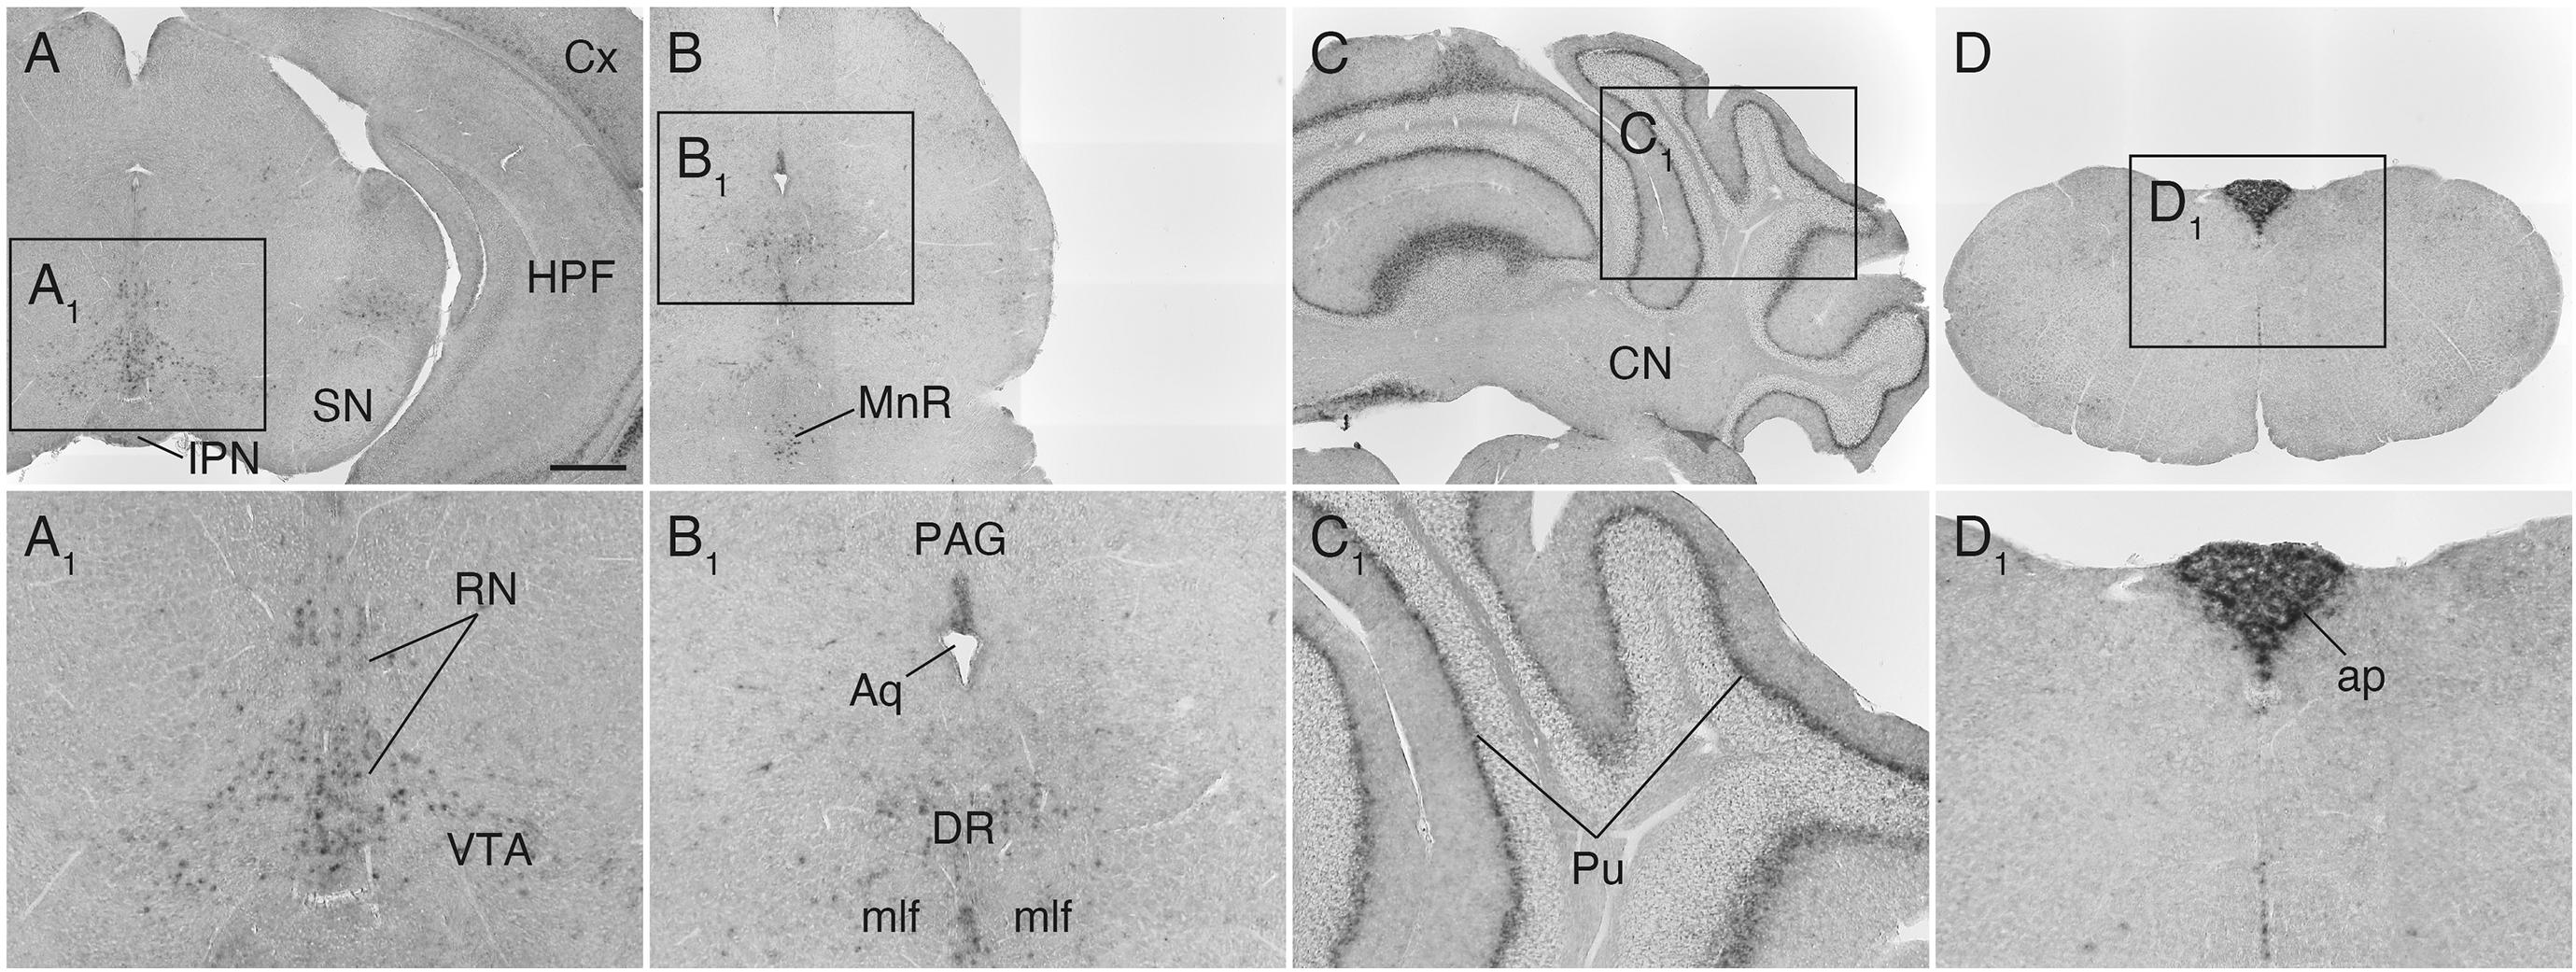
Figure 6. Sulf1 mRNA expression in the midbrain, cerebellum, and lower brainstem. (A,B) Sulf1 was expressed in the raphe nuclei (RN) in the midbrain, including the dorsal (DR) and median raphe (MnR) nuclei, and part of the ventral tegmental area (VTA). (C) In the cerebellum, Sulf1 expression was seen in the Purkinje cell layer (Pu). (D) The area postrema (ap) was strongly labeled. (A1–D1) Show the enlarged images in the boxed areas in (A–D), respectively. Aq, aqueduct; CN, cerebellar nuclei; Cx, cerebral cortex; HPF, hippocampal formation; IPN, interpeduncular nucleus; mlf, medial longitudinal fasciculus; PAG, periaqueductal gray; SN, substantia nigra. The scale bars indicate 500 μm (A–D) and 200 μm (A1–D1). Approximate AP levels from the bregma (in mm) are –3.5 (A), –4.5 (B), –6.5 (C), and –7.5 (D).
Sulf2 Expression in the Adult Mouse Brain
We then analyzed Sulf2 mRNA expression in the adult mouse brain. As shown in Figure 7, Sulf2 was detected throughout the brain and its expression was high in the cerebral cortex, lateral septal nucleus, medial habenula, hippocampal CA3 region, cerebellar nuclei, area postrema, external cuneate nucleus, and inferior olivary complex. In the cerebral cortex, Sulf2 was expressed strongly in layer 5 and layer 6b, and weakly in layer 6a (Supplementary Figures 2A,B), whereas Sulf1 expression was restricted to layer 6. In addition to neuronal expression, punctate signals were scattered throughout the brain regions. These signals overlapped with an astrocyte marker, S100β, but not with a neuronal marker, NeuN (Figure 7M), suggesting Sulf2 expression in astrocytes. These data show that Sulf1 and Sulf2 expressions differed considerably, although they were overlapped in some regions (Table 1).
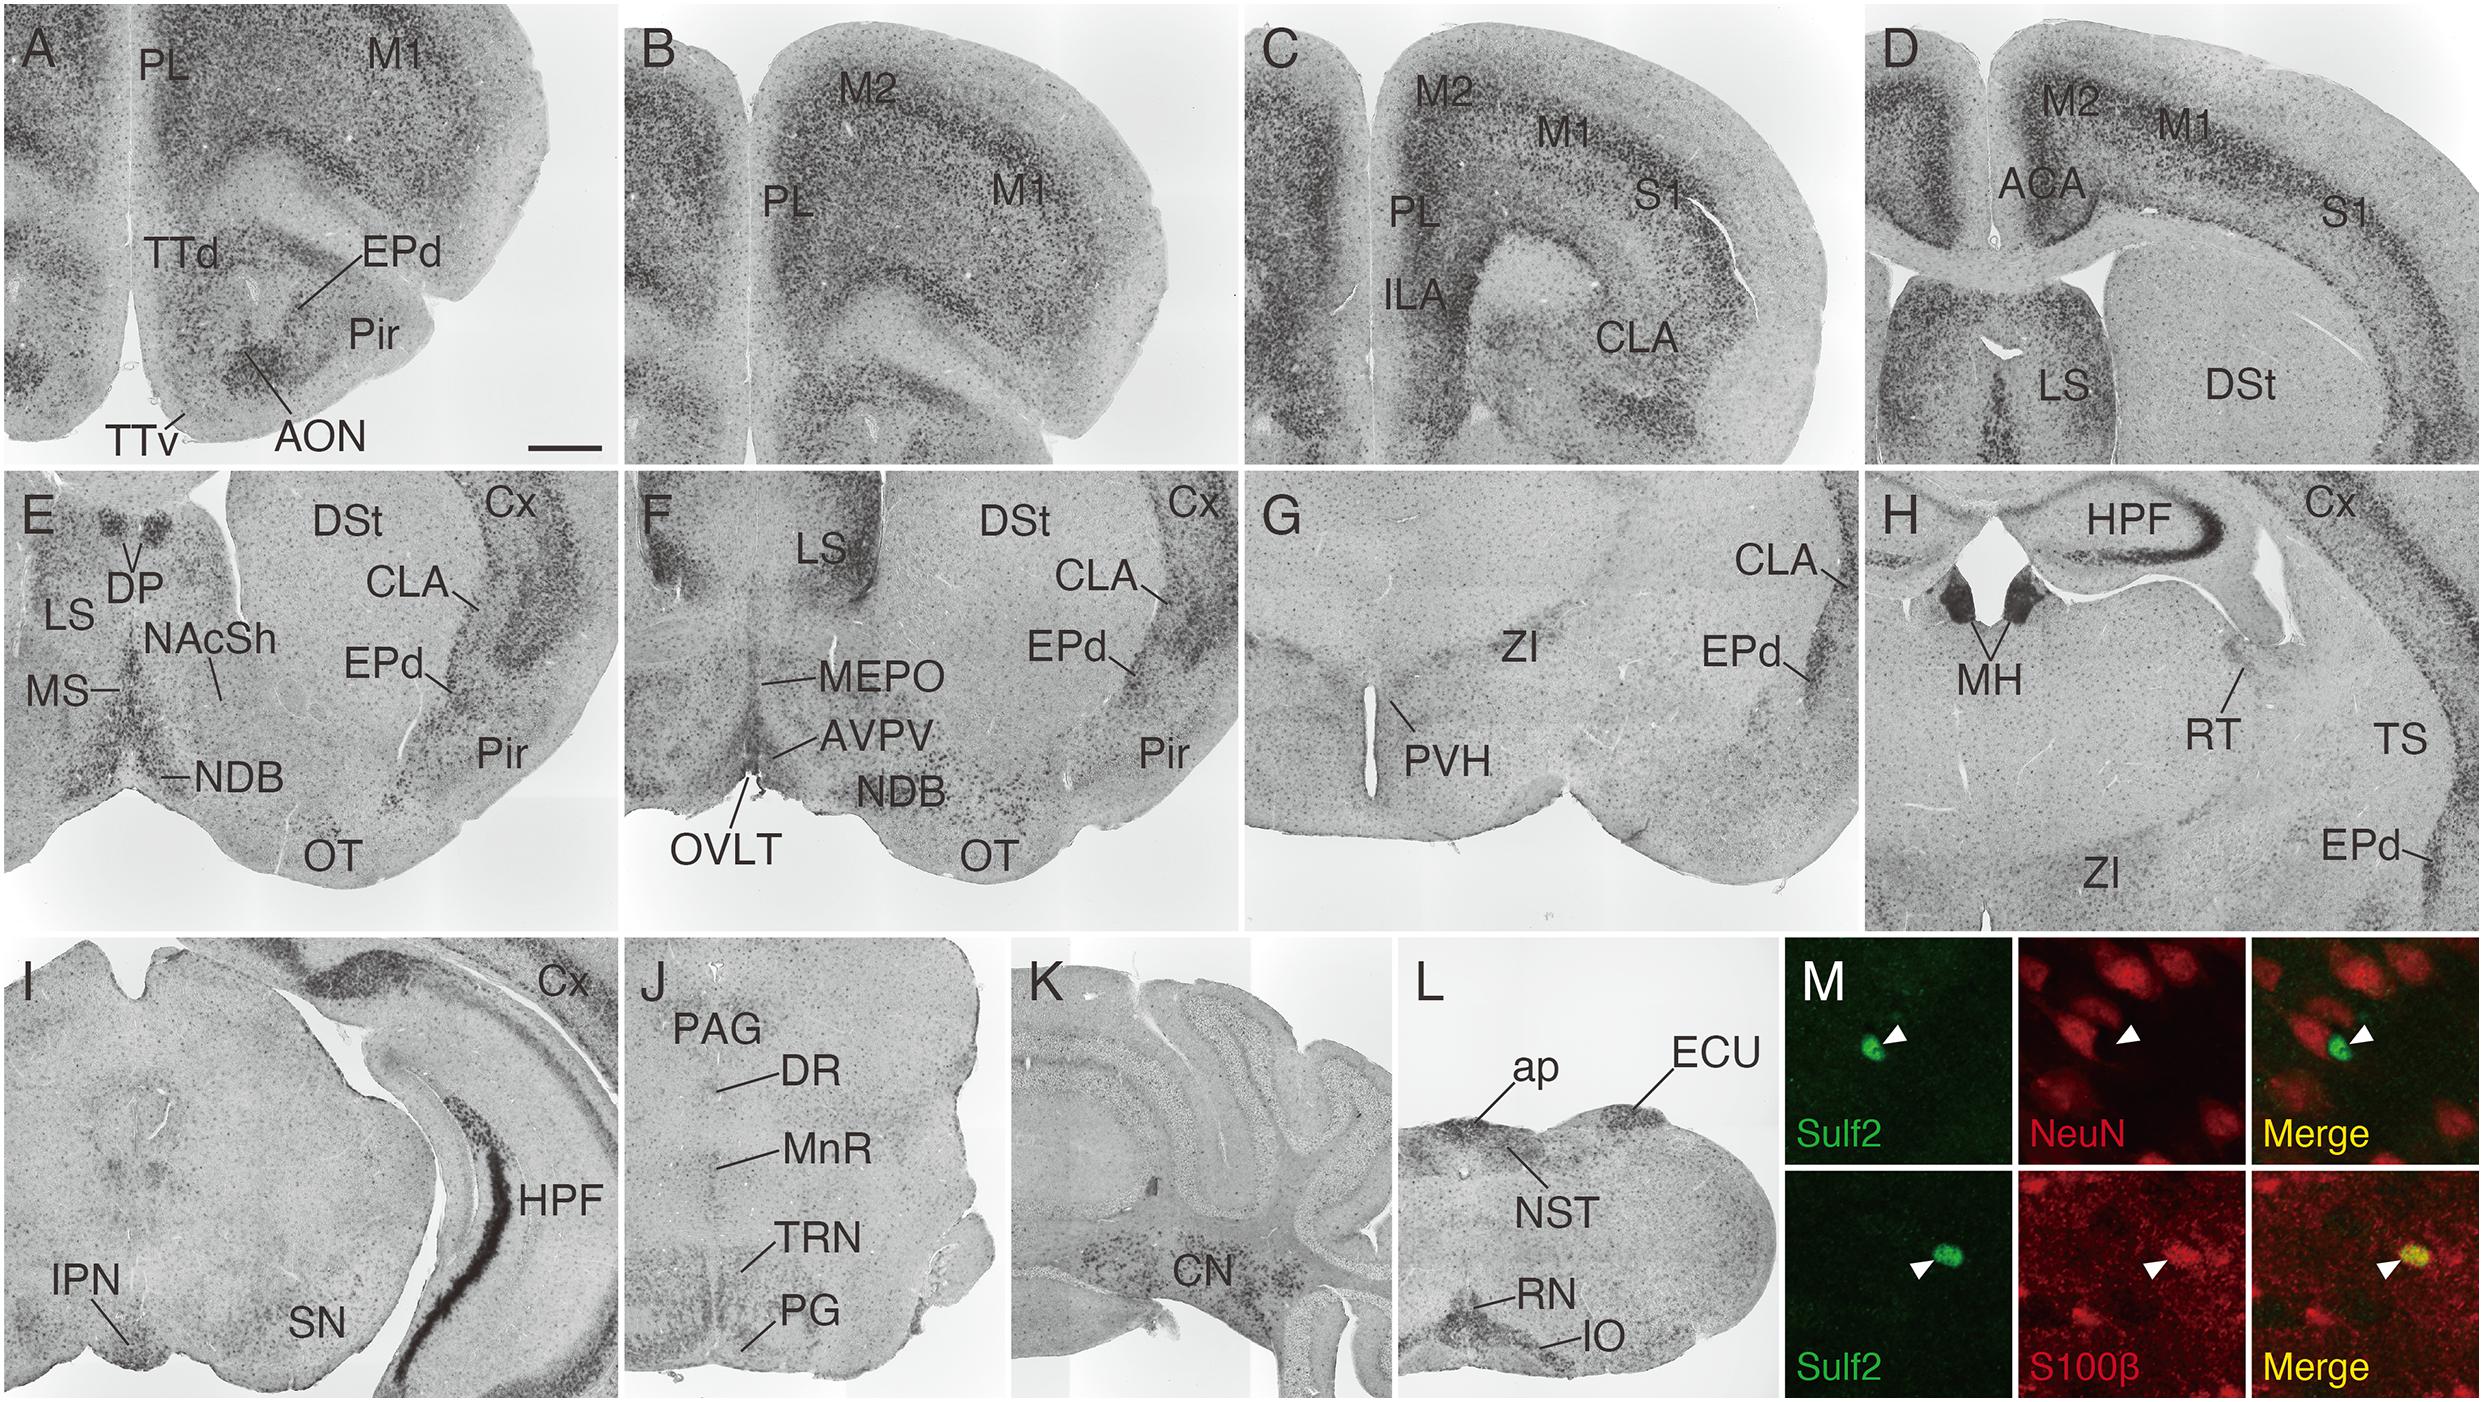
Figure 7. Sulf2 mRNA expression in the adult mouse brain. (A–L) Sulf2 was broadly expressed in the brain. Strong signals were observed in the cerebral cortex (Cx), lateral septal nucleus (LS), medial habenula (MH), hippocampal formation (HPF), cerebellar nuclei (CN), inferior olivary complex (IO), external cuneate nucleus (ECU), and area postrema (ap). (M) Confocal microscopic images of the brain slices from Sulf2LacZ/+ mice stained with anti-β-galactosidase (green) and anti-NeuN or S100β (red). Representative images of the scattered punctate signals in the thalamic region are shown. The β-galactosidase signals, indicative of Sulf2 expression, were co-localized with an astrocyte marker, S100β (arrowheads, lower panels), but not with a neuronal marker, NeuN (arrowheads, upper panels). ACA, anterior cingulate area; AON, anterior olfactory nucleus; AVPV, anteroventral periventricular nucleus; CLA, claustrum; DP, dorsal peduncular cortex; DR, dorsal raphe nucleus; DSt, dorsal striatum; EPd, endopiriform nucleus dorsal part; ILA, infralimbic area; IPN, interpeduncular nucleus; M1, primary motor area; M2, secondary motor area; MEPO, median preoptic nucleus; MnR, median raphe nucleus; MS, medial septal nucleus; NAcSh, nucleus accumbens shell; NDB, diagonal band nucleus; NST, nucleus of the solitary tract; OT, olfactory tubercle; OVLT, organum vasculosum of the lamina terminalis; PAG, periaqueductal gray; PG, pontine gray; Pir, piriform cortex; PL, prelimbic area; PVH, paraventricular hypothalamic nucleus; RN, raphe nuclei; RT, reticular nucleus of the thalamus; SN, substantia nigra; S1, primary somatosensory area; TRN, tegmental reticular nucleus; TS, posterior tail of the striatum; TTd, tenia tecta dorsal part; TTv, tenia tecta ventral part; ZI, zona incerta. The scale bars indicate 500 μm (A–L) and 25 μm (M). Approximate AP levels from the bregma (in mm) are 2.5 (A,B), 2.0 (C), 0.5 (D,F), 1.0 (E), –1.0 (G), –1.5 (H,M), –3.5 (I), –4.5 (J), –6.5 (K), and –7.5 (L).
Co-localization of Sulf1 and Dopamine Receptors
Our results demonstrated an interesting correlation between Sulf1 mRNA expression and the brain regions that receive dopaminergic signals. We therefore focused on identifying the co-localization of Sulf1 and dopamine receptors. For this purpose, we used two different strategies to examine at the cellular level whether Sulf1-expressing cells matched up with cells expressing the dopamine D1 receptor (D1R) or the D2 receptor (D2R).
First, we examined co-localization using mouse strains that carry both lacZ in the Sulf1 locus and either a Drd1-yellow-fluorescent-protein (YFP) or a Drd2-YFP transgene (Sulf1lacZ/+;Drd1-YFP or Sulf1lacZ/+;Drd2-YFP). In these mice, because an IRES-lacZ cassette was inserted into the Sulf1 gene to disrupt it (Nagamine et al., 2012), lacZ expression faithfully delineates Sulf1-expressing cells. Moreover, as β-galactosidase has a nuclear localization signal and the protein is located in the cell nucleus, it enables us to identify the positive cells easily. The Drd1-YFP and Drd2-YFP lines possess transgenes carrying a YFP gene under the promoters of the Drd1 and Drd2 genes, which encode the dopamine D1R and D2R, respectively (Nagai et al., 2016). As shown in Figure 8A, the patterns of β-galactosidase immunostaining completely matched the patterns of Sulf1 mRNA distribution revealed by in situ hybridization. In addition, the distribution was overlapping with YFP signals in D1R- or D2R-expressing cells. We then examined the co-localization of β-galactosidase and YFP by means of confocal microscopy (Figure 8B; see the procedure details in the section “Materials and Methods” and Supplementary Figure 3). As shown in Figure 8C, among the Sulf1-expressing cells in the NAcSh (NAcShSulf1), 55.6 and 37.6% were positive for YFP in the Drd1-YFP and Drd2-YFP mice, respectively. Similarly, among the Sulf1-expressing cells in the TS (TSSulf1), 59.3 and 31.5% were positive for YFP in the Drd1-YFP and Drd2-YFP mice, respectively (Figure 8C). Finally, among the Sulf1-expressing cells in the PFC (PFCSulf1), 61.6% were positive for YFP in the Drd1-YFP mice (Figure 8C). In an opposite manner, the ratio of the Sulf1-positive cells in the YFP-expressing cells in the Drd1-YFP mice was 90.7% in the NAcSh, 95.2% in the TS, and 94.8% in the PFC, whereas the ratio of the Sulf1-positive cells in the YFP-expressing cells in the Drd2-YFP mice was 72.0% in the NAcSh and 73.0% in the TS (Figure 8C). Co-localization of Sulf1 and D2R in the PVT could not be examined because YFP was not expressed in the PVT of the Drd2-YFP mice, although Drd2 mRNA is expressed in the PVT (Clark et al., 2017). Therefore, we decided to use other strains, as described in the next paragraph.
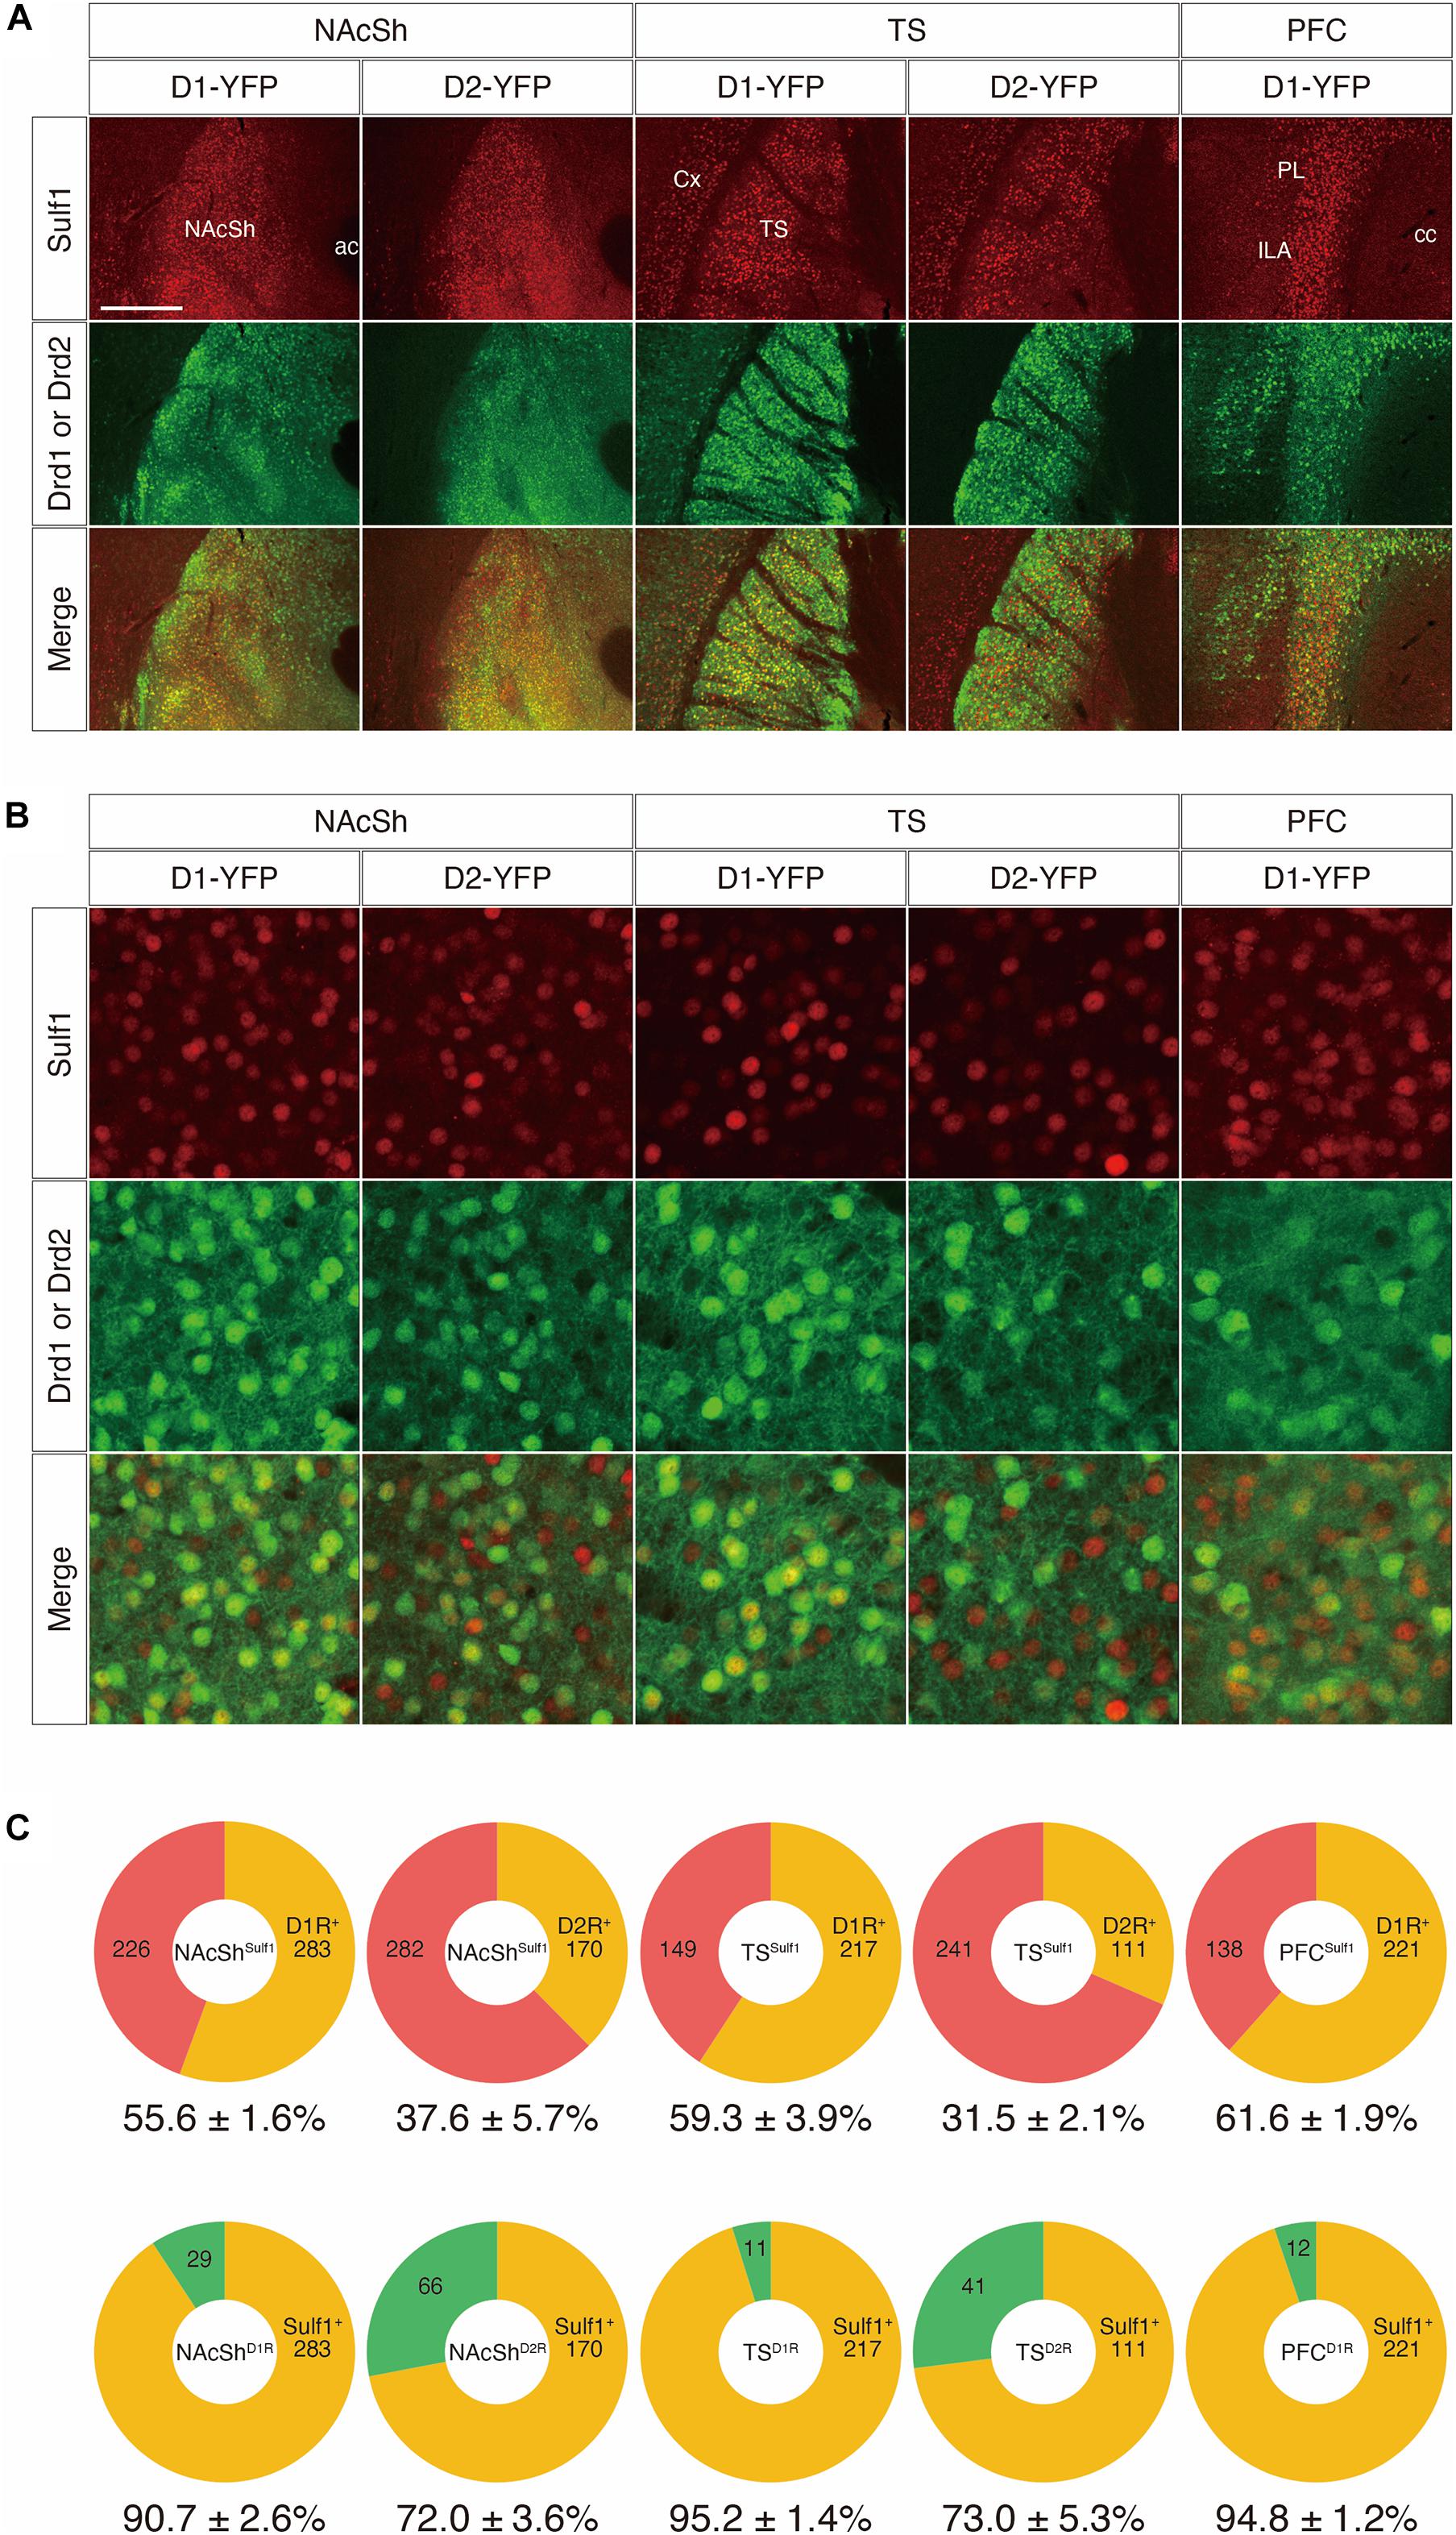
Figure 8. Co-expression of Sulf1 and the dopamine D1/D2 receptors. (A) Confocal microscopic images of the coronal brain slices. Representative images from the nucleus accumbens shell (NAcSh), posterior tail of the striatum (TS), and prefrontal cortex (PFC) are shown. Sulf1-expressing cells were identified by immunostaining β-galactosidase (red) by means of lacZ inserted in the Sulf1 locus (Sulf1lacZ/+). D1R- or D2R-expressing neurons were identified by immunostaining GFP (green) in Drd1- or Drd2-YFP mice. Co-localization of Sulf1 and Drd1/2 were clearly observed. ac, anterior commissure; cc, corpus callosum; Cx, cerebral cortex; ILA, infralimbic area; PL, prelimbic area. (B) High magnification images of the NAcSh, TS, and PFC regions after immunostaining β-galactosidase (red) and GFP (green) are shown. (C) The upper panels show the percentages of D1R- or D2R-positive (orange) and D1R- or D2R-negative (red) cells in the Sulf1-expressing cells. The lower panels show the percentages of Sulf1-positive (orange) and Sulf1-negative (green) cells in the D1R- or D2R-expressing cells. Cell counting was conducted for two randomly selected ROIs for all regions from three mice. The numbers in the circular graphs indicate the number of cells in each category. The numbers below the graphs indicate the percentages of co-localization. The scale bars indicate 400 μm (A) and 50 μm (B). Approximate AP levels from the bregma (in mm) in (A,B) are 1.0 (NAcSh), –1.0 (TS), and 2.0 (PFC).
Next, to examine the co-localization of Sulf1 and D2R in the PVT and to strengthen the above results, we adopted a second strategy using other mouse strains that carry both lacZ in the Sulf1 locus and either a Drd1-Cre or a Drd2-Cre transgene (Sulf1lacZ/+;Drd1-Cre or Sulf1lacZ/+;Drd2-Cre). The Drd1-Cre and Drd2-Cre lines possess transgenes carrying a Cre gene under the promoters of the Drd1 and Drd2 genes, respectively. These mice are extensively used to study the anatomy and physiology of the striatal signaling pathways (Valjent et al., 2009). Injection of AAV5-hSyn-DIO-mCherry into these strains resulted in the Cre-mediated recombination of DIO (double-floxed inverted open reading frame) and led to mCherry expression in Drd1- and Drd2-expressing cells (Figure 9A). When AAV5-hSyn-DIO-mCherry virus was injected into the NAcSh, TS, PFC, and PVT, many mCherry-positive cells were observed in the corresponding regions, and the mCherry signals were overlapping with the Sulf1 expression revealed by β-galactosidase immunostaining (Figure 9A). We then examined the co-localization with β-galactosidase and mCherry at the cellular level (Figure 9B). As shown in Figure 9C, among the Sulf1-expressing cells in the NAcSh (NAcShSulf1), 62.6 and 38.0% were positive for Drd1 and Drd2, respectively. Similarly, among the Sulf1-expressing cells in the TS (TSSulf1), 55.3% was positive for Drd1, and 43.6%, for Drd2 (Figure 9C). Among the Sulf1-expressing cells in the PFC (PFCSulf1), 78.6% were positive for Drd1, whereas among the Sulf1-expressing cells in the PVT (PVTSulf1), 83.8% were positive for Drd2 (Figure 9C). In an opposite manner, the ratio of the Sulf1-positive cells in the Drd1-expressing cells was 90.6% in the NAcSh (NAcShD1R), 87.3% in the TS (TSD1R), and 96.0% in the PFC (PFCD1R), whereas Sulf1-expression in the Drd2-expressing cells was 78.0% in the NAcSh (NAcShD2R), 80.8% in the TS (TSD2R), and 93.5% in the PVT (PVTD2R). Taken together, these data demonstrate that Sulf1 expression coincides with Drd1/2 expression in the NAcSh, TS, PFC, and PVT.
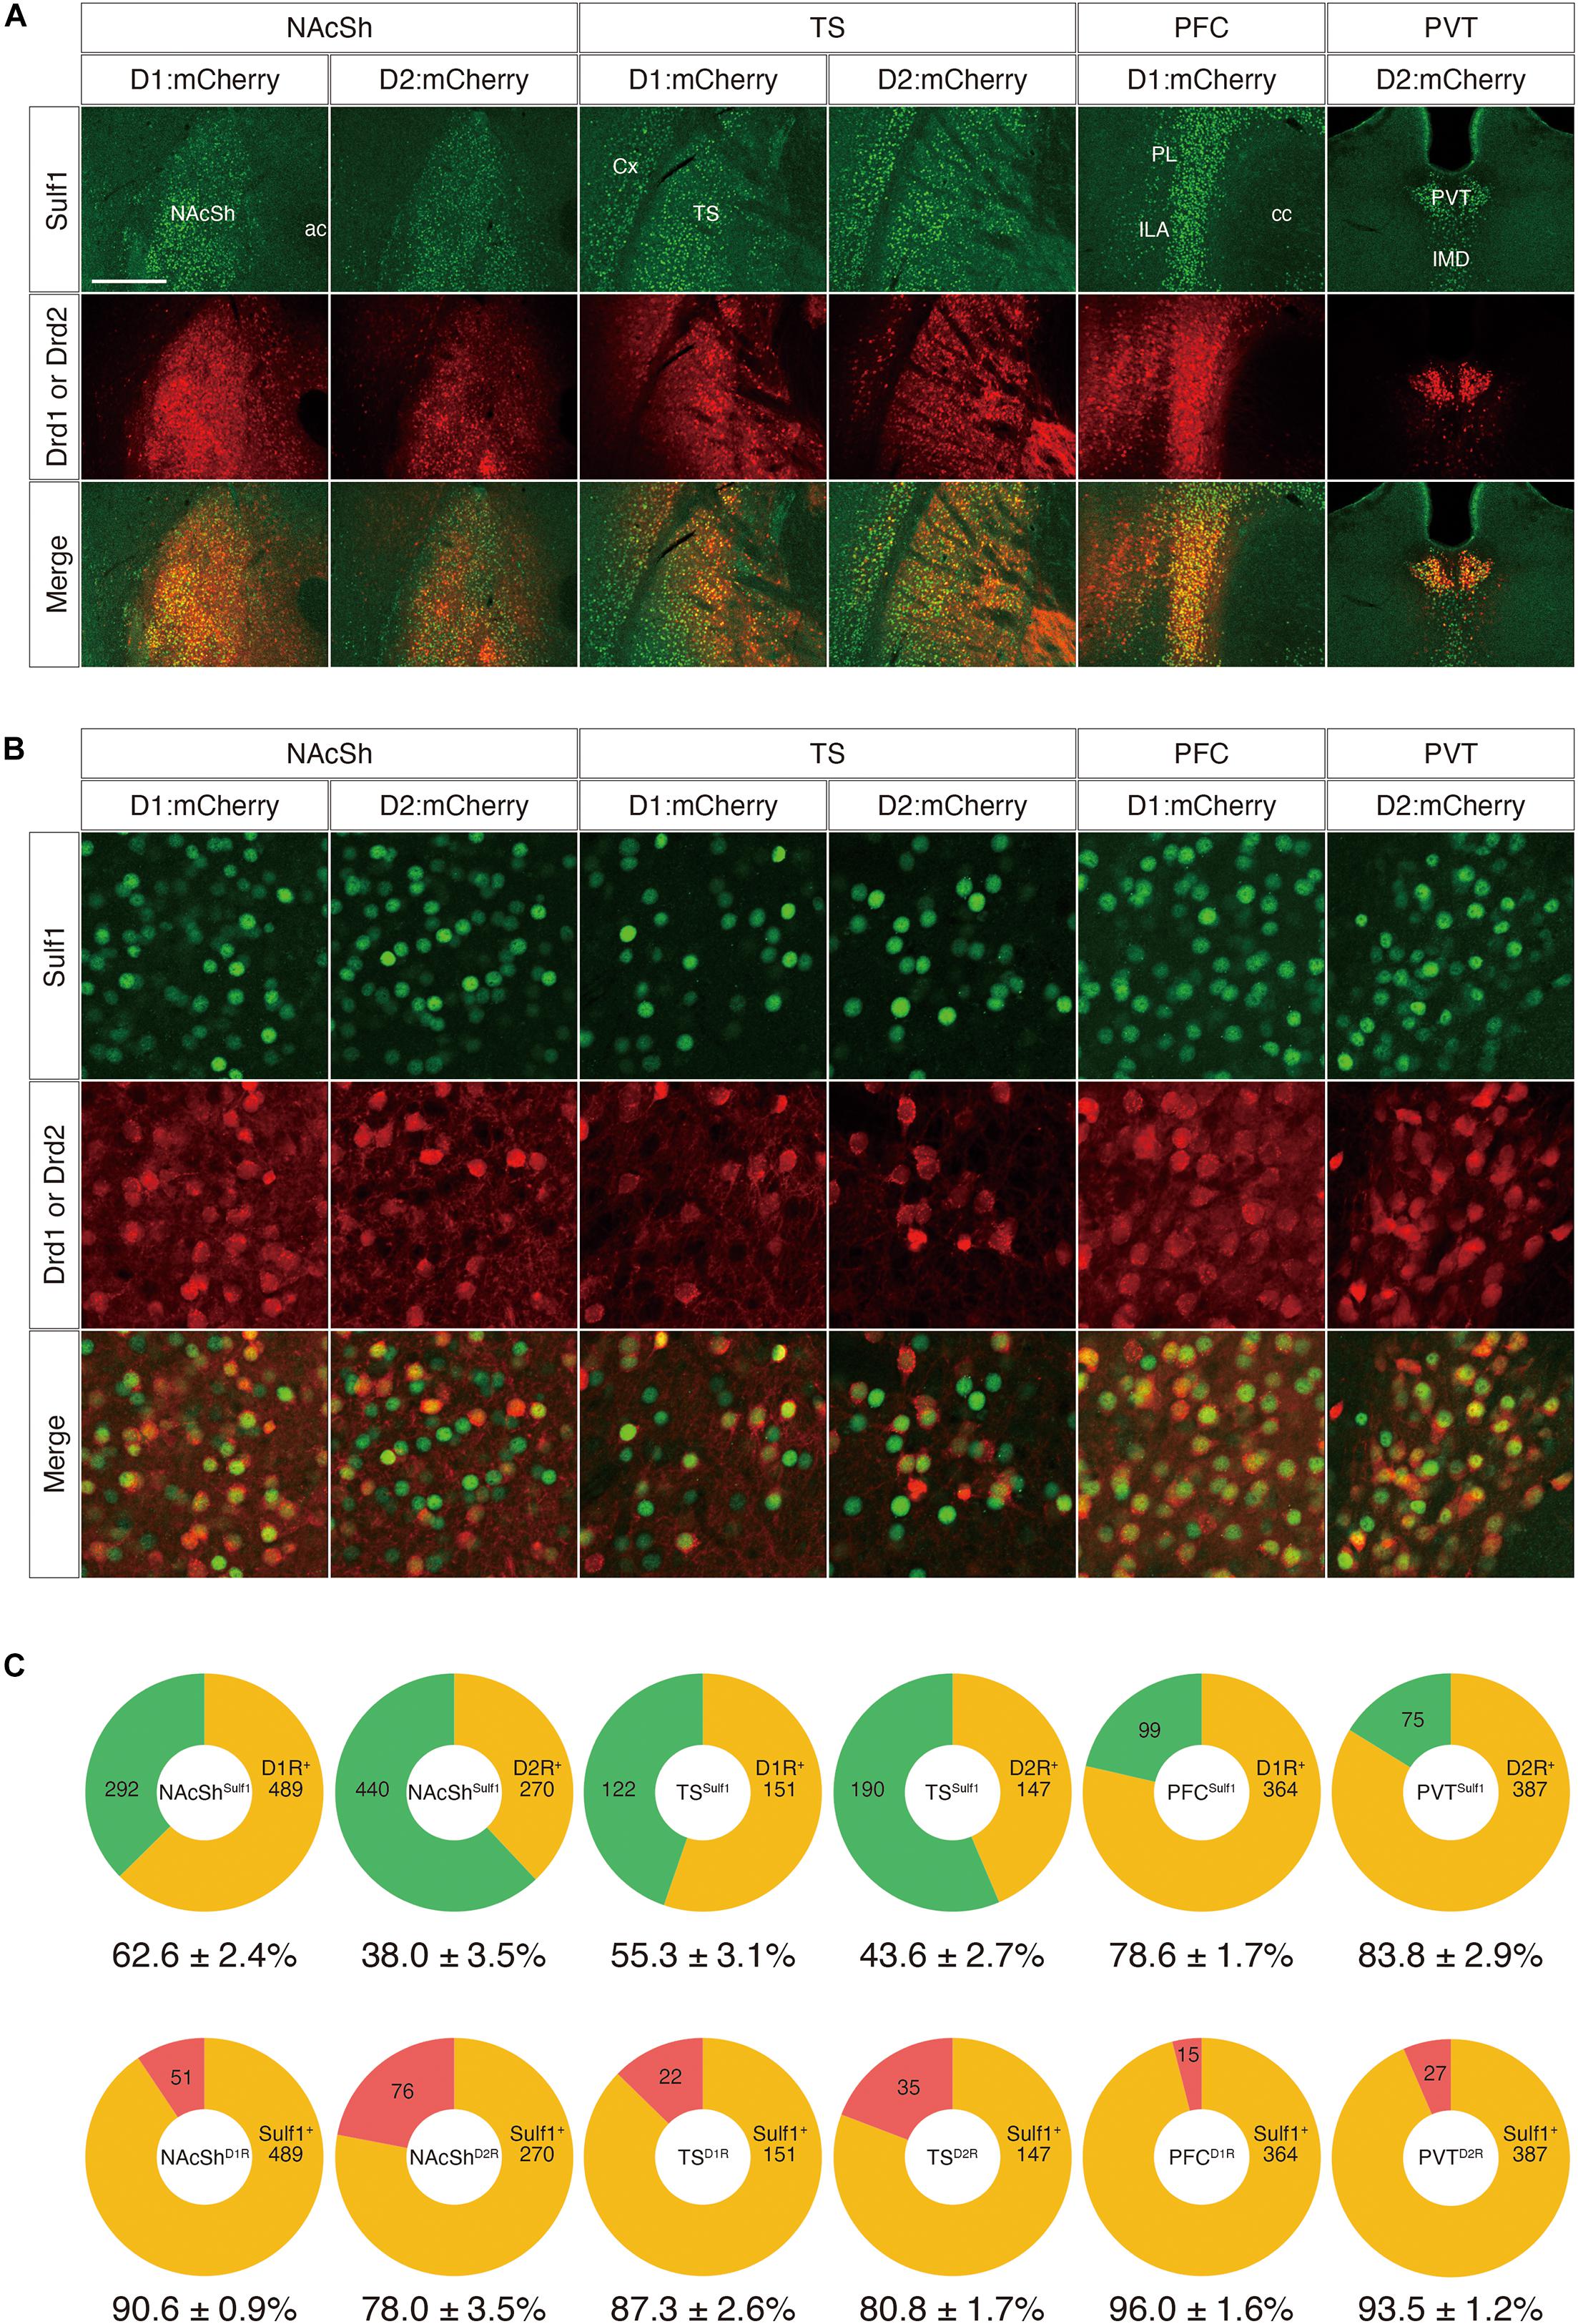
Figure 9. Co-expression of Sulf1 and the dopamine D1/D2 receptors. (A) Confocal microscopic images of the coronal brain slices. Sulf1-expressing cells were identified by detection of β-galactosidase inserted in the Sulf1 locus (Sulf1lacZ/+ mice). To label the D1R- or D2R-expressing neurons, AAV5-hSyn-DIO-mCherry was injected into the specific brain regions of the mice carrying Drd1-Cre or Drd2-Cre transgenes. The signals for β-galactosidase (green) and mCherry (red) are shown. The yellow signals in the merged images indicate co-localization. Coronal slices of the nucleus accumbens shell (NAcSh), posterior tail of the striatum (TS), prefrontal cortex (PFC), and paraventricular nucleus of the thalamus (PVT) are shown. ac, anterior commissure; cc, corpus callosum; Cx, cerebral cortex; ILA, infralimbic area; IMD, intermediodorsal nucleus of the thalamus; PL, prelimbic area. (B) High magnification images of the NAcSh, TS, PFC, and PVT regions are shown. (C) The upper panels show the percentages of D1R- or D2R-positive (orange) and D1R- or D2R-negative (green) cells in the Sulf1-expressing cells in each region. The lower panels show the percentages of Sulf1-positive (orange) and Sulf1-negative (red) cells in the D1R- or D2R-expressing cells in each region. Cell counting was conducted for three randomly selected ROIs for all regions from three mice (NAcSh) and two mice (other regions). The numbers in the circular graphs indicate the number of cells in each category. The numbers below the graphs indicate the percentages of co-localization. The scale bars indicate 400 μm in (A) and 50 μm in (B). Approximate AP levels from the bregma (in mm) in (A,B) are 1.0 (NAcSh), –1.0 (TS, PVT), and 2.0 (PFC).
Discussion
In this study, we examined Sulf1/2 mRNA expression throughout the adult mouse brain by using in situ hybridization. We found that the distribution of the two mRNAs was largely segregated, although some overlapping was observed in a few brain regions (see Table 1). Previous studies have demonstrated that disruption of the Sulf1 or Sulf2 gene singly did not result in apparent abnormalities, whereas disruption of the two genes together led to perinatal lethality and defects in the skeletal, renal, and neural systems (Ai et al., 2007; Holst et al., 2007; Ratzka et al., 2008; Freeman et al., 2015; Okada et al., 2017). These results suggest functional redundancy of the Sulf genes during development owing to overlapping expression of the Sulf1/2 genes in mouse embryos. Given that Sulf1 and Sulf2 show distinct expression patterns in the adult brain, it is possible that they have separate roles in different neural circuits dependent on their expressing regions. HSPGs act as synapse organizers and are implicated in synapse formation and neural plasticity (Holt and Dickson, 2005; Condomitti and de Wit, 2018; Kamimura and Maeda, 2021). More specifically, in the drosophila neuromuscular junction, RNAi-mediated knockdown of heparan sulfate 6-O-sulfotransferase (Hs6st) and Sulf1 resulted in decrease and increase in the amplitude of the synaptic current, respectively (Dani et al., 2012; Kamimura and Maeda, 2021), indicating regulatory roles of HS 6-O-sulfation in synaptic function. Therefore, it would be intriguing to further explore the neural functions of Sulf genes individually, although some behavioral abnormalities were already reported in Sulf1 and Sulf2 KO mice (Kalus et al., 2009). Given that astrocyte-derived glypican 4, one of the HSPGs, is known to cluster AMPA receptors and promote the formation of active synapses (Kamimura and Maeda, 2021), Sulf2 may have some role in astrocyte-mediated synaptic plasticity.
Sulf1 was distinctly expressed in the NAcSh, TS, claustrum, dorsal endopiriform nucleus, layer 6 of the cerebral cortex, and PVT. All of these regions are the target areas of the dopaminergic projections from the substantia nigra (SN), VTA, and others (Björklund and Dunnett, 2007; Li et al., 2014; Wong et al., 2021). In addition, we found that Sulf1-expressing cells were positive for D1R and/or D2R in the above regions (Figures 8, 9, data not shown), suggesting a close relationship between Sulf1 and D1R/D2R. From this viewpoint, it would be intriguing to explore the functions of Sulf1 in relation to the dopamine system. Sulf1 may regulate cell surface localization of dopamine receptors and transporters, act as a co-receptor for dopamine and growth factors, and regulate diffusion of dopamine in the ECM. It is thus important to test the possibility that Sulf1 gene disruption affects dopaminergic transmission. In addition, Sulf1 expression in both layer 6 of the cerebral cortex and the claustrum is also intriguing, because a common developmental and evolutionary origin of these two structures has recently been advocated (Bruguier et al., 2020).
The striatum consists mostly of GABAergic projection neurons called medium spiny neurons (MSNs). They are divided into two distinct populations according to their output pathways and molecular markers (Björklund and Dunnett, 2007; Cox and Witten, 2019). They receive dense innervation from dopamine neurons in the SN and VTA and possess dopamine receptors. It was reported that in the dorsal striatum, 52% and 43% of the MSNs express D1R and D2R, respectively, and only 5% express both subtypes, whereas in the NAcSh, 47% and 36% of the MSNs express D1R and D2R, respectively, and 17% express both (Bertran-Gonzalez et al., 2008). We found that most of the D1R- or D2R-expressing neurons in the NAcSh and TS were positive for Sulf1; therefore, it is likely that Sulf1 is expressed in most of the MSNs in these regions. The dopaminergic projection from the SN to the dorsal striatum is involved in motor and reinforcement-based behaviors, whereas the projection from the VTA to the NAc plays pivotal roles in reward- or aversion-related behaviors (Cox and Witten, 2019). The TS is the extreme caudal portion of the dorsal striatum and has unique anatomical connections and peculiar functions that are different from those of the other portions of the dorsal striatum (Menegas et al., 2015, Menegas et al., 2018; Cox and Witten, 2019; Valjent and Gangarossa, 2021). It is therefore possible that Sulf1 is associated with appetitive/aversive behaviors, motivation, and integration of sensory information and may have a relation with psychiatric diseases and drug addiction. Future work concerning dopamine-related behaviors will be required to elucidate the contribution of Sulf1 to higher brain functions.
In the thalamus, Sulf1 was selectively expressed in the midline and intralaminar nuclei, which have a broad connection with the NAc, hippocampus, and amygdala (Van Der Werf et al., 2002; Kirouac, 2015; Vertes et al., 2015; Kirouac, 2021). Thus, Sulf1 may be associated with the functions of these groups of cells in stress, anxiety, and drug-seeking activity. In particular, the PVT is a region of interest because it has a massive efferent connection with the NAc and controls NAc activity through the activation of the dopaminergic signal from the VTA (Parsons et al., 2007). Because D2R is expressed in the PVT, Sulf1 may affect the function of the PVT through dopaminergic modulation.
Sulf1 was also expressed in the anterior olfactory nucleus, tenia tecta, olfactory tubercle, piriform cortex, and lateral entorhinal cortex. These are collectively called the olfactory cortex and receive inputs from the mitral/tufted cells of the olfactory bulb (Igarashi et al., 2012). Given that they are involved in processing and perception of odors, Sulf1 may have some role in odorant signaling. Again, because D1R/D2R are abundant in the olfactory tubercle, piriform cortex, and lateral entorhinal cortex, Sulf1 may regulate odor signal processing through dopaminergic modulation.
Sulf1 was strongly expressed in the area postrema, organum vasculosum of the lamina terminalis, and subfornical organ. These organs are categorized as the sensory circumventricular organs (Sisó et al., 2010). They have highly permeable capillaries and lack the blood-brain barrier, thereby facilitating communication among the brain parenchyma, cerebrospinal fluid, and blood. They can sense the signals in the circulating blood and send information to other brain regions to maintain homeostasis and regulate the autonomic nervous system. Recent studies showed that neural stem cells exist in these areas in addition to in the subventricular zone and subgranular zone in the dentate gyrus and that tanycyte-like cells in these organs express neural stem cell markers (Prevot et al., 2018; Furube et al., 2020). Sulf1-expressing cells seem to correspond to tanycytes, suggesting the possible role of Sulf1 in neurogenesis. Furthermore, it is also intriguing that tanycytes in the adult brain and radial glial cells in the embryonic brain share some features and that tanycytes are thought to be genealogical descendants of radial glial cells because Sulf1/2 are highly expressed in the radial glial cells in the third ventricle of mouse embryos and regulate Slit2 protein localization for accurate guidance of corticospinal tract axons (Okada et al., 2017).
Taken together, our findings suggest possible roles of Sulf1 in dopaminergic transmission, NAc- and TS-associated behaviors, olfactory signaling, and maintenance of homeostasis. Future studies will be required to evaluate the relevance of Sulf1 in these brain functions.
Data Availability Statement
The raw data supporting the conclusions of this article will be made available by the authors, without undue reservation.
Ethics Statement
The animal study was reviewed and approved by Animal Care and Use Committee of the University of Tsukuba.
Author Contributions
KM, KK-M, TO, and MM designed the research and performed the experiments. KK generated the AAV virus. KM, KK-M, TO, and MM wrote the manuscript. All authors read and approved the final manuscript.
Funding
This work was supported by Kakenhi grants (grant numbers 22123006, 25293065, and 20H03348) from MEXT and the JSPS.
Conflict of Interest
The authors declare that the research was conducted in the absence of any commercial or financial relationships that could be construed as a potential conflict of interest.
Publisher’s Note
All claims expressed in this article are solely those of the authors and do not necessarily represent those of their affiliated organizations, or those of the publisher, the editors and the reviewers. Any product that may be evaluated in this article, or claim that may be made by its manufacturer, is not guaranteed or endorsed by the publisher.
Acknowledgments
We thank Dai Watanabe for providing the AAV-hSyn-DIO-mCherry plasmid and Kazuto Kobayashi for providing the Drd1-YFP/Drd2-YFP mice. We are grateful to Masahiko Takada, Ryuichi Shigemoto, Seiji Miyata, Takeshi Sakurai, Shingo Soya, and Takatoshi Hikida for useful comments and to Flaminia Miyamasu for critical reading of the manuscript.
Supplementary Material
The Supplementary Material for this article can be found online at: https://www.frontiersin.org/articles/10.3389/fnana.2021.726718/full#supplementary-material
Supplementary Figure 1 | Specificity of RNA probes in in situ hybridization. Coronal brain slices were hybridized with digoxigenin-labeled antisense RNA probes, and the signals were detected using a chromogenic substrate BM purple. Sulf1 probes (A–C) and Sulf2 probes (D–F) gave rise to distinct signals in the wild-type (WT) brain slices. The Sulf1 and Sulf2 signals were completely abolished in the Sulf1 KO (A’–C’) and Sulf2 KO (D’–F’) brain slices, respectively. The scale bar indicates 500 μm. Approximate AP levels from the bregma (in mm) are 2.0 (A,A’,D,D’), 1.0 (B,B’,E,E’), and –1.0 (C,C’,F,F’).
Supplementary Figure 2 | Sulf mRNA expression in the cerebral cortex. (A) Sulf1 and Sulf2 expressions in the prefrontal (PFC), primary motor (M1), primary somatosensory (S1), primary auditory (A1), and primary visual (V1) cortices are shown. The dotted lines in PFC indicate the midline; the slices above the lines show the contralateral side. The Sulf1, but not Sulf2, signals show the rostrocaudal gradient. (B) Layer-specific expression of Sulf1 and Sulf2 in the cerebral cortex. Microscopic images of the primary somatosensory cortex are shown. Sulf1/2-expressing cells were identified by staining with anti-β-galactosidase antibody (green). The cytoarchitecture was visualized using NeuroTrace Fluorescent Nissl Stain (red). The Sulf1 signals were strong in layer 6b and weak in layer 6a, whereas the Sulf2 signals were strong in layers 5 and 6b and weak in layer 6a. The scale bar indicates 100 μm. Approximate AP levels from the bregma (in mm) are 2.0 (PFC), 1.0 (M1), 0.5 (S1), –2.5 (A1), and –3.0 (V1).
Supplementary Figure 3 | Experimental procedure for analyzing the co-expression of Sulf1 and the dopamine D1/D2 receptors. Representatives images of the brain slices show Sulf1 expression detected by β-galactosidase immunostaining and D2 expression detected by mCherry in the Sulf1lacZ/+;Drd2-Cre mouse that received AAV5-hSyn-DIO-mCherry injection in the nucleus accumbens. Confocal images of the coronal slice containing the nucleus accumbens are shown. An image analysis software, Imaris, was used to mark Sulf1-expressing cells, labeled green, with spheres in one layer, and D2-expressing cells, labeled red, with squares in another layer. After independent marking, the two images were merged and the doubly or singly marked cells were counted. The scale bar indicates 50 μm. The approximate AP level from the bregma (in mm) is 1.0.
Abbreviations
A1, primary auditory area; AAV, adeno-associated virus; ac, anterior commissure; ACA, anterior cingulate area; AD, anterodorsal thalamic nucleus; AON, anterior olfactory nucleus; AP, anterior-posterior; ap, area postrema; Aq, aqueduct; ARH, arcuate hypothalamic nucleus; AVPV, anteroventral periventricular nucleus; BMA, basomedial amygdalar nucleus; BST, bed nucleus of the stria terminalis; cc, corpus callosum; CLA, claustrum; CM, central medial thalamic nucleus; CN, cerebellar nuclei; CP, choroid plexus; Cx, cerebral cortex; D1R, dopamine receptor type 1; D2R, dopamine receptor type 2; df, dorsal fornix; DIG, digoxigenin; DIO, double-floxed inverted open reading frame; DMH, dorsomedial nucleus of the hypothalamus; DP, dorsal peduncular cortex; DR, dorsal raphe nucleus; DSt, dorsal striatum; DV, dorsal-ventral; ECM, extracellular matrix; ECU, external cuneate nucleus; ENTl, entorhinal area lateral part; EPd, endopiriform nucleus dorsal part; f, fornix; fi, fimbria; fr, fasciculus retroflexus; GFP, green fluorescent protein; HPF, hippocampal formation; HS, heparan sulfate; HSPG, heparan sulfate proteoglycan; ILA, infralimbic area; IMD, intermediodorsal thalamic nucleus; IO, inferior olivary complex; IPN, interpeduncular nucleus; KO, knockout; LH, lateral hypothalamic area; LS, lateral septal nucleus; M1, primary motor area; M2, secondary motor area; MEPO, median preoptic nucleus; MH, medial habenula; ML, medial-lateral; mlf, medial longitudinal fasciculus; MnR, median raphe nucleus; MS, medial septal nucleus; MSN, medium spiny neuron; mt, mammillothalamic tract; NAc, nucleus accumbens; NAcSh, nucleus accumbens shell; NDB, diagonal band nucleus; NST, nucleus of the solitary tract; opt, optic tract; OT, olfactory tubercle; OVLT, organum vasculosum of the lamina terminalis; PAG, periaqueductal gray; PBS, phosphate-buffered saline; PBST, phosphate-buffered saline with 0.1% Tween-20; PCN, paracentral thalamic nucleus; PF, parafascicular thalamic nucleus; PFA, paraformaldehyde; PFC, prefrontal cortex; PG, pontine gray; Pir, piriform cortex; PL, prelimbic area; Pu, Purkinje cell layer; PVH, paraventricular hypothalamic nucleus; PVT, paraventricular thalamic nucleus; RE, reuniens thalamic nucleus; RN, raphe nuclei; ROI, region of interest; RSP, retrosplenial area; RT, reticular thalamic nucleus; S1, primary somatosensory area; SDS, sodium dodecyl sulfate; SFO, subfornical organ; SN, substantia nigra; SSC, saline-sodium citrate buffer; SVZ, subventricular zone; TBST, Tris-buffered saline with 0.1% Tween-20; TRN, tegmental reticular nucleus; TRS, triangular nucleus of septum; TS, the posterior tail of the striatum; TTd, tenia tecta dorsal part; TTv, tenia tecta ventral part; V1, primary visual area; V2, secondary visual area; vhc, ventral hippocampal commissure; VMH, ventromedial nucleus of the hypothalamus; VTA, ventral tegmental area; YFP, yellow fluorescent protein; ZI, zona incerta.
Footnotes
References
Ai, X., Do, A. T., Lozynska, O., Kusche-Gullberg, M., Lindahl, U., and Emerson, C. P. Jr. (2003). QSulf1 remodels the 6-O sulfation states of cell surface heparan sulfate proteoglycans to promote Wnt signaling. J. Cell Biol. 162, 341–351. doi: 10.1083/jcb.200212083
Ai, X., Kitazawa, T., Do, A. T., Kusche-Gullberg, M., Labosky, P. A., and Emerson, C. P. Jr. (2007). SULF1 and SULF2 regulate heparan sulfate-mediated GDNF signaling for esophageal innervation. Development 134, 3327–3338. doi: 10.1242/dev.007674
Bertran-Gonzalez, J., Bosch, C., Maroteaux, M., Matamales, M., Herve, D., Valjent, E., et al. (2008). Opposing patterns of signaling activation in dopamine D1 and D2 receptor-expressing striatal neurons in response to cocaine and haloperidol. J. Neurosci. 28, 5671–5685. doi: 10.1523/JNEUROSCI.1039-08.2008
Bishop, J. R., Schuksz, M., and Esko, J. D. (2007). Heparan sulphate proteoglycans fine-tune mammalian physiology. Nature 446, 1030–1037. doi: 10.1038/nature05817
Björklund, A., and Dunnett, S. B. (2007). Dopamine neuron systems in the brain: an update. Trends Neurosci. 30, 194–202. doi: 10.1016/j.tins.2007.03.006
Bruguier, H., Suarez, R., Manger, P., Hoerder-Suabedissen, A., Shelton, A. M., Oliver, D. K., et al. (2020). In search of common developmental and evolutionary origin of the claustrum and subplate. J. Comp. Neurol. 528, 2956–2977. doi: 10.1002/cne.24922
Clark, A. M., Leroy, F., Martyniuk, K. M., Feng, W., McManus, E., Bailey, M. R., et al. (2017). Dopamine D2 receptors in the paraventricular thalamus attenuate cocaine locomotor sensitization. eNeuro 4:ENEURO.0227-17.2017. doi: 10.1523/ENEURO.0227-17.2017
Condomitti, G., and de Wit, J. (2018). Heparan sulfate proteoglycans as emerging players in synaptic specificity. Front. Mol. Neurosci. 11:14. doi: 10.3389/fnmol.2018.00014
Cox, J., and Witten, I. B. (2019). Striatal circuits for reward learning and decision-making. Nat. Rev. Neurosci. 20, 482–494. doi: 10.1038/s41583-019-0189-2
Danesin, C., Agius, E., Escalas, N., Ai, X., Emerson, C., Cochard, P., et al. (2006). Ventral neural progenitors switch toward an oligodendroglial fate in response to increased Sonic hedgehog (Shh) activity: involvement of Sulfatase 1 in modulating Shh signaling in the ventral spinal cord. J. Neurosci. 26, 5037–5048. doi: 10.1523/JNEUROSCI.0715-06.2006
Dani, N., Nahm, M., Lee, S., and Broadie, K. (2012). A targeted glycan-related gene screen reveals heparan sulfate proteoglycan sulfation regulates WNT and BMP trans-synaptic signaling. PLoS Genet. 8:e1003031. doi: 10.1371/journal.pgen.1003031
Dhoot, G. K., Gustafsson, M. K., Ai, X., Sun, W., Standiford, D. M., Emerson, C. P., et al. (2001). Regulation of Wnt signaling and embryo patterning by an extracellular sulfatase. Science 293, 1663–1666. doi: 10.1126/science.293.5535.1663
El Masri, R., Seffouh, A., Lortat-Jacob, H., and Vivès, R. R. (2017). The “in and out” of glucosamine 6-O-sulfation: the 6th sense of heparan sulfate. Glycoconj. J. 34, 285–298. doi: 10.1007/s10719-016-9736-5
Franklin, K., and Paxinos, G. (2008). The Mouse Brain in Stereotaxic Coordinates, 3rd Edn. New York, NY: Academic Press.
Freeman, S. D., Keino-Masu, K., Masu, M., and Ladher, R. K. (2015). Expression of the heparan sulfate 6-O-endosulfatases. Sulf1 and Sulf2, in the avian and mammalian inner ear suggests a role for sulfation during inner ear development. Dev. Dyn. 244, 168–180. doi: 10.1002/dvdy.24223
Furube, E., Ishii, H., Nambu, Y., Kurganov, E., Nagaoka, S., Morita, M., et al. (2020). Neural stem cell phenotype of tanycyte-like ependymal cells in the circumventricular organs and central canal of adult mouse brain. Sci. Rep. 10:2826. doi: 10.1038/s41598-020-59629-5
Gong, S., Zheng, C., Doughty, M. L., Losos, K., Didkovsky, N., Schambra, U. B., et al. (2003). A gene expression atlas of the central nervous system based on bacterial artificial chromosomes. Nature 425, 917–925. doi: 10.1038/nature02033
Heintz, N. (2004). Gene expression nervous system atlas (GENSAT). Nat. Neurosci. 7:483. doi: 10.1038/nn0504-483
Holst, C. R., Bou-Reslan, H., Gore, B. B., Wong, K., Grant, D., Chalasani, S., et al. (2007). Secreted sulfatases Sulf1 and Sulf2 have overlapping yet essential roles in mouse neonatal survival. PLoS One 2:e575. doi: 10.1371/journal.pone.0000575
Holt, C. E., and Dickson, B. J. (2005). Sugar codes for axons? Neuron 46, 169–172. doi: 10.1016/j.neuron.2005.03.021
Igarashi, K. M., Ieki, N., An, M., Yamaguchi, Y., Nagayama, S., Kobayakawa, K., et al. (2012). Parallel mitral and tufted cell pathways route distinct odor information to different targets in the olfactory cortex. J. Neurosci. 32, 7970–7985. doi: 10.1523/JNEUROSCI.0154-12.2012
Jiang, W., Ishino, Y., Hashimoto, H., Keino-Masu, K., Masu, M., Uchimura, K., et al. (2017). Sulfatase 2 modulates fate change from motor neurons to oligodendrocyte precursor cells through coordinated regulation of Shh signaling with sulfatase 1. Dev. Neurosci. 39, 361–374. doi: 10.1159/000464284
Kalus, I., Rohn, S., Puvirajesinghe, T. M., Guimond, S. E., Eyckerman-Kolln, P. J., Ten Dam, G., et al. (2015). Sulf1 and Sulf2 differentially modulate heparan sulfate proteoglycan sulfation during postnatal cerebellum development: evidence for neuroprotective and neurite outgrowth promoting functions. PLoS One 10:e0139853. doi: 10.1371/journal.pone.0139853
Kalus, I., Salmen, B., Viebahn, C., Von Figura, K., Schmitz, D., D’hooge, R., et al. (2009). Differential involvement of the extracellular 6-O-endosulfatases Sulf1 and Sulf2 in brain development and neuronal and behavioural plasticity. J. Cell Mol. Med. 13, 4505–4521. doi: 10.1111/j.1582-4934.2008.00558.x
Kamimura, K., and Maeda, N. (2021). Glypicans and heparan sulfate in synaptic development, neural plasticity, and neurological disorders. Front. Neural Circuits 15:595596. doi: 10.3389/fncir.2021.595596
Kirouac, G. J. (2015). Placing the paraventricular nucleus of the thalamus within the brain circuits that control behavior. Neurosci. Biobehav. Rev. 56, 315–329. doi: 10.1016/j.neubiorev.2015.08.005
Kirouac, G. J. (2021). The paraventricular nucleus of the thalamus as an integrating and relay node in the brain anxiety network. Front. Behav. Neurosci. 15:627633. doi: 10.3389/fnbeh.2021.627633
Lamanna, W. C., Kalus, I., Padva, M., Baldwin, R. J., Merry, C. L., and Dierks, T. (2007). The heparanome–the enigma of encoding and decoding heparan sulfate sulfation. J. Biotechnol. 129, 290–307. doi: 10.1016/j.jbiotec.2007.01.022
Li, S., Shi, Y., and Kirouac, G. J. (2014). The hypothalamus and periaqueductal gray are the sources of dopamine fibers in the paraventricular nucleus of the thalamus in the rat. Front. Neuroanat. 8:136. doi: 10.3389/fnana.2014.00136
Lum, D. H., Tan, J., Rosen, S. D., and Werb, Z. (2007). Gene trap disruption of the mouse heparan sulfate 6-O-endosulfatase gene. Sulf2. Mol. Cell Biol. 27, 678–688. doi: 10.1128/MCB.01279-06
Menegas, W., Akiti, K., Amo, R., Uchida, N., and Watabe-Uchida, M. (2018). Dopamine neurons projecting to the posterior striatum reinforce avoidance of threatening stimuli. Nat. Neurosci. 21, 1421–1430. doi: 10.1038/s41593-018-0222-1
Menegas, W., Bergan, J. F., Ogawa, S. K., Isogai, Y., Umadevi Venkataraju, K., Osten, P., et al. (2015). Dopamine neurons projecting to the posterior striatum form an anatomically distinct subclass. eLife 4:e10032. doi: 10.7554/eLife.10032
Morimoto-Tomita, M., Uchimura, K., Werb, Z., Hemmerich, S., and Rosen, S. D. (2002). Cloning and characterization of two extracellular heparin-degrading endosulfatases in mice and humans. J. Biol. Chem. 277, 49175–49185. doi: 10.1074/jbc.M205131200
Nagai, T., Nakamuta, S., Kuroda, K., Nakauchi, S., Nishioka, T., Takano, T., et al. (2016). Phosphoproteomics of the dopamine pathway enables discovery of Rap1 activation as a reward signal in vivo. Neuron 89, 550–565. doi: 10.1016/j.neuron.2015.12.019
Nagamine, S., Koike, S., Keino-Masu, K., and Masu, M. (2005). Expression of a heparan sulfate remodeling enzyme, heparan sulfate 6-O-endosulfatase sulfatase FP2, in the rat nervous system. Brain Res. Dev. Brain Res. 159, 135–143. doi: 10.1016/j.devbrainres.2005.07.006
Nagamine, S., Tamba, M., Ishimine, H., Araki, K., Shiomi, K., Okada, T., et al. (2012). Organ-specific sulfation patterns of heparan sulfate generated by extracellular sulfatases Sulf1 and Sulf2 in mice. J. Biol. Chem. 287, 9579–9590. doi: 10.1074/jbc.M111.290262
Narita, K., Staub, J., Chien, J., Meyer, K., Bauer, M., Friedl, A., et al. (2006). HSulf-1 inhibits angiogenesis and tumorigenesis in vivo. Cancer Res. 66, 6025–6032. doi: 10.1158/0008-5472.CAN-05-3582
Ohto, T., Uchida, H., Yamazaki, H., Keino-Masu, K., Matsui, A., and Masu, M. (2002). Identification of a novel nonlysosomal sulphatase expressed in the floor plate, choroid plexus and cartilage. Genes Cells 7, 173–185. doi: 10.1046/j.1356-9597.2001.00502.x
Okada, T., Keino-Masu, K., Nagamine, S., Kametani, F., Ohto, T., Hasegawa, M., et al. (2017). Desulfation of heparan sulfate by Sulf1 and Sulf2 is required for corticospinal tract formation. Sci. Rep. 7:13847. doi: 10.1038/s41598-017-14185-3
Parsons, M. P., Li, S., and Kirouac, G. J. (2007). Functional and anatomical connection between the paraventricular nucleus of the thalamus and dopamine fibers of the nucleus accumbens. J. Comp. Neurol. 500, 1050–1063. doi: 10.1002/cne.21224
Perrimon, N., and Bernfield, M. (2000). Specificities of heparan sulphate proteoglycans in developmental processes. Nature 404, 725–728. doi: 10.1038/35008000
Prevot, V., Dehouck, B., Sharif, A., Ciofi, P., Giacobini, P., and Clasadonte, J. (2018). The versatile tanycyte: a hypothalamic integrator of reproduction and energy metabolism. Endocr. Rev. 39, 333–368. doi: 10.1210/er.2017-00235
Ratzka, A., Kalus, I., Moser, M., Dierks, T., Mundlos, S., and Vortkamp, A. (2008). Redundant function of the heparan sulfate 6-O-endosulfatases Sulf1 and Sulf2 during skeletal development. Dev. Dyn. 237, 339–353. doi: 10.1002/dvdy.21423
Sano, H., Kobayashi, K., Yoshioka, N., Takebayashi, H., and Nambu, A. (2020). Retrograde gene transfer into neural pathways mediated by adeno-associated virus (AAV)-AAV receptor interaction. J. Neurosci. Methods 345:108887. doi: 10.1016/j.jneumeth.2020.108887
Sisó, S., Jeffrey, M., and González, L. (2010). Sensory circumventricular organs in health and disease. Acta Neuropathol. 120, 689–705. doi: 10.1007/s00401-010-0743-5
Touahri, Y., Escalas, N., Benazeraf, B., Cochard, P., Danesin, C., and Soula, C. (2012). Sulfatase 1 promotes the motor neuron-to-oligodendrocyte fate switch by activating Shh signaling in Olig2 progenitors of the embryonic ventral spinal cord. J. Neurosci. 32, 18018–18034. doi: 10.1523/JNEUROSCI.3553-12.2012
Valjent, E., Bertran-Gonzalez, J., Herve, D., Fisone, G., and Girault, J. A. (2009). Looking BAC at striatal signaling: cell-specific analysis in new transgenic mice. Trends Neurosci. 32, 538–547. doi: 10.1016/j.tins.2009.06.005
Valjent, E., and Gangarossa, G. (2021). The tail of the striatum: from anatomy to connectivity and function. Trends Neurosci. 44, 203–214. doi: 10.1016/j.tins.2020.10.016
Van Der Werf, Y. D., Witter, M. P., and Groenewegen, H. J. (2002). The intralaminar and midline nuclei of the thalamus. Anatomical and functional evidence for participation in processes of arousal and awareness. Brain Res. Brain Res. Rev. 39, 107–140. doi: 10.1016/s0165-0173(02)00181-9
Vertes, R. P., Linley, S. B., and Hoover, W. B. (2015). Limbic circuitry of the midline thalamus. Neurosci. Biobehav. Rev. 54, 89–107. doi: 10.1016/j.neubiorev.2015.01.014
Vivès, R. R., Seffouh, A., and Lortat-Jacob, H. (2014). Post-Synthetic regulation of HS structure: the yin and yang of the sulfs in cancer. Front. Oncol. 3:331. doi: 10.3389/fonc.2013.00331
Wang, S., Ai, X., Freeman, S. D., Pownall, M. E., Lu, Q., Kessler, D. S., et al. (2004). QSulf1, a heparan sulfate 6-O-endosulfatase, inhibits fibroblast growth factor signaling in mesoderm induction and angiogenesis. Proc. Natl. Acad. Sci. U S A. 101, 4833–4838. doi: 10.1073/pnas.0401028101
Wong, K. L. L., Nair, A., and Augustine, G. J. (2021). Changing the cortical conductor’s tempo: neuromodulation of the claustrum. Front. Neural Circuits 15:658228. doi: 10.3389/fncir.2021.658228
Keywords: sulfatase 1, sulfatase 2, expression, in situ hybridization, mouse brain, dopamine receptor, Sulf1
Citation: Miya K, Keino-Masu K, Okada T, Kobayashi K and Masu M (2021) Expression of Heparan Sulfate Endosulfatases in the Adult Mouse Brain: Co-expression of Sulf1 and Dopamine D1/D2 Receptors. Front. Neuroanat. 15:726718. doi: 10.3389/fnana.2021.726718
Received: 17 June 2021; Accepted: 26 July 2021;
Published: 20 August 2021.
Edited by:
Wen-Jie Song, Kumamoto University Hospital, JapanCopyright © 2021 Miya, Keino-Masu, Okada, Kobayashi and Masu. This is an open-access article distributed under the terms of the Creative Commons Attribution License (CC BY). The use, distribution or reproduction in other forums is permitted, provided the original author(s) and the copyright owner(s) are credited and that the original publication in this journal is cited, in accordance with accepted academic practice. No use, distribution or reproduction is permitted which does not comply with these terms.
*Correspondence: Masayuki Masu, bW1hc3VAbWQudHN1a3ViYS5hYy5qcA==