 Chao Fang
 Hong Wang
 Robert Konrad Naumann
- CAS Key Laboratory of Brain Connectome and Manipulation, The Brain Cognition and Brain Disease Institute (BCBDI), Shenzhen Institute of Advanced Technology, Chinese Academy of Sciences, Shenzhen-Hong Kong Institute of Brain Science-Shenzhen Fundamental Research Institutions, Shenzhen, China
The claustrum is an enigmatic brain structure thought to be important for conscious sensations. Recent studies have focused on gene expression patterns, connectivity, and function of the claustrum, but relatively little is known about its development. Interestingly, claustrum-enriched genes, including the previously identified marker Nurr1, are not only expressed in the classical claustrum complex, but also embedded within lateral neocortical regions in rodents. Recent studies suggest that Nurr1 positive neurons in the lateral cortex share a highly conserved genetic expression pattern with claustrum neurons. Thus, we focus on the developmental progression and birth dating pattern of the claustrum and Nurr1 positive neurons in the lateral cortex. We comprehensively investigate the expression of Nurr1 at various stages of development in the rat and find that Nurr1 expression first appears as an elongated line along the anterior-posterior axis on embryonic day 13.5 (E13.5) and then gradually differentiates into multiple sub-regions during prenatal development. Previous birth dating studies of the claustrum have led to conflicting results, therefore, we combine 5-ethynyl-2′-deoxyuridine (EdU) labeling with in situ hybridization for Nurr1 to study birth dating patterns. We find that most dorsal endopiriform (DEn) neurons are born on E13.5 to E14.5. Ventral claustrum (vCL) and dorsal claustrum (dCL) are mainly born on E14.5 to E15.5. Nurr1 positive cortical deep layer neurons (dLn) and superficial layer neurons (sLn) are mainly born on E14.5 to E15.5 and E15.5 to E17.5, respectively. Finally, we identify ventral to dorsal and posterior to anterior neurogenetic gradients within vCL and DEn. Thus, our findings suggest that claustrum and Nurr1 positive neurons in the lateral cortex are born sequentially over several days of embryonic development and contribute toward charting the complex developmental pattern of the claustrum in rodents.
Introduction
The claustrum is an irregularly shaped sheet of neurons located in the basolateral forebrain of the mammalian brain. It is thought to be involved in four main functions: regulation of sleep, consciousness, attention and salience, and memory (Mathur, 2014; Jackson et al., 2020; Smith et al., 2020; Wong et al., 2021). This notion is supported by the dense connectivity of the claustrum with other cortical regions (Smith and Alloway, 2010; Patzke et al., 2014; Torgerson et al., 2015; Kitanishi and Matsuo, 2017; Wang et al., 2017; Zingg et al., 2018). In addition, the claustrum also shows a wide range of shapes among mammals (Johnson et al., 2014; Binks et al., 2019), which has made it a challenge to define its precise anatomical boundaries, especially in rodents (Dillingham et al., 2019; Smith et al., 2019). But what exactly is the claustrum? In several anatomical studies (e.g., Witter et al., 1988), the claustrum is relatively broadly defined, encompassing a range of nuclei that are now identified as distinct subregions such as the dorsal claustrum (dCL), ventral claustrum (vCL), and the dorsal endopiriform nucleus (DEn). Much like other cortical regions, the claustrum consists of roughly 90% glutamatergic neurons (Druga, 2014), and typical claustrum markers like Nurr1 (also known as Nr4a2) label a large fraction of these neurons (Erwin et al., 2021). Recent studies of the claustrum using circuit-based and transcriptomic approaches (Wang et al., 2017; Erwin et al., 2021; Marriott et al., 2021; Peng et al., 2021) allow a more precise definition of the claustrum and related nuclei. Intriguingly, while there is an ever expanding list of gene markers mainly expressed in the claustrum (Zeisel et al., 2015; Wang et al., 2017; Smith et al., 2019; Bruguier et al., 2020; Erwin et al., 2021; Yao et al., 2021), a large fraction of these genes are expressed not only in the claustrum proper, but also consistently in other regions, such as the DEn, the subplate (Sp), and – in rodents – in the deep layers of lateral neocortex (Arimatsu, 1994; Puelles, 2014; Bruguier et al., 2020; Ratié et al., 2020). Knowledge about the developmental patterning of claustrum cell types could help to understand their adult distribution and function. However, despite the wealth of new gene expression data, the development of claustrum cell types remains incompletely understood.
In mammals, the cerebral cortex and several non-layered regions that largely consist of excitatory neurons together comprise the pallium, or mantle, of the telencephalon (Puelles et al., 2013). The pallium is best understood as a system of concentric rings of variable differentiation in terms of layers, connections, and cell types, with the neocortex at the center (Filimonoff, 1947; Sanides, 1970; Puelles et al., 2019; Medina et al., 2021). In this model, surrounding the core neocortical sensory and motor areas are transition regions, such as, the insular, perirhinal, or cingulate cortices. These regions show less differentiated lamination, closer interconnections with the amygdala or hippocampal regions, a distinct temporal pattern of development, and a distinct roster of cell types compared to the core neocortex (Reep, 1984; Bayer, 1990; Yao et al., 2021). The lateral transition areas and ventral to it, the olfactory cortex, have a unique characteristic among cortical regions: a set of embedded nuclei – the claustrum and the endopiriform nucleus – consistently located at the same topological position across all mammals (Binks et al., 2019). Given the distinct gene expression patterns in the claustrum and endopiriform nucleus compared to their surrounding cortical areas, elucidating their developmental origin can help to understand structure, connectivity, and possibly function in the adult brain. Puelles et al. (1999, 2000) proposed a model of the pallium containing four subdivisions or sectors, each of which is generated from progenitor cells at different positions of the developing forebrain. Recently, Nurr1 expression was instrumental in updating the pallial sector model (Puelles, 2014, 2017; Puelles et al., 2016a; Watson and Puelles, 2017). Its current version stipulates that Nurr1 positive neurons in the claustrum belong to the lateral sector of the pallium, together with neurons from the insular cortex. Other cortical Nurr1 positive neurons outside the insular cortex are also proposed to be closely related to claustrum neurons, arriving at their final position by tangential migration in the ventral (DEn) or dorsal (dCL, deep layers of lateral neocortex) direction. Thus, unlike most other pallial neurons which only migrate radially, claustrum and endopiriform nucleus neurons may have both unique gene expression and migratory patterns.
A key aspect of claustrum development is to understand the temporal sequence of claustrum neuron generation. Several authors studied birth dating of claustrum and endopiriform nucleus neurons using injections of [H3]thymidine or 5-bromo-2′-deoxyuridine (BrdU) in the rat (reviewed in Puelles, 2014; Bruguier et al., 2020). Interestingly, a wide spectrum of birth dates was reported, with some studies observing early claustrum neuron production peaking at embryonic day 11.5 (E11.5) or E12.5 (Bisconte and Marty, 1975; Valverde and Santacana, 1994) and others observing peak production at E14–E16 (Bayer and Altman, 1991; Arimatsu, 1994; Arimatsu et al., 2003). Bayer and Altman (1991) investigated the patterning of neurogenesis with the aim to identify gradients of neuron generation within the claustrum and DEn. They showed that dorsal endopiriform neurons develop between E12 and E17, with peak production in ventral parts at E14 and in more dorsal parts at E15. In contrast, the claustrum displays a posterior to anterior gradient. In the posterior claustrum, most neurons are born on E15, while anteriorly more neurons are generated at E16. The first studies to combine birth dating with claustrum-specific markers (Arimatsu, 1994; Arimatsu et al., 2003) identified comparable birth dates for the dorsal endopiriform nucleus and the ventral claustrum but did not discuss neurogenetic gradients within these regions. Instead, Arimatsu (1994) and Arimatsu et al. (2003) focused on deep layer neurons (dLn) of the lateral neocortex expressing the claustrum marker Latexin (Lxn), and found that most of these neurons are born on E15, unlike other deep layer neocortex neurons. To our knowledge, the birth dates of the dorsal claustrum neurons have not been studied. Some of the variability in birth dates may be attributable to differences in defining embryonic dates or injection patterns of thymidine analogs (see Puelles, 2014), some to definitions of claustrum and dorsal endopiriform sub-regions, and some to methodological differences. For example, both [H3]thymidine and BrdU labeling involve tissue processing steps that may impact co-labeling with antibodies or in situ hybridization (Miller and Nowakowski, 1988). More recent birth dating methods, such as 5-ethynyl-2′-deoxyuridine (EdU) and FlashTag labeling (Salic and Mitchison, 2008; Govindan et al., 2018) or neurogenetic tagging techniques based on Cre-loxP recombination (Hirata et al., 2019, 2021) have the potential to clarify claustrum birth dating but have not been used to that end. In conclusion, previous studies identified a wide range of claustrum birth dates while considering only some of the regions now known to express claustrum specific markers.
Recently, Hedderich et al. (2021) observed altered claustrum microstructure in the human brain after premature birth. The authors suggest that perinatal development influences the cellular architecture of the claustrum which in turn could be relevant for explaining impaired cognitive performance in premature-born adults. These findings highlight the need to further our understanding about normal and aberrant claustrum development. Therefore, the aims of the present study are: (i) to determine the distribution of Nurr1 expressing neurons in the prenatal and early postnatal rat cerebral cortex, (ii) to identify stable and transient patterns of Nurr1 expression, and (iii) to establish a comprehensive birth dating profile of Nurr1 expressing claustrum and Nurr1 positive neurons in the lateral cortex. To accomplish these aims, we combine single EdU injections on consecutive days during embryonic development with in situ hybridization detection of Nurr1 throughout the entire developing rat brain. Most previous studies of claustrum birth dating have focused on the rat as a model animal, yet shown widely diverging results. To clarify and compare results, here, we also focus on the rat. In addition, we study EdU signals at birth, because all claustrum subdivisions and related cell types are readily identifiable, including some which only appear transiently.
Materials and Methods
Animals
Experimental procedures were performed in accordance with the guidelines of the Animal Care and Use Committees at the Shenzhen Institute of Advanced Technology (SIAT), Chinese Academy of Sciences (CAS), China (permit number SIAT-IACUC-20210607-NS-NBJZX-ROBERT NAUMANN-A1706-01). Wild type pregnant Sprague Dawley (SD) rats were supplied by Beijing Vital River Laboratory Animal Technology Co., Ltd. Both male and female rats aged from E13.5 to postnatal day 20 (P20) were used in this study. Food and water were given ad libitum. The day females were sperm positive was designated as E0.5. Pups were typically born on E21.5-E22.5, and the birth day was designated as P0.
EdU Injection
5-ethynyl-2′-deoxyuridine (EdU, ApexBIO, Houston, United States, Cat# B8337) was diluted in 0.1 M phosphate buffered saline solution (PBS). Female timed-pregnant rats (N = 18, 3 per group, bodyweight 280–320 g) received a single 25 mg/kg EdU injection given between 17:00 and 18:00 on days corresponding to E12.5 to E17.5. At birth, all newborn rats were perfused.
Tissue Preparation
Pregnant rats or rat pups (P0, P2, P4, P8 and P20) were briefly anesthetized with isoflurane and subsequently given an intraperitoneal injection of 60 mg/kg pentobarbital. Rat pups were perfused with 0.1 M DEPC (diethyl pyrocarbonate)-PBS and 4% paraformaldehyde (PFA) in 0.1 M phosphate buffer (PB), followed by brain dissection and fixation with 4% PFA overnight. Embryonic brains were dissected out in ice cold DEPC-PBS, followed by fixation in 4% PFA overnight. Before sectioning, rat brains were cryoprotected using a 30% sucrose solution in DEPC-PBS for over 24 h. We used OCT compound for embedding brains and prepared 50 μm thick coronal sections.
In situ Hybridization
In situ hybridization was performed using a protocol based on Ferran et al. (2015). DIG-labeled Riboprobes were used for hybridization on 50 μm free floating cryosections. Hybridization was performed overnight at 65°C without proteinase K treatment. Sections were washed at 65°C two times in 2xSSC/50% Formamide/0.1% N-lauroylsarcosine for 20 min, twice in 2xSSC/0.1% N-lauroylsarcosine at 37°C for 20 min and twice in 0.2xSSC/0.1% N-lauroylsarcosine at 37°C for 20 min. Sections were blocked in MABT/10% goat serum/1% Blocking reagent (Roche Diagnostics, Mannheim, Germany, Cat# 11096176001), incubated overnight with sheep anti-DIG-AP (1:1000, Roche Diagnostics, Mannheim, Germany, Cat# 11093274910). After washing, staining was performed using NBT/BCIP in NTMT until satisfactory intensity was reached. Staining reaction was stopped with 10 mM EDTA. Sections were washed, dehydrated and mounted with Eukitt® Quick-hardening mounting medium (Sigma Aldrich, St. Louis, United States, Cat# 03989).
Fluorescent in situ hybridization was performed using DIG-labeled probes. After hybridization and washing, sections were first incubated with sheep anti-DIG-POD (1:1000, Roche Diagnostics, Mannheim, Germany, Cat# 11207733910) and tyramide signal amplification (TSA) was performed using biotin-tyramide (ApexBIO, Houston, United States, Cat#A8011). For TSA, sections were equilibrated 5 min in TSA buffer (10 mM imidazole in PBS), then incubated in the TSA staining solution (2 μg/ml biotin-tyramid/0.001%H2O2/TSA buffer) in the dark for 30 min without shaking. After washing, sections, subsequently, were incubated with Streptavidin-Cy2 (Jackson ImmunoResearch) to detect the DIG labeled probe. Sections were washed, then mounted with Fluromount medium (Sigma Aldrich, St. Louis, United States, Cat# F4680).
Rat cDNA was synthetized from total brain RNA using EasyScript First-Strand cDNA Synthesis SuperMix (Transgen Biotech, Beijing, China, Cat# AE301-02). The Nurr1 probe was amplified with the following primer pairs: Fw-tgttcaggcgcagtatgggtcc. Re-tcacaagtgcgaacaccgtaatgc, for a total length of 834 bp, and then cloned in a pEASY-Blunt Zero backbone (Transgen Biotech, Beijing, China, Cat# CB501-01) and verified by sequencing. Antisense digoxigenin-labeled riboprobes were synthetized according to the protocol recommended by the manufacturer (Roche Diagnostics, Mannheim, Germany).
EdU Click Chemistry Reaction
Detection of EdU was performed after in situ hybridization with a modified protocol based on Salic and Mitchison, 2008 and Hong et al., 2009. Free-floating sections were washed 3 × 5 min in PBS, 1 × 20 min 0.5% Triton X-100/PBS, 3 × 5 min in PBS. Subsequently, sections were incubated for 30 min in the EdU click chemistry reaction buffer in the dark at room temperature. The reaction buffer (working solution) was prepared freshly by combining in the following order: (1) 0.1 M PBS (2) 5 mM CuSO4, (3) 1 mM THPTA (tris-hydroxypropyltriazolylmethylamine), (4) 30 mM Na-Asc (Ascorbic Acid Sodium Salt), and (5) 25 μM Cy3 azide (ApexBIO, Cat# A8127). When preparing the reaction buffer, mix well after adding each component, the solution should be transparent after adding Na-Asc. After the click reaction, sections were washed 3 × 5 min in PBS. A detailed ISH and EdU labeling protocol can be found online https://wangnaumannlab.cn/wj.
Quantification of Nurr1 + EdU + Double Positive Cells
For quantification of cells expressing both Nurr1 and EdU, we use P0 sections where all Nurr1 labeled sub-regions can be clearly identified and are comparable across animals. For each individual region, we counted double positive cells from three animals in three equally distanced sections at the coordinates indicated below. For the ventral DEn (vDEn), dorsal DEn (dDEn), vCL, and dCL, we use anterior sections at bregma 0.8 to 0.6 mm. For the dLn, we use intermediate sections at bregma −0.4 to −0.6 mm. For the superficial layer neurons (sLn) and posterior DEn (pDEn), we use posterior sections at bregma −1.6 to −1.8 mm (coordinates based on Khazipov et al., 2015). We focus on injection dates with significant EdU expression for each subregion: E12.5 to E15.5 for the vDEn, dDEn and pDEn; E13.5 to E15.5 for the vCL and dCL; E13.5 to E16.5 for the dLn and E15.5 to E17.5 for the sLn.
Image Acquisition
All chromogenic and fluorescent stainings were imaged at 10 × or 20 × magnification on a slide scanner (BX61VS, Olympus, Japan) or at 20 × magnification on an ApoTome microscope (Axio Imager 2, ZEISS, Germany). The fluorescent images were acquired in monochrome, and color maps were applied to the images post acquisition. Post hoc linear brightness and contrast adjustment were applied uniformly to the image under analysis.
Results
EdU Labeling of Dividing Neurons and Nurr1 Labeling of Claustrum Related Regions
We study the birth dating of the claustrum, endopiriform nucleus, and related cortical regions that are labeled by Nurr1 gene expression by injecting EdU at different time points in timed-pregnant rats. We define E0.5 as the first day that females were sperm positive. We investigate the distribution of EdU labeling and Nurr1 expression in rat pups at birth P0 (Figure 1A). Since EdU toxicity may adversely affect cellular health (Andersen et al., 2013), we sought to identify the lowest dose of EdU that allows reliable birth dating while maximizing pup survival. We find that injections of 10 mg/kg or 25 mg/kg EdU show little effects on litter size, while higher doses correlate with reduced litter size (Figure 1B). The survival time after EdU injection was not correlated with litter size (Figure 1B). Thus, we subsequently use injections of 25 mg/kg for all further experiments. Figures 1C,D shows the lateral and dorsal regions of cortex of P0 rats after consecutively timed EdU injections. In the dorsal cortex (Figure 1C), we observe EdU signal in cortical layer 6 mainly in animals injected on E14.5, in layer 5 mainly in animals injected on E15.5 and in upper layers in animals injected on E16.5 and E17.5. In contrast, in the lateral cortex (Figure 1D) EdU signals appeared earlier and relatively few newborn neurons were detected in animals injected later than E16.5. To identify claustrum neurons we use in situ hybridization for Nurr1, a relatively selective and early expressed marker (Puelles, 2014). We study seven brain regions labeled by Nurr1 illustrated in three coronal sections of the rat brain at P0 (Figure 1E). In the anterior section, Nurr1 labels four sub-regions, including dCL and vCL. Since the DEn shows dark and light staining parts, we divide it into dDEn, and vDEn as suggested previously (Bayer and Altman, 1991; Arimatsu, 1994). In the intermediate section, we identify Nurr1 expression in cortical deep layers dLn. In the posterior section, Nurr1 is expressed in cortical superficial layers sLn, and the elongated pDEn. Another region containing Nurr1 positive neurons, the Sp has been studied in great detail (reviewed in Hoerder-Suabedissen and Molnár, 2015; Molnár et al., 2020), so we do not investigate it here.
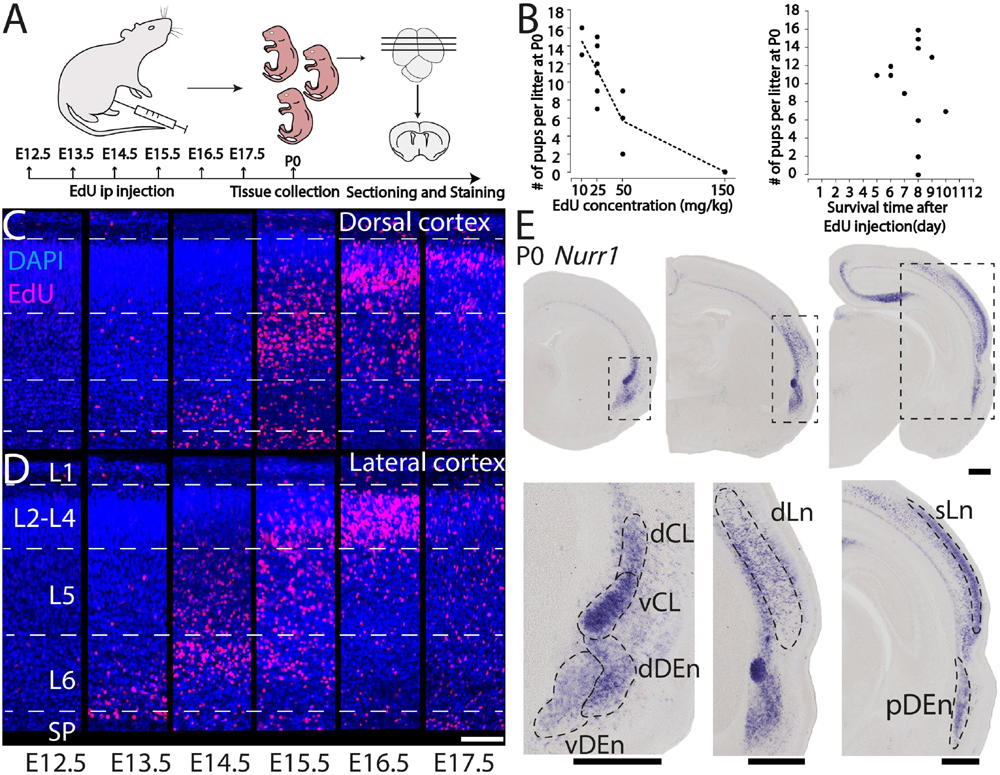
Figure 1. Overview of technical approach. (A) Schematic diagram of EdU injections in pregnant rats from E12.5 to E17.5, followed at P0 by tissue collection, microtomy, and staining. (B) Relation of P0 rats survival rate with EdU concentrations and (left graph), and with survival time after EdU injection (right graph). EdU labeled P0 dorsal (C) and lateral (D) cortical sections from E12.5 to E17.5 injections. (E) Nurr1 expression in P0 sections from anterior to posterior, and magnified Nurr1 labeled regions including, dCL (dorsal claustrum), vCL (ventral claustrum), dDEn (dorsal DEn), vDEn (ventral DEn), dLn (deep layer neurons), sLn (superficial layer neurons), and pDEn (posterior DEn). Scale bar in panels (C,D) = 100 μm. Scale bar in panel (E) = 0.5 mm.
Prenatal Nurr1 Expression in the Lateral Forebrain
During prenatal development, we observe the earliest Nurr1 expression in the prospective claustrum and dorsal endopiriform regions (CL/DEn) on E13.5 (Figure 2A). In intermediate sections, Nurr1 first appears as a small elongated region. Its ventral part is located closer - its dorsal part more distant to the brain surface (Figure 2Aa). In more posterior sections, we observe little Nurr1 staining in the lateral forebrain yet a large group of Nurr1 positive cells is present at more ventral locations marked with a star symbol. We observe a direct connection of this ventral posterior Nurr1 positive region and the prospective CL/DEn region marked by an arrow (Figure 2A). E15.5 (Figure 2B) sees a major shift in the intensity and distribution Nurr1 expression. Nurr1 now labels the CL/DEn in more anterior and more posterior sections than in earlier stages, also weakly labeled in the lateral part of the cortex. Sp neurons are also weakly labeled. Anteriorly, CL/DEn has reversed its orientation. Its dorsal part is now closer to the brain surface while the ventral part is relatively distant from the brain surface (Figure 2Bb1). In the intermediate sections the CL/DEn starts to divide into two parts with different staining intensity (Figure 2Bb2). The elongated shape of the pDEn becomes apparent in more posterior sections (Figure 2Bb3). From E17.5 (Figure 2C) until birth the Nurr1 expression pattern in the prospective CL/DEn shows less overall changes, but becomes more differentiated. Anteriorly, different subregions of CL/DEn are not yet apparent on E17.5 (Figure 2Cc1) but at more intermediate levels more subregions become apparent, we tentatively label them as vCL, dDEn, and vDEn (Figure 2Cc2). In posterior sections, the pDEn appears continuously with the Sp neurons (Figure 2Cc3), while at intermediate sections there is a small gap between CL and Sp neurons and in anterior sections, a wider gap (Figures 2Cc1,c2). In addition, Nurr1 starts to weakly label the sLn (Figure 2Cc3). On E19.5 (Figure 2D), Nurr1 staining becomes more differentiated, with the vCL and dCL subdivisions visible (Figure 2Dd2). The gap between the brain surface and the CL, DEn, and pDEn keeps widening. In intermediate sections, the dLn shows first staining, and in posterior sections the sLn shows stronger Nurr1 expression (Figures 2Dd2,d3). On E20.5 (Figure 2E), all sub-regions that we defined based on Nurr1 expression in P0 brains are readily apparent (Figures 2Ee1–e3). In summary (Figure 2F), on E13.5 Nurr1 first shows weak expression in a relatively ventral position. A major change occurs from E13.5 to E15.5, when Nurr1 shows stronger expression in an elongated stripe from anterior to posterior and subdivisions of different staining intensity become visible. In the sLn, Nurr1 shows weak expressions on E17.5 and increased expression on E19.5. On E20.5, Nurr1 strongly labels all claustrum sub-regions.
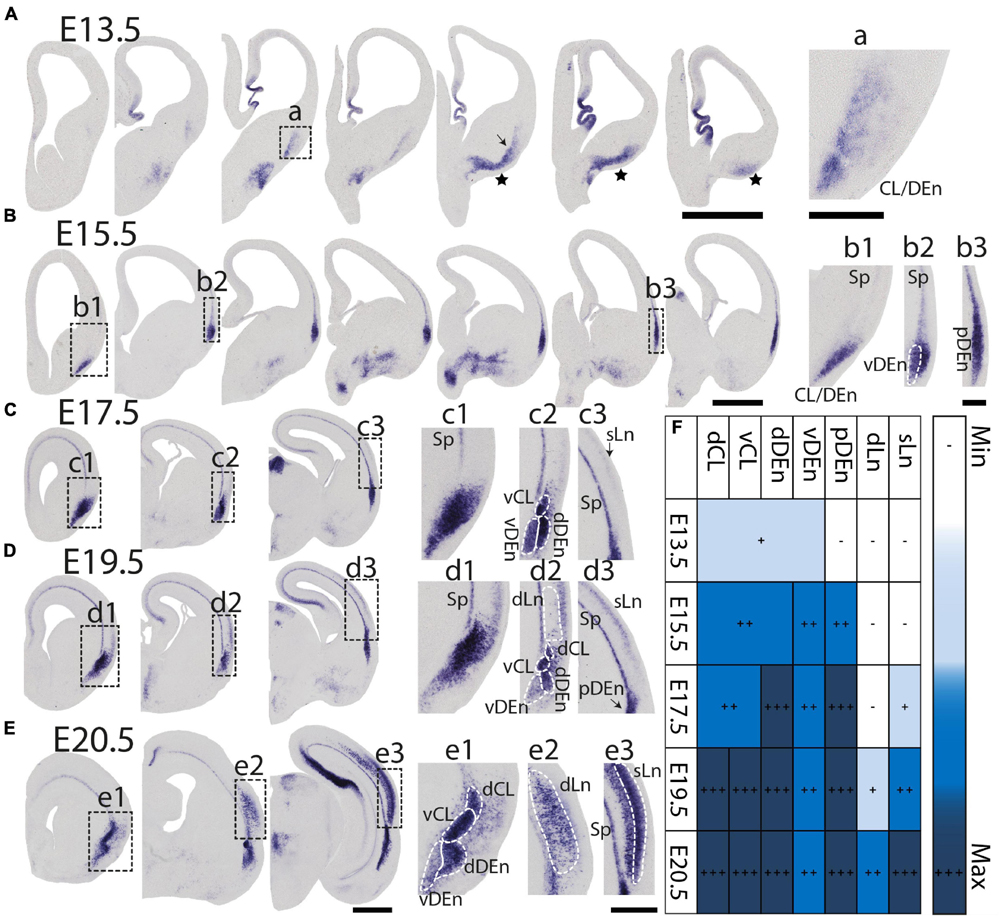
Figure 2. Prenatal development of Nurr1 expression. Nurr1 expression on E13.5 (A), on E15.5 (B), on E17.5 (C), on E19.5 (D) and on E20.5 (E). High magnification Nurr1 labeled regions from E13.5 to E20.5 (a–e), including the CL/DEn on E13.5, the Sp, vDEn, and pDEn on E15.5, the sLn on E17.5, the dLn, vDEn, dDEn, vCL and dCL on E19.5, and all sub-regions on E20.5. (F) Table of prenatal development of Nurr1 expression. White and “–” indicate no expression, light blue and “ + ” indicate beginning Nurr1 expression, higher expression is shown in darker color and more “ + ” signs. N = 2 rats for each date. Scale bars in panels (A–E) = 1 mm. Scale bars in panels (a–b) = 200 μm. Scale bars in panels (c–e) = 500 μm.
Postnatal Nurr1 Expression in the Lateral Forebrain
During early postnatal development Nurr1 expression in the claustrum and adjacent nuclei remains largely unchanged from its pattern at birth (Figure 1E). However, Nurr1 expression in the posterior cortex changes dramatically during early postnatal development (Figure 3A). Nurr1 expression in the sLn is greatly reduced from P2 to P20 (Figure 3B). On P2, Nurr1 has the strongest expression in superficial layers, while on P20, there is almost no Nurr1 expression in that region (Figure 3C). At birth, Nurr1 expression in dLn neurons shows some distance from the Sp, while on P20, Nurr1 expression in dLn is closer to the Sp (Figure 3C). We also note the approximately 3-fold expansion in cortical thickness taking place from P0 to P20 (see scale bars in Figure 3C). In summary, Nurr1 expression in the sLn differs from other Nurr1 positive populations we describe, in that its expression level is greatly reduced during early postnatal development (Figure 3D). Further, dLn neurons differ from other Nurr1 positive neurons in changing their apparent laminar position during early postnatal development. Around birth, they are located mostly in the upper half of the cortex, intermingled with sLn cells, while on P20 they are located in the deep layers of lateral cortical regions. We did not observe major changes in Nurr1 expression patterns after P20.
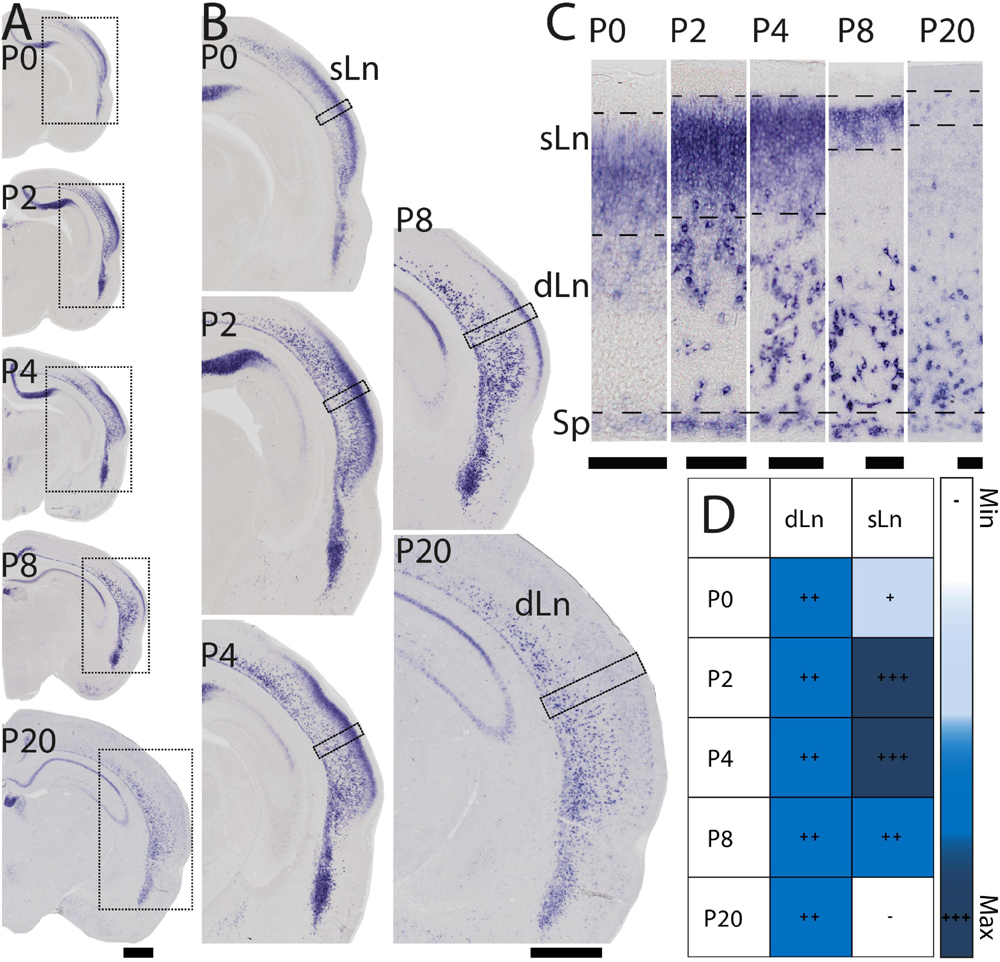
Figure 3. Early postnatal development of Nurr1 expression in posterior cortical regions. (A) Nurr1 expression on P0, P2, P4, P8, and P20. (B) Higher magnification Nurr1 labeled regions from P0 to P20. (C) Higher magnification images of the columns indicated by black squares in panel (B) showing dLn and sLn from P0 to P20. (D) Table of early postnatal development of Nurr1 expression in sLn. White and “–” indicate no expression, light blue and “ + ” indicate little expression, higher expression is shown in darker color and more “ + ” signs. N = 2 rats for each date. Scale bar in panels (A,B) = 1 mm. Scale bar in panel (C) = 100 μm.
Birth Dating of Nurr1 Positive Cells in the Lateral Forebrain
For each EdU injection date from E12.5 to E17.5, we selected 6 sections at comparable distances from anterior to posterior to show the EdU expression patterns combined with Nurr1 in situ hybridization and DAPI staining (Figures 4–9). High resolution images can be accessed here: https://figshare.com/s/9e8fc7cc66be7d9e968b. We briefly describe EdU labeling in selected regions for each injection day, while a more detailed description of EdU and Nurr1 co-labeling follows afterward. EdU injections on E12.5 (Figure 4) reveal mainly signals in the piriform cortex (Pir), intermediate endopiriform nucleus (IEn), anterior cortical amygdaloid area (ACo), basomedial amygdaloid nucleus, anterior part (BMA), medial amygdaloid nucleus (Me), medial amygdaloid nucleus, posteroventral part (MePV). Apparently, there are also some labeled cells in the incipient Sp at E12.5. Following EdU injections on E13.5 (Figure 5) we find additional EdU signals in the claustrum (CL), dorsal endopiriform nucleus (DEn), insular cortex (Ins), Sp, basomedial amygdaloid nucleus (BM), medial amygdaloid nucleus, posterodorsal part (MePD), basomedial amygdaloid nucleus, posterior part (BMP), amygdalohippocampal area, posterolateral (AHiPL), and posteromedial cortical amygdaloid area (PMCo). Following EdU injections on E14.5 (Figure 6) we find reduced EdU signal in the IEn, ACo, Me, and MePV. In addition EdU signals are visible in deep layers of secondary somatosensory cortex (S2), basolateral amygdaloid nucleus, anterior part (BLA) and the basolateral amygdaloid nucleus, posterior part (BLP). EdU injections on E15.5 (Figure 7) show reduced EdU in the DEn, deep layers of Ins, medial and posterior Pir, and the lateral part of Sp. In addition, EdU signals are visible in the superficial layers of Ins, intermediate layers of S2, secondary auditory cortex, dorsal area (AuD), and primary visual cortex (V1). Following EdU injections on E16.5 (Figure 8), EdU signals are reduced in the CL, superficial layers of Ins, intermediate layers of S2, and the dorsal part of Sp. In addition EdU signals are visible in superficial layers of AuD, V1. EdU injections on E17.5 (Figure 9) show reduced EdU signals in superficial layers of AuD but still show signals in the superficial layers of V1.
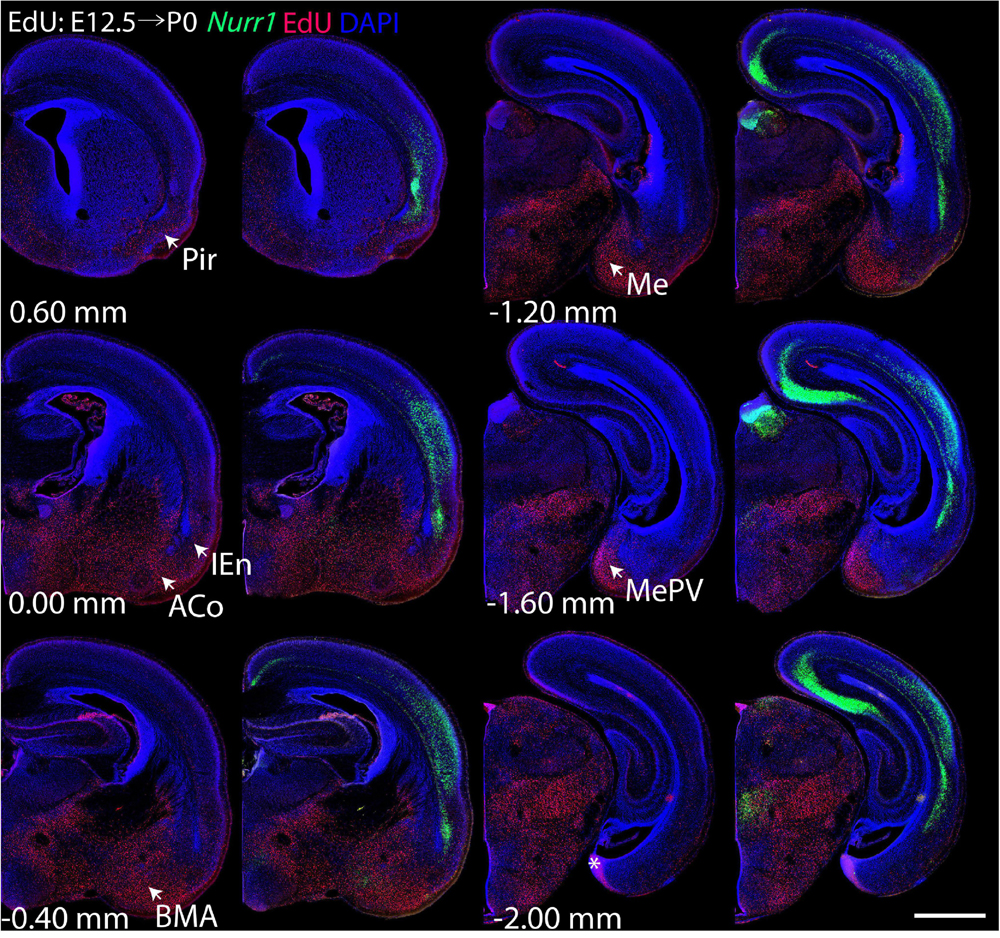
Figure 4. Overview of EdU labeling on E12.5 with Nurr1 FISH on P0. White arrows indicate EdU labeled regions. Pir, piriform cortex, IEn, intermediate endopiriform nucleus, ACo, anterior cortical amygdaloid area, BMA, basomedial amygdaloid nucleus, anterior part, Me, medial amygdaloid nucleus, MePV, medial amygdaloid nucleus, posteroventral part. Numbers below sections indicate the bregma coordinate. N = 3 rats. “∗” indicates staining artifacts. Scale bar = 1 mm.
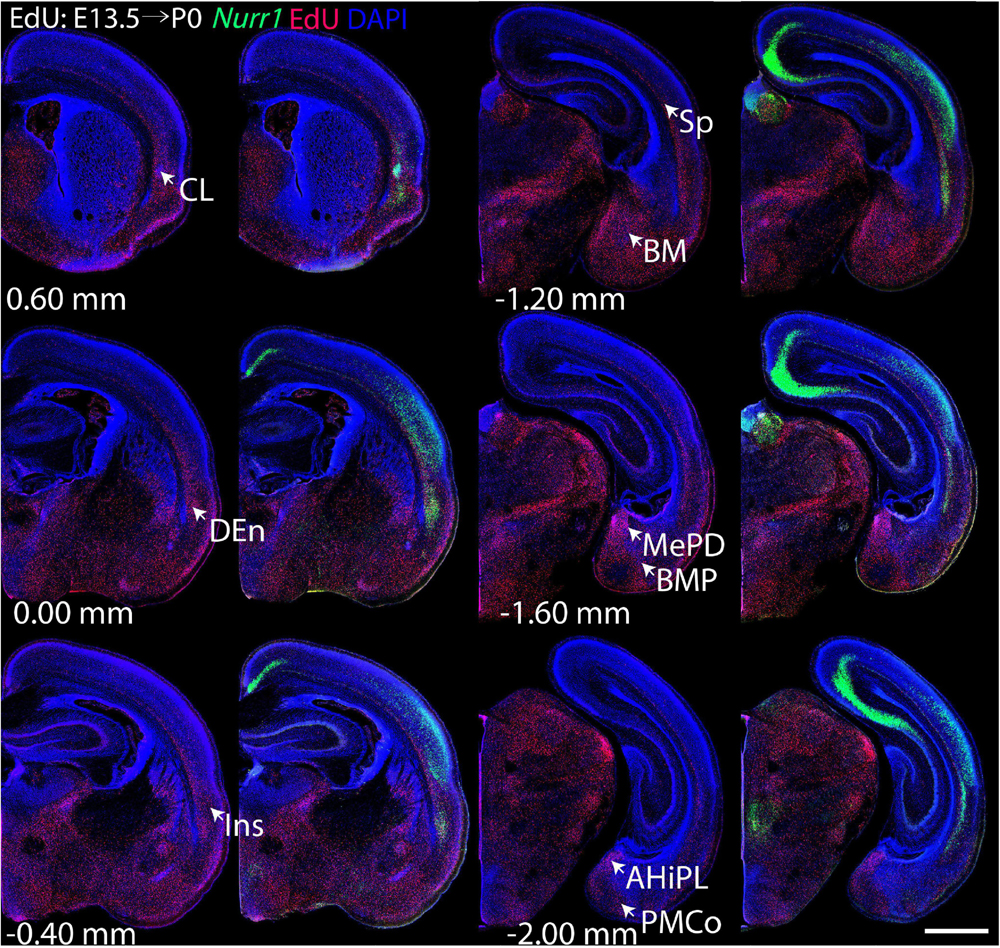
Figure 5. Overview of EdU labeling on E13.5 with Nurr1 FISH on P0. White arrows indicate the EdU labeled regions. CL, claustrum, DEn, dorsal endopiriform nucleus, Ins, insular cortex, Sp, subplate, BM, basomedial amygdaloid nucleus, MePD, medial amygdaloid nucleus, posterodorsal part, BMP, basomedial amygdaloid nucleus, posterior part, AHiPL, amygdalohippocampal area, posterolateral, PMCo, posteromedial cortical amygdaloid area. Numbers below sections indicate the bregma coordinate. N = 3 rats. Scale bar = 1 mm.
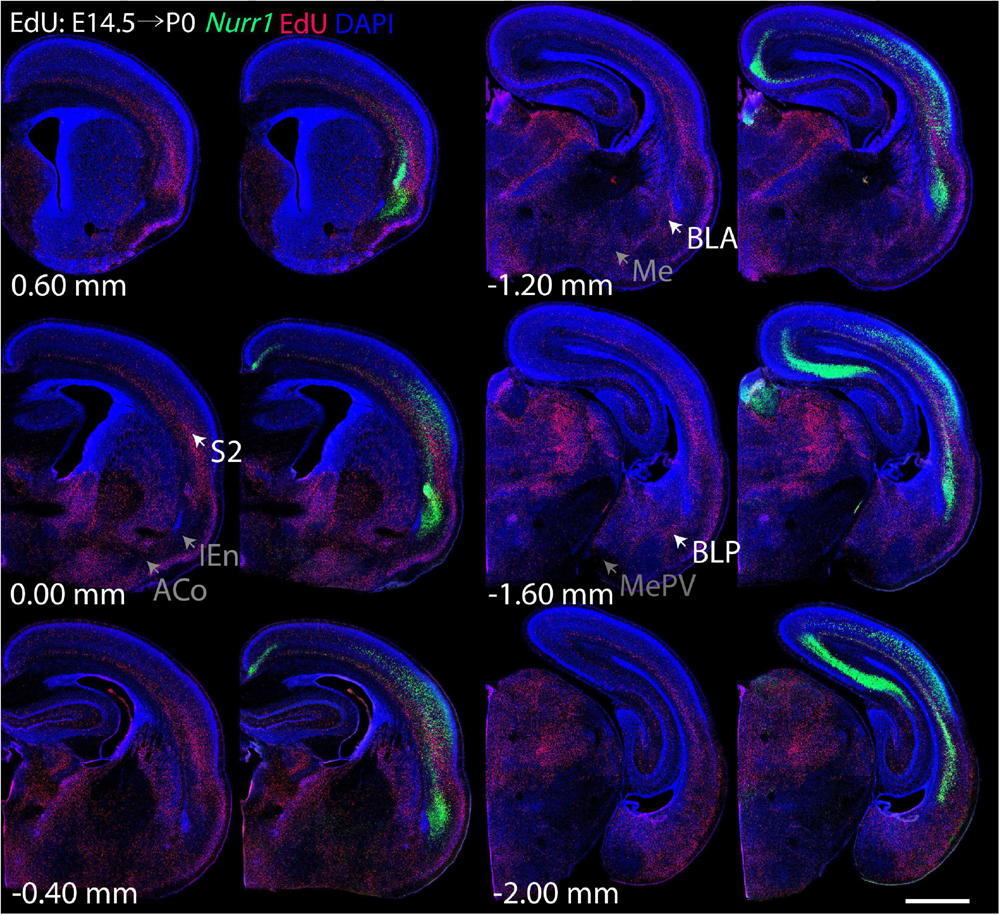
Figure 6. Overview of EdU labeling on E14.5 with Nurr1 FISH on P0. White arrows indicate the EdU labeled regions. Gray arrows indicate the regions with reduced EdU labeling. S2, secondary somatosensory cortex, BLA basolateral amygdaloid nucleus, anterior part, BLP basolateral amygdaloid nucleus, posterior part, IEn, intermediate endopiriform nucleus, ACo anterior cortical amygdaloid area, Me, medial amygdaloid nucleus, MePV, medial amygdaloid nucleus, posteroventral part. Numbers below sections indicate the bregma coordinate. N = 3 rats. Scale bar = 1 mm.
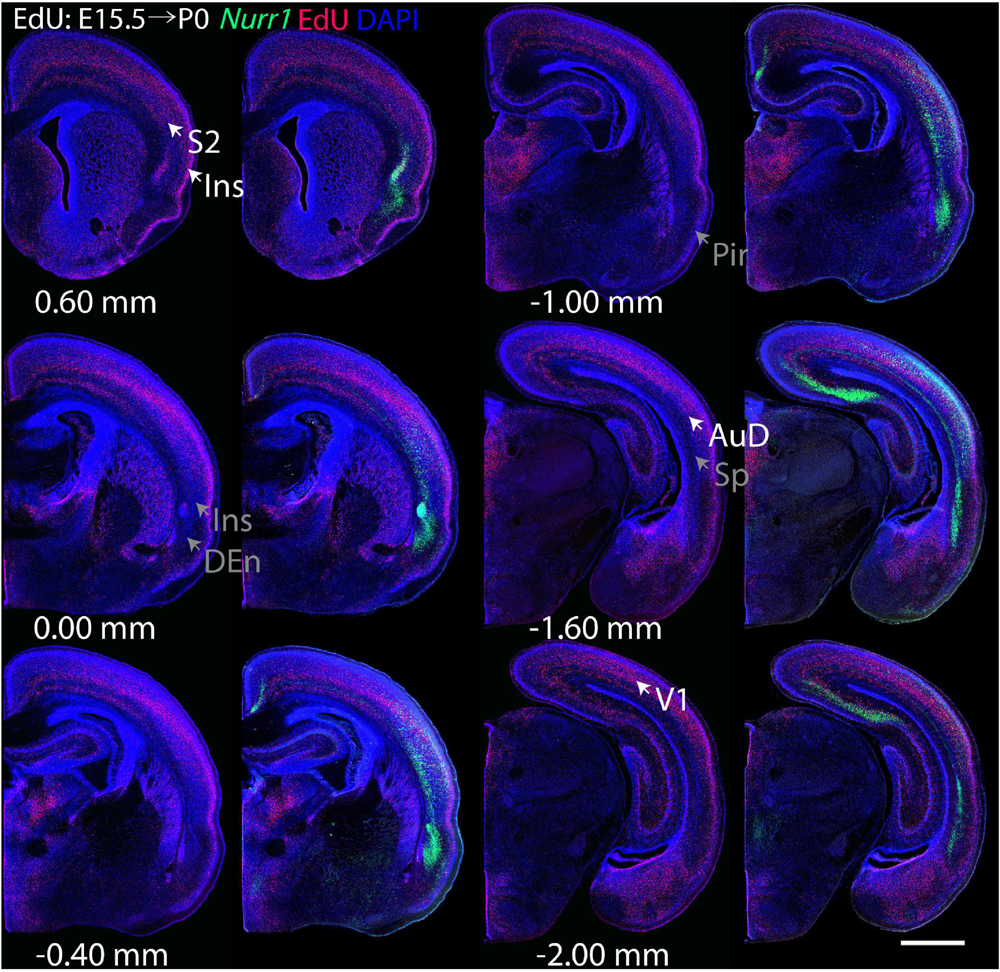
Figure 7. Overview of EdU labeling on E15.5 with Nurr1 FISH on P0. White arrows indicate the EdU labeled regions. Gray arrows indicate the regions with reduced EdU labeling. S2, secondary somatosensory cortex, AuD secondary auditory cortex, V1 primary visual cortex dorsal area, DEn, dorsal endopiriform nucleus, Ins, insular cortex, Pir, piriform cortex, Sp, subplate. Numbers below sections indicate the bregma coordinate. N = 3 rats. Scale bar = 1 mm.
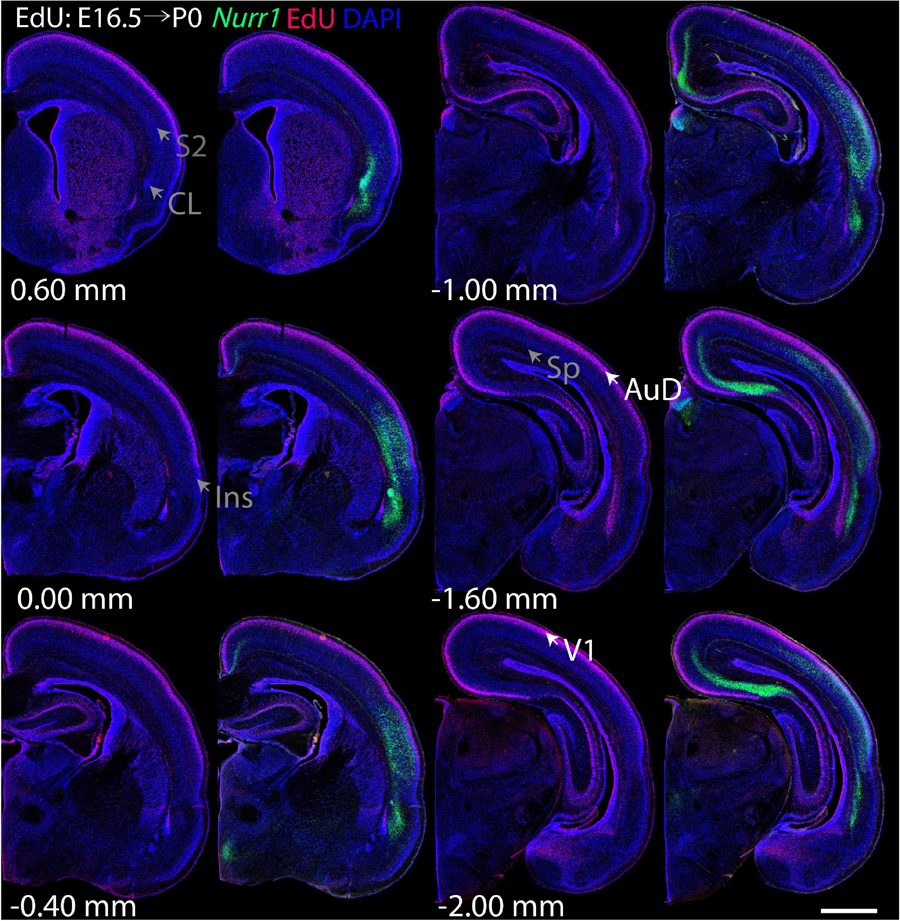
Figure 8. Overview of EdU labeling on E16.5 with Nurr1 FISH on P0. White arrows indicate the EdU labeled regions. Gray arrows indicate the regions with reduced EdU labeling. AuD secondary auditory cortex, V1, primary visual cortex dorsal area, S2, secondary somatosensory cortex, CL, claustrum, Ins, insular cortex, Sp, subplate. Numbers below sections indicate the bregma coordinate. N = 3 rats. Scale bar = 1 mm.
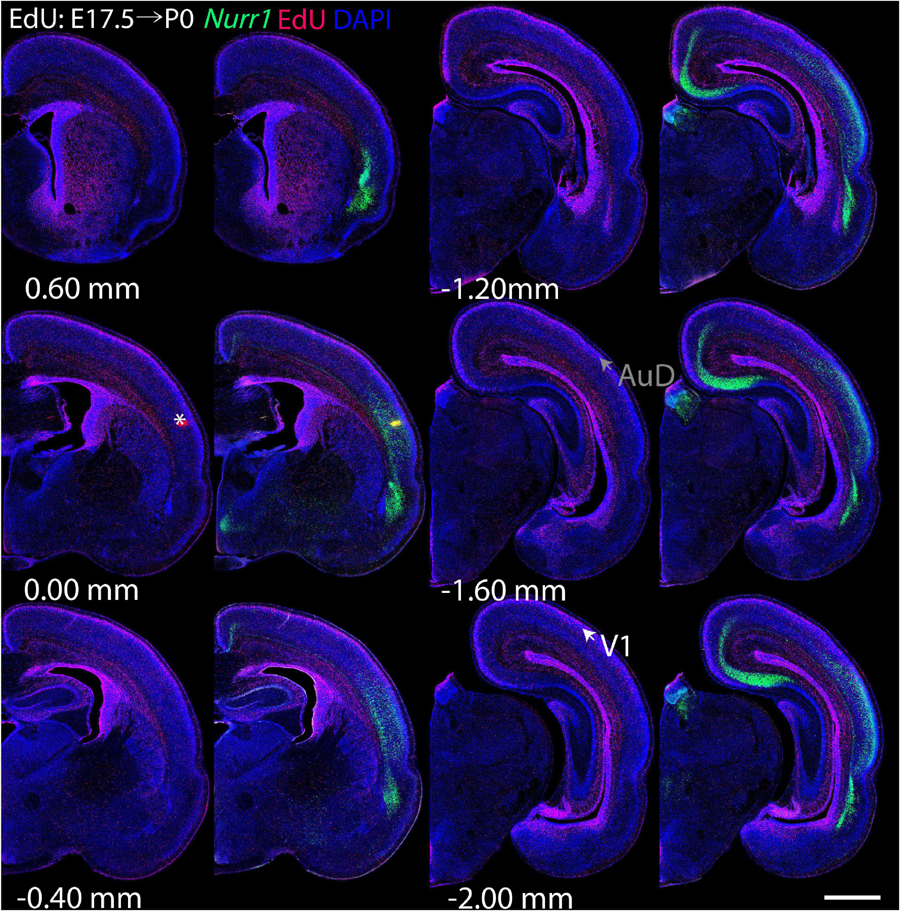
Figure 9. Overview of EdU labeling on E17.5 with Nurr1 FISH on P0. White arrows indicate the EdU labeled regions. Gray arrows indicate the regions with reduced EdU labeling. AuD secondary auditory cortex, V1, primary visual cortex dorsal area. “∗” indicates staining artifacts. Numbers below sections indicate the bregma coordinate. N = 3 rats. Scale bar = 1 mm.
Gradients of Neurogenesis in the Claustrum and Dorsal Endopiriform Nucleus
To study the birth dates of Nurr1 positive neurons, we first describe EdU signals at the level of subregions, focusing first on dCL, vCL, dDEn, vDEn (Figure 10). On E12.5 (Figure 10A), we find few EdU signals in the vDEn, dDEn, vCL, and dCL. On E13.5 (Figure 10B), we find greatly increased EdU signals in the dDEn and vDEn, with some signals in the vCL and dCL. We find that the ventral part of the vCL shows more EdU signals than its dorsal part. On E14.5 (Figure 10C), vCL shows more EdU signal, and more EdU is visible in the dCL. In addition, there are more EdU signals in the dorsal part of the dDEn than in its ventral part. On E15.5 (Figure 10D), vCL is still densely labeled with EdU signals, but with more EdU signals in the dorsal part than its ventral part. The dCL still has some EdU signal, but there is less EdU in the vDEn and dDEn. A small region located medial of the DEn known as the reservoir (Bayer and Altman, 1991), paraclaustral reservoir (Maciejewska et al., 1999), or bed nucleus of the external capsule/BEC (Puelles, 2014; Puelles et al., 2016b) shows dense EdU labeling in its ventral part but does not express Nurr1. On E16.5 (Figure 10E) and E17.5 (Figure 10F), few EdU signals are visible in the claustrum sub-regions, but the paraclaustral reservoir/BEC is densely labeled with EdU in its dorsal part (Figures 10E,F). In summary, EdU signals first appear in the vDEn and dDEn on E12.5, first in the vCL and dCL on E13.5, first in the paraclaustral reservoir/BEC on E15.5 (Figure 10G). In Figure 10H, we summarize the ventral to dorsal gradients in birth dating. vDEn neurons are mainly born on E13.5 and dDEn neurons are mainly born on E13.5 to E14.5, then most vCL and dCL neurons are sequentially born on E14.5 to E15.5, and paraclaustral reservoir neurons are born on E15.5 to E17.5.
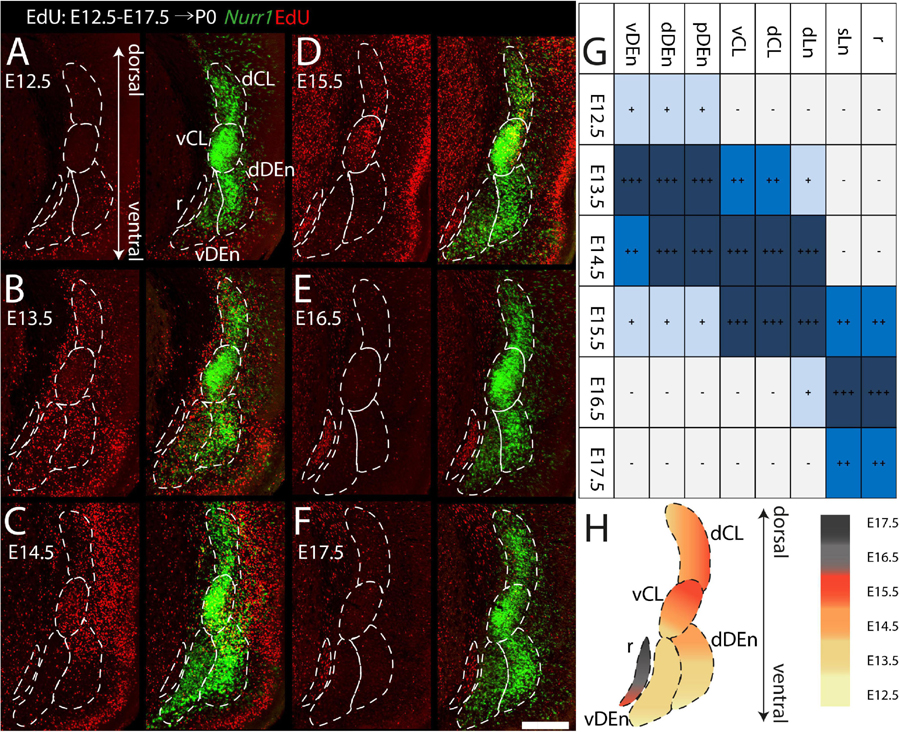
Figure 10. Gradients of neurogenesis in the anterior Nurr1 labeled claustrum and its related regions. High magnification Nurr1 labeled anterior claustrum regions, including dCL, vCL, dDEn, vDEn, with EdU labeling on E12.5 (A), on E13.5 (B), on E14.5 (C), on E15.5 (D), on E16.5 (E), on E17.5 (F). (G) Block diagram for EdU labeling signal in claustrum and its related regions from E12.5 to E17.5. White and “–” mean minimal signal, light blue and “ + ” indicate low EdU signal, stronger EdU signal is shown in darker color and more “ + ” signs. (H) Schematic diagram of E12.5 to E17.5 EdU labeling anterior claustrum regions. EdU signals in different regions from E12.5 to E17.5 shown as indicated by the color bar. Scale bar in panel (A) = 300 μm.
For the remaining Nurr1 positive regions (dLn, sLn, pDEn), we study more posterior sections (Figure 11). On E14.5, we notice EdU signals mainly in the ventral parts of dLn (Figures 11Aa1,a2). On E15.5, we find EdU signals mainly in the dorsal superficial layer parts of dLn (Figures 11Aa3,a4). On E16.5, few EdU signals are in the dLn (Figures 11Aa5,a6). On E15.5, EdU signals are mainly in the ventral parts of sLn (Figures 11Bb1,b2). On E16.5 and E17.5, we observe EdU signals mainly in the dorsal parts of sLn (Figures 11Bb3–b6). On E12.5, there is little EdU signal in the pDEn. However, on E13.5 and E14.5, the pDEn is densely labeled with EdU (Figure 11C). In summary, EdU signals appear in the dLn mainly on E14.5 and E15.5, in the sLn mainly on E15.5 to E17.5, in the pDEn mainly on E13.5 and E14.5 (Figures 10G, 11D). However, we note that both dLn and sLn are intermingled with other Nurr1 negative cortical neurons, therefore, we proceed to directly quantify Nurr1 overlap with EdU.
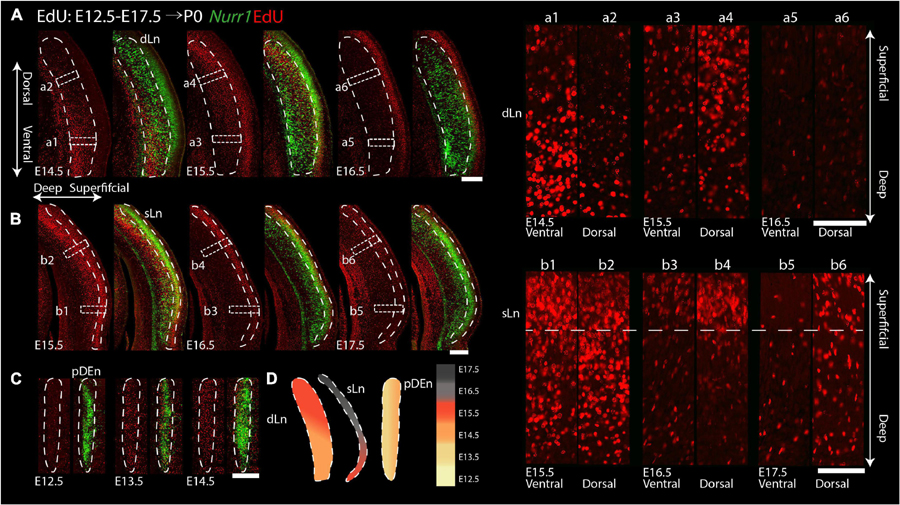
Figure 11. Gradients of neurogenesis in the intermediate and posterior Nurr1 labeled claustrum related regions. High magnification Nurr1 labeled posterior claustrum related regions with E12.5 to E17.5 EdU labeling in the dLn (A), sLn (B), and pDEn (C). Array of crop sections of dLn (a1–a6) and sLn (b1–b6). (D) Schematic diagram of posterior claustrum regions. EdU signals in different regions from E12.5 to E17.5 shown as indicated by the color bar. Scale bar in panel (A–C) = 300 um. Scale bar in panel (a1–b6) = 100 um.
We quantified the fraction of Nurr1 + neurons at P0 that were born on a particular embryonic day (Figure 12), by determining how many of the Nurr1 + neurons (green) co-localized (Nurr1 + EdU +) with EdU + neurons (red). In the vDEn, we find the largest fraction of Nurr1 + EdU + cells on E13.5 (57% ± 6.9). In the dDEn, most Nurr1 + EdU + cells are born on E13.5 and E14.5 (42% ± 6.3, 41% ± 4.5). Similarly, in the pDEn, most Nurr1 + EdU + cells appear on E13.5 and E14.5 (43% ± 5.8, 44% ± 4.4). In the vCL, most Nurr1 + EdU + cells are born on E14.5 and E15.5 (39% ± 2.5, 36% ± 2.5). Likewise, in the dCL, we find the largest fraction of Nurr1 + EdU + cells on E14.5 and E15.5 (36% ± 2.1, 35% ± 2.2). Also, in the dLn, we find most Nurr1 + EdU + cells on E14.5 and E15.5 (33% ± 2.2, 37% ± 2.9). In the sLn, most Nurr1 + EdU + cells show on E16.5 and E17.5 (44% ± 6.2, 34% ± 2.7) (Figure 12B). In summary, we find that all regions show double positive cells on more than one day. Most vDEn neurons are born by E13.5, followed by dDEn and pDEn on E13.5 to E14.5, vCL, dCL, and dLn on E14.5 to E15.5, and sLn on E15.5 to E17.5. Based on the birth dates of the sub-regions above, we find dDEn is most similar to pDEn, while vCL, dCL, and dLn are also similar. In contrast, vDEn and sLn show distinct neurogenetic patterns.
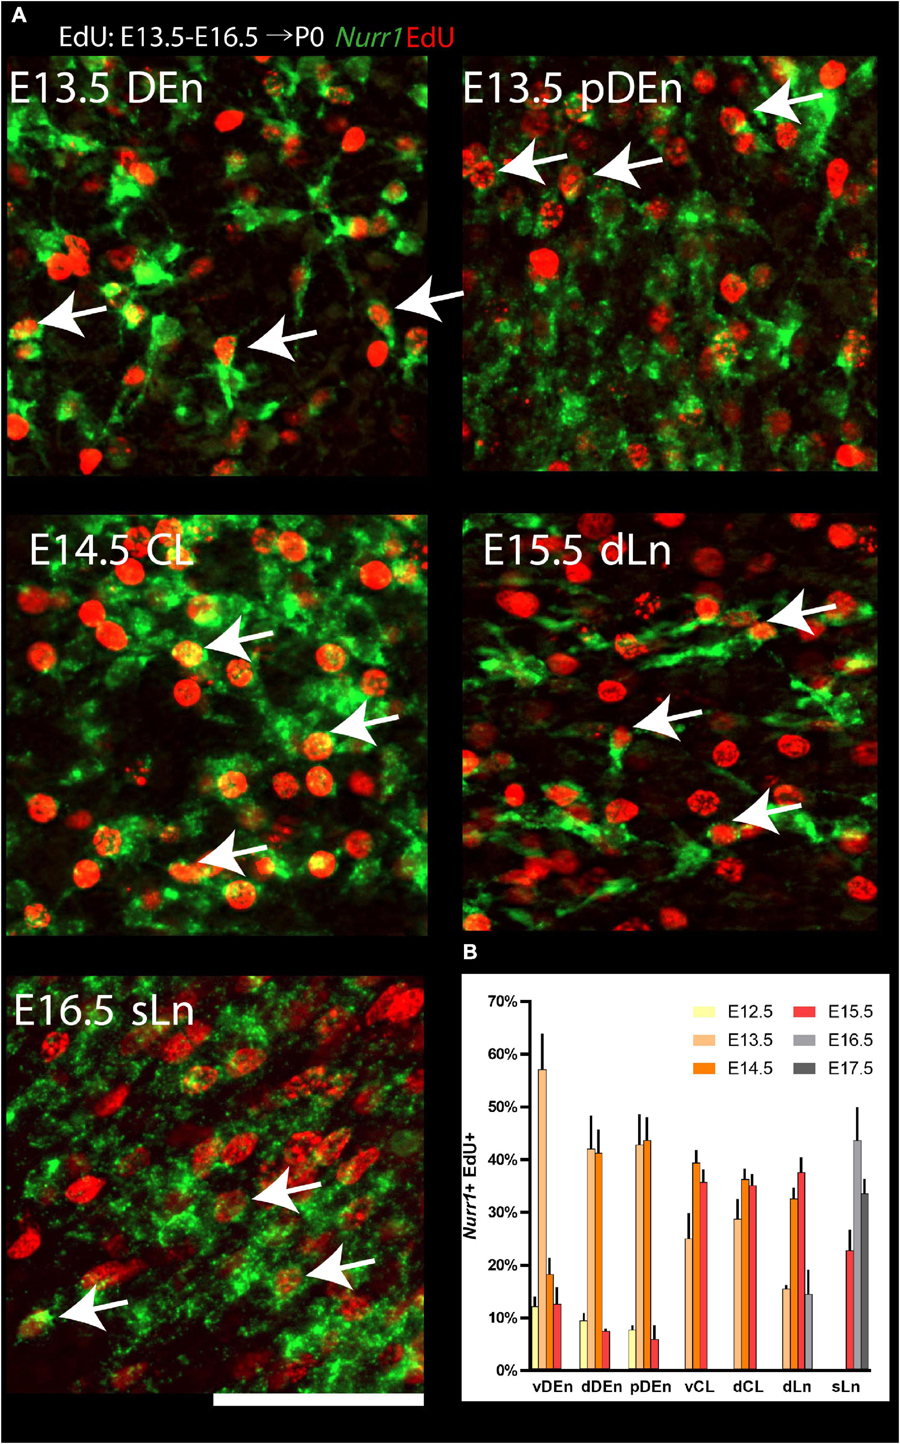
Figure 12. Quantification of Nurr1 + EdU + double positive cells. (A) Examples of cell level overlapping of Nurr1 and EdU in all Nurr1 labeled claustrum regions, including DEn, pDEn, CL, dLn and sLn. (B) Quantification of Nurr1 + EdU + populations born at E12.5 to E17.5 in Nurr1 labeled regions including, dDEn, vDEn, pDEn, vCL, dCL, dLn, and sLn. Bars represent mean ± standard deviation. N = 3 brains for each date (3 sections from each brain). Scale bar in panel (A) = 100 μm.
To investigate anterior to posterior differences in birth dates of CL and Den, we show four comparable sections with injections between E13.5 and E15.5 (Figure 13). We focus on CL and DEn, since further subdivisions are not easy to define consistently at all anterior posterior levels. On E13.5, we find less EdU signals in vCL anteriorly, but more EdU signals in DEn posteriorly. On E14.5, we find that vCL is densely labeled with EdU except in the most anterior section. We also observe decreased EdU signals in the ventral part of DEn. On E15.5, we find decreased EdU signals in the ventral part of vCL, and also decreased EdU signals in the dorsal part of DEn (Figure 13A). In summary, EdU signals appear in the posterior DEn mainly on E13.5 and E14.5, but in the anterior DEn mainly on E13.5, E14.5 and E15.5. EdU labels the posterior CL mainly on E14.5, but the anterior CL mainly on E14.5 and E15.5 (Figure 13B).
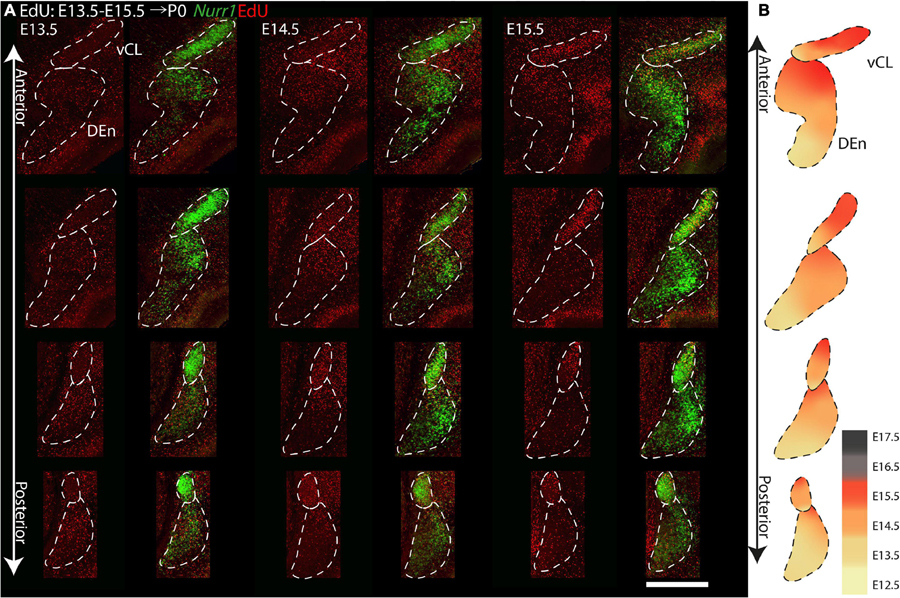
Figure 13. Gradients of neurogenesis in the Nurr1 labeled CL and DEn from anterior to posterior. (A) High magnification Nurr1 labeled posterior claustrum related regions, including CL and DEn with E13.5 to E15.5 EdU labeling. (B) Schematic diagram of the CL and DEn. EdU signals in different regions from E12.5 to E17.5 shown as indicated by the color bar. Scale bar in panel (A) = 0.5 mm.
Discussion
To understand the cell types, structure, and function of the claustrum, and its changes in brain disorders it is critical to study the development of claustrum. Understanding the sequence of birth dates of specific types of neurons is a key aspect of neural development, but studies of claustrum birth dates have led to conflicting results (reviewed in Puelles, 2014; Bruguier et al., 2020). In addition, recent models of claustrum development and transcriptomic studies of cortical cell types indicate that neurons expressing claustrum-specific gene signatures are widely distributed within the cortex (Arimatsu, 1994; Puelles, 2014; Zeisel et al., 2015; Rosenberg et al., 2018; Yao et al., 2021), yet little is known about the development, connectivity, and function of these cortical claustrum-like cell types. This suggests several interesting questions about the development of the claustrum and other claustrum-like neurons: (i) When are these transcriptionally similar neurons generated? (ii) How do they come to be distributed so widely throughout the cerebral cortex? (iii) In which part of the developing forebrain do they originate? We first briefly summarize our findings and then in turn discuss the expression of Nurr1 in the developing pallium, previous birth dating studies of claustrum neurons, and neurogenetic gradients in the claustrum complex.
In this study, we investigated the expression of Nurr1 in combination with EdU labeling to map the development and birth dates of the claustrum and Nurr1 positive neurons in the lateral cortex in brain development. The function of Nurr1 and its role in development of dopaminergic neurons has been studied in detail (Zetterström et al., 1997; Sakurada et al., 1999; Hermanson et al., 2003; Eells et al., 2006). Interestingly, a recent study has found that in the medial pallium Nurr1 is repressed by Satb2 and promotes subiculum identity in the absence of Satb2 (Zhang et al., 2020). However, so far little is known about the role of Nurr1 expression in claustrum development. We took advantage of the early and stable expression of Nurr1 throughout brain development to study the prenatal and postnatal ontogenetic profile of claustrum neurons. We find that Nurr1-labeled claustral sub-regions emerge gradually in prenatal development. We observe the first Nurr1 staining in the prospective area of CL/DEn on E13.5 and first distinguish the ventral subdivision of the DEn by its lighter staining on E15.5. The first separation of the vDEn, dDEn and CL, and first staining of the sLn become visible on E17.5. The first clear division of dCL and vCL is apparent and first staining of the dLn on E19.5, and all sub-regions show distinct staining on E20.5 (Figure 2). We also notice the remarkable change of Nurr1 expression in the cortex in early postnatal development. In sLn, Nurr1 expression is reduced significantly from P2 to P20. In dLn, we observe Nurr1 expression distantly from the subplate on P0 and closer to the subplate on P20 (Figure 3). Aside from the reduction in Nurr1 expression in the sLn compartment, the overall expression pattern of Nurr1 studied here remains essentially stable in postnatal development, although there is some evidence for a gradual reduction of Nurr1 expression intensity (Crispino et al., 1998). Very little is known about the functional role Nurr1 expression in the adult brain. In the hippocampus Nurr1 expression levels may affect long-term memory function (Peña de Ortiz et al., 2000; Colón-Cesario et al., 2006) and Alzheimer’s disease pathology (Moon et al., 2015, 2019). It has been suggested that Nurr1 expression may be influenced by behavioral and sensory stimuli (Biegler et al., 2021). However, supporting evidence in the mammalian brain, particularly in the claustrum, remains scarce. Even high levels of neuronal activity induced by epileptic seizures did not lead to significant changes of Nurr1 expression in the early postnatal rat brain (Crispino et al., 1998). In later postnatal stages and in adult animals seizure induced changes in Nurr1 expression levels were mainly detected in the hippocampus (Xing et al., 1997; Crispino et al., 1998; Kummari et al., 2021). Clearly, further studies are needed to understand the relation of neuronal activity and Nurr1 expression in the mammalian forebrain. By using EdU labeling, we detect dividing neurons in combination with Nurr1 FISH (Figures 4–9). We find that most Nurr1 positive neurons in the vDEn are born on E13.5, in the dDEn and pDEn mainly on E13.5 and E14.5, in the vCL and dCL mainly on E14.5 and E15.5, in the dLn mainly on E14.5 and E15.5, and in the sLn mainly on E15.5, E16.5 and E17.5 (Figures 10, 12). Finally, we identify ventral to dorsal and posterior to anterior gradients of birth dates in subregions including the vCL and DEn (Figures 10, 11, 13).
Nurr1 Expression in the Developing Forebrain
In the claustrum, Nurr1 expression has been reported in the prospective primordium of claustrum in the superficial part of lateral pallium as early as E12.5 in mice (Puelles, 2014). Rat embryonic brain development is thought to attain a comparable state about one to two days later than in mice (Schneider and Norton, 1979; Clancy et al., 2001). Consequently, we find the first Nurr1 staining in the lateral forebrain on E13.5. However, we note that Nurr1 staining on E13.5 in the rat shows some distance to the surface of pallium, with its ventral part relatively closer to the pallium surface than its dorsal parts (Figure 2Aa). Interestingly, while the prospective claustrum neurons remain relatively weakly stained at this time point, we find that there is a more strongly stained posterior-ventral Nurr1 positive region. By following a series of coronal sections (Figure 2A), or on sections cut parallel to the surface (Figure 14A), we find that both Nurr1 positive regions appear to be continuous.
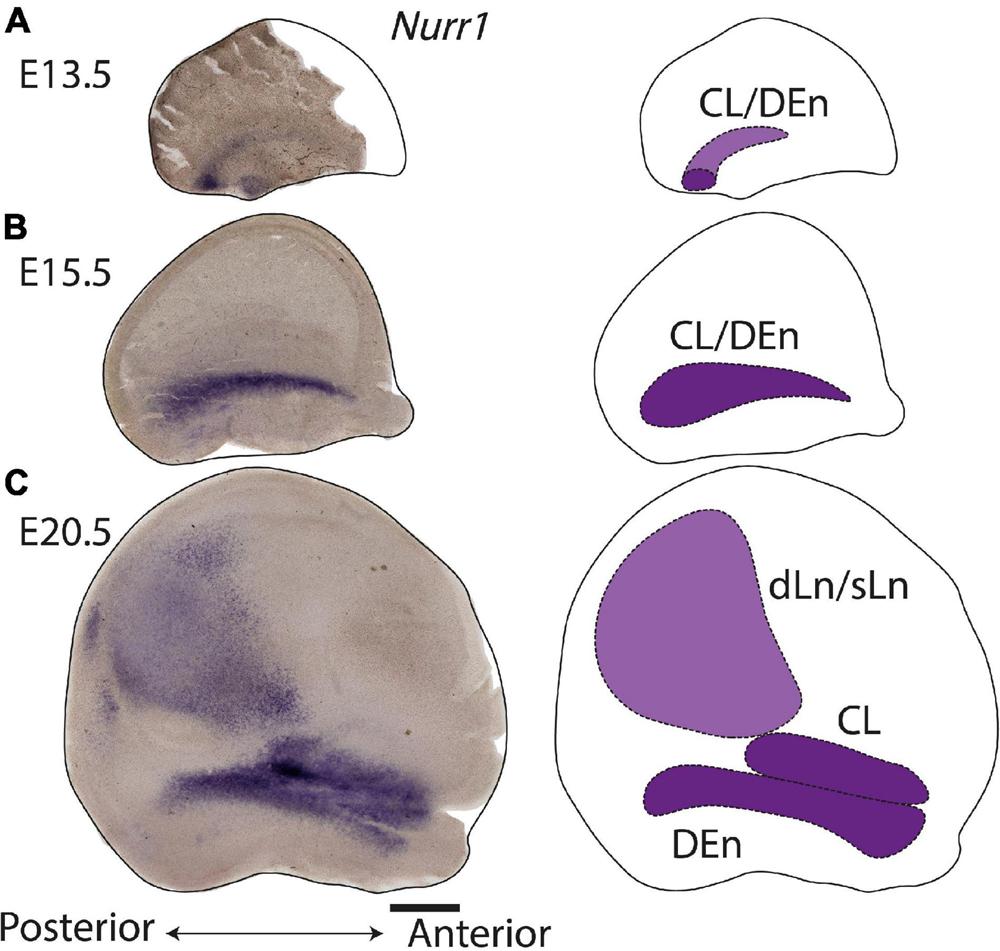
Figure 14. Overview of claustrum development. Flattened cortex and schematic diagram of Nurr1 expression by in situ in E13.5 (A), E15.5 (B), and E20.5 (C). One hemisphere was flattened and sectioned into 100 μm sections. Multiple sections were overlayed in panels (B,C). Scale bar in panel (A) = 1 mm.
While Puelles (2014) proposed that Nurr1 positive claustrum neurons are generated in the lateral pallium, a recent study by Moreau et al. (2021) finds that in the mouse on E12.5 Nurr1 positive neurons are located in the ventral pallium. One possibility is that these cells are unrelated to claustrum neurons and reduce their Nurr1 expression over time. However, if they are related to claustrum neurons, their appearance in different sectors of the pallium remains unexplained (Moreau et al., 2021). Cell lineage analysis supports the former view, suggesting that claustrum and endopiriform neurons are indeed generated in the lateral pallium (Garcia-Moreno et al., 2018; Rueda-Alaña et al., 2018; Bruguier et al., 2020). By E15.5, the majority of Nurr1 staining has congregated in a lateral stripe in the prospective CL/DEn region (Figures 2B, 14B). Little staining remains visible in the previously strongly labeled posterior-ventral parts of the pallium, indicating either loss of Nurr1 expression, or depletion of Nurr1 positive neurons in that region (Figures 2B, 14B). Consistent with the results of Puelles (2014), we find that over the next days of embryonic development the formerly uniform elongated Nurr1 positive region differentiates into multiple subdivisions (Figures 2B–D). Among those, the earliest visible subdivision is based on the light and dark staining of Nurr1 in the DEn, dividing it into ventral and dorsal parts (vDEn and dDEn, Figure 2Bb2). This segmentation of the DEn can also be observed in adult animals by using additional markers including Lxn, Ntng2, and Oprk1, which are enriched in dDEn, and Cpne4, Pcp4, and Npsr1, which are enriched in vDEn (Arimatsu, 1994; Naumann et al., in preparation). The molecular characterization of cell types in the endopiriform nucleus remains largely unexplored (Smith et al., 2019). However, identifying mouse lines with specific expression in subsets of DEn neurons (Riedemann et al., 2019) will enable elucidating their development, connectivity, and function.
In more dorsal parts of cortex, Nurr1 positive sLn neurons first appear faintly on E17.5 (Figure 2Cc3), while dLn neurons first become visible somewhat later, on E19.5 (Figure 2Dd2), comparable to descriptions of dLn in the mouse (Puelles, 2014; Ratié et al., 2020). By E20.5, both sLn and dLn neurons are found in a broad region throughout the posterior dorsal cortex (Figures 2E, 14C). Interestingly, sLn and dLn neurons show a sharply divergent postnatal development (Figure 3). In the sLn region, Nurr1 expression is strongly reduced over the first 10 days of postnatal development and essentially absent by P20. In contrast, dLn neurons become more strongly stained and appear to settle in deeper layers. This observation may be explained by a coordinated pattern of up - and down-regulation of Nurr1 expression involving multiple neuronal populations at different distances from the subplate during early postnatal development. An alternative explanation for such coordinated changes in Nurr1 expression was suggested by Li et al. (2011). Using antibodies against Nurr1, they observed similar changes in staining patterns in the cortex and embryonic spinal cord, interpreting the latter as evidence for neuronal migration. Interestingly, Nurr1 may have a role in neuronal migration during the development of midbrain neurons (Wallén et al., 1999), however, no evidence for such a function is available for Nurr1 in forebrain neurons. In addition, we note that, while the generation of the laminar pattern of cortical neurons is essentially complete before birth (Figures 1C,D), cortical thickness around dLn neurons expands 3-fold (Figure 3C), similar to other cortical regions (Bandeira et al., 2009; Ray and Brecht, 2016). This expansion of cortical thickness may confound the analysis of laminar position of dLn neurons. As pointed out previously, direct evidence for any of these migratory patterns is lacking (Bruguier et al., 2020), and further cell lineage tracing studies are necessary to understand the changing patterns of Nurr1 expression during development. Such studies should also take into account the complex developmental patterns of other cortical neurons (Saito et al., 2019).
Methods for Birthdating
As discussed by Puelles (2014), differences in pin-pointing the birth dates of claustrum neurons may stem from methodological issues. Bayer and Altman (1991) and earlier studies used radioactive [H3]Thymidine given at a single or multiple time points. In [H3]Thymidine studies, cell types are mainly inferred by their anatomical location. Arimatsu (1994) and Arimatsu et al. (2003) used antibodies against Latexin or Nurr1 in combination with the thymidine analog 5-bromo-2′-deoxyuridine (BrdU) to uncover the birthdates of claustrum and Nurr1/Lxn positive neurons in the lateral cortex. However, BrdU detection requires aggressive denaturation which may impact co-labeling with antibodies or in situ hybridization (Miller and Nowakowski, 1988; Chehrehasa et al., 2009). Administration of BrdU may also interfere with neuroblast proliferation and promote apoptotic cell death (Rodríguez-Vázquez and Martí, 2021). Therefore, we decided to use the more recently developed thymidine analog EdU, which does not require DNA denaturation and has been shown to be a specific and reproducible labeling tool to study cell proliferation in the adult central nervous system (Zeng et al., 2010). We also considered FlashTag labeling which allows for birth dating in a more precisely defined time window (Govindan et al., 2018). However, FlashTag labeling, so far, appears restricted to investigating dorsal cortex progenitors (Yoshinaga et al., 2021). One drawback of EdU is its even higher toxicity than BrdU at comparable dosing regimes (Ross et al., 2011; Andersen et al., 2013). However, since EdU is significantly more easily detected, it was possible to administer EdU at a fraction of the dose of BrdU in previous studies (Figure 1B; Arimatsu et al., 2003). We found that even at the lowest injection dose tested (10 mg/kg), EdU remained readily detectable using our staining protocol. The overall EdU labeling pattern in general agrees with previous birth dating studies. For example, in the cortex there is a clear inside-out EdU labeling pattern and lateral parts of the cortex show precocious development compared with dorsal regions (Figures 1C,D; Hicks and D’Amato, 1968; Smart and Smart, 1977; Saito et al., 2019). Further studies combining, for example, BrdU and EdU as shown by Harris et al. (2018), but using injections on different days, will enable direct comparisons of cells born at different time points. While we focus on EdU labeling in the claustrum and related cell types, our data may be of use to researchers interested in the birth dating of other brain regions, therefore we provided high resolution versions of Figures 4–9 online.1
Birth Dating and Neurogenetic Gradients of Nurr1 Positive Neurons
Previous birth dating studies of claustrum and DEn neurons have led to conflicting results (see Puelles, 2014, 2017; Bruguier et al., 2020 for reviews). Some earlier studies had suggested that rat claustrum neurons are born before E12.5 (Bisconte and Marty, 1975; Valverde and Santacana, 1994), however, our data indicate that the majority of all claustrum, DEn, and related Nurr1 positive neurons are born after E12.5 (Figure 10). We think that using reference marker, such as Nurr1, greatly expedites the assignment of birth dates to defined neuronal populations. Presumably, the lack of such a reference marker explains the major differences in the interpretation of the data in Bisconte and Marty (1975) and Valverde and Santacana (1994). Further differences may stem from the use of thin sections in [H3]thymidine studies (typically 5 μm), whereas we use relatively thick sections (50 μm), and differences in defining embryonic days. Our claustrum birth dating results agree to a larger extent with the findings of Bayer and Altman (1991); Arimatsu (1994), and Arimatsu et al. (2003). However, it should be noted that Bayer and Altman (1991) define the first day of embryonic development as E1, while Arimatsu (1994) and Arimatsu et al. (2003) define it as E0, whereas we define it as E0.5. For example, Arimatsu (1994) observe that the majority of DEn neurons are born on E13, we find that they are mainly born on E13.5 to E14.5, while Bayer and Altman (1991) show DEn birth dates from E14 to E15. In addition, we further subdivided DEn into three regions. vDEn has lower Nurr1 expression levels and shows the earliest birth dates (mainly on E13.5), whereas dDEn and pDEn have higher Nurr1 expression and later birth dates (on E13.5 and E14.5). Medial to the vDEn, we observed a group of cells called reservoir or paraclaustral reservoir (Bayer and Altman, 1991; Maciejewska et al., 1999) or more recently, bed nucleus of the external capsule (BEC) (Puelles, 2014; Puelles et al., 2016b). Interestingly, these cells show distinctly later birth dates (E15.5-E17.5) than the neighboring DEn (Figures 7–10). These Nurr1 negative neurons are either thought to migrate into olfactory cortex regions within the first few days after birth (Maciejewska et al., 1999) or constitute a more stable nucleus (Puelles, 2014; Puelles et al., 2016b). In both cases, they are unlikely to be related to claustrum neurons. When considering the adjacent cortical regions, we find that the olfactory cortex cells are produced from E13.5 to E15.5 and insular cortex cells are generated mainly on E14.5 to E15.5, indicating that DEn and claustrum develop jointly with their surrounding cortical regions (Puelles et al., 2016a). In contrast, the paraclaustral reservoir/BEC cells are born significantly later than the adjacent olfactory cortex neurons. Again, when we divide the claustrum into the vCL and dCL regions, they show largely similar birth dating patterns. Interestingly, the dLn Nurr1 positive neurons are generated largely on the same days as claustrum neurons whereas sLn neurons are generated significantly later (Figures 11, 12). Together with the strong reduction in Nurr1 expression during early postnatal development, this indicates that sLn neurons constitute a distinct neuronal type, whereas dLn neurons are more closely related to other claustrum neurons, in agreement with their claustrum-like gene expression profile (Bruguier et al., 2020; Peng et al., 2021).
Bayer and Altman (1991) describe a ventral to dorsal neurogenetic gradient in the DEn and a posterior to anterior neurogenetic gradient in the claustrum. In general, our data also support the notion of neurogenetic gradients in CL and DEn, but we find that both types of neurogenetic gradients are present in DEn and claustrum (Figures 10, 13). Thus, Nurr1 positive neurons are born earlier in ventral and posterior regions and later in dorsal and anterior regions within the major claustrum and DEn subregions. In contrast to Arimatsu (1994) and Arimatsu et al. (2003), we also identify ventral to dorsal neurogenetic gradients in lateral cortical Nurr1 positive dLn and sLn neurons (Figure 11). Overall, the prenatal development of Nurr1 expression follows the birth dating pattern, although it remains to be determined how long after neuronal production Nurr1 expression is induced. For example, claustrum and DEn neurons can be differentiated by their birth dates between E13.5 and E15.5, but based on Nurr1 staining alone, these subdivision are only recognizable after E17.5. Thus, experiments combining EdU injections with Nurr1 staining during embryonic development could provide clues about the relative timing of neuron production and induction of Nurr1 expression. More detailed fate-mapping studies are required to determine the origin and trajectory of claustrum and Nurr1 positive neurons in the lateral cortex.
Conclusion
Using Nurr1 we comprehensively studied the development of the claustrum and the Nurr1 positive neurons in the lateral cortex in the prenatal and early postnatal rat brain. We provide a detailed segmentation of claustral sub-regions and identify transient changes of Nurr1 expression in the cortex. By combining EdU labeling and ISH, we investigated the birth dates of sub-regions of the claustrum and related Nurr1 positive neurons in the lateral cortex. We describe the birth dating patterns of all sub-regions, which helps to understand their relationships based on their neurogenetic pattern. Also, we show that a ventral to dorsal and posterior to anterior neurogenetic gradient is broadly conserved within claustrum and DEn sub-regions. In summary, our data charts the embryonic and early postnatal patterns of claustrum development, and contributes toward explorations of claustrum function and dysfunction during early life.
Data Availability Statement
The original contributions presented in the study are included in the article/supplementary material, further inquiries can be directed to the corresponding author.
Ethics Statement
The animal study was reviewed and approved by Animal Care and Use Committees at the Shenzhen Institute of Advanced Technology (SIAT), Chinese Academy of Sciences (CAS).
Author Contributions
CF, RN, and HW: experimental design and critical revision of the manuscript for important intellectual content. CF and RN: data acquisition and analysis and drafting of the manuscript. RN and HW: obtain funding, administrative, technical, and material support, and study supervision. All authors contributed to the article and approved the submitted version.
Funding
This work was supported by a Shenzhen Governmental Basic Research Grant (JCYJ20180507182458694), the NSFC grants (32050410443, 31871081, 31850410468, and 32070978), and the Ministry of Science and Technology grant (QNL20200132001).
Conflict of Interest
The authors declare that the research was conducted in the absence of any commercial or financial relationships that could be construed as a potential conflict of interest.
Publisher’s Note
All claims expressed in this article are solely those of the authors and do not necessarily represent those of their affiliated organizations, or those of the publisher, the editors and the reviewers. Any product that may be evaluated in this article, or claim that may be made by its manufacturer, is not guaranteed or endorsed by the publisher.
Acknowledgments
We would like to thank Nan Li (Shenzhen Institute of Advanced Technology, Center for Synthetic Biology Engineering Research) for help with EdU staining and Zhonghua Lu and Saikat Ray for comments on the manuscript.
Abbreviations
ACo, anterior cortical amygdaloid area; AHiPL, amygdalohippocampal area, posterolateral; AuD, secondary auditory cortex, dorsal area; BEC, bed nucleus of the external capsule; BMA, basomedial amygdaloid nucleus, anterior part; BLA, basolateral amygdaloid nucleus, anterior part; BLP, basolateral amygdaloid nucleus, posterior part; BM, basomedial amygdaloid nucleus; BMP, basomedial amygdaloid nucleus, posterior part; CL, claustrum; dCL, dorsal claustrum; DEn, dorsal endopiriform; dDEn, dorsal DEn; dLn, deep layer neurons; EP, endopiriform nucleus; IEn, intermediate endopiriform nucleus; Ins, insular cortex; Me, medial amygdaloid nucleus; MePD, medial amygdaloid nucleus, posterodorsal part; MePV, medial amygdaloid nucleus, posteroventral part; PMCo, and posteromedial cortical amygdaloid area; S2, secondary somatosensory cortex; pDEn, posterior DEn; Pir, piriform cortex; r, paraclaustral reservoir; sLn, superficial layer neurons; Sp, subplate; V1, primary visual cortex; vCL, ventral claustrum; vDEn, ventral DEn.
Footnotes
References
Andersen, D. C., Skovrind, I., Christensen, M. L., Jensen, C. H., and Sheikh, S. P. (2013). Stem cell survival is severely compromised by the thymidineanalog EdU (5-ethynyl-2′-deoxyuridine), an alternative to BrdU for proliferation assays and stem cell tracing. Anal. Bioanal. Chem. 405, 9585–9591. doi: 10.1007/s00216-013-7387-y
Arimatsu, Y. (1994). Latexin: a molecular marker for regional specification in the neocortex. Neurosci. Res. 20, 131–135. doi: 10.1016/0168-0102(94)90030-2
Arimatsu, Y., Ishida, M., Kaneko, T., Ichinose, S., and Omori, A. (2003). Organization and development of corticocortical associative neurons expressing the orphan nuclear receptor Nurr1. J. Comp. Neurol. 466, 180–196. doi: 10.1002/cne.10875
Bandeira, F., Lent, R., and Herculano-Houzel, S. (2009). Changing numbers of neuronal and non-neuronal cells underlie postnatal brain growth in the rat. Proc. Natl. Acad. Sci. U.S.A. 106, 14108–14113. doi: 10.1073/pnas.0804650106
Bayer, S. A. (1990). Development of the lateral and medial limbic cortices in the rat in relation to cortical phylogeny. Exp. Neurol. 107, 118–131. doi: 10.1016/0014-4886(90)90150-Q
Bayer, S. A., and Altman, J. (1991). Development of the endopiriform nucleus and the claustrum in the rat brain. Neuroscience 45, 391–412. doi: 10.1016/0306-4522(91)90236-H
Biegler, M. T., Cantin, L. J., Scarano, D. L., and Jarvis, E. D. (2021). Controlling for activity-dependent genes and behavioral states is critical for determining brain relationships within and across species. J. Comp. Neurol. 529, 3206–3221. doi: 10.1002/cne.25157
Binks, D., Watson, C., and Puelles, L. (2019). A re-evaluation of the anatomy of the claustrum in rodents and primates—Analyzing the effect of pallial expansion. Front. Neuroanat. 13:34. doi: 10.3389/fnana.2019.00034
Bisconte, J. C., and Marty, R. (1975). Chronoarchitectonic analysis of the rat brain using radioautography. I. Histogenesis of the telencephalon. J. Hirnforsch. 16, 55–74.
Bruguier, H., Suarez, R., Manger, P., Hoerder-Suabedissen, A., Shelton, A. M., Oliver, D. K., et al. (2020). In search of common developmental and evolutionary origin of the claustrum and subplate. J. Comp. Neurol. 528, 2956–2977. doi: 10.1002/cne.24922
Chehrehasa, F., Meedeniya, A. C., Dwyer, P., Abrahamsen, G., and Mackay-Sim, A. (2009). EdU, a new thymidine analogue for labelling proliferating cells in the nervous system. J. Neurosci. Methods 177, 122–130. doi: 10.1016/j.jneumeth.2008.10.006
Clancy, B., Darlington, R. B., and Finlay, B. L. (2001). Translating developmental time across mammalian species. Neuroscience 105, 7–17. doi: 10.1016/S0306-4522(01)00171-3
Colón-Cesario, W. I., Martínez-Montemayor, M. M., Morales, S., Félix, J., Cruz, J., Adorno, M., et al. (2006). Knockdown of Nurr1 in the rat hippocampus: implications to spatial discrimination learning and memory. Learn. Mem. 13, 734–744. doi: 10.1101/lm.407706
Crispino, M., Tocco, G., Feldman, J. D., Herschman, H. R., and Baudry, M. (1998). Nurr1 mRNA expression in neonatal and adult rat brain following kainic acid-induced seizure activity. Mol. Brain Res. 59, 178–188. doi: 10.1016/S0169-328X(98)00143-0
de Ortiz, S. P., Maldonado-Vlaar, C. S., and Carrasquillo, Y. (2000). Hippocampal expression of the orphan nuclear receptor gene hzf-3/nurr1 during spatial discrimination learning. Neurobiol. Learn. Mem. 74, 161–178. doi: 10.1006/nlme.1999.3952
Dillingham, C. M., Mathiasen, M. L., Frost, B. E., Lambert, M. A., Bubb, E. J., Jankowski, M. M., et al. (2019). The anatomical boundary of the rat claustrum. Front. Neuroanat. 13:53. doi: 10.3389/fnana.2019.00053
Druga, R. (2014). “The structure and connections of the claustrum,” in The Claustrum: Structural, Functional and Clinical Neuroscience, eds J. R. Smythies, L. R. Edelstein and V. S. Ramachandran (San Diego, CA: Academic Press), 29–84.
Eells, J. B., Misler, J. A., and Nikodem, V. M. (2006). Early postnatal isolation reduces dopamine levels, elevates dopamine turnover and specifically disrupts prepulse inhibition in Nurr1-null heterozygous mice. Neuroscience 140, 1117–1126. doi: 10.1016/j.neuroscience.2005.12.065
Erwin, S. R., Bristow, B. N., Sullivan, K. E., Kendrick, R. M., Marriott, B., Wang, L., et al. (2021). Spatially patterned excitatory neuron subtypes and projections of the claustrum. Elife 10:e68967. doi: 10.7554/eLife.68967
Ferran, J. L., Ayad, A., Merchán, P., Morales-Delgado, N., Sánchez-Arrones, L., Alonso, A., et al. (2015). “Exploring brain genoarchitecture by single and double chromogenic in situ hybridization (ISH) and immunohistochemistry (IHC) on cryostat, paraffin, or floating sections,” in Situ Hybridization Methods, ed. G. Hauptmann (New York, NY: Humana Press, 83–107. doi: 10.1007/978-1-4939-2303-8_5
Filimonoff, I. N. (1947). A rational subdivision of the cerebral cortex. Arch. Neurol. Psychiatry 58, 296–311. doi: 10.1001/archneurpsyc.1947.02300320047002
Garcia-Moreno, F., Anderton, E., Jankowska, M., Begbie, J., Encinas, J. M., Irimia, M., et al. (2018). Absence of tangentially migrating glutamatergic neurons in the developing avian brain. Cell Rep. 22, 96–109. doi: 10.1016/j.celrep.2017.12.032
Govindan, S., Oberst, P., and Jabaudon, D. (2018). In vivo pulse labeling of isochronic cohorts of cells in the central nervous system using FlashTag. Nat. Protoc. 13, 2297–2311. doi: 10.1038/s41596-018-0038-1
Harris, L., Zalucki, O., and Piper, M. (2018). BrdU/EdU dual labeling to determine the cell-cycle dynamics of defined cellular subpopulations. J. Mol. Histol. 49, 229–234. doi: 10.1007/s10735-018-9761-8
Hedderich, D. M., Menegaux, A., Li, H., Schmitz-Koep, B., Stämpfli, P., Bäuml, J. G., et al. (2021). Aberrant claustrum microstructure in humans after premature birth. Cereb. Cortex 31, 5549–5559. doi: 10.1093/cercor/bhab178
Hermanson, E., Joseph, B., Castro, D., Lindqvist, E., Aarnisalo, P., and Wallén, Å, et al. (2003). Nurr1 regulates dopamine synthesis and storage in MN9D dopamine cells. Exp. Cell Res. 288, 324–334. doi: 10.1016/S0014-4827(03)00216-7
Hicks, S. P., and D’Amato, C. J. (1968). Cell migrations to the isocortex in the rat. Anat. Rec. 160, 619–633. doi: 10.1002/ar.1091600311
Hirata, T., Shioi, G., Abe, T., Kiyonari, H., Kato, S., Kobayashi, K., et al. (2019). A novel birthdate-labeling method reveals segregated parallel projections of mitral and external tufted cells in the main olfactory system. Eneuro 6:ENEURO.234–ENEURO.219. doi: 10.1523/ENEURO.0234-19.2019
Hirata, T., Tohsato, Y., Itoga, H., Shioi, G., Kiyonari, H., and Oka, S. (2021). NeuroGT: a brain atlas of neurogenic tagging CreER drivers for birthdate-based classification and manipulation of mouse neurons. Cell Rep. Methods 1:100012. doi: 10.1016/j.crmeth.2021.100012
Hoerder-Suabedissen, A., and Molnár, Z. (2015). Development, evolution and pathology of neocortical subplate neurons. Nat. Rev. Neurosci. 16, 133–146. doi: 10.1038/nrn3915
Hong, V., Presolski, S. I., Ma, C., and Finn, M. A. G. (2009). Analysis and optimization of copper-catalyzed azide–alkyne cycloaddition for bioconjugation. Angew. Chem. 121, 10063–10067. doi: 10.1002/ange.200905087
Jackson, J., Smith, J. B., and Lee, A. K. (2020). The anatomy and physiology of claustrum-cortex interactions. Annu. Rev. Neurosci. 43, 231–247. doi: 10.1146/annurev-neuro-092519-101637
Johnson, J. I., Fenske, B. A., Jaswa, A. S., and Morris, J. A. (2014). Exploitation of puddles for breakthroughs in claustrum research. Front. Syst. Neurosci. 8:78. doi: 10.3389/fnsys.2014.00078
Khazipov, R., Zaynutdinova, D., Ogievetsky, E., Valeeva, G., Mitrukhina, O., Manent, J. B., et al. (2015). Atlas of the postnatal rat brain in stereotaxic coordinates. Front. Neuroanat. 9:161. doi: 10.3389/fnana.2015.00161
Kitanishi, T., and Matsuo, N. (2017). Organization of the claustrum-to-entorhinal cortical connection in mice. J. Neurosci. 37, 269–280. doi: 10.1523/JNEUROSCI.1360-16.2016
Kummari, E., Guo-Ross, S. X., Partington, H. S., Nutter, J. M., and Eells, J. B. (2021). Quantitative immunohistochemistry to measure regional expression of nurr1 in the brain and the effect of the nurr1 heterozygous genotype. Front. Neuroanat. 15:63854. doi: 10.3389/fnana.2021.563854
Li, Y., Cong, B., Ma, C., Qi, Q., Fu, L., Zhang, G., et al. (2011). Expression of Nurr1 during rat brain and spinal cord development. Neurosci. Lett. 488, 49–54. doi: 10.1016/j.neulet.2010.10.078
Maciejewska, B., Berdel, B., Dziewia̧tkowski, J., and Moryś, J. (1999). The developmental changes of the “paraclaustral reservoir” of migrating cells in the rat brain: a study using morphometric and in situ DNA end labeling techniques. Brain Res. Bull. 48, 615–621. doi: 10.1016/S0361-9230(99)00007-6
Marriott, B. A., Do, A. D., Zahacy, R., and Jackson, J. (2021). Topographic gradients define the projection patterns of the claustrum core and shell in mice. J. Comp. Neurol. 529, 1607–1627. doi: 10.1002/cne.25043
Mathur, B. N. (2014). The claustrum in review. Front. Syst. Neurosci. 8:48. doi: 10.3389/fnsys.2014.00048
Medina, L., Abellán, A., and Desfilis, E. (2021). Evolving views on the pallium. Brain Behav. Evol. Online ahead of print doi: 10.1159/000519260
Miller, M. W., and Nowakowski, R. S. (1988). Use of bromodeoxyuridine-immunohistochemistry to examine the proliferation, migration and time of origin of cells in the central nervous system. Brain Res. 457, 44–52. doi: 10.1016/0006-8993(88)90055-8
Molnár, Z., Luhmann, H. J., and Kanold, P. O. (2020). Transient cortical circuits match spontaneous and sensory-driven activity during development. Science 370:eabb2153. doi: 10.1126/science.abb2153
Moon, M., Jeong, I., Kim, C. H., Kim, J., Lee, P. K., Mook-Jung, I., et al. (2015). Correlation between orphan nuclear receptor Nurr1 expression and amyloid deposition in 5 XFAD mice, an animal model of Alzheimer’s disease. J. Neurochem. 132, 254–262. doi: 10.1111/jnc.12935
Moon, M., Jung, E. S., Jeon, S. G., Cha, M. Y., Jang, Y., Kim, W., et al. (2019). Nurr1 (NR4A2) regulates Alzheimer’s disease-related pathogenesis and cognitive function in the 5XFAD mouse model. Aging Cell 18:e12866. doi: 10.1111/acel.12866
Moreau, M. X., Saillour, Y., Cwetsch, A. W., Pierani, A., and Causeret, F. (2021). Single-cell transcriptomics of the early developing mouse cerebral cortex disentangle the spatial and temporal components of neuronal fate acquisition. Development 148:dev197962. doi: 10.1242/dev.197962
Patzke, N., Innocenti, G. M., and Manger, P. R. (2014). The claustrum of the ferret: afferent and efferent connections to lower and higher order visual cortical areas. Front. Syst. Neurosci. 8:31. doi: 10.3389/fnsys.2014.00031
Peng, H., Xie, P., Liu, L., Kuang, X., Wang, Y., Qu, L., et al. (2021). Morphological diversity of single neurons in molecularly defined cell types. Nature 598, 174–181. doi: 10.1038/s41586-021-03941-1
Puelles, L. (2014). “Development and evolution of the claustrum∗,” in The Claustrum, (Cambridge, MA: Academic Press), 119–176. doi: 10.1016/B978-0-12-404566-8.00004-0
Puelles, L. (2017). Comments on the updated tetrapartite pallium model in the mouse and chick, featuring a homologous claustro-insular complex. Brain Behav. Evol. 90, 171–189. doi: 10.1159/000479782
Puelles, L., Alonso, A., García-Calero, E., and Martínez-de-la-Torre, M. (2019). Concentric ring topology of mammalian cortical sectors and relevance for patterning studies. J. Comp. Neurol. 527, 1731–1752. doi: 10.1002/cne.24650
Puelles, L., Harrison, M., Paxinos, G., and Watson, C. (2013). A developmental ontology for the mammalian brain based on the prosomeric model. Trends Neurosci. 36, 570–578. doi: 10.1016/j.tins.2013.06.004
Puelles, L., Kuwana, E., Puelles, E., and Rubenstein, J. L. (1999). Comparison of the mammalian and avian telencephalon from the perspective of gene expression data. Eur. J. Morphol. 37, 139–150. doi: 10.1076/ejom.37.2.139.4756
Puelles, L., Kuwana, E., Puelles, E., Bulfone, A., Shimamura, K., and Keleher, J. (2000). Pallial and subpallial derivatives in the embryonic chick and mouse telencephalon, traced by the expression of the genes Dlx-2, Emx-1, Nkx-2.1, Pax-6, and Tbr-1. J. Comp. Neurol. 424, 409–438. doi: 10.1002/1096-9861(20000828)424:3<409::aid-cne3>3.0.co;2-7
Puelles, L., Ayad, A., Alonso, A., Sandoval, J. E., MartÍnez−de-la-Torre, M., Medina, L., et al. (2016a). Selective early expression of the orphan nuclear receptor Nr4a2 identifies the claustrum homolog in the avian mesopallium: impact on sauropsidian/mammalian pallium comparisons. J. Comp. Neurol. 524, 665–703. doi: 10.1002/cne.23902
Puelles, L., Medina, L., Borello, U., Legaz, I., Teissier, A., Pierani, A., et al. (2016b). Radial derivatives of the mouse ventral pallium traced with Dbx1-LacZ reporters. J. Chem. Neuroanat. 75, 2–19. doi: 10.1016/j.jchemneu.2015.10.011
Ratié, L., Desmaris, E., García-Moreno, F., Hoerder-Suabedissen, A., Kelman, A., Theil, T., et al. (2020). Loss of Dmrt5 affects the formation of the subplate and early corticogenesis. Cereb. Cortex 30, 3296–3312. doi: 10.1093/cercor/bhz310
Ray, S., and Brecht, M. (2016). Structural development and dorsoventral maturation of the medial entorhinal cortex. Elife 5:e13343. doi: 10.7554/eLife.13343
Reep, R. (1984). Relationship between prefrontal and limbic cortex: a comparative anatomical review. Brain Behav. Evol. 25, 65–80. doi: 10.1159/000118852
Riedemann, S., Sutor, B., Bergami, M., and Riedemann, T. (2019). Gad1-promotor-driven GFP expression in non-GABAergic neurons of the nucleus endopiriformis in a transgenic mouse line. J. Comp. Neurol. 527, 2215–2232. doi: 10.1002/cne.24673
Rodríguez-Vázquez, L., and Martí, J. (2021). Administration of 5-bromo-2′-deoxyuridine interferes with neuroblast proliferation and promotes apoptotic cell death in the rat cerebellar neuroepithelium. J. Comp. Neurol. 529, 1081–1096. doi: 10.1002/cne.25005
Rosenberg, A. B., Roco, C. M., Muscat, R. A., Kuchina, A., Sample, P., Yao, Z., et al. (2018). Single-cell profiling of the developing mouse brain and spinal cord with split-pool barcoding. Science 360, 176–182. doi: 10.1126/science.aam8999
Ross, H. H., Rahman, M., Levkoff, L. H., Millette, S., Martin-Carreras, T., Dunbar, E. M., et al. (2011). Ethynyldeoxyuridine (EdU) suppresses in vitro population expansion and in vivo tumor progression of human glioblastoma cells. J. Neurooncol. 105, 485–498. doi: 10.1007/s11060-011-0621-6
Rueda-Alaña, E., Martínez-Garay, I., Encinas, J. M., Molnár, Z., and García-Moreno, F. (2018). Dbx1-derived pyramidal neurons are generated locally in the developing murine neocortex. Front. Neurosci. 12:792. doi: 10.3389/fnins.2018.00792
Saito, K., Okamoto, M., Watanabe, Y., Noguchi, N., Nagasaka, A., Nishina, Y., et al. (2019). Dorsal-to-ventral cortical expansion is physically primed by ventral streaming of early embryonic preplate neurons. Cell Rep. 29, 1555–1567. doi: 10.1016/j.celrep.2019.09.075
Sakurada, K., Ohshima-Sakurada, M., Palmer, T. D., and Gage, F. H. (1999). Nurr1, an orphan nuclear receptor, is a transcriptional activator of endogenous tyrosine hydroxylase in neural progenitor cells derived from the adult brain. Development 126, 4017–4026. doi: 10.1242/dev.126.18.4017
Salic, A., and Mitchison, T. J. (2008). A chemical method for fast and sensitive detection of DNA synthesis in vivo. Proc. Natl. Acad. Sci. U.S.A. 105, 2415–2420. doi: 10.1073/pnas.0712168105
Sanides, F. (1970). “Functional architecture of motor and sensory cortices in primates in the light of a new concept of neocortex evolution,” in The Primate Brain: Advances in Primatology, eds C. R. Noback and W. Montagna (New York, NY: Appleton-Century-Crofts), 137–205.
Schneider, B. F., and Norton, S. (1979). Equivalent ages in rat, mouse and chick embryos. Teratology 19, 273–278. doi: 10.1002/tera.1420190302
Smart, I. H., and Smart, M. (1977). The location of nuclei of different labelling intensities in autoradiographs of the anterior forebrain of postnatial mice injected with [3H] thymidine on the eleventh and twelfth days post-conception. J. Anat. 123(Pt 2):515.
Smith, J. B., Alloway, K. D., Hof, P. R., Orman, R., Reser, D. H., Watakabe, A., et al. (2019). The relationship between the claustrum and endopiriform nucleus: a perspective towards consensus on cross-species homology. J. Comp. Neurol. 527, 476–499. doi: 10.1002/cne.24537
Smith, J. B., and Alloway, K. D. (2010). Functional specificity of claustrum connections in the rat: interhemispheric communication between specific parts of motor cortex. J. Neurosci. 30, 16832–16844. doi: 10.1523/jneurosci.4438-10.2010
Smith, J. B., Lee, A. K., and Jackson, J. (2020). The claustrum. Curr. Biol. 30, R1401–R1406. doi: 10.1016/j.cub.2020.09.069
Torgerson, C. M., Irimia, A., Goh, S. M., and Van Horn, J. D. (2015). The DTI connectivity of the human claustrum. Hum. Brain Mapp. 36, 827–838. doi: 10.1002/hbm.22667
Valverde, F., and Santacana, M. (1994). Development and early postnatal maturation of the primary olfactory cortex. Dev. Brain Res. 80, 96–114. doi: 10.1016/0165-3806(94)90093-0
Wallén, Å, Zetterström, R. H., Solomin, L., Arvidsson, M., Olson, L., and Perlmann, T. (1999). Fate of mesencephalic AHD2-expressing dopamine progenitor cells in NURR1 mutant mice. Exp. Cell Res. 253, 737–746. doi: 10.1006/excr.1999.4691
Wang, Q., Ng, L., Harris, J. A., Feng, D., Li, Y., Royall, J. J., et al. (2017). Organization of the connections between claustrum and cortex in the mouse. J. Comp. Neurol. 525, 1317–1346. doi: 10.1002/cne.24047
Watson, C., and Puelles, L. (2017). Developmental gene expression in the mouse clarifies the organization of the claustrum and related endopiriform nuclei. J. Comp. Neurol. 525, 1499–1508. doi: 10.1002/cne.24034
Witter, M. P., Room, P., Groenewegen, H. J., and Lohman, A. H. M. (1988). Reciprocal connections of the insular and piriform claustrum with limbic cortex: an anatomical study in the cat. Neuroscience 24, 519–539. doi: 10.1016/0306-4522(88)90347-8
Wong, K. L., Nair, A., and Augustine, G. J. (2021). Changing the cortical conductor’s tempo: neuromodulation of the claustrum. Front. Neural Circuits 15:658228. doi: 10.3389/fncir.2021.658228
Xing, G., Zhang, L., Zhang, L., Heynen, T., Li, X. L., Smith, M. A., et al. (1997). Rat nurr1 is prominently expressed in perirhinal cortex, and differentially induced in the hippocampal dentate gyrus by electroconvulsive vs. kindled seizures. Mol. Brain Res. 47, 251–261. doi: 10.1016/S0169-328X(97)00056-9
Yao, Z., van Velthoven, C. T., Nguyen, T. N., Goldy, J., Sedeno-Cortes, A. E., Baftizadeh, F., et al. (2021). A taxonomy of transcriptomic cell types across the isocortex and hippocampal formation. Cell 184, 3222–3241. doi: 10.1016/j.cell.2021.04.021
Yoshinaga, S., Shin, M., Kitazawa, A., Ishii, K., Tanuma, M., Kasai, A., et al. (2021). Comprehensive characterization of migration profiles of murine cerebral cortical neurons during development using FlashTag labeling. Iscience 24:102277. doi: 10.1016/j.isci.2021.102277
Zeisel, A., Muñoz-Manchado, A. B., Codeluppi, S., Lönnerberg, P., La Manno, G., and Juréus, A. (2015). Cell types in the mouse cortex and hippocampus revealed by single-cell RNA-seq. Science 347, 1138–1142. doi: 10.1126/science.aaa1934
Zeng, C., Pan, F., Jones, L. A., Lim, M. M., Griffin, E. A., and Sheline, Y. I. (2010). Evaluation of 5-ethynyl-2′-deoxyuridine staining as a sensitive and reliable method for studying cell proliferation in the adult nervous system. Brain Res. 1319, 21–32. doi: 10.1016/j.brainres.2009.12.092
Zetterström, R. H., Solomin, L., Jansson, L., Hoffer, B. J., Olson, L., and Perlmann, T. (1997). Dopamine neuron agenesis in Nurr1-deficient mice. Science 276, 248–250. doi: 10.1126/science.276.5310.248
Zhang, L., Song, N. N., Zhang, Q., Mei, W. Y., He, C. H., Ma, P., et al. (2020). Satb2 is required for the regionalization of retrosplenial cortex. Cell Death Differ. 27, 1604–1617. doi: 10.1038/s41418-019-0443-1
Keywords: claustrum, EdU, birth dating, rat, Nurr1, Nr4a2, cortical development
Citation: Fang C, Wang H and Naumann RK (2021) Developmental Patterning and Neurogenetic Gradients of Nurr1 Positive Neurons in the Rat Claustrum and Lateral Cortex. Front. Neuroanat. 15:786329. doi: 10.3389/fnana.2021.786329
Received: 30 September 2021; Accepted: 05 November 2021;
Published: 02 December 2021.
Edited by:
José L. Ferran, University of Murcia, SpainReviewed by:
Luis Puelles, University of Murcia, SpainFernando Garcia-Moreno, Achucarro Basque Center for Neuroscience, Spain
Copyright © 2021 Fang, Wang and Naumann. This is an open-access article distributed under the terms of the Creative Commons Attribution License (CC BY). The use, distribution or reproduction in other forums is permitted, provided the original author(s) and the copyright owner(s) are credited and that the original publication in this journal is cited, in accordance with accepted academic practice. No use, distribution or reproduction is permitted which does not comply with these terms.
*Correspondence: Robert Konrad Naumann, cm9iZXJ0QHNpYXQuYWMuY24=