 Kyra T. Newmaster
 Fae A. Kronman
 Yuan-ting Wu
 Yongsoo Kim
- Department of Neural and Behavioral Sciences, The Pennsylvania State University, Hershey, PA, United States
The brain is composed of diverse neuronal and non-neuronal cell types with complex regional connectivity patterns that create the anatomical infrastructure underlying cognition. Remarkable advances in neuroscience techniques enable labeling and imaging of these individual cell types and their interactions throughout intact mammalian brains at a cellular resolution allowing neuroscientists to examine microscopic details in macroscopic brain circuits. Nevertheless, implementing these tools is fraught with many technical and analytical challenges with a need for high-level data analysis. Here we review key technical considerations for implementing a brain mapping pipeline using the mouse brain as a primary model system. Specifically, we provide practical details for choosing methods including cell type specific labeling, sample preparation (e.g., tissue clearing), microscopy modalities, image processing, and data analysis (e.g., image registration to standard atlases). We also highlight the need to develop better 3D atlases with standardized anatomical labels and nomenclature across species and developmental time points to extend the mapping to other species including humans and to facilitate data sharing, confederation, and integrative analysis. In summary, this review provides key elements and currently available resources to consider while developing and implementing high-resolution mapping methods.
Introduction
Macro-circuits across the brain integrate information from regional micro-circuits to process external stimuli, evaluate internal state, and generate behavior (e.g., motor action). Each micro-circuit contains a diverse array of neuronal and non-neuronal cell types with region- specific compositions. For example, glutamatergic (excitatory) and GABAergic (inhibitory) neurons are the two major neocortical neuron types with a respective ratio of 4:1 in the mouse brain (Isaacson and Scanziani, 2011; Tremblay et al., 2016). Moreover, recent single cell transcriptomic approaches combined with other physiological analyses unveiled that more than 100 different neuronal cell types exist in the mouse isocortex (neocortex) with distinct connectivity, physiology, and molecular characteristics (Belgard et al., 2011; Zeng et al., 2012; Fuzik et al., 2016; Tasic et al., 2016, 2018; Tremblay et al., 2016; Zeng and Sanes, 2017; Lim et al., 2018; Saunders et al., 2018; Zeisel et al., 2018; Kanari et al., 2019; Winnubst et al., 2019; Gouwens et al., 2020; Ortiz et al., 2020; Scala et al., 2020; Yao et al., 2021). Notably, different functional regions within the neocortex such as the primary motor-sensory and association cortices showed different densities of excitatory and inhibitory neurons as well as variation in their cerebrovascular networks (Kim et al., 2017; Yun et al., 2019; Wu et al., 2021). Investigation of long–range connectivity within the neocortex and closely connected brain regions also identified modular and integrative circuits across brain regions (Oh et al., 2014; Zingg et al., 2014; Hintiryan et al., 2016; Harris et al., 2019; Foster et al., 2020). Unveiling the spatial distribution of cell types throughout the cortex provides useful information for inferring how the cortex and its subdivisions may function. Likewise, comprehensive knowledge of cell type distribution throughout the whole brain is critical to fully understanding the dynamic intricacies and exceptional breadth of brain function.
To visualize and quantify the spatial distribution of cell types in the entire brain, high-resolution imaging across the whole 3D volume is necessary. Microscopy techniques can provide up to submicron resolution details, but in its original design, microscopy does not lend itself to volumetric imaging. Conversely, many neuroimaging tools such as magnetic resonance imaging (MRI) can provide volumetric imaging, but they don’t offer sufficient resolution to image individual cells and lack the ability to distinguish individual cell types. Mesoscale imaging bridges these two scales by combining high-resolution 3D imaging and computational analysis to allow visualization and quantification of axons, cell nuclei, processes, and even synapses in intact biological samples (Odgaard et al., 1990; Dodt et al., 2007; Mayerich et al., 2008; Li et al., 2010; Zheng et al., 2019; Ueda et al., 2020a, b). This technical breakthrough has ushered in a new era of neuroanatomy providing new opportunities to advance our knowledge of the principles governing nervous system organization and function.
Although 3D cell type mapping is highly useful, it comes with technical and analytical challenges that require a systematic workflow (Figure 1). Thus, the goal of this review is to provide insight into how scientists can acquire and utilize different forms of brain mapping to precisely examine their biological questions. Many previous works have focused on the mouse brain due to the variety of available transgenic animals, the compact size of the mouse brain, and the availability of high-quality 3D atlases. However, similar mapping approaches are also possible in other species such as the non-human primate (NHP) as well as human brains (Woodward et al., 2020; Rapan et al., 2021; Shapson-Coe et al., 2021).
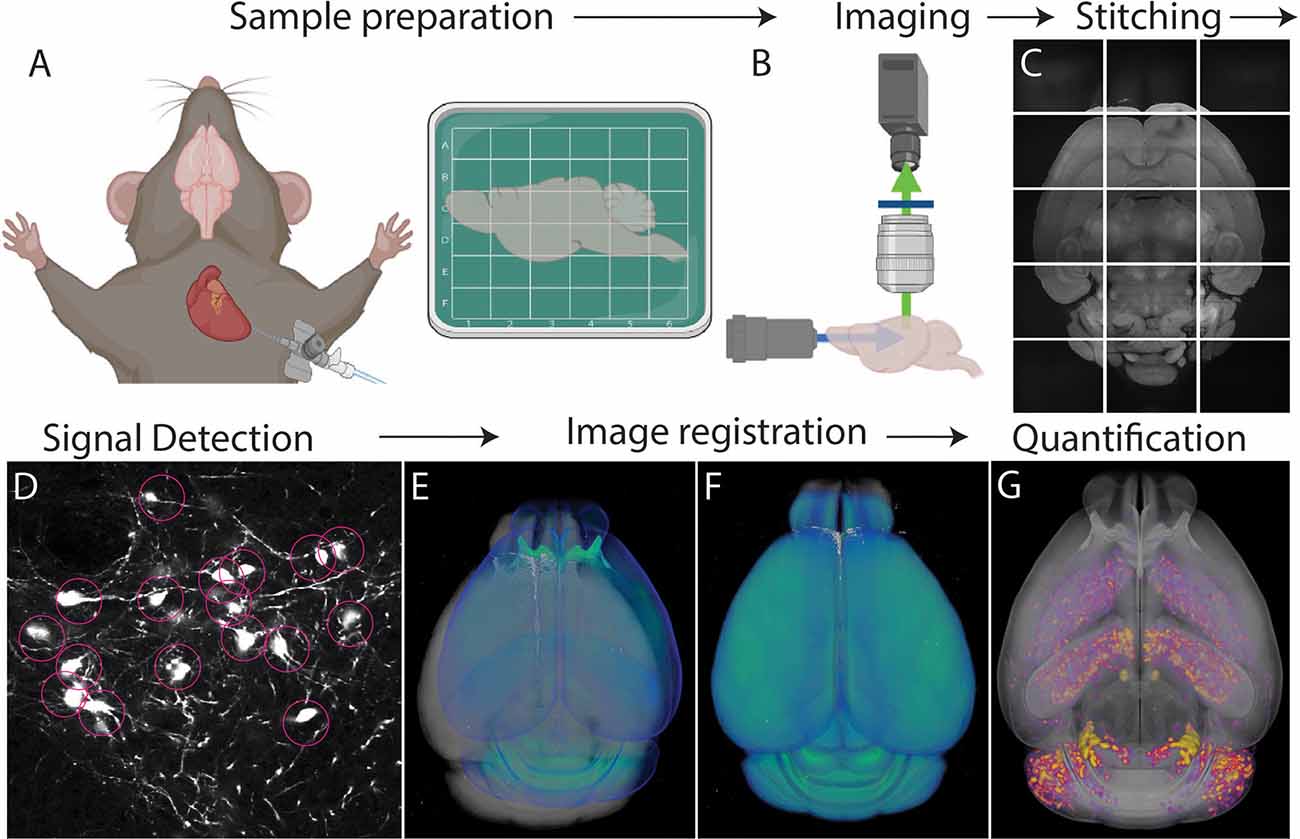
Figure 1. Whole brain cell type mapping pipeline. (A) Perfusion and fixation of the brain stabilize target signals. Fixed brains labeled with fluorescent signals can be further processed to lower background using tissue clearing. (B) Tiled images are acquired throughout the entire brain using whole brain 3D microscopy. (C) The resulting images are stitched to reconstruct the 3D volume of the brain. (D) Computational algorithms detect target signals automatically throughout the brain. (E,F) An individual brain (gray) is registered to an annotated standardized atlas (blue). (E) before and (F) after the registration. (G) Detected signals (purple/yellow) are mapped onto the atlas that allows either region of interest (ROI) or evenly spaced voxel-based analysis throughout the whole brain.
1. Cell Type Specific Labeling
In order to assess the distribution of cell types across the brain, genetic or histological methods can be used to distinguish specific cells from background information (Figure 2). Genetic methods leverage cell type specific promoters to drive reporter expression directly or indirectly through transgenic animals, viral administration, or a combination of both (Madisen et al., 2010; Josh Huang and Zeng, 2013; Daigle et al., 2018; Newmaster et al., 2020). Histological labeling is achieved through whole brain 3D immunohistochemistry with cell type specific antibodies and various tissue clearing methods (Renier et al., 2014; Yun et al., 2019; Kirst et al., 2020; Ueda et al., 2020b). Each labeling method has both benefits and limitations, making it important to choose a method that best suits the proposed experiment.
1.1. Transgenic Animals
Genetic labeling with transgenic animals provides a way to examine different cell populations across the whole brain without immunohistochemistry (Luo et al., 2008; Taniguchi et al., 2011; Josh Huang and Zeng, 2013; Figure 2A). One of the most popular approaches is the Cre recombinase system. In this system, Cre recombinase is expressed from a knock-in locus that is driven by a cell type specific promoter (Gong et al., 2007; Madisen et al., 2010; Harris et al., 2014). The knock-in approach labels target cells with high accuracy and can be combined with various conditional reporter animals to express different reporter proteins making the Cre system highly flexible (Madisen et al., 2010; Taniguchi et al., 2011; Harris et al., 2014; Madisen et al., 2015; Daigle et al., 2018; Figure 2A). Reporter variants include several different colors (e.g., Ai14 with tdTomato, Ai75 with nuclear tdTomato, or Ai140 with an extremely high-level of GFP), Ca++ reporters (e.g., Ai96 with gCaMP6 s), sparse labeling models (e.g., MORF), and tools to manipulate activity (e.g., CAG-LSL-Gq-DREADD, Ai32 with channelrhodopsin 2; Gong et al., 2007; Taniguchi et al., 2011; Madisen et al., 2012, 2015; Harris et al., 2014; Zhu et al., 2016; Veldman et al., 2020).
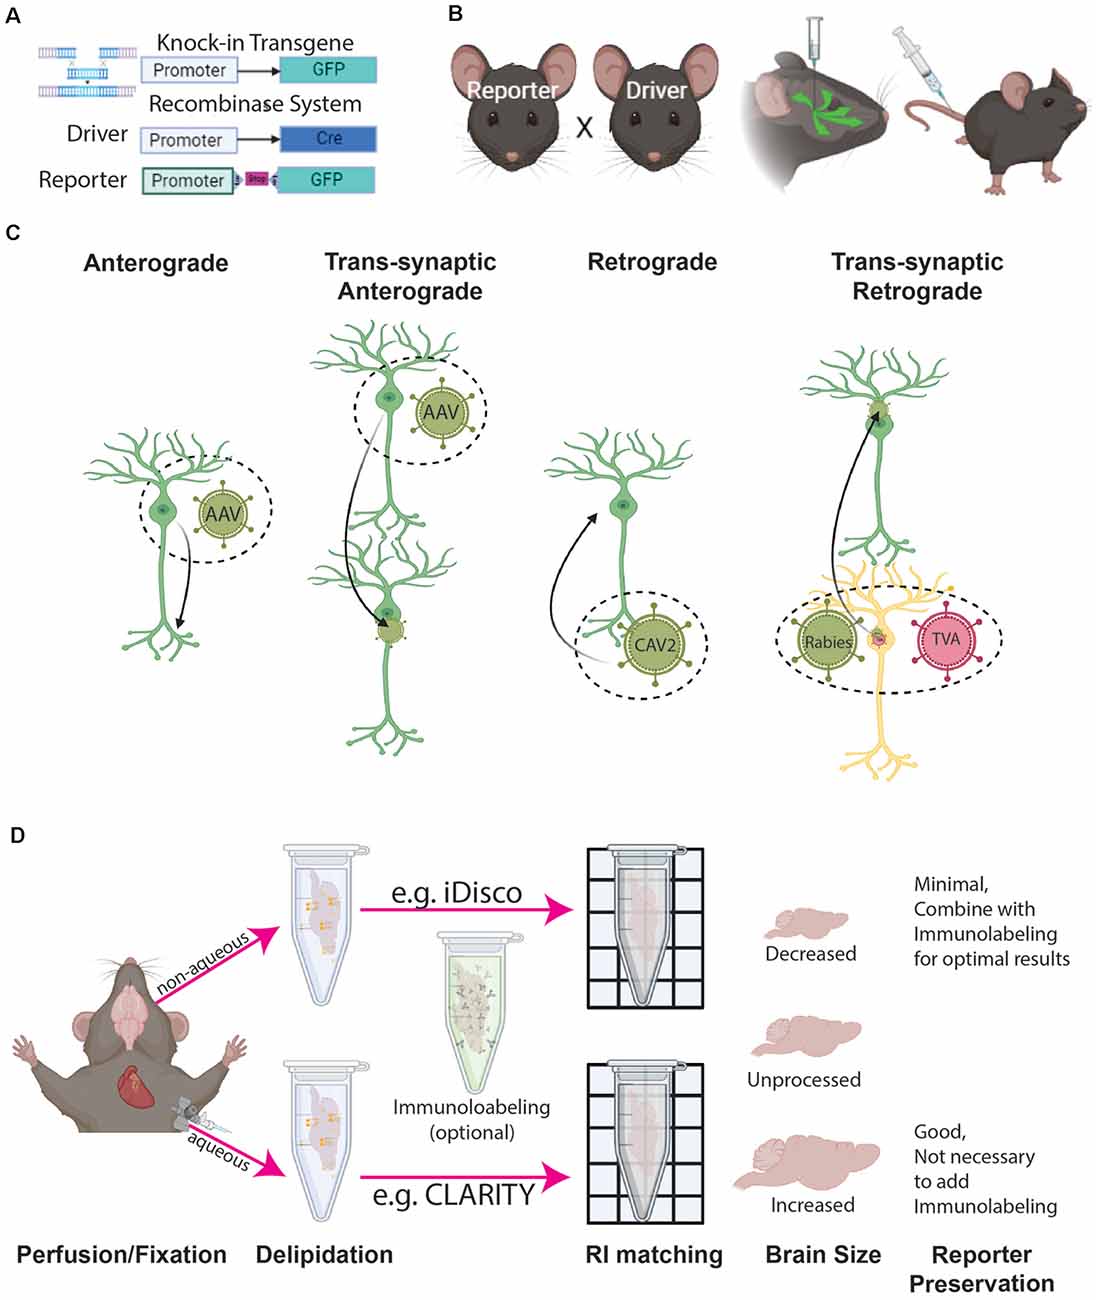
Figure 2. Cell type labeling and tissue clearing methods. (A) Genetic labeling methods include either reporter genes (e.g., GFP) directedly driven by the cell type specific promoter, or recombinase systems driven by a combination of cell type specific recombinase (e.g., Cre) expression and conditional (e.g., LoxP-Stop-LoxP) reporter gene expression (e.g., GFP). (B) Labeling can be achieved by the breeding reporter and driver animals and/or combining them with viral tools injected either directly into a target brain location or peripheral areas (e.g., tail vein). (C) Different configurations of viral tools provide ways to label specific cell compartments and their connection with other cells. (D) 3D immunohistochemistry with tissue clearing can be achieved by either aqueous or non-aqueous methods, both of which affect overall tissue volume.
To examine the overall distribution of target cells throughout the whole brain, a Cre driver animal can be bred with a conditional reporter animal which leads to offspring with the desired cell type labeled (Harris et al., 2014; Figure 2B). If the goal is to examine a specific cell type in an anatomically defined region, intracerebral injection of a virus carrying a reporter or Cre recombinase will provide spatial specificity in addition to cell type specificity (see the next section for more details; Josh Huang and Zeng, 2013; He et al., 2016; Jeong et al., 2016; Son et al., 2020; Figure 2B). Flippase (flp), another popular recombinase, can be combined with Cre to further identify subtypes within a cell type population (Farago et al., 2006; Miyoshi et al., 2010; Taniguchi et al., 2011; Josh Huang and Zeng, 2013; He et al., 2016; Graybuck et al., 2020). Inducible recombinase (e.g., tamoxifen inducible CreERT) provides temporally restricted recombinase activity which is useful in the study of cell type development from a defined time point (Taniguchi et al., 2011; Wu et al., 2021). This type of recombinase can also be used to achieve sparse labeling by titrating recombinase activating drugs (e.g., tamoxifen). Sparse labeling is particularly useful for dense cell types and single cell tracing experiments. Another way to achieve sparse labeling is through the MORF mouse which was designed to stochastically label 1–3% of Cre expressing cells (Veldman et al., 2020).
One caveat of Cre recombinase-based labeling is its lack of temporal resolution. Animals derived from the pairing of a conditional reporter mouse and a Cre expressing mouse will express a fluorescent reporter after a single Cre activation even when the gene of interest and Cre are no longer being expressed. Therefore, these animals may not accurately represent temporal patterns of gene expression (Song and Palmiter, 2018; Newmaster et al., 2020). This issue can be circumvented with the use of transgenic animals with direct reporter expression under specific cell type specific promoters. Regardless of reporter mice, it is important to validate the expression of reporter genes against the gene of choice using immunohistochemistry or mRNA in situ prior to mapping effort as transgenic animals may lead to misrepresent or over represent target cell type expression (Zoghbi, 2003; Gerfen et al., 2013; Newmaster et al., 2020).
More detailed information about different recombinase based cell type specific drivers and conditional reporter animals, reference the characterization databases can be found in Allen Institute for Brain Science1, the GENSAT project2, and the NIH Neuroscience Blueprint Cre Driver Network3. We also refer to recent review articles summarizing a different set of genetic tools to label specific cell types (Kim and Dymecki, 2009; Madisen et al., 2010; Taniguchi et al., 2011; Gerfen et al., 2013; Josh Huang and Zeng, 2013; Harris et al., 2014; McLellan et al., 2017; Daigle et al., 2018; Debbache et al., 2018; Yook et al., 2021).
1.2. Viral Tools
Virus-mediated labeling has been critical to examine cell type distribution in anatomically defined areas and cell-type specific connectivity throughout the brain (Oh et al., 2014; He et al., 2016; Jeong et al., 2016; Harris et al., 2019; Figures 2B,C). To assess anterograde connectivity, adeno-associated virus (AAV) with a recombinase-dependent reporter can be injected into the target area of a cell-type specific Cre and/or Flp driver animal (Figure 2C). This approach has been widely used to establish wiring diagrams of different cell types in the mouse brain (Oh et al., 2014; Gerfen et al., 2018; Harris et al., 2019; Winnubst et al., 2019; Son et al., 2020). The main caveat to this approach is that only cellular processes (e.g., axons and axon terminals) are visualized and one cannot determine which cells in the targeted regions are receiving synaptic input. To address this, trans-synaptic anterograde tracing with different serotypes of AAV and herpes simplex virus is under development, but the robustness of these viruses in mono trans-synaptic anterograde tracing remains to be established (Lo and Anderson, 2011; Zingg et al., 2017; Cembrowski et al., 2018; Su et al., 2020; Zingg et al., 2020; Yook et al., 2021; Figure 2C). For retrograde tracing, viruses such as retro AAV or Canine adenovirus type 2 (CAV-2) can be injected into a region to be taken up by presynaptic terminals and transported to the cell nucleus for reporter expression (Junyent and Kremer, 2015; Tervo et al., 2016; Li et al., 2018; Figure 2C). For mono-synaptic retrograde tracing, rabies viruses coupled with helper viruses that restrict retrograde jumping to one neuron have been well-established and widely used (Callaway and Luo, 2015; Schwarz et al., 2015; Pomeranz et al., 2017; Son et al., 2020; Huang et al., 2021; Figure 2C).
Virus-mediated labeling has become even more flexible with the invention of AAV viruses packaged with plasmids that contain enhancers for cell type specific expression of reporter genes (Chan et al., 2017; Mich et al., 2021). When combined with blood-brain barrier penetrating viruses (e.g., AAVphp.eb), peripheral injection of this viral tool can achieve cell type specific labeling in any animal opening new paths to cell type mapping in non-traditional model animals and animal models of disease (Chan et al., 2017; Mich et al., 2021; Figure 2B). With so much flexibility, virus-mediated cell type labeling is a versatile tool that simply requires a little creativity to effectively use. We refer to recent excellent reviews that summarize the recent development and application of viral tools for more details and guidance on experimental design (Callaway and Luo, 2015; Bedbrook et al., 2018; Haery et al., 2019; Saleeba et al., 2019; Suzuki et al., 2020; Cong et al., 2020; Lanciego and Wouterlood, 2020; Nectow and Nestler, 2020).
1.3. 3D Immunolabeling With Tissue Clearing
Remarkable advances in tissue clearing and 3D immunolabeling make it possible to label target cells with specific antibodies in intact biological samples. This enables scientists to bypass complex breeding schemes and care for excessively large colonies accelerating new discoveries and extending brain mapping technology to new species including humans (Lai et al., 2018; Kim et al., 2021). Here, we provide a brief summary of a few widely used clearing and chemical labeling methods to examine cell type distribution in the whole brain. Tissue clearing involves delipidation (first part of tissue clearing) and index matching (second part of the clearing) with an optional and often necessary immunolabeling step (Ueda et al., 2020a, b; Figure 2D). Tissue clearing can be aqueous or non-aqueous (Jensen and Berg, 2017; Qi et al., 2019; Yun et al., 2019; Ueda et al., 2020a, b; Figure 2D). Furthermore, full brain clearing and 3D immunolabeling can be achieved through active or passive methods. Active methods (e.g., CLARITY, SHIELD) use electrophoresis and chemical engineering to increase the homogeneity of clearing and immunolabeling (Chung et al., 2013; Chung and Deisseroth, 2013; Yun et al., 2019; Ueda et al., 2020a, b). However, the procedure is costly due to the required equipment and often only allows for the processing of small batches per round. Passive clearing (e.g., iDISCO) can take longer especially with additional immunolabeling, but it is less expensive and a large number of samples can be processed at the same time (Renier et al., 2014; Qi et al., 2019).
Different tissue clearing methods can introduce varying degrees of tissue deformation (Wan et al., 2018; Ueda et al., 2020a, b; Weiss et al., 2021). Aqueous methods tend to bloat the tissue which can introduce tearing of delicate areas and connected structures such as axons and vasculature (Chung et al., 2013; Wan et al., 2018). However, aqueous clearing methods can preserve native fluorescence well (Chung et al., 2013; Wan et al., 2018). In contrast, non-aqueous methods use tissue dehydration to finalize the clearing process which often causes tissue shrinkage (Wan et al., 2018). Moreover, non-aqueous clearing methods tend to quench endogenous fluorescent proteins (Renier et al., 2014; Qi et al., 2019). Recently developed non-aqueous methods such as FDISCO improve the preservation of endogenous fluorescence, but the native signals begin to fade after a few days, limiting the window of opportunity for sample imaging (Qi et al., 2019). This problem can be overcome by performing immunolabeling for endogenous reporter proteins with a more stable secondary antibody (Renier et al., 2014). An additional benefit of sample dehydration is that the tissue becomes plasticized, which makes handling delicate samples (e.g., early developing brains) easier and tissue shrinkage can facilitate imaging of larger tissue samples (Wan et al., 2018).
Finally, it is important to consider the experimental needs and location of the structure that is being targeted. Cell counting is best done with signals restricted to the cell nucleus or cell body. On the other hand, tracing and visualization of subcellular structures such as spines will require labeling that fills the entire cell or localizes to the cell membrane. Visualizing subcellular structures will also benefit from expansion seen in aqueous clearing methods (Matryba et al., 2019). In short, no one method will work for all antibodies or probes due to different biophysical properties of proteins and mRNA, so the appropriate literature searches and initial pilot testing should be done before choosing a particular method (Weiss et al., 2021). For an in-depth discussion of 3D tissue labeling and clearing please see: Molbay et al. (2021), Ueda et al. (2020a,b), and Weiss et al. (2021).
2. Imaging
Following sample labeling and preparation, 3D imaging with sufficient resolution to examine individual cells and their processes in intact biological samples can be performed (Figure 3). The most basic yet labor-intensive imaging method is using serial sectioning and tiled microscopic imaging of 2D sections followed by 3D reconstruction (Zingg et al., 2014; Hintiryan et al., 2016; Zingg et al., 2018; Cizeron et al., 2020; Benavidez et al., 2021; Figure 3A). Though this method is readily available to most labs, it is difficult to scale up. High-speed slide scanners such as the Nanozoomer (Hamamatsu) can make this method more streamlined and have even been used to achieve brain mapping in many different species including the marmoset (Zheng et al., 2014; Lin et al., 2019; Woodward et al., 2020). However, histological sectioning and mounting on microscopic slides can also present a challenge as these procedures introduce unexpected volume distortion, making 3D reconstruction challenging. Here, we will review two commonly used automated 3D high-resolution imaging methods that ensure precise 3D reconstruction; block-face imaging and selective plane illumination microscopy (SPIM) imaging. Each system has unique advantages and disadvantages (Figure 3). Labeling type, structure of interest, and sample properties are the main dictators of which imaging modality to choose.
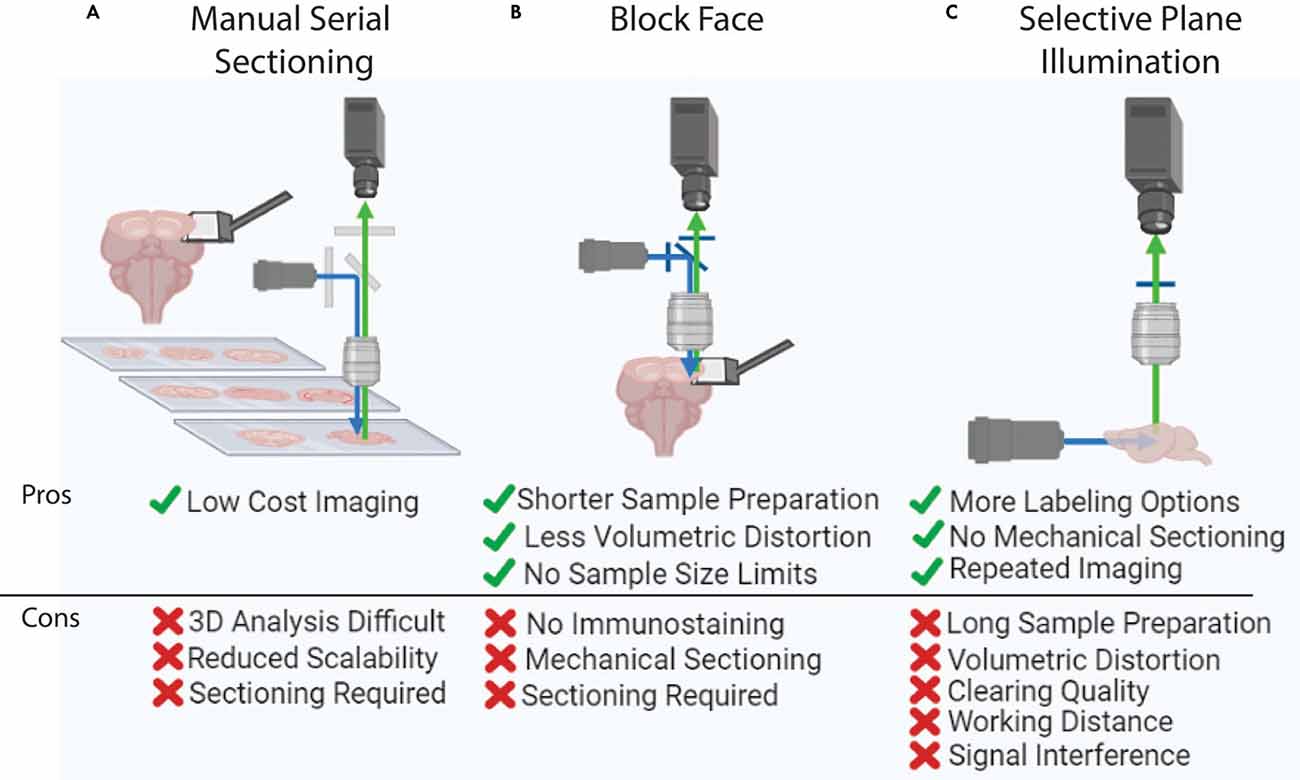
Figure 3. Whole brain imaging methods. (A) Manual cutting and imaging histological sections on slides. This method is laborious and requires significant amounts of manual effort. (B) Block-face imaging such as serial two photon tomography. The requirement of serial sectioning can introduce challenges in delicate samples. (C) Selective plane illumination or light-sheet imaging. This method can visualize an intact and clear sample without any physical sectioning, yet this imaging is hard to apply to large tissue (e.g., human brain) due to the limited working distance of an objective lens.
2.1. Block-Face Imaging
Block-face imaging utilizes tiled microscopic images of the surface of an intact sample block followed by serial sectioning (Ragan et al., 2012; Zheng et al., 2013, 2019; Amato et al., 2016; Economo et al., 2016; Figure 3B). Serial two photon tomography (STPT) performs tiled block-face imaging with a multiphoton microscope and high fidelity vibratome with typical sectioning at either 50 μm or 100 μm thick (Oh et al., 2014; Kim et al., 2017; Newmaster et al., 2020). Finer z-resolution imaging can be acquired by adding optical sectioning within each slice (Wu et al., 2021). STPT is a flexible modality that has been used to map neural connectivity, cell-type density, cerebrovasculature, and dendritic architecture (Tsai et al., 2009; Oh et al., 2014; Zapiec and Mombaerts, 2015; Kim et al., 2017; Newmaster et al., 2020; Wu et al., 2021). However, it is important to note that STPT requires endogenous fluorescence expression of target signals. Therefore, STPT mapping heavily relies on transgenic reporter animals which can require complex breeding schemes (Amato et al., 2016; McLellan et al., 2017). However, the recent developments in viral tools such as AAVphp.eb and enhancer-based viral tools enable the expression of fluorescent proteins in non-transgenic animals discussed above, open new possibilities for expanding the implementation of STPT brain mapping (Chan et al., 2017; Mich et al., 2021). One distinct advantage of STPT is simple sample preparation (Figure 3B). Fixed brains can be used without further tissue clearing. Another advantage to this imaging method is that the working distance of the objective lens does not dictate the image depth of the system because serial sectioning removes the sample surface as imaging progresses through the volume. Therefore, STPT can be employed to examine larger samples such as the marmoset and human brain (Okano and Mitra, 2015; Abe et al., 2017; Lin et al., 2019; Mancini et al., 2020).
Knife-Edge Scanning Microscopy and Micro-optical sectioning tomography (MOST) are other variations of block-face imaging which were originally developed with light microscopy to achieve high-resolution 3D imaging with ultrathin sectioning (less than 1 μm; Mayerich et al., 2008; Zheng et al., 2013, 2019). Fluorescence MOST (fMOST) combines fluorescence microscopy with MOST to take advantage of cell type specific labeling. This technology images the sample on the edge of a diamond blade as sectioning occurs (Zheng et al., 2013, 2019; Figure 3B). To achieve thin sections, brain samples are embedded in resin or hard plastic. Thin sectioning along with a high numerical aperture oil lens improves imaging resolution allowing structures such as individual axons and dendritic spines to be captured for highly accurate axon tracing and neuron reconstruction experiments (Zheng et al., 2013, 2019). Moreover, a recently developed line-illumination modulation technique further improves signal-to-noise ratio and acquisition speed (Zhong et al., 2021). The major drawbacks of this system are that it is not commercially available and imaging at such a high-resolution often generates more than 10 TB of data for one mouse brain requiring a specialized data analysis infrastructure.
2.2. SPIM
SPIM or light-sheet imaging generates tiled images by illuminating a plane of optically cleared tissue and collecting signals in the orthogonal direction (Corsetti et al., 2019; Figure 3C). Light-sheet imaging was originally developed over 100 years ago, yet it did not become popular until the recent advances in tissue clearing (Corsetti et al., 2019; Ueda et al., 2020a, b). The illumination sheet of light is generated via transverse facing lenses and the signal is then collected from a second objective lens which can have many positions but is typically in the orthogonal direction (Corsetti et al., 2019). To obtain full brain data, the entire sample is moved through the imaging field with a motorized stage which triggers a CMOS camera for image collection (Ueda et al., 2020a). Because there is no need to section the sample and the field of view (FOV) is large, SPIM has dramatically reduced imaging time compared to STPT and is ideal for delicate samples (e.g., developing embryos). SPIM also has the added benefit of being intrinsically paired with 3D immunolabeling and tissue clearing methods which can be easily applied to different biological samples with any genetic labeling strategy (Roostalu et al., 2019; Gómez et al., 2021).
Nonetheless, SPIM also has a number of complicated drawbacks stemming from tissue preparation and the physical properties of the illumination system (Wan et al., 2018; Xu et al., 2019; Ueda et al., 2020a, b; Molbay et al., 2021; Weiss et al., 2021). SPIM requires samples to be optically clear which is time-consuming and often introduces tissue distortion (Dodt et al., 2007; Renier et al., 2014; Jensen and Berg, 2017; Wan et al., 2018; Qi et al., 2019; Figure 3C). Clearing technology itself also limits the size of the sample as it is difficult to remove lipids/penetrate larger volumes such as those of non-human primates and human brains (Tainaka et al., 2018; Zhao et al., 2019; Ueda et al., 2020a; Figure 3C). Even if these brains could be cleared, it is challenging to create an objective lens with a long enough working distance to collect signals from the entire sample (Ueda et al., 2020a). Some trials are currently underway to combine slab sectioning and SPIM imaging to overcome this limitation (Hillman et al., 2019; Voleti et al., 2019). For a more in-depth discussion of SPIM, refer to the following review articles (Elisa et al., 2018; Müllenbroich et al., 2018; Wan et al., 2018; Corsetti et al., 2019; Hillman et al., 2019; Ueda et al., 2020a).
3. Image Pre-Processing and 3D Image Reconstruction (Stitching)
Before images can be analyzed in 3D, raw data must be preprocessed to compensate for image distortion in each image tile and re-assembled into a volumetric dataset. Each type of 3D microscopy comes with its own mechanical and optical artifacts that require modality-specific attention to achieve precise 3D stitching. Therefore, stitching algorithms have evolved over time to meet the particular needs of different imaging modalities particularly when it comes to managing increasingly large data sets. This section will discuss currently available tools for block-face and SPIM image processing.
The main challenge in developing an accurate stitching algorithm is accounting for different types of distortion in the X, Y, and Z directions. For example, manual histological sectioning is generally uniform in section thickness (Z direction), but mounting tissue on glass slides often introduces non-uniform distortion along the X-Y axes. In mapping through manual serial sectioning, it is typical to use stitching software provided with the microscope to perform X-Y stitching but then an in-house method to align the data along the Z-axis for 3D registration (Hintiryan et al., 2016; Bienkowski et al., 2018). Although block-face imaging also relies on sectioning, the X-Y-Z distortion is minimal due to its unique imaging configuration as explained in section 2.1 and Figure 3. Therefore, stitching modules in Fiji (or ImageJ) can be used to perform repeated two-dimensional stitching throughout the entire image volume (Ragan et al., 2012). To mitigate tile line artifacts in 2D reconstruction, image tiles are normalized by an average Z projection (Ragan et al., 2012). Then, corrected tiles can be aligned using cross-correlation, and the overlapping pixels can be blended using linear averaging (Ragan et al., 2012). Because this pipeline is accomplished in Fiji, it is free, and little programming skill is needed to stitch data. However, this simple Fiji stitching utilizes high amounts of memory, making it less suitable for larger data sets (e.g., over 1 TB). This has been recently overcome by TeraStitcher, a python- based code, that uses meta-data stored in the acquired images to calculate the minimum number of stitching lines needed reducing the computational costs of stitching large data (Bria and Iannello, 2012; Hörl et al., 2019; Kirst et al., 2020). TeraStitcher also simultaneously performs illumination corrections and allows the user to manually correct stitching misplacement (Bria and Iannello, 2012). BigStitcher utilizes a similar method to reduce the computational costs of stitching and is available in Fiji as a plugin (Hörl et al., 2019). However, BigStitcher also incorporates iterative minimization of square displacements to improve poor distance control between disconnected objects and improved correction for spherical and chromatic aberrations (Matsuda et al., 2018; Hörl et al., 2019). Spherical aberrations arise from light that enters a lens at the edge of the lens and gets focused on a different point in the tissue compared to the lights entering the center of the lens making the edges of an image where stitching occurs appear blurred which impedes accurate stitching and further analysis (Diel et al., 2020). Chromatic aberrations occur because the refractive index and the focal length of a lens are dependent on wavelength. Therefore, different wavelengths of light will produce shifted images. Thus, spherical and chromatic aberration correction can significantly improve the alignment of multichannel images (Marimont and Wandell, 1994; Matsuda et al., 2018).
SPIM datasets also contain an additional aberration because excitation and emission light need to go through the whole cleared 3D volume which introduces optical aberrations in all 3D axes including the z-direction (Kirst et al., 2020). WobblyStitcher is a python-based tool that accounts for this 3D aberration by creating max z projections to calculate a z profile per sample which is then combined with a global optimizer to complete tile merging (Kirst et al., 2020). While this stitching method solves an important problem for processing SPIM images, WobblyStitcher is only available as a python code requiring some programming skill to handle while also demanding significant computational power and time (Kirst et al., 2020). Another artifact that is unique to SPIM is striping which is caused when any object blocks light penetration into the sample. Destriping tools have been developed to remove striping and other shadows by applying a low pass Fourier transform filter on the 2D wavelet transform (Swaney et al., 2019; Kirst et al., 2020). This prevents the removal of important biological information such as entire vessels/axons that align with the artifact while smoothing ripple-like striping. Many other denoising algorithms are also available to enhance the signal to noise ratio but should be approached with caution to prevent the introduction of unexpected artifacts (Tyson and Margrie, 2021).
4. Automated Signal Detection
Cellular resolution information in the whole brain makes manual detection and counting difficult if not impossible. To overcome this issue, many automated cell counting and tracing tools have been developed. They can be divided into three large categories: Filter-based, Machine Learning (ML), and Deep Learning (DL).
Filter-based, non-machine learning detection utilizes simple thresholds to select features and define objects (Sbalzarini, 2016). Detection often starts with binarization or masking through intensity thresholds (Figure 4A). Following binarization, objects in the image can be separated using other filters such as water-shedding, fast-marching, erosion, size, circularity, and many more refined methods (Figure 4A). These simple methods can be applied to brain mapping samples, but special attention must be paid to the three-dimensional nature of the imaging as objects may appear in multiple planes depending on the resolution (Figure 4B). ClearMap is a tool that identifies the local maximum of a 3D spherical object and assigns a single coordinate to the center of a sphere with all connected pixels belonging to that cell/coordinate which prevents overcounting of cells appearing in multiple planes (Renier et al., 2016). This filter-based detection is simple and easily achievable in any image processing software but has limited functionality because each algorithm must be designed per experiment and tuned by a user which can lead to highly subjective selection patterns.
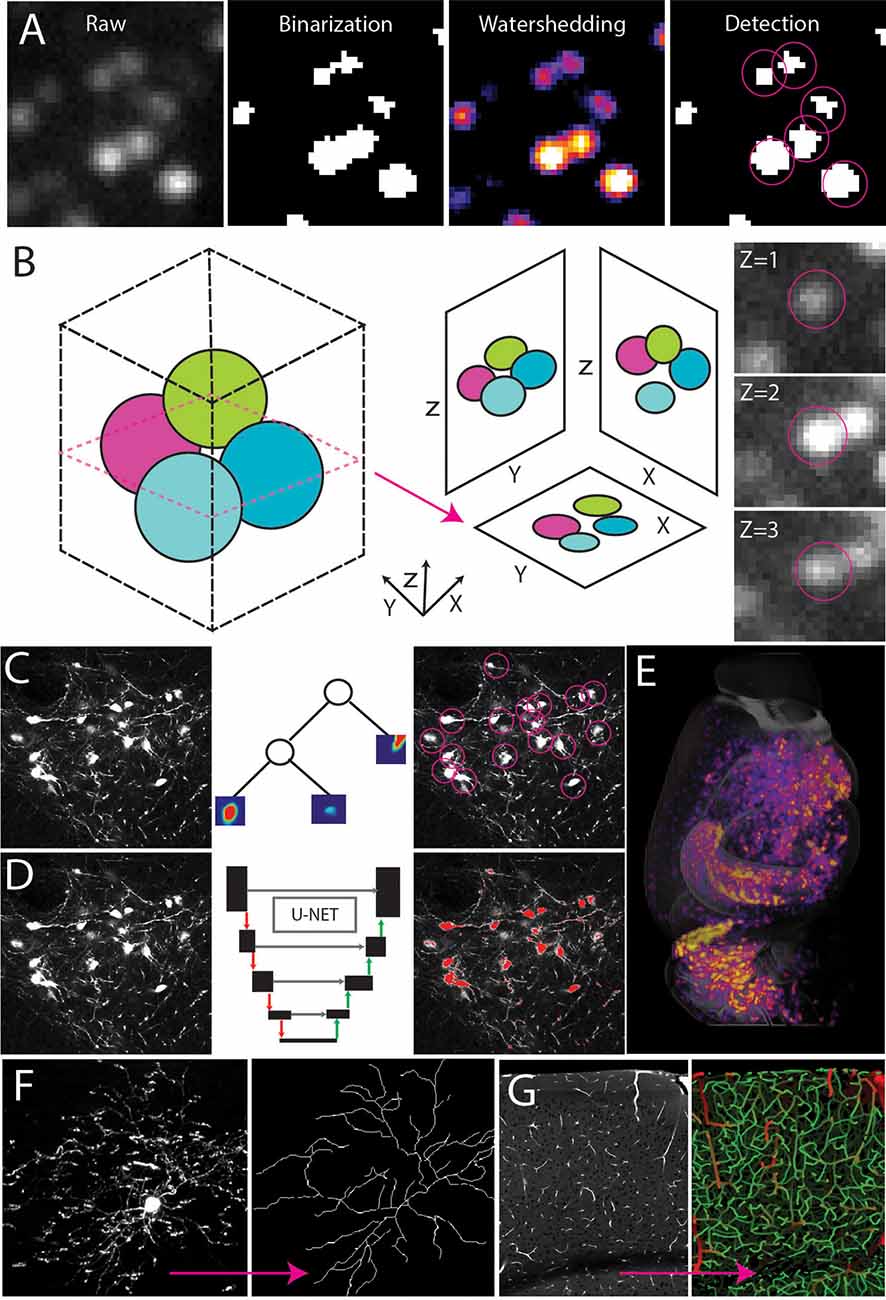
Figure 4. Automated signal detection. (A) Cell detection pipeline using filter-based methods including intensity filters and water-shedding. (B) Cells can be captured in multiple planes making it necessary to identify the connected components of a central point in the sphere. (C–E) Random forest-based machine learning (C) or deep learning segmentation (D) to detect cell type signals across the whole brain (E). (F,G) Signal detection and tracing to achieve full 3D reconstruction of a single neuron (F, adapted from Janelia MouseLight NeuronBrowser) or cerebrovascular network analysis (G).
Because filter-based detection is not flexible, it does not lend itself to complex or densely packed structures with variable intensity or poor signal to noise ratio (Shamir et al., 2010; Sbalzarini, 2016). For example, simple thresholding in images with an inherent intensity gradient and multiple structures of interest is tedious and subjective as each ROI in a large 3D brain may have a unique intensity profile (Renier et al., 2016; Mergenthaler et al., 2021). A task such as this (e.g., without clear-cut rules and requiring repeated efforts) is better tackled with machine learning approaches which can do any number of tasks with adaptive thresholding (Figure 4C). Ilastik is a popular user-friendly software that will utilize machine learning to segment data based on a small number of user inputs and training (Renier et al., 2016; Berg et al., 2019; Kreshuk and Zhang, 2019). Ilastik mainly uses random forest clustering to calculate probabilities based on experimenter inputs to determine detected signals (Renier et al., 2016; Berg et al., 2019; Kreshuk and Zhang, 2019). The Weka plug-in for Fiji also works in a similar manner to Ilastik, making it a useful add-on to Fiji-based analysis pipelines (Arganda-Carreras et al., 2017).
Though machine learning is more flexible than filtering methods the quality of detection depends on the quality of the training set and the selection criteria making it subject to human bias and limited to concrete mathematical-based problems (Sbalzarini, 2016). When feature selection is more challenging, deep learning (DL) can provide better automatic annotation (Yangt et al., 2017; Figure 4D). For example, a set of morphologically distinct neurons labeled with the same fluorescent color in the same brain can still be separated with DL which uses human annotation to develop its own criteria/ algorithm for counting and classifying structures (Kim et al., 2015, 2017; Ning et al., 2020; Tyson et al., 2021; Wu et al., 2021; Zhang et al., 2021; Figure 4D). DL requires much more user input than machine learning, but it allows the neural network more freedom in algorithm development, however, implementing DL requires more computational skill and power than other methods making it more challenging to use for scientists with a basic level of computational skill. Finally, none of these automated detection algorithms are 100% accurate, so quality control and mathematical validation are critical.
The main applications of automated annotation include cell/synapse counting, connectivity analysis, and single cell morphological reconstruction. Counting cells (e.g., cell nuclei) is relatively simple due to their uniform shape and is often done using filter-based counting (Renier et al., 2016; Asan et al., 2021; Figure 4E). In fact, many ML and DL cell counting approaches will start with filter-based output and perform additional refinements (Kim et al., 2015; Renier et al., 2016; Newmaster et al., 2020; Wu et al., 2021). If the labeling is cytosolic, the DL based NeuroGPS tool may be employed to isolate the soma from the axon and dendritic tree (Quan et al., 2013; Figure 4D). The benefit of this approach is that it can be combined with more advanced connectivity and morphology analyses such as single cell reconstruction and tracing (Gong et al., 2013; Zheng et al., 2013; Economo et al., 2016, 2019; Han et al., 2018; Winnubst et al., 2019; Gouwens et al., 2020; Xu et al., 2021; Figures 4F,G). Single cell tracing can be accomplished in programs such as Allen’s Vaa3D which contains plug-ins utilizing Euclidean distance to identify the connected components of a skeletonized image (Peng et al., 2010; Friedmann et al., 2020). Other Vaa3D plug-ins such as Deep Neuron utilize deep learning to take tracing to the next level by annotating axons and dendrites as separate compartments within a single image (Zhou et al., 2018). Though simple filter-based methods have been used to quantify the density of axons in tracing experiments, these methods cannot assign a single axon to a single soma in images with densely packed structures. TrailMap and MIRACL use DL to trace back overlapping axons to their respective soma adding another level to connectivity analysis (Çiçek et al., 2016; Gerfen et al., 2018; Goubran et al., 2019; Friedmann et al., 2020; Li and Shen, 2020). In neural connectivity analysis, another interesting challenge is quantifying synapses as the size of synaptic puncta resides near the limit of light diffraction and synapses are densely packed along neural processes. To address this issue, ML and DL were again employed allowing researchers to map synapses across large three-dimensional regions, yet no study to date has looked at the whole brain completely due to the daunting data size and magnitude of the required analysis (Zhu et al., 2018; Cizeron et al., 2020; Curran et al., 2021).
Many of these algorithms can be modified and applied to other cell types within the nervous system as well. For example, tracing the cerebrovasculature has become a popular new frontier in 3D brain mapping as the densely packed microvessels of the brain and their connectivity patterns are deeply intertwined with neural structures (Blinder et al., 2013; Xiong et al., 2017; Schmid et al., 2019; Ji et al., 2021; Wu et al., 2021; Figure 4G). This complex system also presents a unique challenge requiring higher resolution imaging, precise image reconstruction, and connectivity analysis (Xiong et al., 2017; Kirst et al., 2020; Todorov et al., 2020). Recently, open source programs developed based on machine learning have been used to trace and skeletonize vasculature throughout the brain (Kirst et al., 2020; Todorov et al., 2020; Wu et al., 2021).
In summary, recently developed open source software and AI-based tools provide great opportunities to perform high throughput detection of various cell type features in high- resolution 3D datasets. As the focus of brain mapping expands beyond neurons, many new algorithms will become available to better analyze different cell type densities and morphologies.
5. Mapping Signals onto Standard Spatial Framework
Cell type signals from individual brains vary in quantity and spatial distribution. Moreover, each individual brain and its sub-regions can have different volumes and shapes (Toga and Thompson, 2001; Allen et al., 2008; Shimono, 2013; Janke and Ullmann, 2015; Lee et al., 2021). Therefore, reproducible analysis and interpretation of whole brain 3D data from multiple samples requires mapping onto a common coordinate framework. By aligning or registering individual samples onto a standardized annotated template brain (atlas), identified signals can be automatically assigned to anatomical areas in an unbiased way (Figure 5A). Moreover, using this spatial framework and mathematical deformation allows ROI volume to be calculated from each brain for more precise estimates of cell density per area (Kim et al., 2015, 2017; Newmaster et al., 2020). Here, we will discuss image registration tools and currently available atlas frameworks.
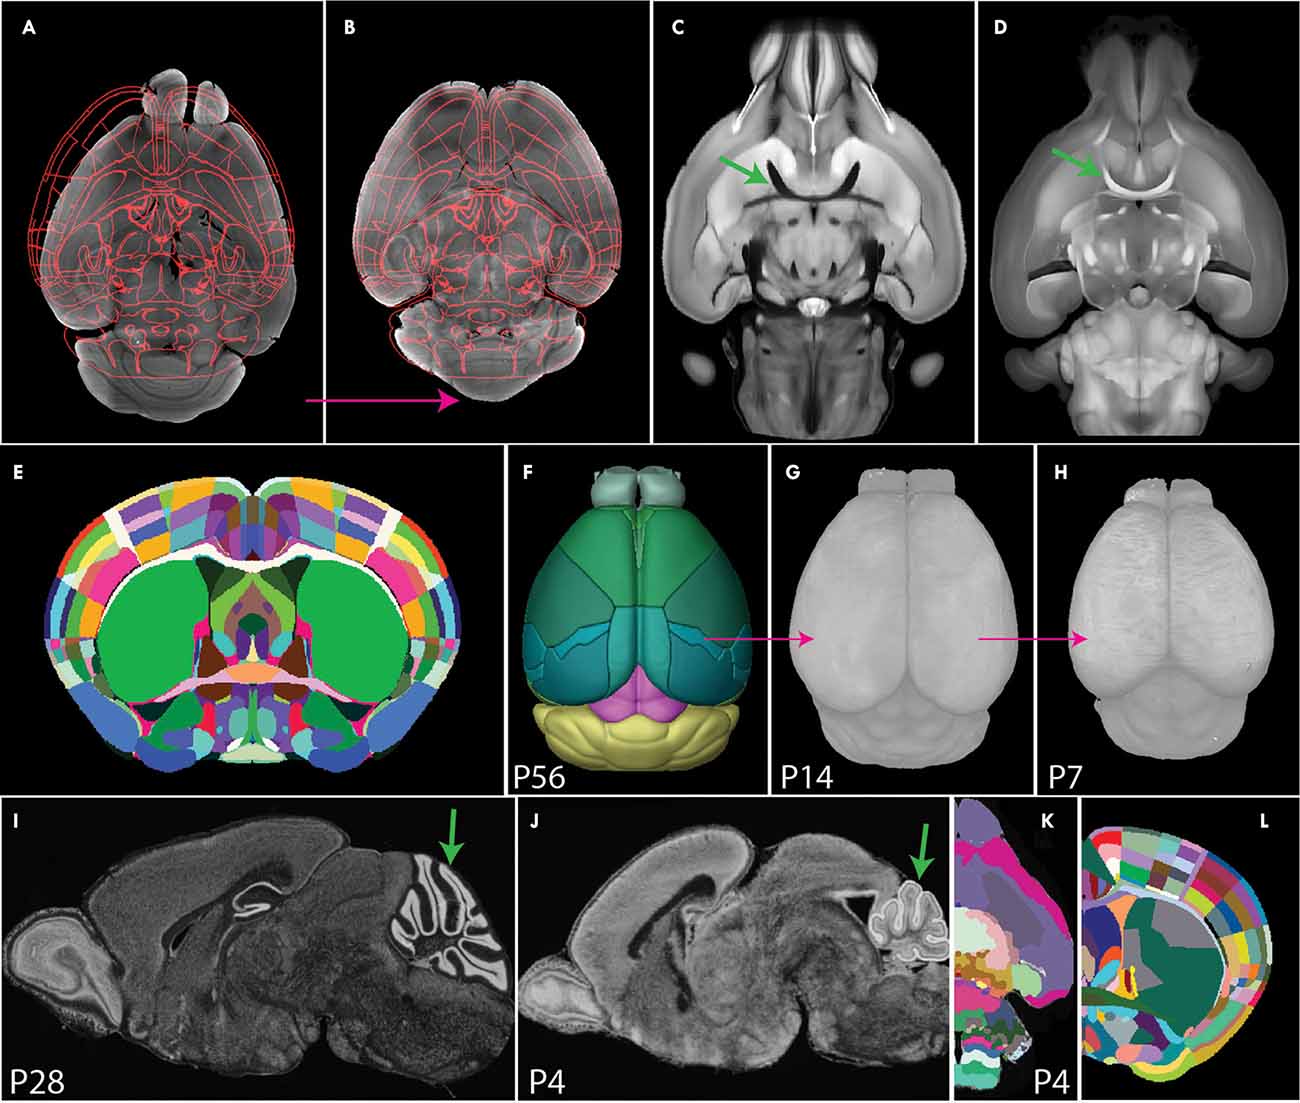
Figure 5. Image registration to a common coordinate framework. (A,B) Image registration transforms individual samples to align with an annotated template atlas (A), allowing detected signals to be assigned to anatomical labels (B). (C,D) Comparison of STPT (C) and SPIM (D) images. The STPT image has a characteristic intensity profile with dark white matter tracts (arrow in C), while SPIM has light white matter tracts (arrow in D). (E,F) The Allen CCF was generated by averaging many STPT images of adult mouse brains (E) and was annotated with smooth 3D labels (F). (G,H) 3D Developmental mouse brain atlases at postnatal day 14 (G) and 7 (H) based on STPT imaging via back registration and label importation. (I,J) Nissl staining sagittal image of P28 (I) and P4 mouse brain. Arrows highlight morphological differences in the cerebellum between the two ages. (K) P4 3D Developmental atlases derived from 2D annotations. (L) Franklin-Paxinos labels mapped onto the Allen CCF template with detailed segmentations in the dorsal striatum.
5.1. Image Registration
The process of aligning one image to another (e.g., registration) utilizes rigid, affine, and other non-linear transformations in varying combinations and implementations (e.g., algorithms) to achieve optimal image matching (Toga and Thompson, 2001; Klein et al., 2010; Avants et al., 2011, 2014; Beare et al., 2018; Balakrishnan et al., 2019; Figures 5A,B). Rigid registration is restricted to translation and rotation, while affine transformation allows scaling and sheering along all three axes with each pixel/voxel undergoing an identical transformation (Holden, 2008; Song et al., 2017). Other non-linear registration including elastic and diffeomorphic registration allows deformable rigid, scaling, and sheering to be applied to different parts of an image (Avants et al., 2008, 2011; Klein et al., 2010; Mansilla et al., 2020; Sun and Simon, 2021). Diffeomorphic registration has the most freedom as each pixel or voxel can be moved independently which can increase registration quality, but it is computationally expensive compared to rigid and affine registration methods (Avants et al., 2008, 2011; Lee et al., 2021). Therefore, the best alignment method combines these methods in a way that maximizes accuracy while minimizing computational time. Alignment accuracy can be evaluated by mathematical procedures that calculate how well intensity values align with common metrics such as cross correlation which maximizes the correlation between normalized intensity values and mutual information which matches features such as edges or intensity gradients (Andronache et al., 2008; Jiang et al., 2017; Bashiri et al., 2018). These methods can be further explored for specific use cases in Avants et al., 2011.
Preprocessing steps and registration can be performed using various open source programs like Elastix, Advanced Normalization Tools (ANTs), Insight Toolkit (ITK), and the Statistical Parametric Mapping (SPM) package (Avants et al., 2008, 2014; Klein et al., 2010; Kronman et al., 2020). Elastix is a Unix command line interface that efficiently applies rigid, affine, and elastic registration. This program has been used to register data to reference atlases and co-register labels between two differing adult mouse brain atlases (Ragan et al., 2012; Kim et al., 2015; Renier et al., 2016; Chon et al., 2019; Kirst et al., 2020; Newmaster et al., 2020; Son et al., 2020; Wu et al., 2021). ANTs is also a Unix interface based on registration tools from ITK which houses all of the described registration methods (Ibanez et al., 2002; Avants et al., 2014). ITK has been used to create mouse brain templates, register STPT samples to the Allen common coordinate framework, and perform a number of human studies making it broadly applicable in 3D image analysis (Kuan et al., 2015; Pichet Binette et al., 2021; Tustison et al., 2014; Wang et al., 2020; Whitesell et al., 2021). The SPM package, housed within MATLAB, is commonly used for co-registering and analyzing MRI data in human brain mapping studies including mapping of functional resting state networks (Friston et al., 2007; Kronman et al., 2020). Additional programs for registration include FSL (Jenkinson et al., 2012), AFNI (Cox, 1996), Fiji (Schindelin et al., 2012), Medical Image Registration Toolkit (Rueckert et al., 1999; Schnabel et al., 2001), and FreeSurfer (Reuter et al., 2010). Many of these packages have been wrapped together in command line or graphical user interface (GUI) tools for an easier user experience. For example, Nipype, an open source python tool, integrates ANTs, AFNI, SPM, FSL, and more, while BrainMaker and NeuroInfo, a pair of commercial packages, combine ITK and additional custom software in a GUI to perform image preprocessing and registration (Tappan et al., 2019). Most software is compatible with different 3D imaging data including human neuroimaging. However not all software is universally applicable across species, so additional plugins have been developed for commonly used preclinical models, such as SPMMouse, which allow SPM to be used with mouse brain data (Sawiak et al., 2009). A more comprehensive list of available software can be found at www.nitrc.org.
A major conundrum in the imaging field is cross-modality registration because current registration methods rely on intensity contrast to guide alignment. For example, STPT and LSFM imaging with iDISCO based cleared samples have different contrast profiles such as fiber tracks being labeled as dark and light contrast, respectively (Figures 5C,D, arrows). Therefore, attempting to align light and dark regions between images may result in erroneous registration. One solution is to use DL networks trained by expertly aligned multimodal data to register novel data (Fu et al., 2020). Many open source packages are presently available to explore DL approaches to medical image registration, and improving DL registration will increase the quality and applicability of image registration as image resolution rises and whole brain imaging of larger primates, including humans, evolves (Yangt et al., 2017; Balakrishnan et al., 2019; Mok and Chung, 2020; Wang and Zhang, 2020). Future efforts in neuroimaging will require innovative neuro-engineering solutions to reduce the computational resources and time required to register large images. Further information about image registration can be found in the following review articles: (Viergever et al., 2001, 2016; Hess et al., 2018; Fu et al., 2020).
5.2. Atlases as Common Spatial Framework
An atlas defines anatomical boundaries that can be used to interpret target signals in an anatomical context. Historically, brain atlases were manually annotated on 2D images by expert neuroanatomists based on histological features. These atlases exist for many species including mice (Kaufman, 1992; Thompson et al., 2014; Paxinos and Franklin, 2019), rats (Paxinos and Watson, 2006), non-human primates (Paxinos et al., 2000; Palazzi and Bordier, 2008), and humans (Mai et al., 2008; Ding et al., 2016). However, limitations of sparse labeling, uni-planar views, and tissue distortion render these atlases sub-optimal for application to 3D brain mapping. Today, 3D digital brain atlases are available in a few selected species including humans (Mazziotta et al., 2001; Amunts et al., 2020) non-human primates (Liu et al., 2018; Woodward et al., 2018), and mice (Dorr et al., 2008; Chuang et al., 2011; Szulc et al., 2015; Young et al., 2021). Unfortunately, many of these atlases are often based on only one sample, lack detailed segmentation, and/or are subject to modality-specific tissue distortion. The state-of-the-art atlas used for localizing 3D whole mouse brain signals is the Allen common coordinate framework (CCF), an STPT based atlas comprised of 1,675 samples averaged together with highly detailed and smoothed 3D labels (Wang et al., 2020; Figures 5C,E,F).
In contrast to the detailed Allen CCF for the adult brain, 3D CCFs for neurodevelopmental stages are scarce which presents a major hurdle to understanding the developmental trajectories of different cell types in normal and pathological conditions (Puelles et al., 2013; Levitt and Veenstra-VanderWeele, 2015). Though registration tools are applicable at any age, they require size and shape matching templates. To generate such templates for early post-natal brain mapping, we previously created intensity averaged STPT brain templates by registering more than 10 samples onto one best brain at each postnatal day (P) 7, 14, 21, and 28. These 3D templates were annotated by back registering the Allen CCF 3D labels to each template in sequence from oldest to youngest using Elastix. These brains were successfully used to quantify oxytocin receptor cell density across the whole mouse brain in development (Newmaster et al., 2020; Figures 5F–H, pink arrows show back registration). While back registration is a common approach to developmental brain mapping, it is not the best approach as ROIs may undergo differential rates of development depending on their embryonic origin (Zhang et al., 2005; Chuang et al., 2011; Figures 5I,J, arrows for the cerebellum). A more biologically sound method for creating developmental atlases is to create age-specific digitized templates or reference brains for developmental time points with anatomical labels based on neurodevelopmental perspective (Puelles and Ferran, 2012; Puelles et al., 2013; Thompson et al., 2014). Recent advances have attempted to convert 2D developmental atlases to 3D atlases, but these converted 3D anatomical labels still contain jagged surfaces due to interpolation errors (Young et al., 2021; Figure 5K). Therefore, neuroscience is still in great need of accurately annotated 3D developmental atlases that can be applied to seamlessly map and interpret datasets from different embryonic/early postnatal ages and imaging modalities.
Current 3D atlases also lack cross-modality capabilities. The current gold standard, the Allen CCF, is obtained from STPT images which does not align well with datasets from other imaging modalities (e.g., light-sheet fluorescence microscopy). To address this gap, a light-sheet optimized template brain was developed by averaging light-sheet images and importing Allen labels to this space (Perens et al., 2021). However, such a template is likely to have volume distortion specific to the chosen tissue clearing method. Thus, the ideal spatial template should come from an imaging modality with minimal distortion such as high resolution, in skull, ex vivo MRI. Moving forward, future atlases should be based on distortion-free template space while accommodating multiple imaging modalities, allowing for cross-modality comparison of datasets from any experimental setup.
6. Data Sharing and Federation
Whole brain mapping data contains rich anatomical and functional data that one single publication cannot capture. Thus, data sharing has become increasingly important to facilitate further analysis of these hard-earned datasets. The FAIR data principles describe guidelines for making digital data findable, accessible, interoperable, and reusable (Wilkinson et al., 2016). The FAIR principles focus on the proper use of metadata to describe digital datasets in a way that is readable by both computers and human scientists optimizing collaboration and data reuse. The International Neuroinformatics Coordinating Facility (INCF) has endorsed the use of the FAIR principles and added more specifications (Abrams et al., 2021). For instance, in the United States, all microscopy data collected as part of a BRAIN Initiative grant must be shared via the Brain Imaging Library (BIL; Benninger et al., 2020). The BIL will soon require a list of essential metadata for 3D BRAIN Microcopy for uploaded datasets including data contributors, descriptors, funders, instruments, images, specimens, and related publications (Ropelewski et al., 2021). Data from omics experiments, electrophysiology, MRI, and electron microscopy also have their own respective archives as described by the NIH Notice of Data Sharing Policy for the BRAIN Initiative allowing this data to be combined with imaging (National Institutes of Health, 2019). The Human Brain Project, EBRAINS, and INCF all lay out similar requirements across the world (Kleven and Bjerke, 2021). In addition to public databases, web visualization has been a useful data sharing tool that avoids the need to download large-scale data. For instance, we created a website4 where high-resolution datasets of oxytocin receptor expression, the oxytocin neuron wiring diagram, and full brain vasculature can be easily visualized. Allen Institute of Brain Sciences also has a large repository of brain data on the Allen Brain Map website5.
With the huge influx of large-scale mapping datasets, scientists need to consider how to confederate different data from individual research groups for integrative analysis. The main barrier to developing a brain mapping community with highly reproducible and shareable data lies in the existence of multiple atlases with conflicting segmentation and ontology (Chon et al., 2019; Figure 5L). As mentioned before, comparison between different datasets requires registration into a standardized common coordinate framework with a coherent anatomical label system like the Allen CCFv3 (Muñoz-Castañeda et al., 2020; Wang et al., 2020; BRAIN Initiative Cell Census Network (BICCN), 2021; Takata et al., 2021). To further facilitate data confederation, there is a significant need to have a standardized anatomical nomenclature system within and across species. Anatomical labels are subject to how different anatomists select delineation criteria from their knowledge, so putting different anatomical systems in a single common space can allow neuroscientists to interpret their data in a more streamlined and coherent way. For example, we recently integrated Franklin-Paxinos atlas labels onto the Allen CCF and added detailed segmentation in the dorsal striatum (Chon et al., 2019). This way, data can be mapped onto the Allen CCF, but users can choose different atlas labels to interpret their data.
Finally, as brain mapping advances, standardized neuroanatomy terminology across species will be critical to cross-species comparison and evolutionary studies. The Neuroscience Lexicon6 and the Uberon ontologies database7 were developed as resources to track neuroanatomical structure names and concepts, incorporating them into a structured knowledge management framework with unique identifiers for each concept (Larson and Martone, 2013; Haendel et al., 2014; Miller et al., 2020; Yuste et al., 2020). Standardized anatomical labels based on current data will facilitate translational research by providing a common language between clinical and preclinical work. In summary, data standardization and confederation can unlock the true power of community-driven neuroscience approaches to gain a comprehensive understanding of brain organization in many species.
Conclusion
Whole brain mapping at the cellular resolution is becoming increasingly popular and important to gain a better understanding of cellular organizational principles across the whole brain. When done correctly, we can see the cellular composition and arborization across many brain regions, in essence allowing us to see both the individual “trees” within the context of the “forest”. However, brain mapping requires optimization at multiple steps with experiment-specific considerations. Our review provides basic information on each of these steps and highlights major considerations and resources to facilitate the optimization of brain mapping experiments. Finally, making mapping data more widely accessible will facilitate a new era in neuroscience where collaboration and data sharing can provide enormous synergy and impact to facilitate the advance of neuroscience research.
Author Contributions
KTN and YK conceptualized the manuscript. KTN wrote the initial manuscript draft and figures and developed the manuscript further with other authors (FAK, YW, YK). YK handled the funding and critically revised the manuscript. All authors contributed to the article and approved the submitted version.
Funding
This publication was made possible by an NIH grant R01MH116176, R01NS108407, RF1MH12460501 to YK. Its contents are solely the responsibility of the authors and do not necessarily represent the views of the funding agency.
Conflict of Interest
The authors declare that the research was conducted in the absence of any commercial or financial relationships that could be construed as a potential conflict of interest.
Publisher’s Note
All claims expressed in this article are solely those of the authors and do not necessarily represent those of their affiliated organizations, or those of the publisher, the editors and the reviewers. Any product that may be evaluated in this article, or claim that may be made by its manufacturer, is not guaranteed or endorsed by the publisher.
Acknowledgments
We used BioRender.com to create parts of illustration in Figures 1–3. We thank Rebecca Betty and Hannah Bennett for improving the manuscript.
Footnotes
- ^ https://connectivity.brain-map.org/transgenic
- ^ www.gensat.org
- ^ https://neuroscienceblueprint.nih.gov/resources-tools/blueprint-resources-tools-library/cre-driver-network
- ^ https://kimlab.io/
- ^ https://portal.brain-map.org/
- ^ https://scicrunch.org/scicrunch/interlex/dashboard
- ^ https://www.ebi.ac.uk/ols/ontologies/uberon
References
Abe, H., Tani, T., Mashiko, H., Kitamura, N., Miyakawa, N., Mimura, K., et al. (2017). 3D reconstruction of brain section images for creating axonal projection maps in marmosets. J. Neurosci. Methods 286, 102–113. doi: 10.1016/j.jneumeth.2017.04.016
Abrams, M. B., Bjaalie, J. G., Das, S., Egan, G. F., Ghosh, S. S., Goscinski, W. J., et al. (2021). A standards organization for open and FAIR neuroscience: the international neuroinformatics coordinating facility. Neuroinformatics . [Online ahead of print]. doi: 10.1007/s12021-020-09509-0
Allen, J. S., Bruss, J., Mehta, S., Grabowski, T., Brown, C. K., and Damasio, H. (2008). Effects of spatial transformation on regional brain volume estimates. NeuroImage 42, 535–547. doi: 10.1016/j.neuroimage.2008.05.047
Amato, S. P., Pan, F., Schwartz, J., and Ragan, T. M. (2016). Whole brain imaging with serial two-photon tomography. Front. Neuroanat. 10:31. doi: 10.3389/fnana.2016.00031
Amunts, K., Mohlberg, H., Bludau, S., and Zilles, K. (2020). Julich-brain: A 3D probabilistic atlas of the human brain’s cytoarchitecture. Science 369, 988–992. doi: 10.1126/science.abb4588
Andronache, A., von Siebenthal, M., Székely, G., and Cattin, Ph. (2008). Non-rigid registration of multi-modal images using both mutual information and cross-correlation. Med. Image Anal. 12, 3–15. doi: 10.1016/j.media.2007.06.005
Arganda-Carreras, I., Kaynig, V., Rueden, C., Eliceiri, K. W., Schindelin, J., Cardona, A., et al. (2017). Trainable Weka Segmentation: a machine learning tool for microscopy pixel classification. Bioinformatics 33, 2424–2426. doi: 10.1093/bioinformatics/btx180
Asan, L., Falfán-Melgoza, C., Beretta, C. A., Sack, M., Zheng, L., Weber-Fahr, W., et al. (2021). Cellular correlates of gray matter volume changes in magnetic resonance morphometry identified by two-photon microscopy. Sci. Rep. 11:4234. doi: 10.1038/s41598-021-83491-8
Avants, B. B., Epstein, C. L., Grossman, M., and Gee, J. C. (2008). Symmetric diffeomorphic image registration with cross-correlation: evaluating automated labeling of elderly and neurodegenerative brain. Med. Image Anal. 12, 26–41. doi: 10.1016/j.media.2007.06.004
Avants, B. B., Tustison, N. J., Song, G., Cook, P. A., Klein, A., and Gee, J. C. (2011). A reproducible evaluation of ANTs similarity metric performance in brain image registration. Neuroimage 54, 2033–2044. doi: 10.1016/j.neuroimage.2010.09.025
Avants, B. B., Tustison, N. J., Stauffer, M., Song, G., Wu, B., and Gee, J. C. (2014). The Insight ToolKit image registration framework. Front. Neuroinformat. 8:44. doi: 10.3389/fninf.2014.00044
Balakrishnan, G., Zhao, A., Sabuncu, M. R., Guttag, J., and Dalca, A. V. (2019). VoxelMorph: a learning framework for deformable medical image registration. IEEE Trans. Med. Imaging 38, 1788–1800. doi: 10.1109/TMI.2019.2897538
Bashiri, F. S., Baghaie, A., Rostami, R., Yu, Z., and D’Souza, R. M. (2018). Multi-modal medical image registration with full or partial data: a manifold learning approach. J. Imaging 5:5. doi: 10.3390/jimaging5010005
Beare, R., Lowekamp, B., and Yaniv, Z. (2018). Image segmentation, registration and characterization in R with simpleITK. J. Stat. Softw. 86:8. doi: 10.18637/jss.v086.i08
Bedbrook, C. N., Deverman, B. E., and Gradinaru, V. (2018). Viral strategies for targeting the central and peripheral nervous systems. Ann. Rev. Neurosci. 41, 323–348. doi: 10.1146/annurev-neuro-080317-062048
Belgard, T. G., Marques, A. C., Oliver, P. L., Abaan, H. O., Sirey, T. M., Hoerder-Suabedissen, A., et al. (2011). A transcriptomic atlas of mouse neocortical layers. Neuron 71, 605–616. doi: 10.1016/j.neuron.2011.06.039
Benavidez, N. L., Bienkowski, M. S., Zhu, M., Garcia, L. H., Fayzullina, M., Gao, L., et al. (2021). Organization of the inputs and outputs of the mouse superior colliculus. Nat. Commun. 12:4004. doi: 10.1038/s41467-021-24241-2
Benninger, K., Hood, G., Simmel, D., Tuite, L., Wetzel, A., Ropelewski, A., et al. (2020). Cyberinfrastructure of a multi-petabyte microscopy resource for neuroscience research. Pract. Exp. Adv. Res. Comput. 1–7. doi: 10.1145/3311790.3396653
Berg, S., Kutra, D., Kroeger, T., Straehle, C. N., Kausler, B. X., Haubold, C., et al. (2019). ilastik: interactive machine learning for (bio)image analysis. Nat. Methods 16, 1226–1232. doi: 10.1038/s41592-019-0582-9
Bienkowski, M. S., Bowman, I., Song, M. Y., Gou, L., Ard, T., Cotter, K., et al. (2018). Integration of gene expression and brain-wide connectivity reveals the multiscale organization of mouse hippocampal networks. Nat. Neurosci. 21, 1628–1643. doi: 10.1038/s41593-018-0241-y
Blinder, P., Tsai, P. S., Kaufhold, J. P., Knutsen, P. M., Suhl, H., and Kleinfeld, D. (2013). The cortical angiome: an interconnected vascular network with noncolumnar patterns of blood flow. Nat. Neurosci. 16, 889–897. doi: 10.1038/nn.3426
Bria, A., and Iannello, G. (2012). TeraStitcher—A tool for fast automatic 3D-stitching of teravoxel-sized microscopy images. BMC Bioinform. 13:316. doi: 10.1186/1471-2105-13-316
BRAIN Initiative Cell Census Network (BICCN). (2021). A multimodal cell census and atlas of the mammalian primary motor cortex. Nature 598, 86–102. doi: 10.1038/s41586-021-03950-0
Callaway, E. M., and Luo, L. (2015). Monosynaptic circuit tracing with glycoprotein-deleted rabies viruses. J. Neurosci. 35, 8979–8985. doi: 10.1523/JNEUROSCI.0409-15.2015
Cembrowski, M. S., Phillips, M. G., DiLisio, S. F., Shields, B. C., Winnubst, J., Chandrashekar, J., et al. (2018). Dissociable structural and functional hippocampal outputs via distinct subiculum cell classes. Cell 173, 1280–1292.e18. doi: 10.1016/j.cell.2018.03.031
Chan, K. Y., Jang, M. J., Yoo, B. B., Greenbaum, A., Ravi, N., Wu, W.-L., et al. (2017). Engineered AAVs for efficient noninvasive gene delivery to the central and peripheral nervous systems. Nat. Neurosci. 20, 1172–1179. doi: 10.1038/nn.4593
Chon, U., Vanselow, D. J., Cheng, K. C., and Kim, Y. (2019). Enhanced and unified anatomical labeling for a common mouse brain atlas. Nat. Commun. 10:5067. doi: 10.1038/s41467-019-13057-w
Chuang, N., Mori, S., Yamamoto, A., Jiang, H., Ye, X., Xu, X., et al. (2011). An MRI-based atlas and database of the developing mouse brain. Neuroimage 54, 80–89. doi: 10.1016/j.neuroimage.2010.07.043
Chung, K., and Deisseroth, K. (2013). CLARITY for mapping the nervous system. Nat. Methods 10, 508–513. doi: 10.1038/nmeth.2481
Chung, K., Wallace, J., Kim, S.-Y., Kalyanasundaram, S., Andalman, A. S., Davidson, T. J., et al. (2013). Structural and molecular interrogation of intact biological systems. Nature 497, 332–337. doi: 10.1038/nature12107
Çiçek, Ö., Abdulkadir, A., Lienkamp, S. S., Brox, T., and Ronneberger, O. (2016). 3D U-Net: learning dense volumetric segmentation from sparse annotation. arXiv [Preprint]. doi: 10.1007/978-3-319-46723-8_49
Cizeron, M., Qiu, Z., Koniaris, B., Gokhale, R., Komiyama, N. H., Fransén, E., et al. (2020). A brain-wide atlas of synapses across the mouse lifespan. Science 369, 270–275. doi: 10.1126/science.aba3163
Cong, W., Shi, Y., Qi, Y., Wu, J., Gong, L., and He, M. (2020). Viral approaches to study the mammalian brain: lineage tracing, circuit dissection and therapeutic applications. J. Neurosci. Methods 335:108629. doi: 10.1016/j.jneumeth.2020.108629
Corsetti, S., Gunn-Moore, F., and Dholakia, K. (2019). Light sheet fluorescence microscopy for neuroscience. J. Neurosci. Methods 319, 16–27. doi: 10.1016/j.jneumeth.2018.07.011
Cox, R. W. (1996). AFNI: Software for analysis and visualization of functional magnetic resonance neuroimages. Comput. Biomed. Res. 29, 162–173. doi: 10.1006/cbmr.1996.0014
Curran, O. E., Qiu, Z., Smith, C., and Grant, S. G. N. (2021). A single-synapse resolution survey of PSD95-positive synapses in twenty human brain regions. Eur. J. Neurosci. 54, 6864–6881. doi: 10.1111/ejn.14846
Daigle, T. L., Madisen, L., Hage, T. A., Valley, M. T., Knoblich, U., Larsen, R. S., et al. (2018). A suite of transgenic driver and reporter mouse lines with enhanced brain cell type targeting and functionality. Cell 174, 465–480.e22. doi: 10.1016/j.cell.2018.06.035
Debbache, J., Parfejevs, V., and Sommer, L. (2018). Cre-driver lines used for genetic fate mapping of neural crest cells in the mouse: an overview. Genesis. 56, e23105. doi: 10.1002/dvg.23105"
Diel, E. E., Lichtman, J. W., and Richardson, D. S. (2020). Tutorial: avoiding and correcting sample-induced spherical aberration artifacts in 3D fluorescence microscopy. Nat. Protoc. 15, 2773–2784. doi: 10.1038/s41596-020-0360-2
Ding, S.-L., Royall, J. J., Sunkin, S. M., Ng, L., Facer, B. A. C., Lesnar, P., et al. (2016). Comprehensive cellular-resolution atlas of the adult human brain. J. Comp. Neurol. 524, 3127–3481. doi: 10.1002/cne.24080
Dodt, H.-U., Leischner, U., Schierloh, A., Jährling, N., Mauch, C. P., Deininger, K., et al. (2007). Ultramicroscopy: three-dimensional visualization of neuronal networks in the whole mouse brain. Nat. Methods 4, 331–336. doi: 10.1038/nmeth1036
Dorr, A. E., Lerch, J. P., Spring, S., Kabani, N., and Henkelman, R. M. (2008). High resolution three-dimensional brain atlas using an average magnetic resonance image of 40 adult C57Bl/6J mice. Neuroimage 42, 60–69. doi: 10.1016/j.neuroimage.2008.03.037
Economo, M. N., Clack, N. G., Lavis, L. D., Gerfen, C. R., Svoboda, K., Myers, E. W., et al. (2016). A platform for brain-wide imaging and reconstruction of individual neurons. eLife 5:e10566. doi: 10.7554/eLife.10566
Economo, M. N., Winnubst, J., Bas, E., Ferreira, T. A., and Chandrashekar, J. (2019). Single-neuron axonal reconstruction: The search for a wiring diagram of the brain. J. Comp. Neurol. 527, 2190–2199. doi: 10.1002/cne.24674
Elisa, Z., Toon, B., De Smedt, S. C., Katrien, R., Kristiaan, N., and Kevin, B. (2018). Technical implementations of light sheet microscopy. Microsc. Res. Tech. 81, 941–958. doi: 10.1002/jemt.22981
Farago, A. F., Awatramani, R. B., and Dymecki, S. M. (2006). Assembly of the brainstem cochlear nuclear complex is revealed by intersectional and subtractive genetic fate maps. Neuron 50, 205–218. doi: 10.1016/j.neuron.2006.03.014
Foster, N. N., Korobkova, L., Garcia, L., Gao, L., Becerra, M., Sherafat, Y., et al. (2020). The mouse cortico-basal ganglia-thalamic network. bioRxiv [Preprint]. doi: 10.1101/2020.10.06.326876
Friedmann, D., Pun, A., Adams, E. L., Lui, J. H., Kebschull, J. M., Grutzner, S. M., et al. (2020). Mapping mesoscale axonal projections in the mouse brain using a 3D convolutional network. Proc. Natl. Acad. Sci. U S A 117, 11068–11075. doi: 10.1073/pnas.1918465117
Friston, K. J., Ashburner, J., Kiebel, S., Nichols, T., and Penny, W. (2007). Statistical Parametric Mapping: The Analysis of Funtional Brain Images. 1st Edn. New York, NY: Elsevier/Academic Press.
Fu, Y., Lei, Y., Wang, T., Curran, W. J., Liu, T., and Yang, X. (2020). Deep learning in medical image registration: A review. Phys. Med. Biol. 65:20TR01. doi: 10.1088/1361-6560/ab843e
Fuzik, J., Zeisel, A., Máté, Z., Calvigioni, D., Yanagawa, Y., Szabó, G., et al. (2016). Integration of electrophysiological recordings with single-cell RNA-seq data identifies neuronal subtypes. Nat. Biotechnol. 34, 175–183. doi: 10.1038/nbt.3443
Gerfen, C. R., Economo, M. N., and Chandrashekar, J. (2018). Long distance projections of cortical pyramidal neurons. J. Neurosci. Res. 96, 1467–1475. doi: 10.1002/jnr.23978
Gerfen, C. R., Paletzki, R., and Heintz, N. (2013). GENSAT BAC Cre-recombinase driver lines to study the functional organization of cerebral cortical and basal ganglia circuits. Neuron 80, 1368–1383. doi: 10.1016/j.neuron.2013.10.016
Gómez, H. F., Hodel, L., Michos, O., and Iber, D. (2021). Morphological study of embryonic Chd8+/– mouse brains using light-sheet microscopy. BMC Res. Notes 14:23. doi: 10.1186/s13104-020-05436-0
Gong, S., Doughty, M., Harbaugh, C. R., Cummins, A., Hatten, M. E., Heintz, N., et al. (2007). Targeting cre recombinase to specific neuron populations with bacterial artificial chromosome constructs. J. Neurosci. 27, 9817–9823. doi: 10.1523/JNEUROSCI.2707-07.2007
Gong, H., Zeng, S., Yan, C., Lv, X., Yang, Z., Xu, T., et al. (2013). Continuously tracing brain-wide long-distance axonal projections in mice at a one-micron voxel resolution. Neuroimage 74, 87–98. doi: 10.1016/j.neuroimage.2013.02.005
Goubran, M., Leuze, C., Hsueh, B., Aswendt, M., Ye, L., Tian, Q., et al. (2019). Multimodal image registration and connectivity analysis for integration of connectomic data from microscopy to MRI. Nat. Commun. 10:5504. doi: 10.1038/s41467-019-13374-0
Gouwens, N. W., Sorensen, S. A., Baftizadeh, F., Budzillo, A., Lee, B. R., Jarsky, T., et al. (2020). Integrated morphoelectric and transcriptomic classification of cortical GABAergic cells. Cell 183, 935–953.e19. doi: 10.1016/j.cell.2020.09.057
Graybuck, L. T., Daigle, T. L., Sedeño-Cortés, A. E., Walker, M., Kalmbach, B., Lenz, G. H., et al. (2020). Enhancer viruss and a transgenic platform for combinatorial cell subclass-specific labeling. bioRxiv [Preprint]. doi: 10.1101/525014
Haendel, M. A., Balhoff, J. P., Bastian, F. B., Blackburn, D. C., Blake, J. A., Bradford, Y., et al. (2014). Unification of multi-species vertebrate anatomy ontologies for comparative biology in Uberon. J. Biomed. Semantics 5:21. doi: 10.1186/2041-1480-5-21
Haery, L., Deverman, B. E., Matho, K. S., Cetin, A., Woodard, K., Cepko, C., et al. (2019). Adeno-associated virus technologies and methods for targeted neuronal manipulation. Front. Neuroanat. 13:93. doi: 10.3389/fnana.2019.00093
Han, Y., Kebschull, J. M., Campbell, R. A. A., Cowan, D., Imhof, F., Zador, A. M., et al. (2018). The logic of single-cell projections from visual cortex. Nature 556, 51–56. doi: 10.1038/nature26159
Harris, J. A., Hirokawa, K. E., Sorensen, S. A., Gu, H., Mills, M., Ng, L. L., et al. (2014). Anatomical characterization of Cre driver mice for neural circuit mapping and manipulation. Front. Neural Circuits 8:76. doi: 10.3389/fncir.2014.00076
Harris, J. A., Mihalas, S., Hirokawa, K. E., Whitesell, J. D., Choi, H., Bernard, A., et al. (2019). Hierarchical organization of cortical and thalamic connectivity. Nature 575, 195–202. doi: 10.1038/s41586-019-1716-z
He, M., Tucciarone, J., Lee, S., Nigro, M. J., Kim, Y., Levine, J. M., et al. (2016). Strategies and tools for combinatorial targeting of GABAergic neurons in mouse cerebral cortex. Neuron 91, 1228–1243. doi: 10.1016/j.neuron.2016.08.021
Hess, A., Hinz, R., Keliris, G. A., and Boehm-Sturm, P. (2018). On the usage of brain atlases in neuroimaging research. Mol. Imaging Biol. 20, 742–749. doi: 10.1007/s11307-018-1259-y
Hillman, E. M. C., Voleti, V., Li, W., and Yu, H. (2019). Light-Sheet Microscopy in Neuroscience. Annu. Rev. Neurosci. 42, 295–313. doi: 10.1146/annurev-neuro-070918-050357
Hintiryan, H., Foster, N. N., Bowman, I., Bay, M., Song, M. Y., Gou, L., et al. (2016). The mouse cortico-striatal projectome. Nat. Neurosci. 19, 1100–1114. doi: 10.1038/nn.4332
Holden, M. (2008). A review of geometric transformations for nonrigid body registration. IEEE Trans. Med. Imaging 27, 111–128. doi: 10.1109/TMI.2007.904691
Hörl, D., Rojas Rusak, F., Preusser, F., Tillberg, P., Randel, N., Chhetri, R. K., et al. (2019). BigStitcher: reconstructing high-resolution image datasets of cleared and expanded samples. Nat. Methods 16, 870–874. doi: 10.1038/s41592-019-0501-0
Huang, L., Chen, Y., Jin, S., Lin, L., Duan, S., Si, K., et al. (2021). Organizational principles of amygdalar input-output neuronal circuits. Mol. Psychiatry . [Online ahead of print]. doi: 10.1038/s41380-021-01262-3
Ibanez, L., Ng, L., Gee, J., and Aylward, S. (2002). Registration patterns: The generic framework for image registration of the insight toolkit.Proc. IEEE Int. Symp. Biomed. Imaging 345–348. doi: 10.1109/ISBI.2002.1029264
Isaacson, J. S., and Scanziani, M. (2011). How inhibition shapes cortical activity. Neuron 72, 231–243. doi: 10.1016/j.neuron.2011.09.027
Janke, A. L., and Ullmann, J. F. P. (2015). Robust methods to create ex vivo minimum deformation atlases for brain mapping. Methods 73, 18–26. doi: 10.1016/j.ymeth.2015.01.005
Jenkinson, M., Beckmann, C. F., Behrens, T. E. J., Woolrich, M. W., and Smith, S. M. (2012). FSL. Neuroimage 62, 782–790. doi: 10.1016/j.neuroimage.2011.09.015
Jensen, K. H. R., and Berg, R. W. (2017). Advances and perspectives in tissue clearing using CLARITY. J. Chem. Neuroanat. 86, 19–34. doi: 10.1016/j.jchemneu.2017.07.005
Jeong, M., Kim, Y., Kim, J., Ferrante, D. D., Mitra, P. P., Osten, P., et al. (2016). Comparative three-dimensional connectome map of motor cortical projections in the mouse brain. Sci. Rep. 6:20072. doi: 10.1038/srep20072
Ji, X., Ferreira, T., Friedman, B., Liu, R., Liechty, H., Bas, E., et al. (2021). Brain microvasculature has a common topology with local differences in geometry that match metabolic load. Neuron 109, 1168–1187.e13. doi: 10.1016/j.neuron.2021.02.006
Jiang, Y., Zheng, Y., Hou, S., Chang, Y., and Gee, J. (2017). Multimodal image alignment via linear mapping between feature modalities. J. Healthc. Eng. 2017:8625951. doi: 10.1155/2017/8625951
Josh Huang, Z., and Zeng, H. (2013). Genetic approaches to neural circuits in the mouse. Annu. Rev. Neurosci. 36, 183–215. doi: 10.1146/annurev-neuro-062012-170307
Junyent, F., and Kremer, E. J. (2015). CAV-2—Why a canine virus is a neurobiologist’s best friend. Curr. Opin. Pharmacol. 24, 86–93. doi: 10.1016/j.coph.2015.08.004
Kanari, L., Ramaswamy, S., Shi, Y., Morand, S., Meystre, J., Perin, R., et al. (2019). Objective morphological classification of neocortical pyramidal cells. Cereb. Cortex 29, 1719–1735. doi: 10.1093/cercor/bhy339
Kim, M. S., Ahn, J. H., Mo, J. E., Song, H. Y., Cheon, D., Yoo, S. H., et al. (2021). Optimizing tissue clearing and imaging methods for human brain tissue. J. Int. Med. Res. 49:3000605211001729. doi: 10.1177/03000605211001729
Kim, J. C., and Dymecki, S. M. (2009). Genetic fate-mapping approaches: new means to explore the embryonic origins of the cochlear nucleus. Methods Mol. Biol. 493, 65–85. doi: 10.1007/978-1-59745-523-7_5
Kim, Y., Venkataraju, K. U., Pradhan, K., Mende, C., Taranda, J., Turaga, S. C., et al. (2015). Mapping social behavior-induced brain activation at cellular resolution in the mouse. Cell Rep. 10, 292–305. doi: 10.1016/j.celrep.2014.12.014
Kim, Y., Yang, G. R., Pradhan, K., Venkataraju, K. U., Bota, M., García Del Molino, L. C., et al. (2017). Brain-wide maps reveal stereotyped cell-type-based cortical architecture and subcortical sexual dimorphism. Cell 171, 456–469.e22. doi: 10.1016/j.cell.2017.09.020
Kirst, C., Skriabine, S., Vieites-Prado, A., Topilko, T., Bertin, P., Gerschenfeld, G., et al. (2020). Mapping the fine-scale organization and plasticity of the brain vasculature. Cell 180, 780–795.e25. doi: 10.1016/j.cell.2020.01.028
Klein, S., Staring, M., Murphy, K., Viergever, M. A., and Pluim, J. P. W. (2010). elastix: a toolbox for intensity-based medical image registration. IEEE Trans. Med. Imaging 29, 196–205. doi: 10.1109/TMI.2009.2035616
Kleven, H., and Bjerke, I. E. (2021). The Critical Window for Becoming a FAIR Researcher—News. Available online at: https://ebrains.eu/news/critical-window-fair-researcher/.
Kreshuk, A., and Zhang, C. (2019). Machine learning: advanced image segmentation using ilastik. Methods Mol. Biol. 2040, 449–463. doi: 10.1007/978-1-4939-9686-5_21
Kronman, C. A., Kern, K. L., Nauer, R. K., Dunne, M. F., Storer, T. W., and Schon, K. (2020). Cardiorespiratory fitness predicts effective connectivity between the hippocampus and default mode network nodes in young adults. Hippocampus 30, 526–541. doi: 10.1002/hipo.23169
Kuan, L., Li, Y., Lau, C., Feng, D., Bernard, A., Sunkin, S. M., et al. (2015). Neuroinformatics of the allen mouse brain connectivity atlas. Methods 73, 4–17. doi: 10.1016/j.ymeth.2014.12.013
Lai, H. M., Liu, A. K. L., Ng, H. H. M., Goldfinger, M. H., Chau, T. W., DeFelice, J., et al. (2018). Next generation histology methods for three-dimensional imaging of fresh and archival human brain tissues. Nat. Commun. 9:1066. doi: 10.1038/s41467-018-03359-w
Lanciego, J. L., and Wouterlood, F. G. (2020). Neuroanatomical tract-tracing techniques that did go viral. Brain Struct. Funct. 225, 1193–1224. doi: 10.1007/s00429-020-02041-6
Larson, S. D., and Martone, M. E. (2013). NeuroLex.org: an online framework for neuroscience knowledge. Front. Neuroinform. 7:18. doi: 10.3389/fninf.2013.00018
Lee, B. C., Lin, M. K., Fu, Y., Hata, J., Miller, M. I., and Mitra, P. P. (2021). Multimodal cross-registration and quantification of metric distortions in marmoset whole brain histology using diffeomorphic mappings. J. Comp. Neurol. 529, 281–295. doi: 10.1002/cne.24946
Levitt, P., and Veenstra-VanderWeele, J. (2015). Neurodevelopment and the origins of brain disorders. Neuropsychopharmacology 40, 1–3. doi: 10.1038/npp.2014.237
Li, A., Gong, H., Zhang, B., Wang, Q., Yan, C., Wu, J., et al. (2010). Micro-optical sectioning tomography to obtain a high-resolution atlas of the mouse brain. Science 330, 1404–1408. doi: 10.1126/science.1191776
Li, Q., and Shen, L. (2020). 3D neuron reconstruction in tangled neuronal image with deep networks. IEEE Trans. Med. Imaging 39, 425–435. doi: 10.1109/TMI.2019.2926568
Li, S.-J., Vaughan, A., Sturgill, J. F., and Kepecs, A. (2018). A viral receptor complementation strategy to overcome cav-2 tropism for efficient retrograde targeting of neurons. Neuron 98, 905–917.e5. doi: 10.1016/j.neuron.2018.05.028
Lim, L., Mi, D., Llorca, A., and Marín, O. (2018). Development and functional diversification of cortical interneurons. Neuron 100, 294–313. doi: 10.1016/j.neuron.2018.10.009
Lin, M. K., Takahashi, Y. S., Huo, B.-X., Hanada, M., Nagashima, J., Hata, J., et al. (2019). A high-throughput neurohistological pipeline for brain-wide mesoscale connectivity mapping of the common marmoset. eLife 8:e40042. doi: 10.7554/eLife.40042
Liu, C., Ye, F. Q., Yen, C. C.-C., Newman, J. D., Glen, D., Leopold, D. A., et al. (2018). A digital 3D atlas of the marmoset brain based on multi-modal MRI. Neuroimage 169, 106–116. doi: 10.1016/j.neuroimage.2017.12.004
Lo, L., and Anderson, D. J. (2011). A Cre-dependent, anterograde transsynaptic viral tracer for mapping output pathways of genetically marked neurons. Neuron 72, 938–950. doi: 10.1016/j.neuron.2011.12.002
Luo, L., Callaway, E. M., and Svoboda, K. (2008). Genetic dissection of neural circuits. Neuron 57, 634–660. doi: 10.1016/j.neuron.2008.01.002
Madisen, L., Garner, A. R., Shimaoka, D., Chuong, A. S., Klapoetke, N. C., Li, L., et al. (2015). Transgenic mice for intersectional targeting of neural sensors and effectors with high specificity and performance. Neuron 85, 942–958. doi: 10.1016/j.neuron.2015.02.022
Madisen, L., Mao, T., Koch, H., Zhuo, J., Berenyi, A., Fujisawa, S., et al. (2012). A toolbox of Cre-dependent optogenetic transgenic mice for light-induced activation and silencing. Nat. Neurosci. 15, 793–802. doi: 10.1038/nn.3078
Madisen, L., Zwingman, T. A., Sunkin, S. M., Oh, S. W., Zariwala, H. A., Gu, H., et al. (2010). A robust and high-throughput Cre reporting and characterization system for the whole mouse brain. Nat. Neurosci. 13, 133–140. doi: 10.1038/nn.2467
Mai, J. K., Voss, T., and Paxinos, G. (2008). Atlas of the Human Brain. 3rd Edn. New York, NY: Elsevier/Academic Press.
Mancini, M., Casamitjana, A., Peter, L., Robinson, E., Crampsie, S., Thomas, D. L., et al. (2020). A multimodal computational pipeline for 3D histology of the human brain. Sci. Rep. 10:13839. doi: 10.1038/s41598-020-69163-z
Mansilla, L., Milone, D. H., and Ferrante, E. (2020). Learning deformable registration of medical images with anatomical constraints. Neural Netw. 124, 269–279. doi: 10.1016/j.neunet.2020.01.023
Marimont, D. H., and Wandell, B. A. (1994). Matching color images: the effects of axial chromatic aberration. JOSA A. 11, 3113–3122. doi: 10.1364/JOSAA.11.003113
Matryba, P., Kaczmarek, L., and Gołąb, J. (2019). Advances in ex situ tissue optical clearing. Laser Photonics Rev. 13:1800292. doi: 10.1002/lpor.201800292
Matsuda, A., Schermelleh, L., Hirano, Y., Haraguchi, T., and Hiraoka, Y. (2018). Accurate and fiducial-marker-free correction for three-dimensional chromatic shift in biological fluorescence microscopy. Sci. Rep. 8:7583. doi: 10.1038/s41598-018-25922-7
Mayerich, D., Abbott, L., and McCormick, B. (2008). Knife-edge scanning microscopy for imaging and reconstruction of three-dimensional anatomical structures of the mouse brain. J. Microsc. 231, 134–143. doi: 10.1111/j.1365-2818.2008.02024.x
Mazziotta, J., Toga, A., Evans, A., Fox, P., Lancaster, J., Zilles, K., et al. (2001). A probabilistic atlas and reference system for the human brain: international consortium for brain mapping (ICBM). Philos. Trans. R Soc. B Biol. Sci. 356, 1293–1322. doi: 10.1098/rstb.2001.0915
McLellan, M. A., Rosenthal, N. A., and Pinto, A. R. (2017). Cre-loxP-mediated recombination: general principles and experimental considerations. Curr. Protoc. Mouse Biol. 7, 1–12. doi: 10.1002/cpmo.22
Mergenthaler, P., Hariharan, S., Pemberton, J. M., Lourenco, C., Penn, L. Z., and Andrews, D. W. (2021). Rapid 3D phenotypic analysis of neurons and organoids using data-driven cell segmentation-free machine learning. PLoS Comput. Biol. 17:e1008630. doi: 10.1371/journal.pcbi.1008630
Mich, J. K., Graybuck, L. T., Hess, E. E., Mahoney, J. T., Kojima, Y., Ding, Y., et al. (2021). Functional enhancer elements drive subclass-selective expression from mouse to primate neocortex. Cell Rep. 34:108754. doi: 10.1016/j.celrep.2021.108754
Miller, J. A., Gouwens, N. W., Tasic, B., Collman, F., van Velthoven, C. T., Bakken, T. E., et al. (2020). Common cell type nomenclature for the mammalian brain. eLife 9:e59928. doi: 10.7554/eLife.59928
Miyoshi, G., Hjerling-Leffler, J., Karayannis, T., Sousa, V. H., Butt, S. J. B., Battiste, J., et al. (2010). Genetic fate mapping reveals that the caudal ganglionic eminence produces a large and diverse population of superficial cortical interneurons. J. Neurosci. 30, 1582–1594. doi: 10.1523/JNEUROSCI.4515-09.2010
Mok, T. C. W., and Chung, A. C. S. (2020). Large deformation diffeomorphic image registration with laplacian pyramid networks. arXiv:2006.16148 [Preprint]. Available online at: http://arxiv.org/abs/2006.16148 211–221.
Molbay, M., Kolabas, Z. I., Todorov, M. I., Ohn, T.-L., and Ertürk, A. (2021). A guidebook for DISCO tissue clearing. Mol. Syst. Biol. 17:e9807. doi: 10.15252/msb.20209807
Müllenbroich, M. C., Silvestri, L., Di Giovanna, A. P., Mazzamuto, G., Costantini, I., Sacconi, L., et al. (2018). High-fidelity imaging in brain-wide structural studies using light-sheet microscopy. eNeuro 5:ENEURO.0124-18.2018. doi: 10.1523/ENEURO.0124-18.2018
Muñoz-Castañeda, R., Zingg, B., Matho, K. S., Wang, Q., Chen, X., Foster, N. N., et al. (2020). Cellular anatomy of the mouse primary motor cortex. bioRxiv [Preprint].doi: 10.1101/2020.10.02.323154
National Institutes of Health (2019). Notice of Data Sharing Policy for the BRAIN Initiative. Available online at: https://grants.nih.gov/grants/guide/notice-files/NOT-MH-19-010.html.
Nectow, A. R., and Nestler, E. J. (2020). Viral tools for neuroscience. Nat. Rev. Neurosci. 21, 669–681. doi: 10.1038/s41583-020-00382-z
Newmaster, K. T., Nolan, Z. T., Chon, U., Vanselow, D. J., Weit, A. R., Tabbaa, M., et al. (2020). Quantitative cellular-resolution map of the oxytocin receptor in postnatally developing mouse brains. Nat. Commun. 11:1885. doi: 10.1038/s41467-020-15659-1
Ning, K., Zhang, X., Gao, X., Jiang, T., Wang, H., Chen, S., et al. (2020). Deep-learning-based whole-brain imaging at single-neuron resolution. Biomed. Opt. Express 11, 3567–3584. doi: 10.1364/BOE.393081
Odgaard, A., Andersen, K., Melsen, F., and Gundersen, H. J. (1990). A direct method for fast three-dimensional serial reconstruction. J. Microsc. 159, 335–342. doi: 10.1111/j.1365-2818.1990.tb03038.x
Oh, S. W., Harris, J. A., Ng, L., Winslow, B., Cain, N., Mihalas, S., et al. (2014). A mesoscale connectome of the mouse brain. Nature 508, 207–214. doi: 10.1038/nature13186
Okano, H., and Mitra, P. (2015). Brain-mapping projects using the common marmoset. Neurosci. Res. 93, 3–7. doi: 10.1016/j.neures.2014.08.014
Ortiz, C., Navarro, J. F., Jurek, A., Märtin, A., Lundeberg, J., and Meletis, K. (2020). Molecular atlas of the adult mouse brain. Sci. Adv. 6:eabb3446. doi: 10.1126/sciadv.abb3446
Palazzi, X., and Bordier, N. (2008). The Marmoset Brain in Stereotaxic Coordinates. Berlin, Germany: Springer. doi: 10.1007/978-0-387-78385-7_1
Paxinos, G., and Franklin, K. B. J. (2019). Paxinos and Franklin’s the Mouse Brain in Stereotaxic Coordinates. New York: Academic Press.
Paxinos, G., Huang, X.-F., and Toga, A. (2000). “The rhesus monkey brain in stereotaxic coordinates,” in Faculty of Health and Behavioural Sciences - Papers (Archive). University of Wollongong, Australia. Available online at: https://ro.uow.edu.au/hbspapers/3613.
Paxinos, G., and Watson, C. (2006). The Rat Brain in Stereotaxic Coordinates: Hard Cover Edition. Amsterdam, Netherlands: Elsevier.
Peng, H., Ruan, Z., Long, F., Simpson, J. H., and Myers, E. W. (2010). V3D enables real-time 3D visualization and quantitative analysis of large-scale biological image data sets. Nat. Biotechnol. 28, 348–353. doi: 10.1038/nbt.1612
Perens, J., Salinas, C. G., Skytte, J. L., Roostalu, U., Dahl, A. B., Dyrby, T. B., et al. (2021). An optimized mouse brain atlas for automated mapping and quantification of neuronal activity using iDISCO+ and light sheet fluorescence microscopy. Neuroinformatics 19, 433–446. doi: 10.1007/s12021-020-09490-8
Pichet Binette, A., Theaud, G., Rheault, F., Roy, M., Collins, D. L., Levin, J., et al. (2021). Bundle-specific associations between white matter microstructure and Aβ and tau pathology in preclinical Alzheimer’s disease. eLife 10:e62929. doi: 10.7554/eLife.62929
Pomeranz, L. E., Ekstrand, M. I., Latcha, K. N., Smith, G. A., Enquist, L. W., and Friedman, J. M. (2017). Gene expression profiling with cre-conditional pseudorabies virus reveals a subset of midbrain neurons that participate in reward circuitry. J. Neurosci. 37, 4128–4144. doi: 10.1523/JNEUROSCI.3193-16.2017
Puelles, L., and Ferran, J. L. (2012). Concept of neural genoarchitecture and its genomic fundament. Front. Neuroanat. 6:47. doi: 10.3389/fnana.2012.00047
Puelles, L., Harrison, M., Paxinos, G., and Watson, C. (2013). A developmental ontology for the mammalian brain based on the prosomeric model. Trends Neurosci. 36, 570–578. doi: 10.1016/j.tins.2013.06.004
Qi, Y., Yu, T., Xu, J., Wan, P., Ma, Y., Zhu, J., et al. (2019). FDISCO: Advanced solvent-based clearing method for imaging whole organs. Sci. Adv. 5:eaau8355. doi: 10.1126/sciadv.aau8355
Quan, T., Zheng, T., Yang, Z., Ding, W., Li, S., Li, J., et al. (2013). NeuroGPS: automated localization of neurons for brain circuits using L1 minimization model. Sci. Rep. 3:1414. doi: 10.1038/srep01414
Ragan, T., Kadiri, L. R., Venkataraju, K. U., Bahlmann, K., Sutin, J., Taranda, J., et al. (2012). Serial two-photon tomography: an automated method for ex-vivo mouse brain imaging. Nat. Methods 9, 255–258. doi: 10.1038/nmeth.1854
Rapan, L., Froudist-Walsh, S., Niu, M., Xu, T., Funck, T., Zilles, K., et al. (2021). Multimodal 3D atlas of the macaque monkey motor and premotor cortex. Neuroimage 226:117574. doi: 10.1016/j.neuroimage.2020.117574
Renier, N., Adams, E. L., Kirst, C., Wu, Z., Azevedo, R., Kohl, J., et al. (2016). Mapping of brain activity by automated volume analysis of immediate early genes. Cell 165, 1789–1802. doi: 10.1016/j.cell.2016.05.007
Renier, N., Wu, Z., Simon, D. J., Yang, J., Ariel, P., and Tessier-Lavigne, M. (2014). iDISCO: a simple, rapid method to immunolabel large tissue samples for volume imaging. Cell 159, 896–910. doi: 10.1016/j.cell.2014.10.010
Reuter, M., Rosas, H. D., and Fischl, B. (2010). Highly accurate inverse consistent registration: a robust approach. Neuroimage 53, 1181–1196. doi: 10.1016/j.neuroimage.2010.07.020
Roostalu, U., Salinas, C. B. G., Thorbek, D. D., Skytte, J. L., Fabricius, K., Barkholt, P., et al. (2019). Quantitative whole-brain 3D imaging of tyrosine hydroxylase-labeled neuron architecture in the mouse MPTP model of Parkinson’s disease. Dis. Models Mech. 12:dmm042200. doi: 10.1242/dmm.042200
Ropelewski, A. J., Rizzo, M. A., Swedlow, J. R., Huisken, J., Osten, P., Khanjani, N., et al. (2021). Essential metadata for 3D BRAIN microscopy. arXiv:2105.09158 [Preprint]. Available online at: http://arxiv.org/abs/2105.09158.
Rueckert, D., Sonoda, L. I., Hayes, C., Hill, D. L. G., Leach, M. O., and Hawkes, D. J. (1999). Nonrigid registration using free-form deformations: application to breast MR images. IEEE Trans. Med. Imaging 18, 712–721. doi: 10.1109/42.796284
Saleeba, C., Dempsey, B., Le, S., Goodchild, A., and McMullan, S. (2019). A student’s guide to neural circuit tracing. Front. Neurosci. 13:897. doi: 10.3389/fnins.2019.00897
Saunders, A., Macosko, E. Z., Wysoker, A., Goldman, M., Krienen, F. M., de Rivera, H., et al. (2018). Molecular diversity and specializations among the cells of the adult mouse brain. Cell 174, 1015–1030.e16. doi: 10.1016/j.cell.2018.07.028
Sawiak, S. J., Wood, N. I., Williams, G. B., Morton, A. J., and Carpenter, T. A. (2009). SPMMouse: A New Toolbox for SPM in the Animal Brain 1.
Sbalzarini, I. F. (2016). Seeing is believing: quantifying is convincing: computational image analysis in biology. Adv. Anat. Embryol. Cell Biol. 219, 1–39. doi: 10.1007/978-3-319-28549-8_1
Scala, F., Kobak, D., Bernabucci, M., Bernaerts, Y., Cadwell, C. R., Castro, J. R., et al. (2020). Phenotypic variation of transcriptomic cell types in mouse motor cortex. Nature 598, 144–150. doi: 10.1038/s41586-020-2907-3
Schindelin, J., Arganda-Carreras, I., Frise, E., Kaynig, V., Longair, M., Pietzsch, T., et al. (2012). Fiji: an open-source platform for biological-image analysis. Nat. Methods 9, 676–682. doi: 10.1038/nmeth.2019
Schmid, F., Barrett, M. J. P., Jenny, P., and Weber, B. (2019). Vascular density and distribution in neocortex. Neuroimage 197, 792–805. doi: 10.1016/j.neuroimage.2017.06.046
Schnabel, J. A., Rueckert, D., Quist, M., Blackall, J. M., Castellano-Smith, A. D., Hartkens, T., et al. (2001). “A generic framework for non-rigid registration based on non-uniform multi-level free-form deformations,” in Medical Image Computing and Computer-Assisted Intervention - MICCAI 2001 ed W. J. Niessen and M. A. Viergever (Berlin, Germany: Springer), 573–581. doi: 10.1007/3-540-45468-3_69
Schwarz, L. A., Miyamichi, K., Gao, X. J., Beier, K. T., Weissbourd, B., DeLoach, K. E., et al. (2015). Viral-genetic tracing of the input-output organization of a central norepinephrine circuit. Nature 524, 88–92. doi: 10.1038/nature14600
Shamir, L., Delaney, J. D., Orlov, N., Eckley, D. M., and Goldberg, I. G. (2010). Pattern recognition software and techniques for biological image analysis. PLoS Comput. Biol. 6:e1000974. doi: 10.1371/journal.pcbi.1000974
Shapson-Coe, A., Januszewski, M., Berger, D. R., Pope, A., Wu, Y., Blakely, T., et al. (2021). A connectomic study of a petascale fragment of human cerebral cortex. bioRxiv [Preprint]. doi: 10.1101/2021.05.29.446289
Shimono, M. (2013). Non-uniformity of cell density and networks in the monkey brain. Sci. Rep. 3:2541. doi: 10.1038/srep02541
Son, S., Manjila, S. B., Newmaster, K. T., Wu, Y., Vanselow, D. J., Ciarletta, M., et al. (2020). Wiring diagram of the oxytocin system in the mouse brain. bioRxiv [Preprint]. doi: 10.1101/2020.10.01.320978
Song, G., Han, J., Zhao, Y., Wang, Z., and Du, H. (2017). A review on medical image registration as an optimization problem. Curr. Med. Imaging Rev. 13, 274–283. doi: 10.2174/1573405612666160920123955
Song, A. J., and Palmiter, R. D. (2018). Detecting and avoiding problems when using the cre-lox system. Trends Genet. 34, 333–340. doi: 10.1016/j.tig.2017.12.008
Su, P., Ying, M., Han, Z., Xia, J., Jin, S., Li, Y., et al. (2020). High-brightness anterograde transneuronal HSV1 H129 tracer modified using a trojan horse-like strategy. Mol. Brain 13:5. doi: 10.1186/s13041-020-0544-2
Sun, K., and Simon, S. (2021). FDRN: a fast deformable registration network for medical images. Med. Phys. 48, 6453–6463. doi: 10.1002/mp.15011
Suzuki, T., Morimoto, N., Akaike, A., and Osakada, F. (2020). Multiplex neural circuit tracing with G-deleted rabies viral vectors. Front. Neural Circuits 13:77. doi: 10.3389/fncir.2019.00077
Swaney, J., Kamentsky, L., Evans, N. B., Xie, K., Park, Y.-G., Drummond, G., et al. (2019). Scalable image processing techniques for quantitative analysis of volumetric biological images from light-sheet microscopy. bioRxiv [Preprint]. doi: 10.1101/576595
Szulc, K. U., Lerch, J. P., Nieman, B. J., Bartelle, B. B., Friedel, M., Suero-Abreu, G. A., et al. (2015). 4D MEMRI atlas of neonatal FVB/N mouse brain development. Neuroimage 118, 49–62. doi: 10.1016/j.neuroimage.2015.05.029
Tainaka, K., Murakami, T. C., Susaki, E. A., Shimizu, C., Saito, R., Takahashi, K., et al. (2018). Chemical landscape for tissue clearing based on hydrophilic reagents. Cell Rep. 24, 2196–2210.e9. doi: 10.1016/j.celrep.2018.07.056
Takata, N., Sato, N., Komaki, Y., Okano, H., and Tanaka, K. F. (2021). Flexible annotation atlas of the mouse brain: Combining and dividing brain structures of the allen brain atlas while maintaining anatomical hierarchy. Sci. Rep. 11:6234. doi: 10.1038/s41598-021-85807-0
Taniguchi, H., He, M., Wu, P., Kim, S., Paik, R., Sugino, K., et al. (2011). A resource of Cre driver lines for genetic targeting of GABAergic neurons in cerebral cortex. Neuron 71, 995–1013. doi: 10.1016/j.neuron.2011.07.026
Tappan, S. J., Eastwood, B. S., O’Connor, N., Wang, Q., Ng, L., Feng, D., et al. (2019). Automatic navigation system for the mouse brain. J. Comp. Neurol. 527, 2200–2211. doi: 10.1002/cne.24635
Tasic, B., Menon, V., Nguyen, T. N., Kim, T. K., Jarsky, T., Yao, Z., et al. (2016). Adult mouse cortical cell taxonomy revealed by single cell transcriptomics. Nat. Neurosci. 19, 335–346. doi: 10.1038/nn.4216
Tasic, B., Yao, Z., Graybuck, L. T., Smith, K. A., Nguyen, T. N., Bertagnolli, D., et al. (2018). Shared and distinct transcriptomic cell types across neocortical areas. Nature 563, 72–78. doi: 10.1038/s41586-018-0654-5
Tervo, D. G. R., Huang, B.-Y., Viswanathan, S., Gaj, T., Lavzin, M., Ritola, K. D., et al. (2016). A designer AAV variant permits efficient retrograde access to projection neurons. Neuron 92, 372–382. doi: 10.1016/j.neuron.2016.09.021
Thompson, C. L., Ng, L., Menon, V., Martinez, S., Lee, C.-K., Glattfelder, K., et al. (2014). A high-resolution spatiotemporal atlas of gene expression of the developing mouse brain. Neuron 83, 309–323. doi: 10.1016/j.neuron.2014.05.033
Todorov, M. I., Paetzold, J. C., Schoppe, O., Tetteh, G., Shit, S., Efremov, V., et al. (2020). Machine learning analysis of whole mouse brain vasculature. Nat. Methods 17, 442–449. doi: 10.1038/s41592-020-0792-1
Toga, A. W., and Thompson, P. M. (2001). The role of image registration in brain mapping. Image Vis. Comput. 19, 3–24. doi: 10.1016/S0262-8856(00)00055-X
Tremblay, R., Lee, S., and Rudy, B. (2016). GABAergic interneurons in the neocortex: from cellular properties to circuits. Neuron 91, 260–292. doi: 10.1016/j.neuron.2016.06.033
Tsai, P. S., Kaufhold, J. P., Blinder, P., Friedman, B., Drew, P. J., Karten, H. J., et al. (2009). Correlations of neuronal and microvascular densities in murine cortex revealed by direct counting and colocalization of nuclei and vessels. J. Neurosci. 29, 14553–14570. doi: 10.1523/JNEUROSCI.3287-09.2009
Tustison, N. J., Cook, P. A., Klein, A., Song, G., Das, S. R., Duda, J. T., et al. (2014). Large-scale evaluation of ANTs and FreeSurfer cortical thickness measurements. Neuroimage 99, 166–179. doi: 10.1016/j.neuroimage.2014.05.044
Tyson, A. L., and Margrie, T. W. (2021). Mesoscale microscopy and image analysis tools for understanding the brain. Prog. Biophys. Mol. Biol. doi: 10.1016/j.pbiomolbio.2021.06.013
Tyson, A. L., Rousseau, C. V., Niedworok, C. J., Keshavarzi, S., Tsitoura, C., Cossell, L., et al. (2021). A deep learning algorithm for 3D cell detection in whole mouse brain image datasets. PLoS Comput. Biol. 17:e1009074. doi: 10.1371/journal.pcbi.1009074
Ueda, H. R., Dodt, H.-U., Osten, P., Economo, M. N., Chandrashekar, J., and Keller, P. J. (2020a). Whole-brain profiling of cells and circuits in mammals by tissue clearing and light-sheet microscopy. Neuron 106, 369–387. doi: 10.1016/j.neuron.2020.03.004
Ueda, H. R., Ertürk, A., Chung, K., Gradinaru, V., Chédotal, A., Tomancak, P., et al. (2020b). Tissue clearing and its applications in neuroscience. Nat. Rev. Neurosci. 21, 61–79. doi: 10.1038/s41583-019-0250-1
Veldman, M. B., Park, C. S., Eyermann, C. M., Zhang, J. Y., Zuniga-Sanchez, E., Hirano, A. A., et al. (2020). Brainwide genetic sparse cell labeling to illuminate the morphology of neurons and glia with cre-dependent MORF mice. Neuron 108, 111–127.e6. doi: 10.1016/j.neuron.2020.07.019
Viergever, M. A., Maintz, J. B. A., Klein, S., Murphy, K., Staring, M., and Pluim, J. P. W. (2016). A survey of medical image registration—under review. Med. Image Anal. 33, 140–144. doi: 10.1016/j.media.2016.06.030
Viergever, M. A., Maintz, J. B. A., Niessen, W. J., Noordmans, H. J., Pluim, J. P. W., Stokking, R., et al. (2001). Registration, segmentation and visualization of multimodal brain images. Comput. Med. Imaging Graph. 25, 147–151. doi: 10.1016/s0895-6111(00)00065-3
Voleti, V., Patel, K. B., Li, W., Perez Campos, C., Bharadwaj, S., Yu, H., et al. (2019). Real-time volumetric microscopy of in vivo dynamics and large-scale samples with SCAPE 2.0. Nat. Methods 16, 1054–1062. doi: 10.1038/s41592-019-0579-4
Wan, P., Zhu, J., Xu, J., Li, Y., Yu, T., and Zhu, D. (2018). Evaluation of seven optical clearing methods in mouse brain. Neurophotonics 5:035007. doi: 10.1117/1.NPh.5.3.035007
Wang, Q., Ding, S.-L., Li, Y., Royall, J., Feng, D., Lesnar, P., et al. (2020). The allen mouse brain common coordinate framework: a 3D reference atlas. Cell 181, 936–953.e20. doi: 10.1016/j.cell.2020.04.007
Wang, J., and Zhang, M. (2020). DeepFLASH: an efficient network for learning-based medical image registration. arXiv:2004.02097 [Preprint]. Available online at: http://arxiv.org/abs/2004.02097.
Weiss, K. R., Voigt, F. F., Shepherd, D. P., and Huisken, J. (2021). Tutorial: Practical considerations for tissue clearing and imaging. Nat. Protoc. 16, 2732–2748. doi: 10.1038/s41596-021-00502-8
Whitesell, J. D., Liska, A., Coletta, L., Hirokawa, K. E., Bohn, P., Williford, A., et al. (2021). Regional, layer and cell-type-specific connectivity of the mouse default mode network. Neuron 109, 545–559.e8. doi: 10.1016/j.neuron.2020.11.011
Wilkinson, M. D., Dumontier, M., Aalbersberg, I. J., Appleton, G., Axton, M., Baak, A., et al. (2016). The FAIR guiding principles for scientific data management and stewardship. Sci. Data 3:160018. doi: 10.1038/sdata.2016.18
Winnubst, J., Bas, E., Ferreira, T. A., Wu, Z., Economo, M. N., Edson, P., et al. (2019). Reconstruction of 1,000 projection neurons reveals new cell types and organization of long-range connectivity in the mouse brain. Cell 179, 268–281.e13. doi: 10.1016/j.cell.2019.07.042
Woodward, A., Gong, R., Abe, H., Nakae, K., Hata, J., Skibbe, H., et al. (2020). The NanoZoomer artificial intelligence connectomics pipeline for tracer injection studies of the marmoset brain. Brain Struct. Funct. 225, 1225–1243. doi: 10.1007/s00429-020-02073-y
Woodward, A., Hashikawa, T., Maeda, M., Kaneko, T., Hikishima, K., Iriki, A., et al. (2018). The brain/MINDS 3D digital marmoset brain atlas. Sci. Data 5:180009. doi: 10.1038/sdata.2018.9
Wu, Y., Bennett, H. C., Chon, U., Vanselow, D. J., Zhang, Q., Muñoz-Castañeda, R., et al. (2021). The cellular architecture of microvessels, pericytes and neuronal cell types in organizing regional brain energy homeostasis in mice. bioRxiv [Preprint]. doi: 10.1101/2021.05.19.444854
Xiong, B., Li, A., Lou, Y., Chen, S., Long, B., Peng, J., et al. (2017). Precise cerebral vascular atlas in stereotaxic coordinates of whole mouse brain. Front. Neuroanat. 11:128. doi: 10.3389/fnana.2017.00128
Xu, J., Ma, Y., Yu, T., and Zhu, D. (2019). Quantitative assessment of optical clearing methods in various intact mouse organs. J. Biophotonics 12:e201800134. doi: 10.1002/jbio.201800134
Xu, F., Shen, Y., Ding, L., Yang, C.-Y., Tan, H., Wang, H., et al. (2021). High-throughput mapping of a whole rhesus monkey brain at micrometer resolution. Nat. Biotechnol. 1–8. doi: 10.1038/s41587-021-00986-5
Yangt, X., Kwitt, R., Styned, M., and Niethammer, M. (2017). Quicksilver: fast predictive image registration—a deep learning approach. Neuroimage 158, 378–396. doi: 10.1016/j.neuroimage.2017.07.008
Yao, Z., van Velthoven, C. T. J., Nguyen, T. N., Goldy, J., Sedeno-Cortes, A. E., Baftizadeh, F., et al. (2021). A taxonomy of transcriptomic cell types across the isocortex and hippocampal formation. Cell 184, 3222–3241.e26. doi: 10.1016/j.cell.2021.04.021
Yook, J. S., Kim, J., and Kim, J. (2021). Convergence circuit mapping: genetic approaches from structure to function. Front. Syst. Neurosci. 15:688673. doi: 10.3389/fnsys.2021.688673
Young, D. M., Fazel Darbandi, S., Schwartz, G., Bonzell, Z., Yuruk, D., Nojima, M., et al. (2021). Constructing and optimizing 3D atlases from 2D data with application to the developing mouse brain. eLife 10:e61408. doi: 10.7554/eLife.61408
Yun, D. H., Park, Y.-G., Cho, J. H., Kamentsky, L., Evans, N. B., Albanese, A., et al. (2019). Ultrafast immunostaining of organ-scale tissues for scalable proteomic phenotyping. bioRixv [Preprint]. doi: 10.1101/660373
Yuste, R., Hawrylycz, M., Aalling, N., Aguilar-Valles, A., Arendt, D., Arnedillo, R. A., et al. (2020). A community-based transcriptomics classification and nomenclature of neocortical cell types. Nat. Neurosci. 23, 1456–1468. doi: 10.1038/s41593-020-0685-8
Zapiec, B., and Mombaerts, P. (2015). Multiplex assessment of the positions of odorant receptor-specific glomeruli in the mouse olfactory bulb by serial two-photon tomography. Proc. Natl. Acad. Sci. U S A 112, E5873–E5882. doi: 10.1073/pnas.1512135112
Zeisel, A., Hochgerner, H., Lönnerberg, P., Johnsson, A., Memic, F., van der Zwan, J., et al. (2018). Molecular architecture of the mouse nervous system. Cell 174, 999–1014.e22. doi: 10.1016/j.cell.2018.06.021
Zeng, H., and Sanes, J. R. (2017). Neuronal cell-type classification: challenges, opportunities and the path forward. Nat. Rev. Neurosci. 18, 530–546. doi: 10.1038/nrn.2017.85
Zhang, G.-W., Shen, L., Tao, C., Jung, A.-H., Peng, B., Li, Z., et al. (2021). Medial preoptic area antagonistically mediates stress-induced anxiety and parental behavior. Nat. Neurosci. 24, 516–528. doi: 10.1038/s41593-020-00784-3
Zeng, H., Shen, E. H., Hohmann, J. G., Oh, S. W., Bernard, A., Royall, J. J., et al. (2012). Large-scale cellular-resolution gene profiling in human neocortex reveals species-specific molecular signatures. Cell 149, 483–496. doi: 10.1016/j.cell.2012.02.052
Zhang, J., Miller, M. I., Plachez, C., Richards, L. J., Yarowsky, P., van Zijl, P., et al. (2005). Mapping postnatal mouse brain development with diffusion tensor microimaging. Neuroimage 26, 1042–1051. doi: 10.1016/j.neuroimage.2005.03.009
Zhao, S., Todorov, M. I., Cai, R., Steinke, H., Kemter, E., Wolf, E., et al. (2019). Cellular and molecular probing of intact transparent human organs. bioRxiv [Preprint]. doi: 10.1101/643908
Zheng, T., Feng, Z., Wang, X., Jiang, T., Jin, R., Zhao, P., et al. (2019). Review of micro-optical sectioning tomography (MOST): Technology and applications for whole-brain optical imaging [Invited]. Biomed. Opt. Express 10, 4075–4096. doi: 10.1364/BOE.10.004075
Zheng, J.-J., Li, S.-J., Zhang, X.-D., Miao, W.-Y., Zhang, D., Yao, H., et al. (2014). Oxytocin mediates early experience-dependent cross-modal plasticity in the sensory cortices. Nat. Neurosci. 17, 391–399. doi: 10.1038/nn.3634
Zheng, T., Yang, Z., Li, A., Lv, X., Zhou, Z., Wang, X., et al. (2013). Visualization of brain circuits using two-photon fluorescence micro-optical sectioning tomography. Opt. Express 21, 9839–9850. doi: 10.1364/OE.21.009839
Zhong, Q., Li, A., Jin, R., Zhang, D., Li, X., Jia, X., et al. (2021). High-definition imaging using line-illumination modulation microscopy. Nat. Methods 18, 309–315. doi: 10.1038/s41592-021-01074-x
Zhou, Z., Kuo, H.-C., Peng, H., and Long, F. (2018). DeepNeuron: an open deep learning toolbox for neuron tracing. Brain Inform. 5:3. doi: 10.1186/s40708-018-0081-2
Zhu, H., Aryal, D. K., Olsen, R. H. J., Urban, D. J., Swearingen, A., Forbes, S., et al. (2016). Cre-dependent DREADD (designer receptors exclusively activated by designer drugs) mice. Genesis 54, 439–446. doi: 10.1002/dvg.22949
Zhu, F., Cizeron, M., Qiu, Z., Benavides-Piccione, R., Kopanitsa, M. V., Skene, N. G., et al. (2018). Architecture of the mouse brain synaptome. Neuron 99, 781–799.e10. doi: 10.1016/j.neuron.2018.07.007
Zingg, B., Chou, X., Zhang, Z., Mesik, L., Liang, F., Tao, H. W., et al. (2017). AAV-mediated anterograde transsynaptic tagging: mapping input-defined functional neural pathways for defense behavior. Neuron 93, 33–47. doi: 10.1016/j.neuron.2016.11.045
Zingg, B., Dong, H.-W., Tao, H. W., and Zhang, L. I. (2018). Input-output organization of the mouse claustrum. J. Comp. Neurol. 526, 2428–2443. doi: 10.1002/cne.24502
Zingg, B., Hintiryan, H., Gou, L., Song, M. Y., Bay, M., Bienkowski, M. S., et al. (2014). Neural networks of the mouse neocortex. Cell 156, 1096–1111. doi: 10.1016/j.cell.2014.02.023
Zingg, B., Peng, B., Huang, J., Tao, H. W., and Zhang, L. I. (2020). Synaptic specificity and application of anterograde transsynaptic aav for probing neural circuitry. J. Neurosci. 40, 3250–3267. doi: 10.1523/JNEUROSCI.2158-19.2020
Keywords: brain mapping, cell type, serial two-photon tomography, light sheet fluorescence microscopy, data confederation, digital atlas, image analysis, image registration
Citation: Newmaster KT, Kronman FA, Wu Y-t and Kim Y (2022) Seeing the Forest and Its Trees Together: Implementing 3D Light Microscopy Pipelines for Cell Type Mapping in the Mouse Brain. Front. Neuroanat. 15:787601. doi: 10.3389/fnana.2021.787601
Received: 01 October 2021; Accepted: 02 December 2021;
Published: 14 January 2022.
Edited by:
James A. Bourne, Australian Regenerative Medicine Institute (ARMI), AustraliaReviewed by:
Anna Hoerder-Suabedissen, University of Oxford, United KingdomJingpeng Wu, Flatiron Institute, United States
Copyright © 2022 Newmaster, Kronman, Wu and Kim. This is an open-access article distributed under the terms of the Creative Commons Attribution License (CC BY). The use, distribution or reproduction in other forums is permitted, provided the original author(s) and the copyright owner(s) are credited and that the original publication in this journal is cited, in accordance with accepted academic practice. No use, distribution or reproduction is permitted which does not comply with these terms.
*Correspondence: Yongsoo Kim, eXVrMTdAcHN1LmVkdQ==