1
Department of Biotechnologies and Biosciences, University of Milano-Bicocca, Milan, Italy
2
Department of Biomolecular Sciences and Biotechnology, University of Milan, Milan, Italy
3
Icagen Inc., Durham, NC, USA
It has been demonstrated using single-cell and multiunit electrophysiology in layer III entorhinal cortex and disinhibited hippocampal CA3 slices that the balancing of the up-down activity is characterized by both GABAA and GABAB mechanisms. Here we report novel results obtained using multi-electrode array (60 electrodes) simultaneous recordings from reverberating postnatal neocortical networks containing 19.2 ± 1.4% GABAergic neurons, typical of intact tissue. We observed that in each spontaneous active-state the total number of spikes in identified clusters of excitatory and inhibitory neurons is almost equal, thus suggesting a balanced average activity. Interestingly, in the active-state, the early phase is sustained by only 10% of the total spikes and the firing rate follows a sigmoidal regenerative mode up to peak at 35 ms with the number of excitatory spikes greater than inhibitory, therefore indicating an early unbalance. Concentration-response pharmacology of up- and down-state lifetimes in clusters of excitatory (n = 1067) and inhibitory (n = 305) cells suggests that, besides the GABAA and GABAB mechanisms, others such as GAT-1-mediated uptake, Ih, INaP and IM ion channel activity, robustly govern both up- and down-activity. Some drugs resulted to affect up- and/or down-states with different IC50s, providing evidence that various mechanisms are involved. These results should reinforce not only the role of synchrony in CNS networks, but also the recognized analogies between the Hodgkin–Huxley action potential and the population bursts as basic mechanisms for originating membrane excitability and CNS network synchronization, respectively.
Action potential (AP) propagation and synaptic transmission are shared by both peripheral and central nervous systems to sustain fast responding excitability. Nevertheless, both systems are constitutively acted upon by several fundamental but conflicting properties such as serial or parallel activity, rate or temporal spike coding, independent or synchronous operation, reliable or unreliable synaptic transmission, respectively (Otmakhov et al., 1993
; Lisman, 1997
).
Spontaneous synchronous activity, an emerging property of many central networks, is due to the interactions of many relatively simple elements such as chemical and electrical synapses, ion channels and transporters (O’Learly et al., 1994
; Catalano and Shatz, 1998
; Garaschuk et al., 1998
; Komuro and Rakic, 1998
; Corlew et al., 2004
; Fellin et al., 2004
; Dupont et al., 2006
). It is believed that neuronal network assembly bursting is physiologically important to ensure the reliability of synaptic transmission, plasticity and information processing (Lisman, 1997
; Harris, 2005
).
Extracellularly recorded neural signals such as those recorded from multi-electrode arrays (MEAs) consist of time-varying spatial distributions of APs (“spikes”, 1 ms) superimposed on relatively slow local field potentials (LFP, 1–2 s). Usually, the former type of activity, known as multiple-unit activity (MUA), can be spatially separated if the recording electrodes are sufficiently small and estimated in the high-frequency range (typically 250–5000 Hz), whereas the LFPs are assessed in the low-frequency range (e.g. 1–250 Hz) (see Menendez de la Prida et al., 2006
, as an example of such a type of simultaneous recording in vitro). A large number of experiments have suggested that single-unit spikes are primarily attributable to spiking activity of pyramidal or inhibitory neurons, and thus measure the cortical output. On the other hand, LFPs reflect population synaptic potentials (Belitski et al., 2008
; Rasch et al., 2008
), and other types of slow activity unrelated to synaptic events, putatively including slow voltage-dependent membrane oscillations. Recordings from MEA dishes are governed by sets of excitatory and inhibitory synaptic transmission systems that have been described as consisting of indistinguishable cells capable of generating either spikes during synchronous bursting in cortical cultures in vitro (Keefer et al., 2001
; Giugliano et al., 2004
; Gramowski et al., 2004
; Selinger et al., 2004
; Van Pelt et al., 2004
; Martinoia et al., 2005
; Tateno et al., 2005
; Eytan and Marom, 2006
; Wagenaar et al., 2006
), or LFPs in organotypic cultures and slices (Beggs and Plenz, 2003
, 2004
; Sun and Luhmann, 2007
).
On the contrary, applying robust sorting procedures commonly used during in vivo extracellular unit recordings (Barthò et al., 2004
; Buzsàki, 2004
), we provided evidence in long-term MEA networks that the autocorrelation function (AC) (and other statistical features) of each identified neuron represents a very good model to find appropriate clusters of cells characterized by similar activity (Gullo et al., 2009
). For each cluster, identified by standard K-means procedures using the principal component analysis (PCA) of AC components, we computed physiological parameters such as burst duration (BD), number of spikes in each burst (SN), average interburst spike rate (IBSR), interburst intervals (IBI) which, indeed, resulted to be very different in each cluster. On the whole, it resulted that the initial sorting into units unveiled intrinsic multiplicity of responses of assemblies of cells during pharmacological manipulations.
In the present communication we show through immunocytochemistry methods that our neonatal cortical networks contain an inhibitory/excitatory neuron ratio that is similar to that found in intact cortex, suggesting that we are performing multi-site recording from correctly balanced and spontaneously bursting sets of CNS cells. This finding allowed us to link the identified clusters to the inhibitory/excitatory cells, strongly confirming the previously identified feature properties of AC (see Materials and Methods). Moreover, using selective modulators we demonstrate that up- and down network states (whose durations are here quantified by BD and IBI, respectively) not only depend on GABAA and GABAB receptors as already reported (Menendez de la Prida et al., 2006
; Mann et al., 2009
), but also on pacing and spike frequency accommodation currents (i.e. Ih, INaP and IM, respectively). We provide evidence that blockade of the GAT-1 transporter at low and high concentrations with SKF89976A [SKF] (Borden, 1996
) produced robust effects, suggesting putative regulations of homeostasis of extracellular GABA concentration [(GABA)o], which were rescued by specifically blocking the GABABR with CGP55845 (CGP).
Finally, following the Lisman idea of the burst as a unit of neuronal information (Lisman, 1997
; but see also Beggs and Plenz, 2003
, 2004
; Eytan and Marom, 2006
) we inspected the burst structure to characterize how the spikes belonging to excitatory and inhibitory cells are elicited during the burst time-course.
Cell Cultures
The primary cultures of cortical neurons were prepared as described (Gullo et al., 2009
). Briefly, all of the cerebral cortices (excluding the hippocampus) were removed from decapitated post-natal mice (P1–P3), cut into 1 mm3 pieces and digested by trypsin (0.15%) and DNase (10 μg/ml) at 37°C for 20 min. After enzyme digestion, the cells were mechanically dissociated by means of trituration, and plated at the density of 600–900 × 103 cells/ml on glass coverslips for immunocytochemistry and on MEA Petri dishes (30 μm diameter ITO electrodes 200 μm apart, Multichannels System, Germany) pre-coated with polyethyleneimine 0.1% (wt/vol) and laminin 20 μg/ml. After 3 h incubation, the plating medium was replaced by neurobasal medium (NB) with B27 (Invitrogen, Italy), glutamine 1 mM and bFGF 10 ng/ml, and the culture was maintained at 37°C in 5% CO2. One-half of the medium volume was replaced every 3 days. The cultures in MEA Petri dishes were covered with gas permeable covers (MEA-MEM, Ala Scientific Instruments, Inc., USA) from beginning of procedures until the end of the culture period.
Immunocytochemistry
To characterize the neuronal population in our cultures, we used monoclonal antibodies against microtubule-associated protein 2 (MAP2; 1:1000, Sigma) for neurons and gliofibrillar acid protein (GFAP; 1:400, Boehringer Mannheim) for glial cells. GABA-containing neurons were labelled with a polyclonal anti-GABA antibody (1:4000, Sigma; Figure 1
). Controls were performed by omitting primary antibodies. In these cases, no labelling was observed.
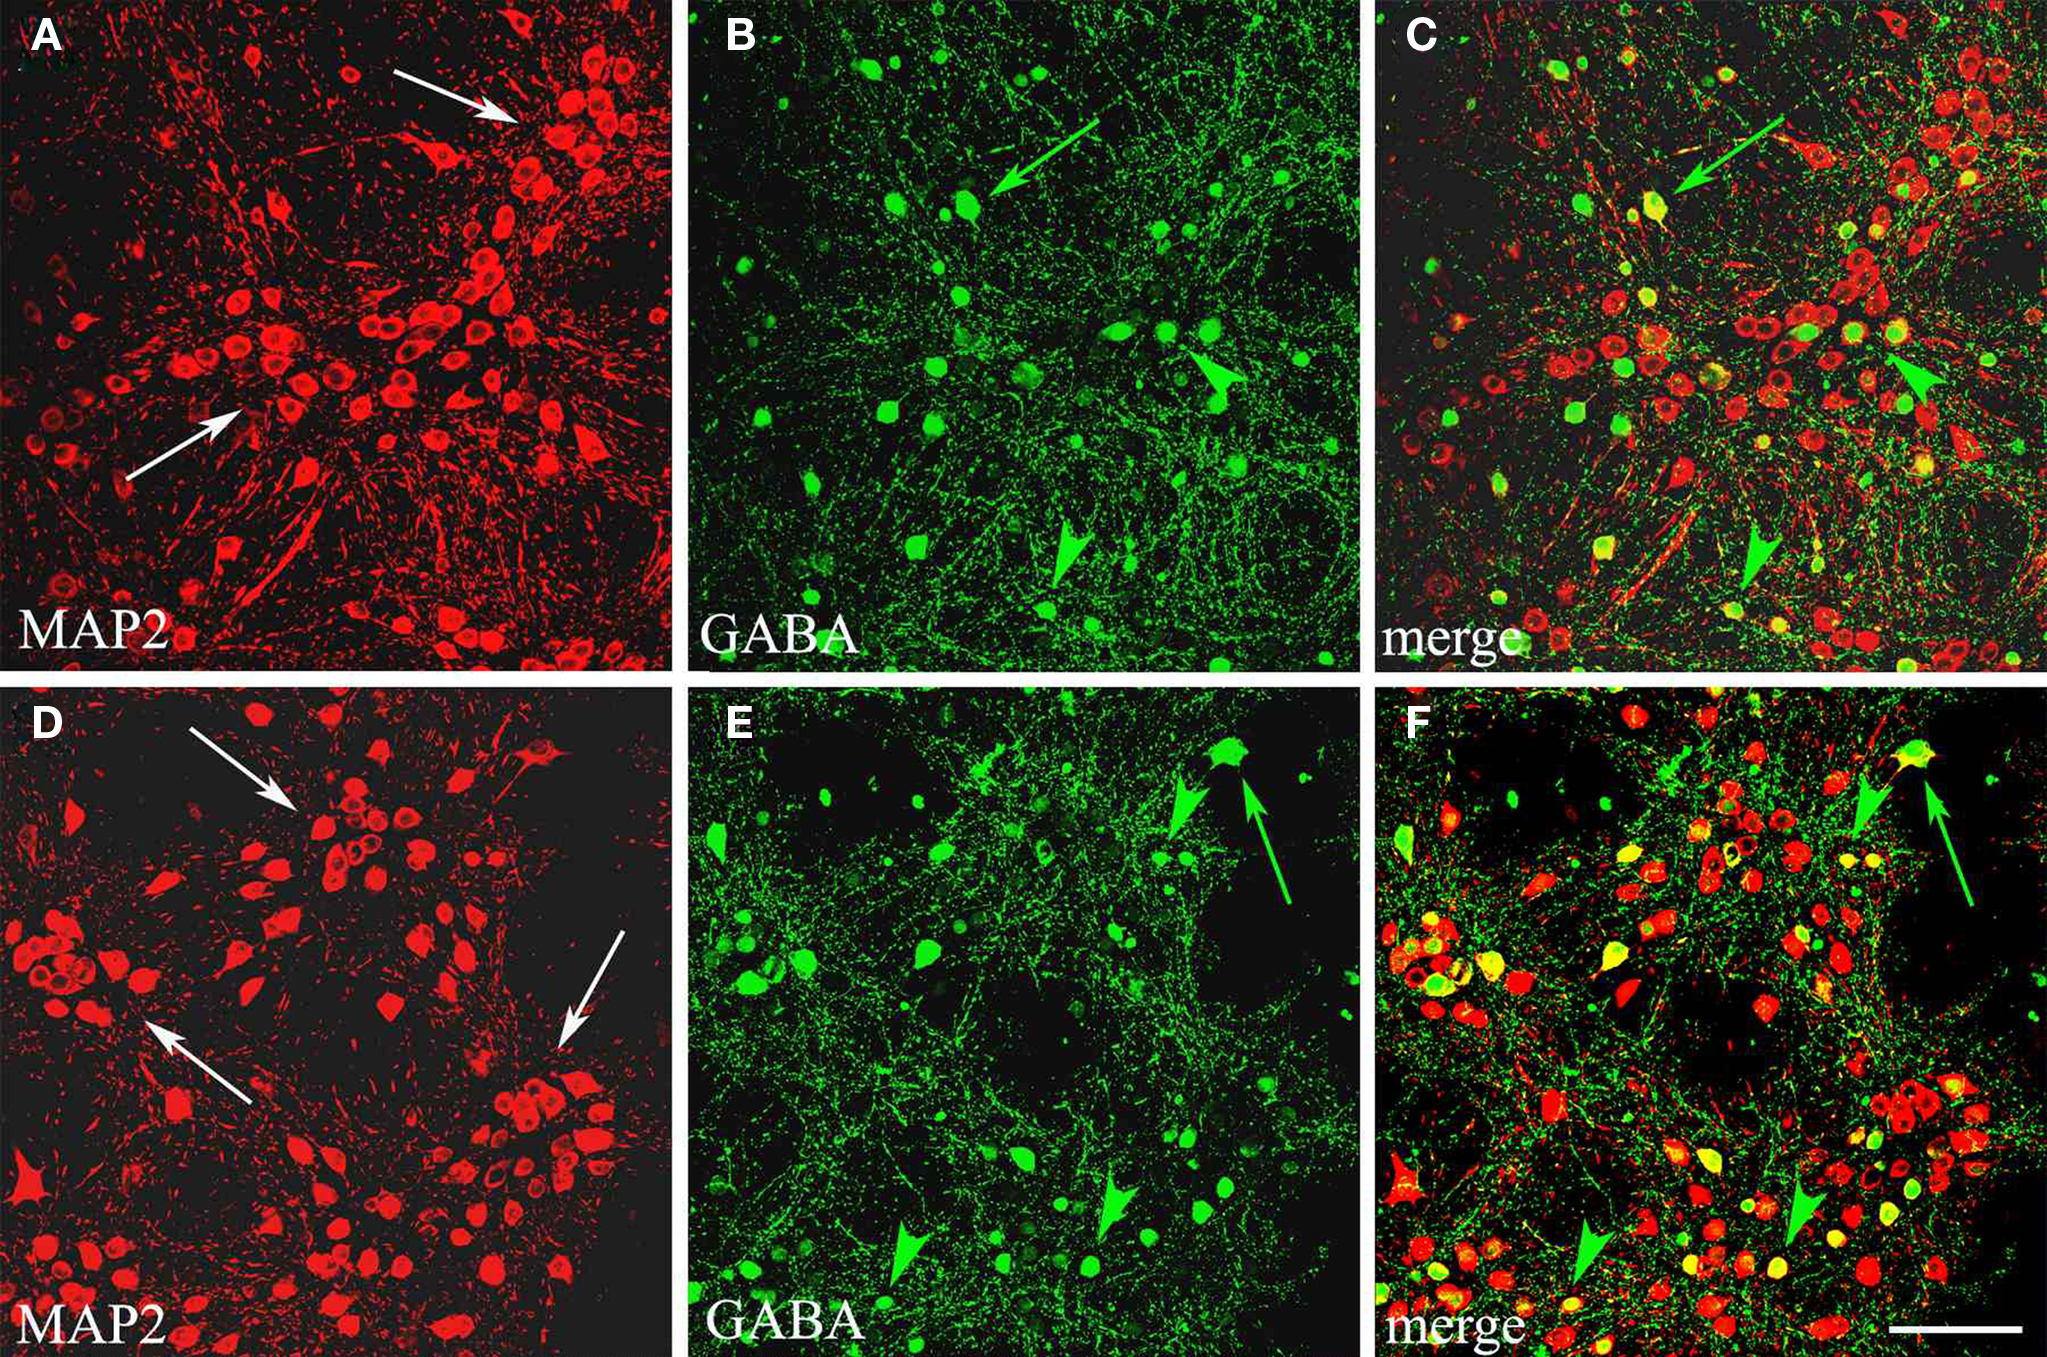
Figure 1. GABAergic population in cortical cultures at DIV15. Confocal microscopical analysis of double immunofluorescence staining for MAP2 (neuronal marker, red signal) and GABA (green signal). In (A,D) MAP2 labelling shows the distribution of neuronal cells in clusters (arrows) in two sampled fields, where GABA immunocytochemistry (B,E) selects inhibitory neurons (yellow signal in merge, C and F). Large GABAergic cells (green arrows) are preferentially localized among clusters, whereas small GABAergic cells (green arrowheads) lie also inside these neuronal groups. Scale bar: 67 μm.
Immunoperoxidase labelling
At 15 DIV cultured cortical cells were fixed for 20 min at 4°C in 4% paraformaldehyde and 0.05% glutaraldehyde in phosphate buffer. After aldehyde quenching with 0,05M NH4Cl, peroxidase blocking with 1% H2O2 and permeabilization with 0.1% Triton X-100, cells were preincubated with 1% bovine serum albumin for 30 min. Successive primary anti-GABA or anti-GFAP antibody incubation was performed overnight at 4°C. This procedure was followed by incubation with biotinylated anti-rabbit (for GABA) or anti-mouse (for GFAP) IgG (Vector Inc., diluted 1:200), for 75 min. After washing, sections were treated with the avidin-biotinylated complex (ABC kit, Vector Inc., diluted 1:100) and then with a freshly prepared solution (0.075%) of 3-3’-diaminobenzidine tetrahydrochloride (Sigma) and 0.002% H2O2. Finally, coverslips were dehydrated, cleared and mounted over clean slides (see Figures S1A,B for GABA and Figure S1C for GFAP in Supplementary Material).
Cell counting. GABA single immunolabelling was examined under the light microscope. After a qualitative evaluation of GABAergic cells, we selected one to three cultures/coverslips per experimental set (cultures obtained from each animal). Four experiments/mice were used for our immunocytochemical analysis (see Table 1
).GABAergic cells were counted at least in 16 non-overlapping random fields (320 μm × 240 μm), acquiring paired images both at phase contrast (Figure S1A in Supplementary Material) and light (Figure S1B in Supplementary Material) microscopy. Phase contrast microscopy allowed the discrimination of glial cell and counting of non-GABAergic neurons in the same field (see Figure S1A in Supplementary Material). To verify the reliability of the method, % of GABA positive cells were also evaluated in five random fields (340 μm × 340 μm, Figure 1
) of two sample cultures combining MAP2 and GABA localizations by double immunofluorescence (Figure 1
).
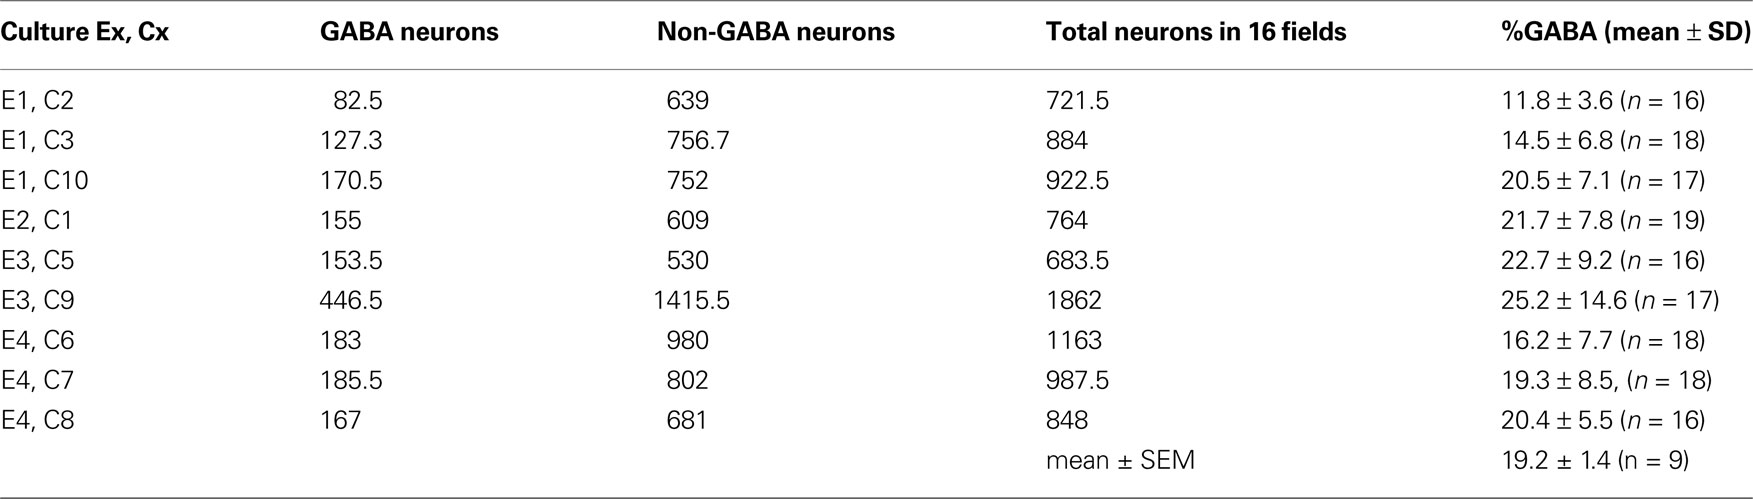
Table 1. Results from counting GABA immunostained neurons and non-GABA neurons in cultures (Cx, n = 9) obtained from four experimental sets (mice, Ex). In each culture at least 16 fi elds were sampled.
Immunofluorescence
Fixed cultures were pretreated as previously reported for immunoperoxidase method, except for H2O2 treatment. Overnight incubation at 4°C in a solution, containing anti-GABA and either anti-MAP2 (see Figure 1 and Figure S1E in Supplementary Material) or anti-GFAP (see Figure S1D in Supplementary Material) antibodies, was followed by incubation in a mixture of appropriate secondary antibodies conjugated to different fluorochromes, such as Alexa-488 conjugated goat anti-rabbit (1:200, Molecular Probes) for GABA immunolabelling (green fluorescence in Figure 1 and Figures S1D,E in Supplementary Material) and indocarbocyanine Cy3-conjugated donkey anti-mouse (1:400, Jackson ImmunoResearch) for MAP2 and GFAP immunolocalizations (red fluorescence in Figure 1 and Figures S1D,E in Supplementary Material). The double-labelled cultures were then mounted with a mixture of PBS/glycerol containing 4′,6-diamidino-2-phenylindole (DAPI) for the staining of cell nuclei (blue fluorescence in Figures S1D,E in Supplementary Material). Images were analyzed by a TCS NT laser scanning confocal microscopy (Leica Lasertecknik GmbH, Heidelberg, Germany). All the thickness of cell cultures (about 15 μm) was acquired by digital superimposing of at least 15 serial optical sections.
Drug Application
As fully previously explained (Gullo et al., 2009
), all of the results reported here were obtained in just a few hours, thus, they can be considered at steady-state. In our MEA dishes, the recording area is ∼2 mm2 and we assume that the average number of neurons (NNs, plus glia) is of the order of ∼6000 cells and thus, on average, the space among cells is relatively large. Under these conditions the extracellular recording should not suffer from the problems present in adult tissue where the extracellular volume is small as compared to the total volume of the cells. The drug ZD-7288 was purchased from Tocris, UK, gabazine (GBZ, also known as SR95531) and SKF-89976A from Sigma (I), CGP-55845 from Biotrend (CH) and ICA-27243 was a kind gift from Icagen, USA. They were kept as frozen stock solutions in distilled water (or DMSO < 0.1%) at −20°C until diluted to their appropriate concentrations in MEA culture medium before each experiment. All of the experiments here described were performed by adding the drug in volumes that were always less than 1% of the total volume of the solution bathing the neurons.
Recordings, Waveform Acquisition and Sorting
Data recordings were done as described (Gullo et al., 2009
). Briefly, raw analogue signals sampled at 40 kHz were recorded, at 36°C in CO2-controlled incubators, from MEA-1060BC or 1060INV preamplifiers (bandwidth 1–8000 Hz, Multichannel Systems, Germany) connected to a MEAWorkstation (bandwidth 100–8000 Hz, Plexon Inc. USA), sorted to timestamp files by the MEAWorkstation Sorter software (MEAWS, see below for details), and subsequently cleaned of artefacts using the OFFLine Sorter program (Plexon Inc., USA). The electrodes responding irregularly during the experiments were excluded from the analysis. Except otherwise noted, we used only 9–22 DIV MEA dishes that have a number of active electrodes not less than 25 and a total number of units not less than 60. This age interval is considered the best for having a fairly stable activity and the average MEA waveform rate in control was 68 ± 9.2 Hz (n = 18) that is in line with current values of other laboratories (Wagenaar et al., 2006
). The capture acquisition procedure performed by the MEAWS was carried out in a window of 1.2 ms, according to a mixed amplitude-duration criterion as described (Gullo et al., 2009
).
Neuronal Cluster Identification and Normalization
The procedures to obtain burst detection and their properties are described in Gullo et al. (2009)
. Briefly, for each identified channel unit, the following characteristics were computed: the autocorrelogram AC, the time at which the decaying phase of the autocorrelogram halved (ACHL), the BD, the spike number (SN), the IBSR, the spike rate (SR), the Fano factor (FF) (Teich, 1989
; Baddeley et al., 1997
), the IBI. Data for all bursts of a specific neuron were averaged in defined time segments corresponding to control or the time intervals during the presence of different drug concentrations. Subsequently, we characterized in the present communication each unit by a set of computed features which were ACHL and FF or FF and SN. We were able to classify neurons based on an Unsupervised Learning Approach, consisting in a data dimensionality reduction method as PCA (Johnson and Wichern, 2002
) followed by the K-means clustering procedure (Duda et al., 2000
). We enriched the clustering processing by an outliers removing procedure discarding from results those units having a Mahalanobis distance from the centroid of its cluster bigger than a fixed threshold (here we used 1).
The procedure identified two clusters (with number of neurons, NN), that here we named with a subscript “e” (excitatory) or “i” (inhibitory), respectively. The two identified clusters were found to obey all the following rules at the same time (in control conditions):
1. ACHLe ≪ ACHLi,
2. BDe ≪ BDi,
3. SNe ≪ SNi,
4. SRe ≪ Sri,
5. IBSRe ≫ IBSRi,
6. FFe ≪ FFi
7. IBIe ≤ IBIi.
8. NNe ∼ Ni × 4
To inspect the burst structure we applied a scanning window of 5 ms to search the start of the up state and collect the spikes (Ham et al., 2008
). From the two clusters defined above it was possible to identify how the spikes belonging to each cluster are elicited during the burst timecourse. In Figures 2
–4
we show the spike activity histograms (5 ms time bins from 0 to 3 s). Depending on the subject of interest, data will be expressed in one of the following three types of format: (1) SR of all the neurons in a cluster (cSR, Hz), (2) SR of the typical neuron of the cluster (i.e. nSR = cSR/NN, Hz) and (3) number of spikes as a function of delay after the burst start [N(t)].
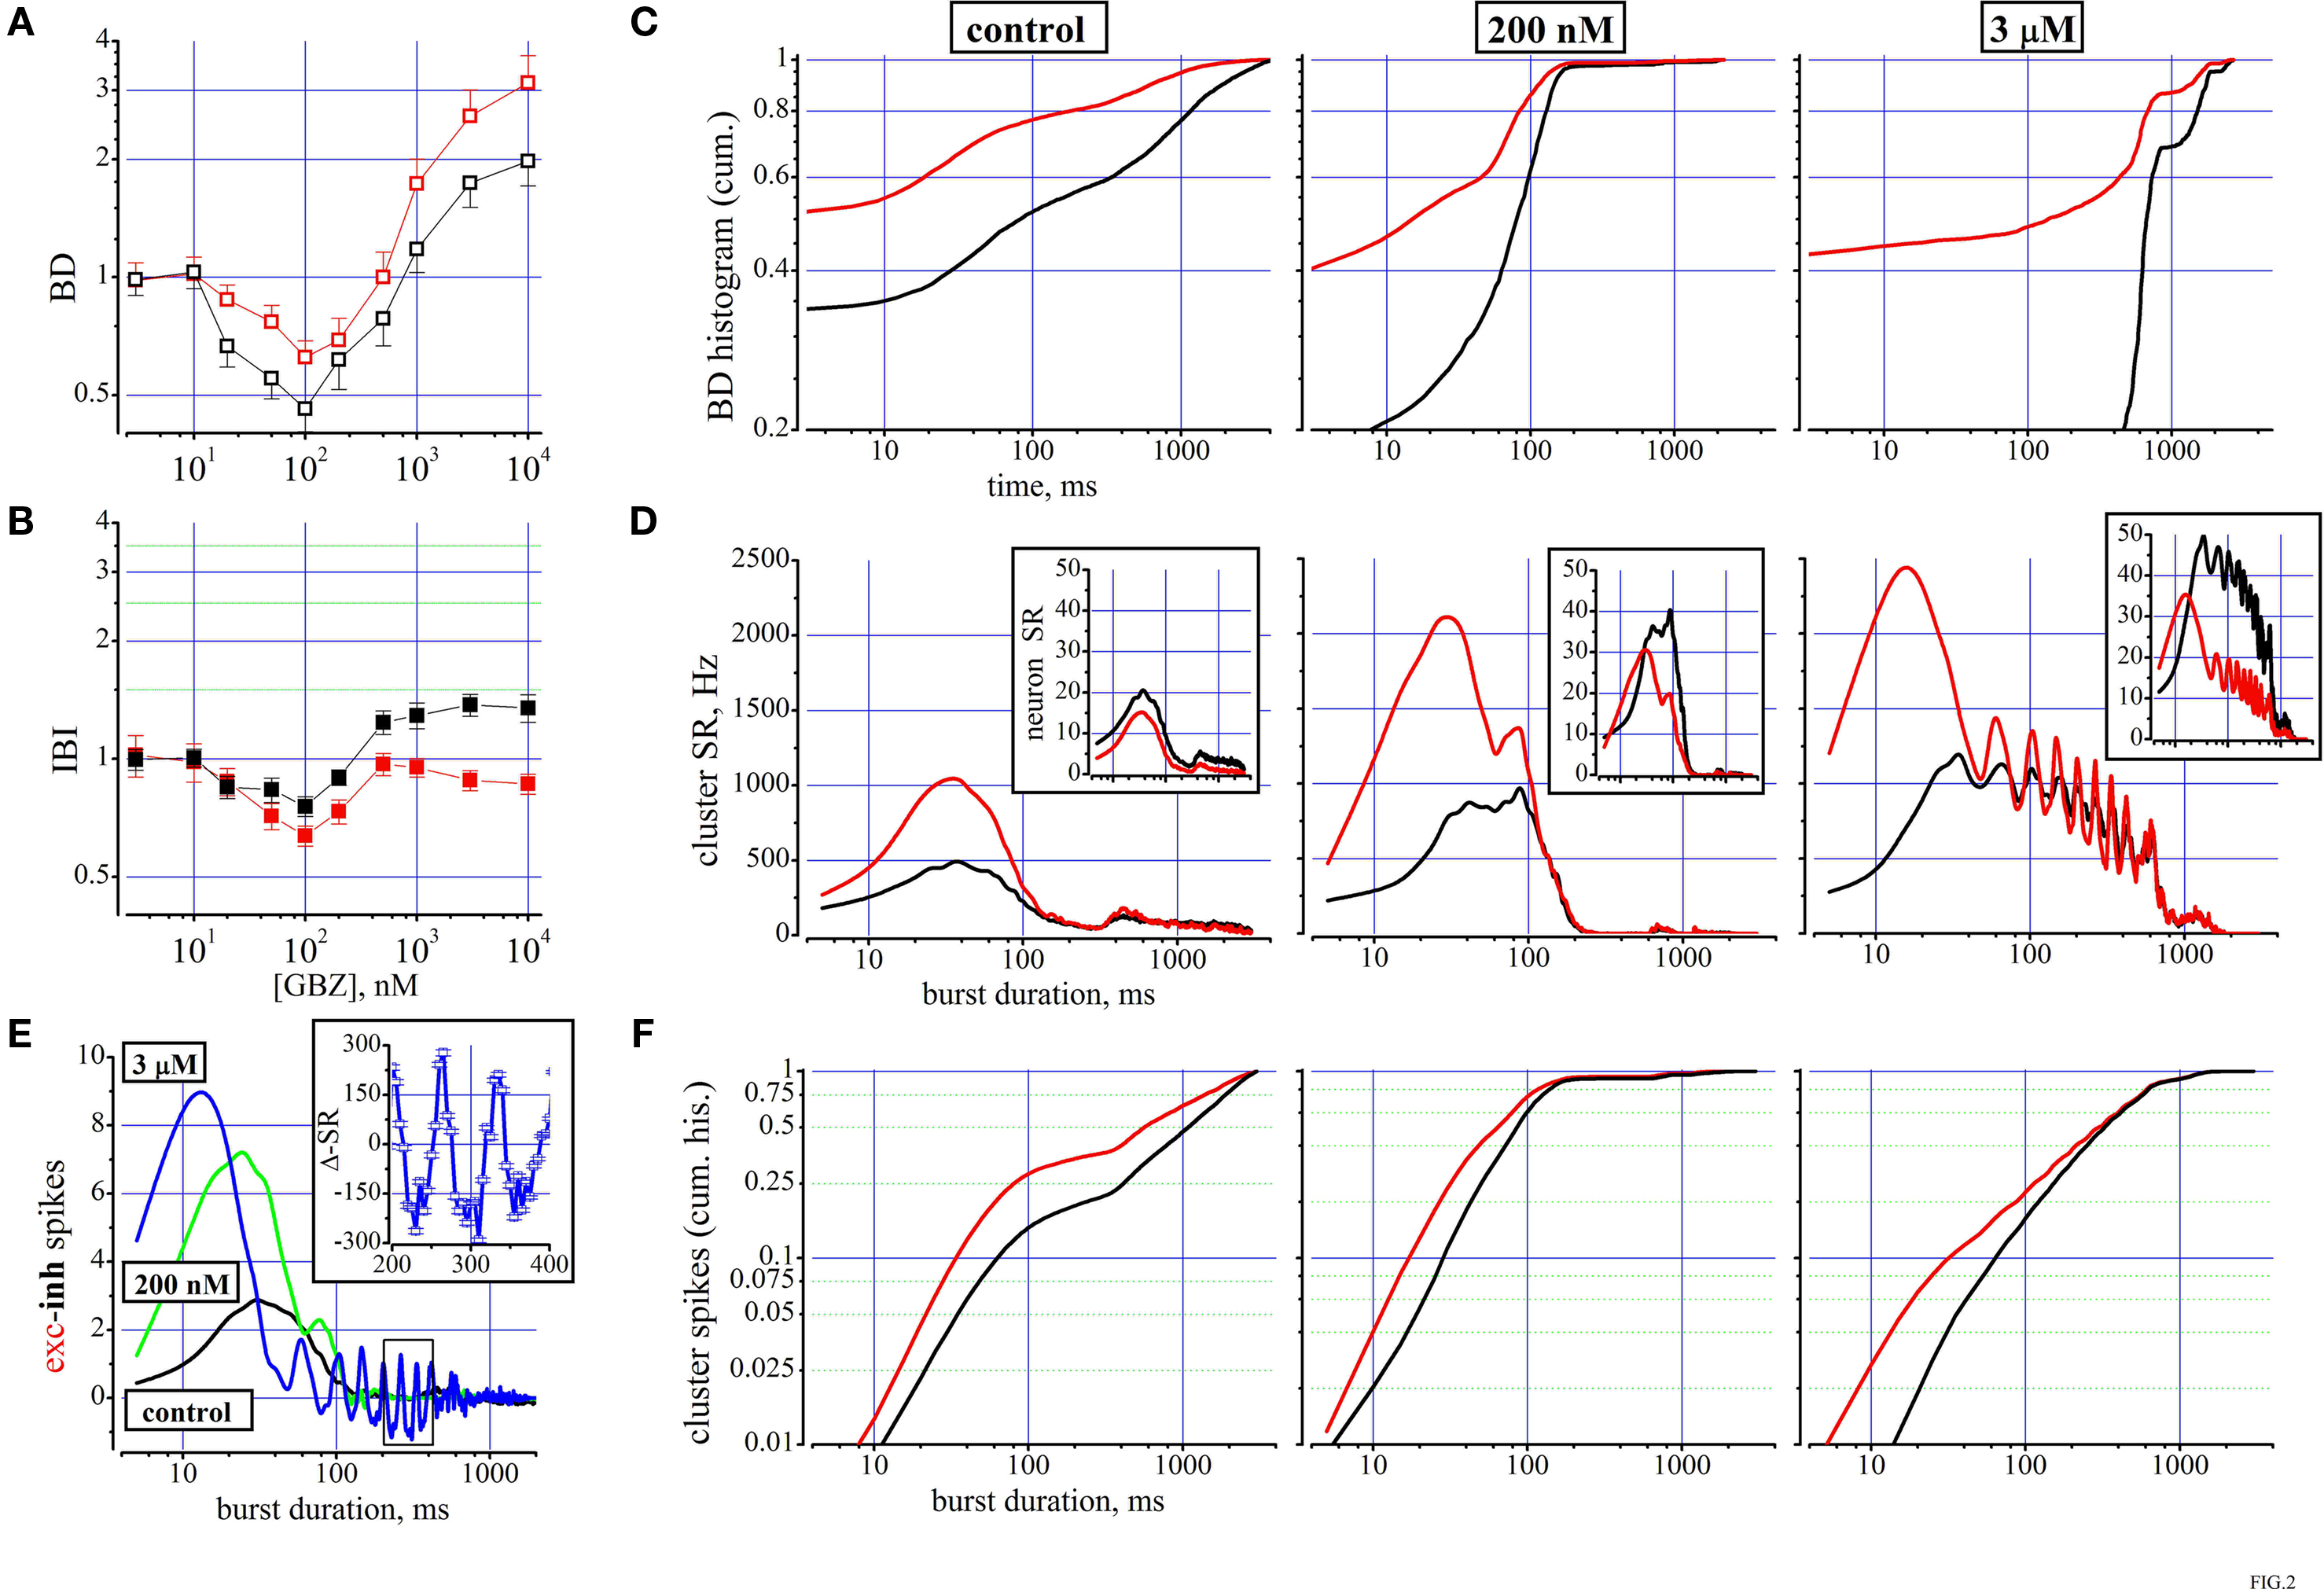
Figure 2. The effects of the GABAA disinhibition by gabazine (GBZ). (A,B) dose–response curves for IBI and BD evaluated for the excitatory (red symbols) and inhibitory (black symbols) cluster of neurons (total number of cells: 187, 68, respectively). (C) From a single experiment with two clusters of 69 excitatory (red) and 24 inhibitory (black), the cumulative histograms of BD are shown under control (left), in 200 nM (middle) and in 3 μM GBZ. In control average data of BD and IBI for the excitatory (inhibitory) clusters were 0.17 ± 0.02 s (0.64 ± 0.07 s) and 11.4 ± 0.6 s (9.7 ± 0.37 s), respectively. (D) From the same network of (C), the cluster SR versus the time after the burst start are plotted (mean values, red and black for excitatory and inhibitory clusters; data evaluated every 5 ms), in control (left), at 200 nM (middle) and at 3 μM GBZ (right) as indicated for the excitatory (red) and inhibitory (black) neurons. Insets to each graph illustrate how the same data appear after division by the number of cells in each cluster (nSR on y-scale). Cubic B-spline option was used. (E) The difference between the number of spikes produced by the excitatory and inhibitory clusters shown in (D) is plotted in control (black), at 200 nM (green) and at 3 μM GBZ (blue). The small rectangle indicates the zoomed region shown in inset where the oscillatory behaviour data, at 3 μM GBZ from 200 to 400 ms, of cluster-SR difference is shown with bar errors. (F) From the same data shown in (D), the cumulative histograms versus the time after the burst start are plotted (mean values, red and black for excitatory and inhibitory clusters; data evaluated every 5 ms), in control (left), at 200 nM (middle) and at 3 μM GBZ (right) as indicated for the excitatory (red) and inhibitory (black) neurons.
Data analysis and statistical analysis of results
We used the OriginPro 7.0 (OriginLab Co., Northampton, MA, USA) software program to analyze data and prepare figures. All results are indicated as mean ± SEM and n indicate the number of experiments performed. Statistical significance was accessed using paired Student’s t-test at the significance level (p) indicated. When normality test of data was not satisfied we used the Kolmogorov–Smirnov test.
The Percentage of GABAergic Neurons in Neocortical Postnatal Cultured Networks is Similar to that Observed in Intact Cortex
Two different, but complementary, approaches were used to characterize the cortical cell cultures and to evaluate the GABAergic population: immunoperoxidase and immunofluorescence methods. The identification of the MAP2 positive neuronal component (Figures 1
A,D) showed neurons distributed on the coverslips forming clusters connected each other by dendritic processes. This distribution was frequently observed in the central area of cultures, whereas neuronal cells endowed with large cell bodies and extensive processes became more scattered in the periphery (see for example Figures S1A,B in Supplementary Material). Numerous glial cells stained positive for GFAP surrounded this cortical neuronal network and was rather homogeneously distributed (Figures S1C,D in Supplementary Material). The selective immunocytochemical staining for GABAergic cells showed inhibitory interneurons scattered in the network; they mainly appeared in the external part of clusters (Figures 1
B,C,E,F). GABAergic neurons generally displayed two different morphologies, as previously reported (de Lima and Voigt, 1997
). Numerous small round or fusiform GABAergic cells were observed among the clusters, rarely inside them (Figures 1
C,F) and also scattered near the border of the coverslip, where few large multipolar GABAergic neurons formed a loose network of GABA positive processes (Figures S1A,B,D,E in Supplementary Material).
The quantitative evaluation of the inhibitory population was done on single labelled cultures by immunoenzymatic method (see Table 1
) observed at phase contrast microscopy (Figure S1A in Supplementary Material). Numbers reported in Table 1
for each culture/coverslip (C) obtained from an experiment/animal (E) were the means derived from counting of two independent observers on immunostained coverslips by single GABA immunoperoxidase method. We showed how the total NN in each examined culture was rather homogeneous and that GABA positive neurons ranged between 11.8 and 25.2% of the neuronal population with a mean of 19. 2 ± 1.4% (SEM, n = 9), a value consistent with previous reports on interneuronal cortical population both in vitro and in vivo (Gabbott et al., 1997
; Sang and Tan, 2003
; Tsugorka et al., 2007
; de Lima et al., 2009
). From experiments/animals E2 and E4 two cultures were labelled by MAP2/GABA immunofluorescence giving similar results (15.4 ± 6.8% SD and 25.5 ± 6% SD respectively), demonstrating the reproducibility of the methods.
Concentration-Dependent GABAzine-Induced Disinhibition Caused Opposite Effects on Firing Rates of Excitatory and Inhibitory Neurons During Up-States
Except where indicated, the data shown in Figures 2
–4
were obtained from several completely reversible pharmacological experiments performed on MEA dishes in about 2–3 h (see Materials and Methods). BD and IBI data of putative inhibitory (always in black) and excitatory (always in red) neurons were normalized to 1 in control and averaged to obtain double-log plots versus drug concentration (minimal n = 3, from different dishes derived from different long-term cultured neurons). In each of the figures we reported the cumulative distributions of BD (and IBI, when necessary) in order to identify the eventual presence of homogeneous or heterogeneous populations of up-states. Moreover, since BDs do not tell us how spikes are internally structured, we show the time histograms of the spike firing during the burst either in the form of SR (either for cluster, cSR, or for neuron type, nSR) or as number of spikes [N(t), see Materials and Methods]. These data (also as cumulative distributions) are useful to inspect how the percentage of the total spikes elicited in the burst is distributed along the burst life. Since in control conditions we frequently found the total numbers of elicited excitatory and inhibitory spikes are almost equal, we computed the difference between the excitatory and inhibitory spikes along the burst lifetime in some experiments.
The results of using GBZ as blocker of the GABAergic transmission are shown in Figure 2
A,B as concentration–response curves for a total of 187 and 68 excitatory and inhibitory neurons, respectively. No major changes were noted for IBI, although the data are significantly different for the two neuronal populations (p < 0.03). The most powerful effects (p < 0.01) are seen for BD which first halved at concentrations up to 200 nM GBZ and furthermore increased by several fold at larger concentrations. The BD data are means obtained from long recordings in which the network bursting was present about every 10 s and accordingly we averaged data from ∼360 or ∼60 bursts in 1 h (control) or in 600 s (drug), respectively.
In general, we noticed that in control conditions the behaviour of the network was characterized by a considerable heterogeneity and therefore we specifically studied the BD histograms. In a representative experiment (69 and 24 excitatory and inhibitory neurons, respectively), the BD cumulative probability histograms are shown in Figure 2
C. The two lines show (excitatory and inhibitory clusters, p < 10−8), respectively, that the probability of finding short (from ∼3 to 60 ms), medium (∼60/600 ms) or long (∼600 ms up to 4 s) BDs are very different. For excitatory cells about 75% of the bursts are short, 15% are medium and only 10% are long. On the contrary, for the inhibitory cells, 50% are short, about 20% are medium, but 30% are long, reaching also BDs up to 4 s. The addition of 200 nM and 3 μM GBZ dramatically changed the control results into more homogeneous properties, characterized by either a net decrease or a net increase of the probability of finding BD of short or long duration, respectively (Figure 2
C middle and right, p < 10−9) (Haeusser and Clark, 1997
).
At Low and High GABAzine Concentrations the Distribution of Spikes During the Up-State are Exceptionally Different
It was suggested that mainly the phasic GABAergic transmission is inhibited in the interval 20–200 nM of GBZ concentrations (Stell and Mody, 2002
; Mann et al., 2009
). Since at high GBZ concentrations the tonic GABA inhibition is certainly removed, the GBZ effect at low concentrations deserved further explanation.
To this aim, we show in Figure 2
D, how cSR is distributed along the BD (see legend). In control conditions (left), cSR is rapidly increasing up to a peak at 35 ms and then a slow decrease starts the decaying phase of the burst activity (notice horizontal logarithmic scale). Upon addition of 200 nM GBZ (middle) we observed a 2-fold peak increase in approximately the same time range (from 1100 to 2100 Hz and from 500 to 1000 Hz for the excitatory and inhibitory clusters, respectively). At 3 μM GBZ, an even higher earlier peak was observed with respect to 200 nM, but a huge increase resulted between 150 and 700 ms, accompanied by a clear oscillating activity. On the whole, the excitatory and inhibitory data were significantly different (p < 10−6).
These results emphasize the large excess of spikes produced by the excitatory cluster especially during the early phase of the burst. Dividing these data by the NN in each cluster should clarify what is the average behaviour of an exemplary neuron of each class: these data are shown in the respective insets of Figure 2
D. In control, nSRs were significantly different (p < 10−4). However, in the presence of 200 nM and at 3 μM GBZ there was an excess of inhibitory spikes not in the early but in the late phase of the decaying part of the burst (p < 10−6).
To further examine the consequences of the low GBZ-mediated disinhibition, we explored how the spike balance was distributed. To this aim, we plotted in Figure 2
E a point-by-point (5 ms window) difference between excitatory and inhibitory spikes in the three different conditions mentioned above. In control (black) this ratio starts from ∼0.5, reached a peak at 2.9 and rapidly decayed at 0. On the contrary, at 200 nM (green) and 3 μM (blue) GBZ, the difference reached peaks of 7 and 9 at 30 and 15 ms, respectively. Interestingly, at 3 μM GBZ this difference became negative from ∼80 up to 450 ms, suggesting that under this type of disinhibition, oscillations could take place because of the loose inhibitory feedback loop between cells of different clusters and the delays introduced by the synaptic connections allow a positive feedback to take place (starting at around 25 Hz and decaying to 12 Hz before the end of the burst). Since it is difficult to perceive the effects of such low numbers of spikes found every 5 ms, in the inset we plotted the SR difference (ΔSR, with errors bars) between the excitatory and inhibitory clusters in the 200–400 ms range. These results emphasize that the networks as simple as those described here have an intrinsic fast capability to change the firing rate due to the particular disinhibited conditions, producing potentially unwanted decaying oscillations.
To better understand what proportion of spikes for each cluster is contributing to the early and late phases of the up-state, we show in Figure 2
F the cumulative histograms in the same time ranges (for probabilities ranging from 0.01 to 1). From the control data (left panel) it is evident that less than 10% of the excitatory neurons fired during the first 30 ms and this percentage reduces to about 4% for the inhibitory cells. At about 300 ms still only 30 and 20% of the spikes were elicited by the excitatory and inhibitory cells, respectively. All the other spikes were produced at later times. Upon addition of 200 nM GBZ and further at 3 μM, we observed strong modification of the probability curves, as seen before from the data shown in Figure 2
C.
Taken together, the results shown above indicate that in control conditions the excitatory cluster is rather strongly inhibited probably by many inhibitory modes (putatively feedback, feedforward and autaptic). At 200 nM GBZ the phasic (and eventually the autaptic) inhibitory modes are almost blocked and the excitatory cluster is free to briefly fire at higher rate but the inhibitory cluster is still able to immediately respond to this excessive rate by shortly terminating the burst since cells are still under the action of tonic inhibition. Interestingly, this process takes place dynamically during the burst lifetime and causes a substantial burst shortening because there is an excess of inhibitory spikes per neuron (see inset to Figure 2
C middle). On the contrary, at 3 μM GBZ, although the first burst phase is the similar as before, the disappearance of the tonic inhibition allows a continuous prominent firing of both clusters, finally resulting in the lack of ability to produce an early burst end.
In conclusion, the number of spikes per cluster or per neuron in a representative experiment is shown in Table 2
. We observe that in each burst, on average, the control condition is characterized by an almost balanced number of spikes originating from the two cell types, similarly to what happens under complete disinhibition. On the contrary, if the blockade of GABA receptors is limited to the phasic mode, we observed that the inhibitory spikes are halved while the excitatory spikes are only reduced by a factor of 0.8 (see asterisks in Table 1
). While the tonic inhibition is still functioning at 200 nM GBZ, the balance of excitatory and inhibitory activity is strongly shifted to the early burst phase favouring a rapid switch-off of the burst as shown by the results of Figure 2
F middle. On the other hand, after the removal of tonic inhibition the cells fire much more spikes by a factor of ∼2.4. In columns 5–7 of Table 2
, averaged activity data per burst are reported for single representative neurons and it can be noticed that an excitatory cell elicits always much less spikes than an inhibitory cell, although these numbers change in different pharmacological conditions.
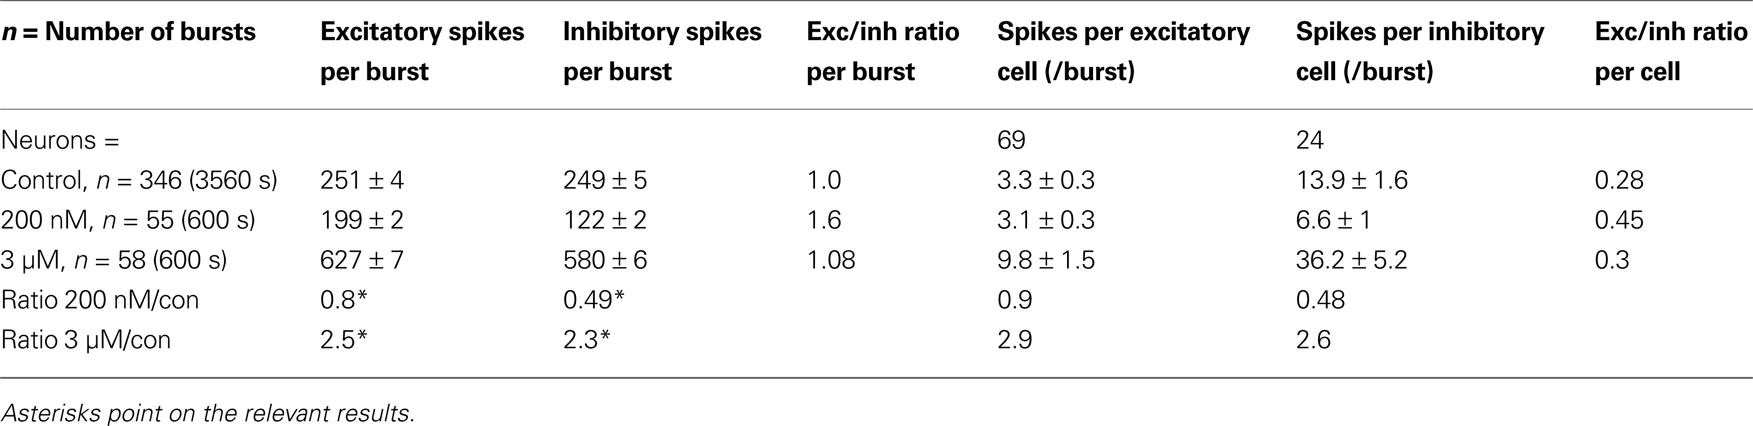
Table 2. A typical experiment analyzed in Figure 2
C-F originated the data shown below.
These results indicate that a continuous strong synaptic balance is present in each cell and among the cells. The substantial BD increase at high GBZ concentrations (where it is supposed that both phasic and tonic inhibitions are completely blocked) suggests that in almost all of the cells the GABA reversal potential should not be positive with respect to resting potential, thus confirming that the GABA transmission is inhibitory although the cultured neurons derive from postnatal mice (Payne et al., 2003
; Farrant and Nusser, 2005
).
The Agonist of the GABAB Receptors Baclofen Strongly Increased Both Down- and Up-State Durations
The putative role of the GABABRs in the network activity was investigated both by using the specific blocker CGP55845 (CGP) or the agonist baclofen (BAC) or both. Since in three experiments done with the blocker only one showed a reasonable reduction of the IBI (not shown), we suspected that in some networks the role of GABABRs was weakly active under control activity. Indeed, when we started to use BAC for testing the presence of functional GABABRs, the results (3/3) shown in Figures 3
A–D, were much more convincing.
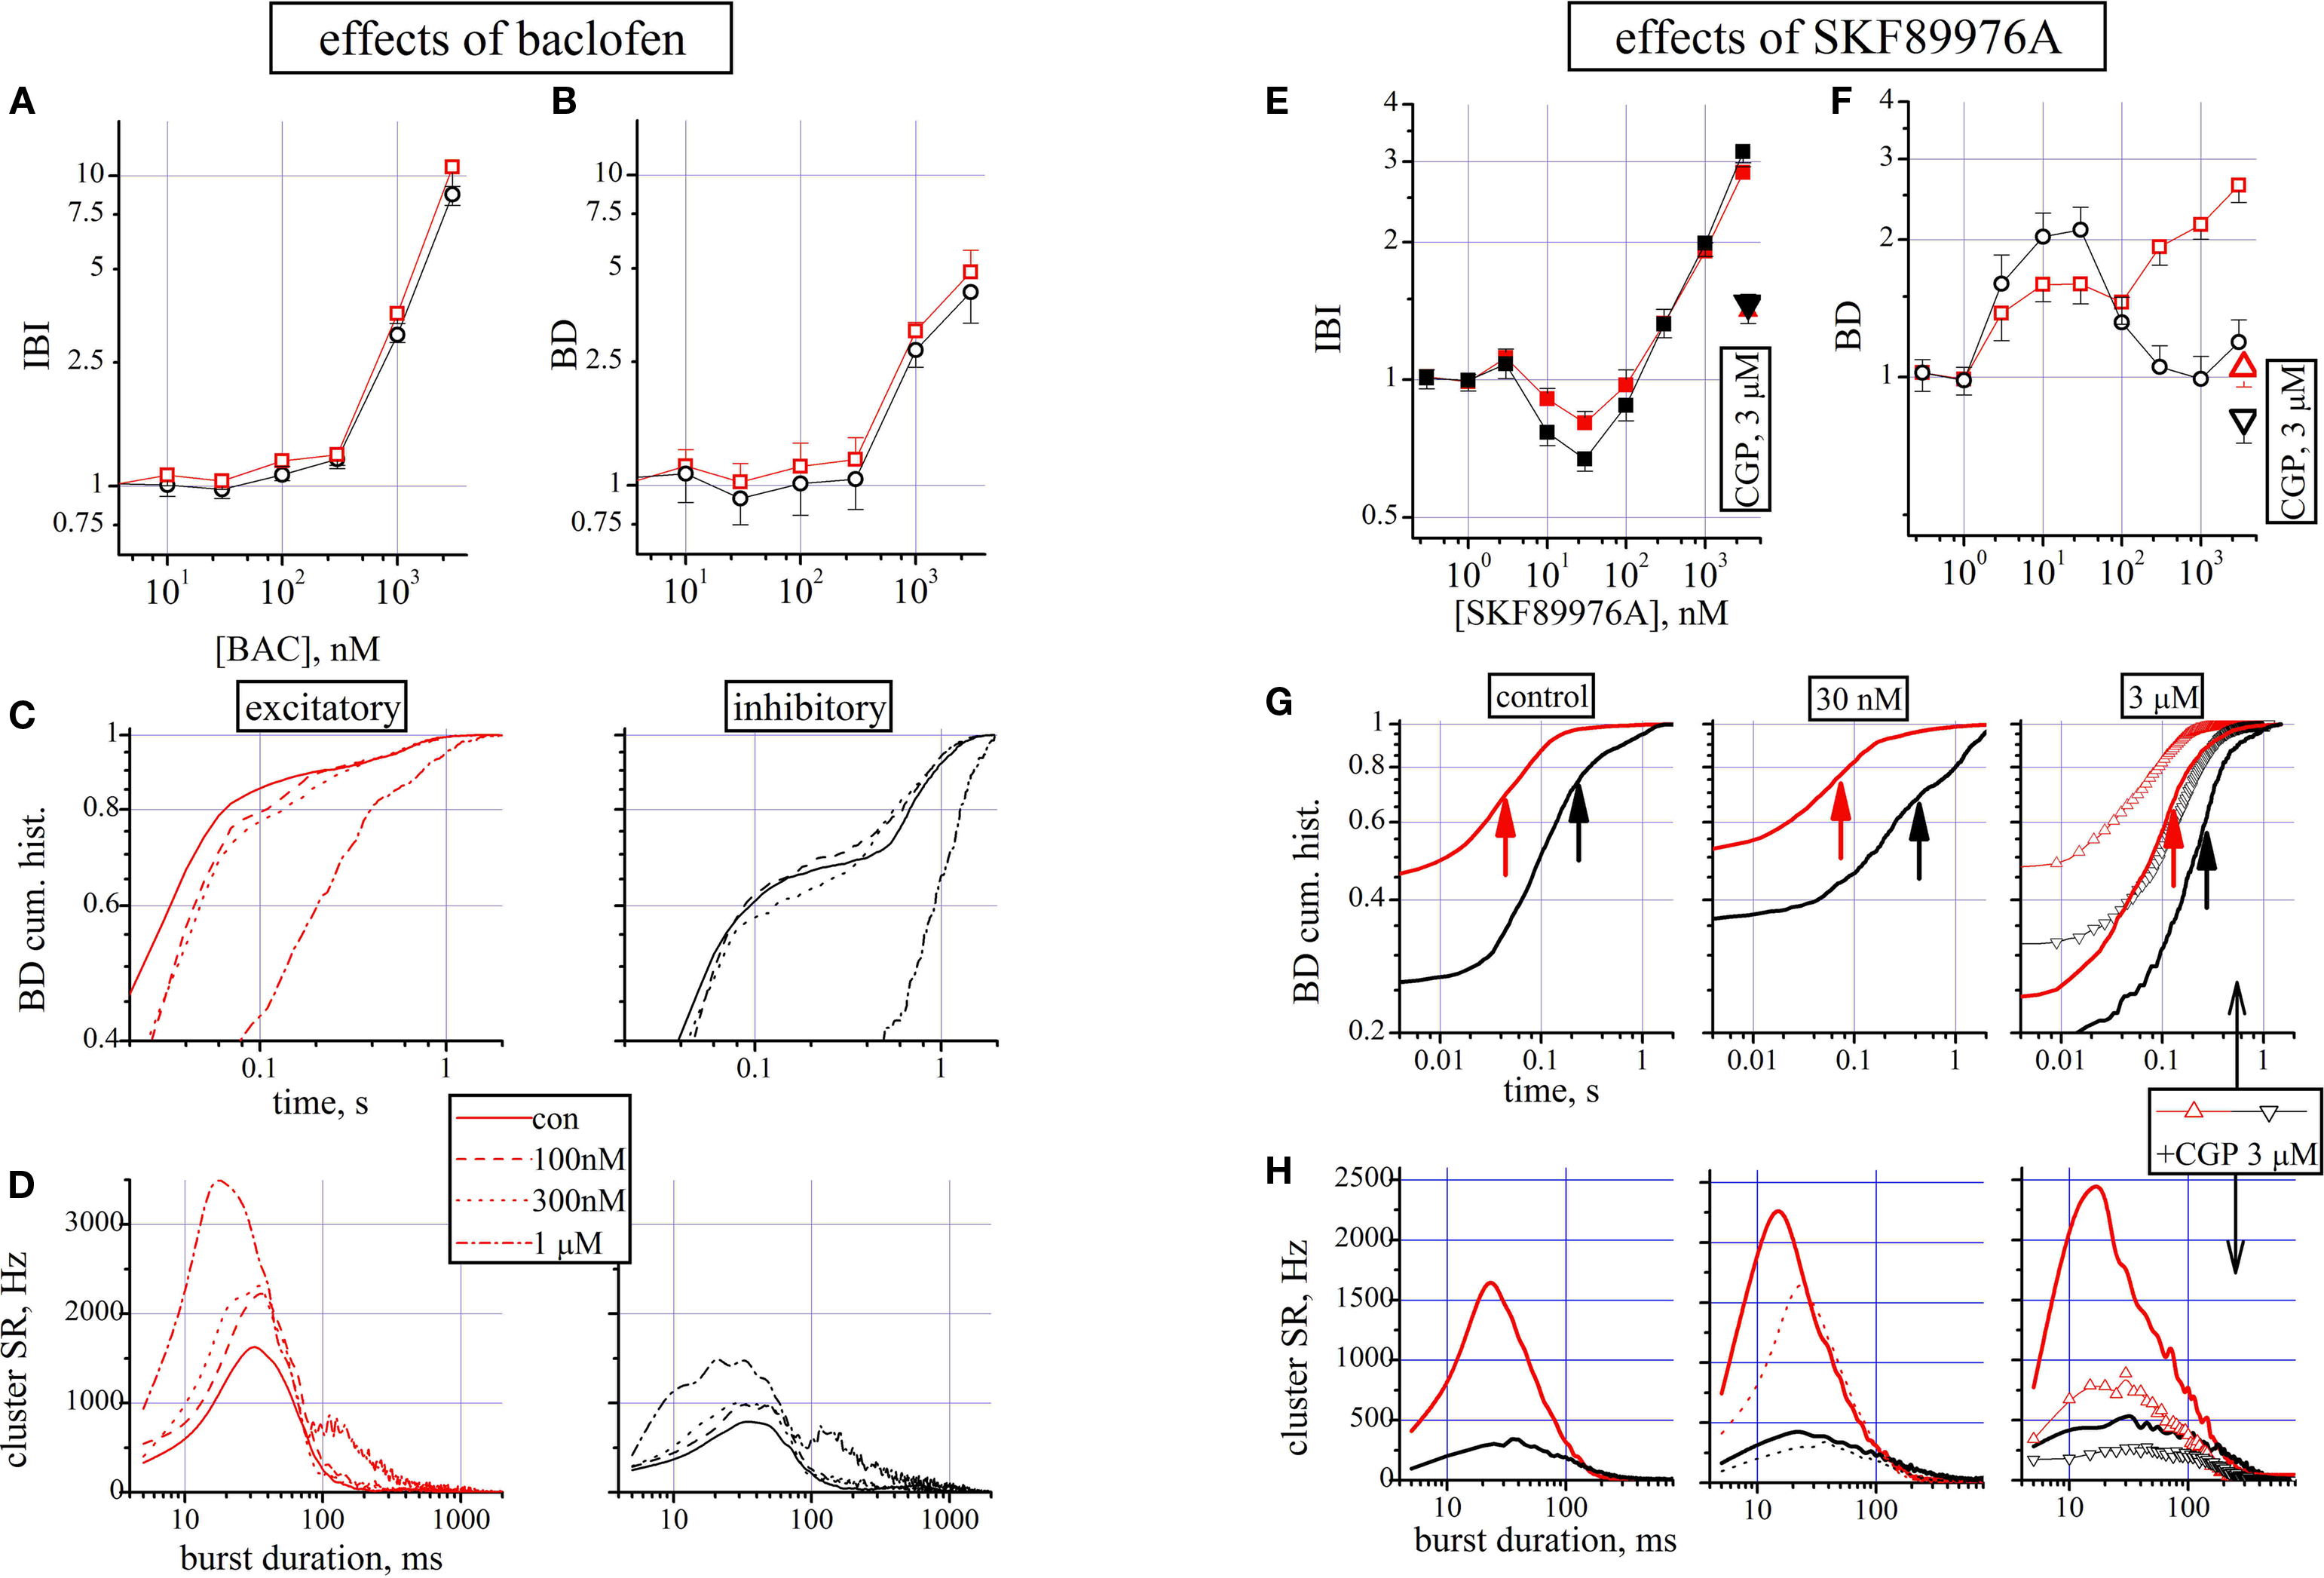
Figure 3. Effects of baclofen and SKF89976A. (A–D) Effects of baclofen. (A,B) Dose–response curves for IBI and BD evaluated for the excitatory (red symbols) and inhibitory (black symbols) cluster of neurons (total number of cells: 153, 33, respectively). (C) For one of the three experiments and the two related cell clusters, the BD cumulative probability is shown in control, 100, 300 nM and in 1 μM BAC (see legend for different line styles). The average values of BD for the two clusters were 88 ± 4 and 286 ± 6 ms in control and 276 ± 15 and 737 ± 73 ms in 1μM BAC, n = 42 and 13 respectively. (D) From the same experiment shown in (C), the cSR data are shown superimposed for the above concentrations for excitatory (left) and inhibitory (right) clusters. (E–H) Effects of SKF89976A. (E,F) Dose–response curves for IBI and BD evaluated for the excitatory (red symbols) and inhibitory (black symbols) cluster of neurons (total number of cells: 169, 39, respectively). After the highest SKF concentration, a dose of 3 μM CGP was added on top and the corresponding data are shown as triangular symbols. (G) For one of the three experiments and the two cell clusters, the BD cumulative histograms are shown in control (left panel), in 30 nM (middle) and in 3 μM (right) SKF. Arrows indicate the mean values. Data with triangles show the results after the CGP addition on top of SKF. For the same experiment shown, the BD values for the excitatory (inhibitory) clusters were: 45 ± 5 (212 ± 34 ms) ms in control, 73 ± 17 (450 ± 99 ms) ms in 30 nM SKF and 121 ± 13 (257 ± 48 ms) ms in 3 μM SKF, n = 52 and 11 respectively. The average IBI values for the two clusters were: 6.7 ± 0.2 and 5.8 ± 0.3 s in control, 5.5 ± 0.32 and 3.9 ± 0.23 s in 30 nM SKF and 19.3 ± 0.6 and 18.3 ± 0.98 s in 3 μM SKF. (H) From the same experiment shown in (G), the average cSR recorded during the bursts in control (left) and in 30 nM (middle, dotted lines replicate data in control) and 3 μM (right) SKF. In the last panel the data of the effect of adding 3 μM CGP on top of SKF is shown, as indicated, in triangle + line legend.
In all three experiments the addition of 1 μM CGP in the presence of a maximal BAC concentration recovered the network almost to control (not shown). In Figures 3
A,B the IBI and BD dose–response data suggested an inhibitory effect on the burst rate and a parallel and considerable increase of BD. Both effects are expected because: (1) the BAC-induced increase in the K+ current IGIRK should hyperpolarize cells preventing firing and increasing the down-state duration (Sohn et al., 2007
), (2) BAC should inhibit the Ca2+ currents in the synaptic terminals decreasing release and finally inducing an increase of the number of spikes elicited by excitatory cells (Porter and Nieves, 2004
).
To further investigate the reasons which were behind the BD increase, we studied in detail one experiment (42 and 13 cells respectively) whose cumulative probability of the BD histogram is shown in Figure 3
C left and right for excitatory and inhibitory clusters, respectively. Data are shown in control, at 100 nM, 300 nM and 1 μM BAC with different line styles. Small concentrations yielded insignificant effects, but 1 μM produced a net increase of the BD duration.
The control (lines) data show that about 70% of the BDs are shorter than 50 and 500 ms in excitatory and inhibitory cells, respectively (t-test, p < 10−5). In the presence of 1 μM BAC (line and point) the histograms are right shifted and many of the short BD bursts disappeared and 70% of bursts had BDs of 300 and 1300 ms in excitatory and inhibitory clusters, respectively (t-test, p < 10−10).
To gain insight into the changes in burst structure produced by the different concentrations of BAC, we superimposed in Figure 3
D left and right the firing rate histograms of excitatory and inhibitory clusters, respectively. Data from different concentrations of BAC were statistically different from control when compared in the same cluster (p < 0.02, except for the 100 and 300 nM pairs) and obviously between clusters (p < 0.001). For both clusters it is evident that the peak of activity and the leading edge of the curves at the highest concentrations were left-shifted, probably because less GABA is released producing a sort of disinhibition of the network as shown before in Figure 2
at GBZ concentrations of ∼1 μM. Also in the late phase it is possible to notice that the activity is prolonged with respect to control (p < 10−8 in the 100–500 ms region). Since at lower BAC concentrations data indicate similar increases of activity for both clusters, it is difficult to suggest if the neurotransmitters release inhibition prevails in excitatory or inhibitory synapses.
In conclusion, the scarce effects of CGP demonstrate that in control the release of GABA is poorly regulated by the GABABR-mediated feedback mechanism. Indeed, gradually reinforcing with BAC the presynaptic and postsynaptic pathways activated by GABABRs, the effects resemble both a disinhibition during the up state firing, and a decreased probability of starting a burst due to the putative hyperpolarization of the resting potential (Sodickson and Bean, 1996
; Leaney, 2003
).
GABA Transporter Blockade Robustly Altered Up- and Down-States
To study the effects resulting from a blockade of the GAT-1 transporter, we used a specific inhibitor like SKF89976A at concentrations ranging from 3 to 3000 nM. The reported effects, shown in Figures 3
E–H, were obtained only if the age of the cultured network were higher than 20div. Shorter ages resulted in data at which only the highest drug concentration was effective. Figures 3
E,F shows that the drug could affect both IBI and BD with opposite actions at low (30 nM) and high (3 μM) concentrations. To verify if the GABABRs were still functioning during the GAT blockade, 3 μM CGP was added on top of the last SKF concentration (open triangles). Indeed, it can be verified that the largest part of the effects seen during high [SKF] can be reset by the CGP action.
At low [SKF], at which we can hypothesize only a partial GAT blockade, we observed a shorter IBI (not significant, p < 0.1) and a longer BD (p < 0.003). In other words, the network significantly increased its spontaneous activity during the up-state. At high [SKF] the IBI became large enough to block the network activity for more than one minute.
To better investigate these effects we show in Figures 3
G,H the BD and cSR histograms at low, medium and high [SKF]. The cumulative probability histograms of BD were investigated (in a 28div dish with 52 and 11 neurons) in control (left), at 30 nM (middle) and 3 μM (right), and in CGP (open triangles). The changes observed at low [SKF] were small in excitatory cells (p < 0.08) where about 80% of BDs are below 90 ms, but at 3 μM the same percentage was reached at 200 ms (p < 0.01). On the contrary, inhibitory cell BDs behaved in opposite direction at low and high [SKF]. The 80% BD limit was 0.3 s in control, but increased to 1 s at 30 nM and decreased to 0.4 s at 3 μM (p < 10−5; see legend). In Figure 3
G right the 3 μM SKF and CGP data suggest that the largest part of the effects could be due to actions produced by GABABRs. Since it has been shown that the mode of functioning of GAT-1 could change between normal and reverse also under physiological conditions, we did not further investigate these effects (Wu et al., 2003
, 2009
).
To understand how up-states were temporally structured we analyzed also the histograms of the average cluster activity during the burst. These data are shown in Figure 3
H-left, middle, right, in control, 30 nM SKF, 3 μM SKF and plus CGP (open triangles), respectively. The main difference was found earlier at the burst start (10 ms) where, both at low and high [SKF], cSR doubled with respect to control and the peak cSRs were shifted from 20 to 12 ms (cSR in control and in 30 nM SKF was significantly different with p < 0.05 in both excitatory and inhibitory cells, in the 5–40 ms region). CGP addition rescued at a large extent the network activity, suggesting that the effect seen at high [SKF] are probably due to a strong disinhibition of excitatory cells caused by a reduction of released GABA in the early phase of the burst and not by an increased [GABA]o. Taken together, the results support a view in which only the high IBI values at 3 μM SKF is caused by high [GABA]o.
Ih Blockade and IM Potentiation Increase Interburst Intervals and Decrease Burst Duration
To investigate the role of near-threshold currents we used an Ih blocker (ZD7288, ZD; Gasparini and DiFrancesco, 1997
) and an IM enhancer (ICA-27243, ICA; Wickenden et al., 2008
). Blocking a pacemaker current under control conditions is expected to produce a resting potential hyperpolarization and consequently a decrease of excitability. However, we have seen from the results shown in Figure 2
that a strong tonic GABAergic inhibition is present and many neurons are almost silent. Thus, a further hyperpolarization mediated by a Ih block could completely eliminate these cells from the network activity. To unmask this putative condition which could interfere with the data analysis, we first disinhibited the network with a maximal concentration of GBZ (10 μM) and then applied on top increasing ZD concentrations. Under these conditions we further clarified if the role of Ih is different between inhibitory or excitatory neurons. As shown in Figures 4
A,B, increasing ZD concentrations produced a net BD decrease and IBI increase up to a total and completely reversible block of activity, suggesting a crucial role for this current.
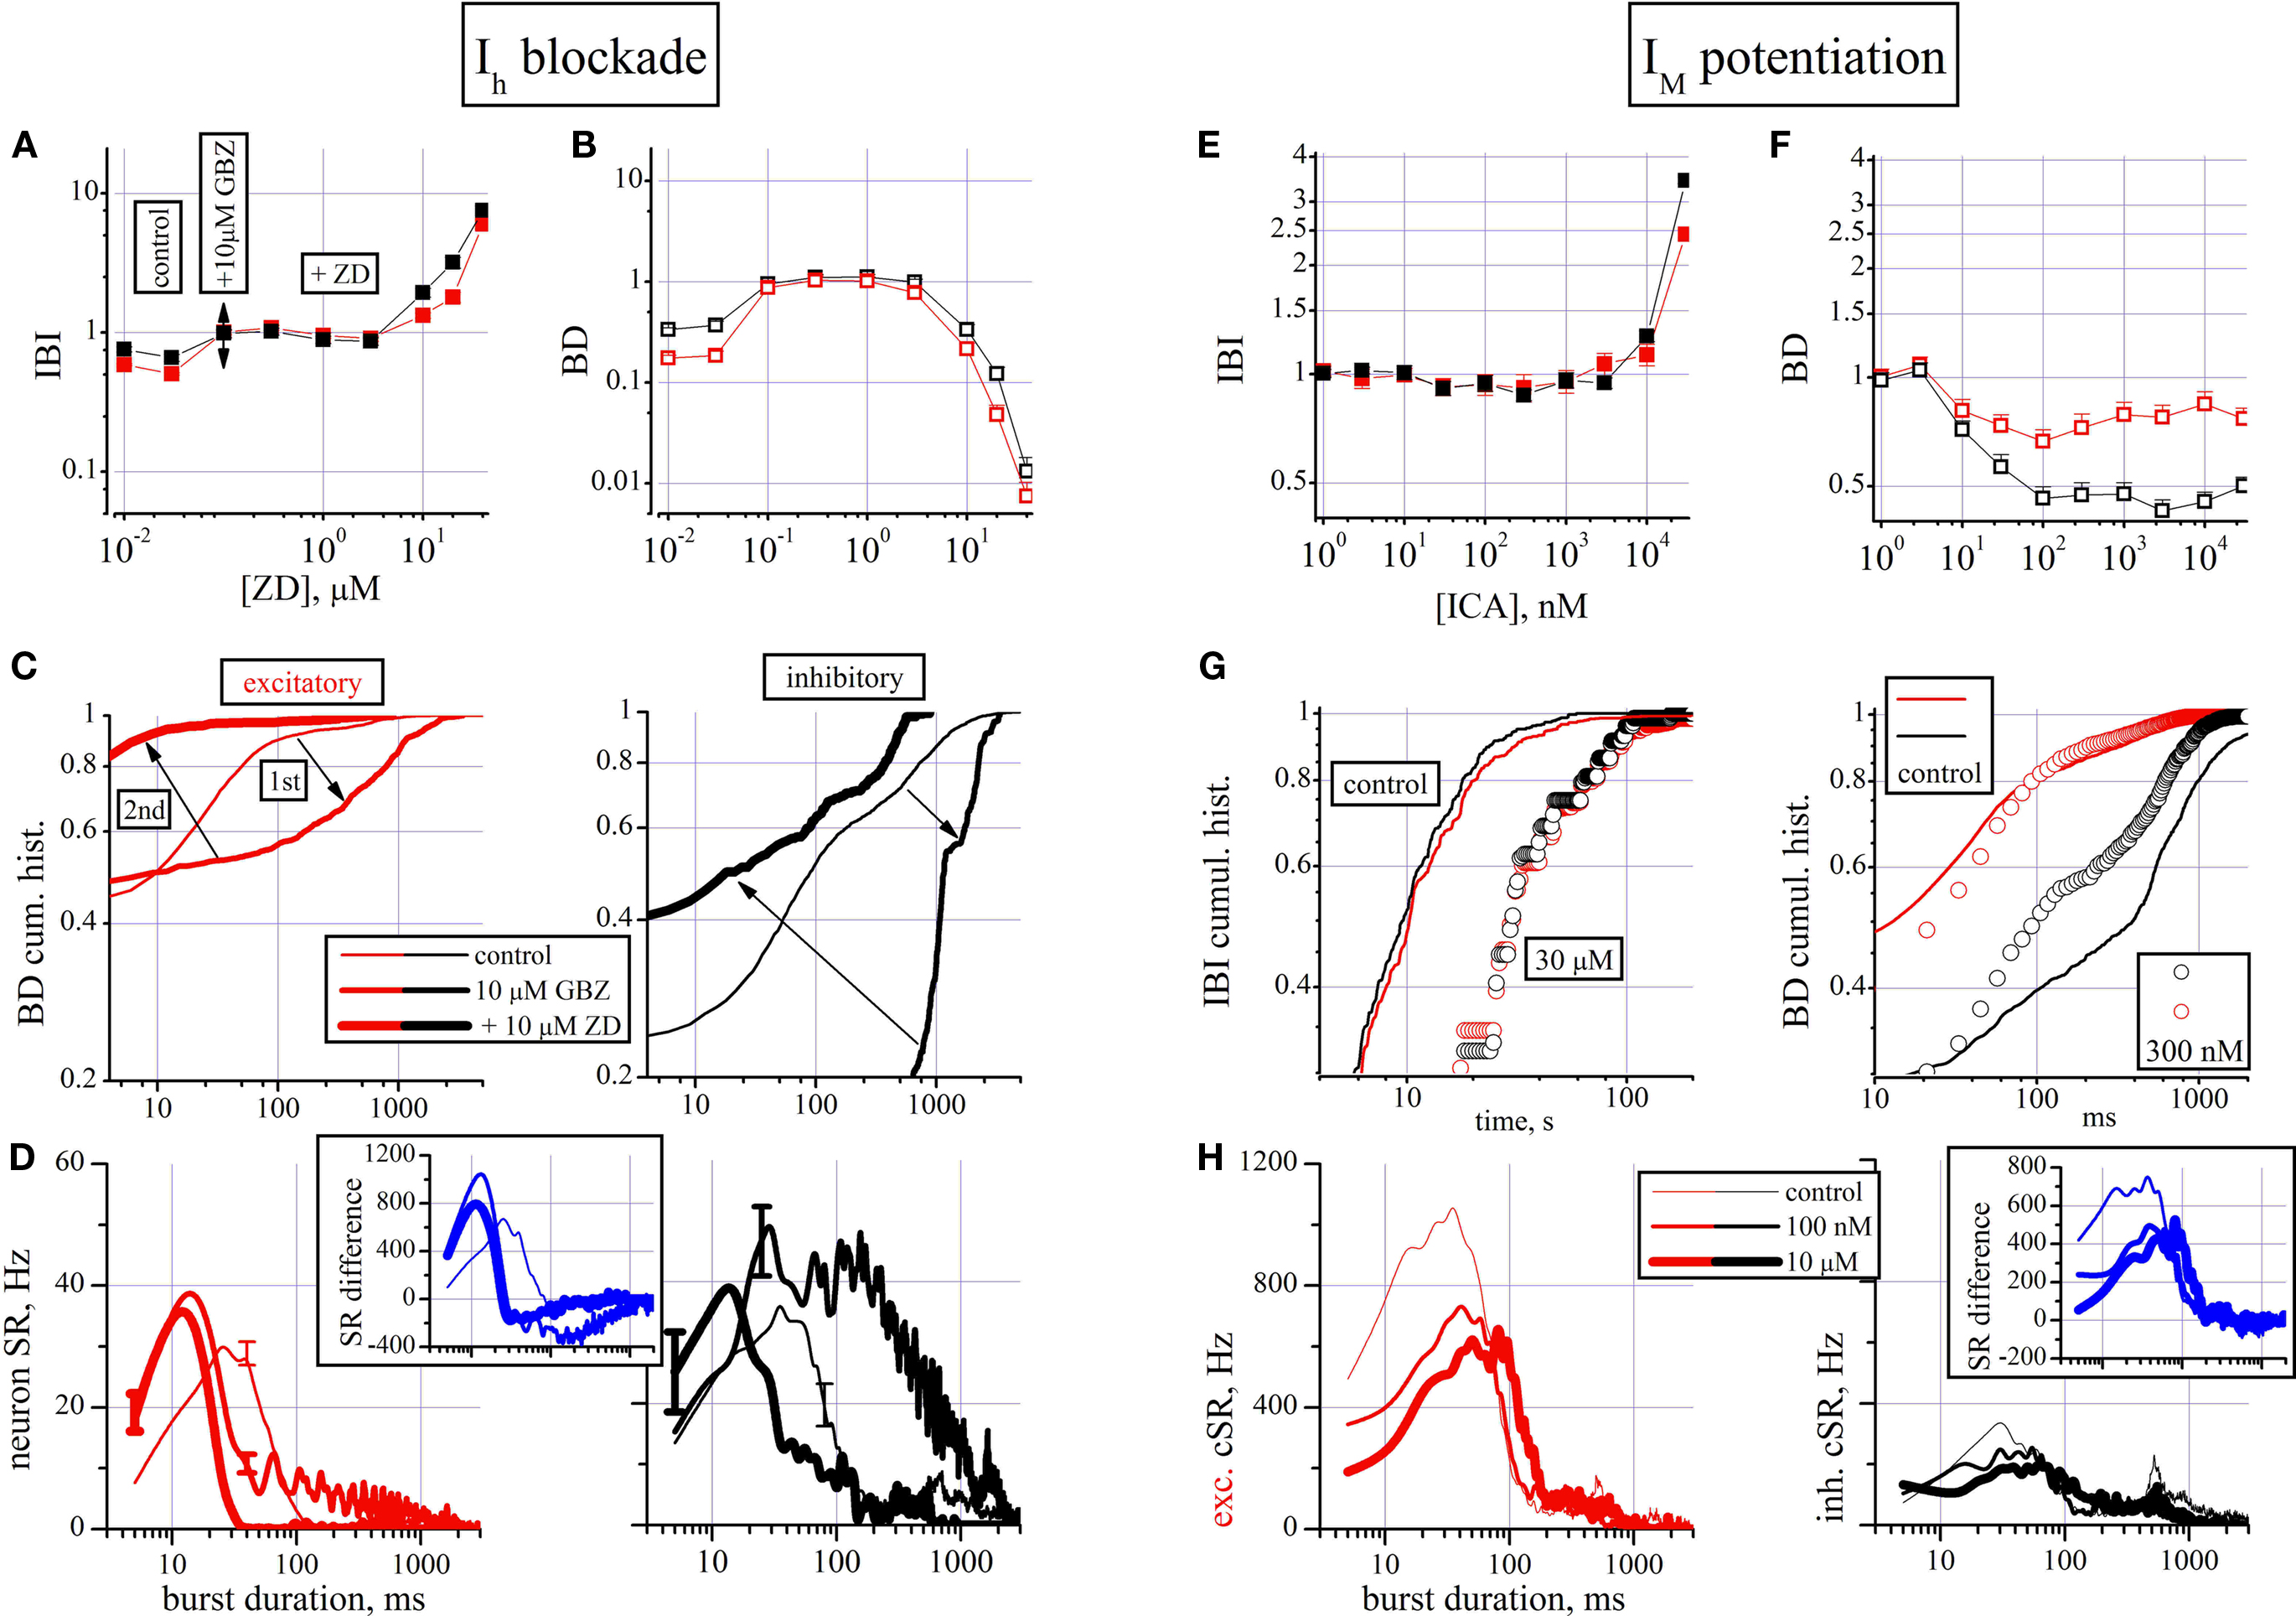
Figure 4. The effects of blocking Ih (with ZD7288) and enhancing IM (with ICA-27243) currents. (A–D) Effects of ZD. (A,B) Dose–response curves for IBI and BD evaluated for the excitatory (red symbols) and inhibitory (black symbols) cluster of neurons (total number of cells: 192, 45, respectively). (C) BD cumulative histogram data from one of the three experiments with 36 excitatory (left) and 13 inhibitory (right) cells. Arrows indicate the temporal sequence during the experiment. For the single experiment shown, mean values of IBI and BD (in parenthesis the inhibitory cells) in control were, respectively: 8.3 ± 0.3 s (7.4 ± 0.3); 61 ± 7 ms (405 ± 68), n = 36 (n = 13). The values in 10 μM GBZ were: 10.2 ± 0.4 s (15.5 ± 0.6); 374 ± 60 ms (1430 ± 0.8) and in 10 μM ZD were: 22.2 ± 1.3 s (19.2 ± 0.75); 70 ± 17 ms (450 ± 61). (D) nSR (neuron-normalized cSR in each cluster) is plotted versus burst duration, for excitatory (left) and inhibitory (right) typical cells. Thin, medium and thick lines are used to distinguish control, 10 μM GBZ and 10 μM ZD on top, respectively. Inset illustrates the cSR difference between excitatory and inhibitory clusters. (E–H) Effects of ICA-27243. (E,F) Dose–response curves for IBI and BD evaluated for the excitatory (red symbols) and inhibitory (black symbols) clusters of neurons (total number of cells: 190, 52, respectively). (G) Cumulative histogram of IBI (left) and BD (right), respectively for excitatory (red) and inhibitory (black) cells in control and at the indicated concentrations. For the single experiment shown, mean values of IBI and BD (in parenthesis the inhibitory cells) in control were, respectively: 17.1 ± 2.3 s (12.1 ± 0.6); 98 ± 14 ms (619 ± 82 ms), n = 52 (n = 14); in 100 nM ICA: 16.2 ± 2.4 s (11.8 ± 1.2 s); 64 ± 8 ms (280 ± 30 ms); in 10 μM ICA: 19.6 ± 2.9 s (14.9 ± 0.7 s); 86 ± 10 ms (260 ± 20 ms). (H) Plot of cSR in excitatory (left) and inhibitory (right) cells in control (thin lines), at 100 nM (medium lines) and at 10 μM ICA (thick lines), respectively. Inset: the difference of SR between excitatory and inhibitory clusters.
Both the BD and IBI effects seem to operate approximately at the same ZD concentration of about 30 μM. With the aim of clarifying the mechanism of the BD decrease in one (out of 3) experiments, we show in Figure 4
C the cumulative histograms of BD under control (thin line), in 10 μM GBZ (medium line) and 10 μM GBZ in the presence of 10 μM ZD (thick line). These data (follow the arrows) show the effect of disinhibition and blockade of Ih which produced a large increase and a strong shortening in the BD, respectively (p < 0.02 for all of the 15 pairs, excitatory/inhibitory, control/GBZ/GBZ + ZD).
The burst structure analysis was performed in the same three conditions and is shown in Figure 4
D in the form of nSR, because the cluster data were divided by the number of cells and error bars have been added to illustrate the error arising at level of single cells data. It illustrates not only the typical effect of disinhibition (already seen in Figure 2
D), but also how ZD is able to remove it completely (p < 0.003 for all of the 15 pairs (excitatory/inhibitory, control/GBZ/GBZ + ZD), except for the pair control-inhibitory/GBZ-excitatory, p < 0.3). In the inset, the difference of the cSRs between the two clusters clearly illustrates that under the three different conditions the activity of the up-states can be completely altered by pharmacological manipulations.
The potentiation of the IM current was obtained by using the selective IM enhancer ICA-27243 (Wickenden et al., 2008
). The results shown in Figures 4
E–H (190/52 excitatory/inhibitory cells from three experiments) suggested two different effects: first an early BD decrease at nanomolar concentrations (significant at p < 0.05 between excitatory and inhibitory cells) and, secondly, an increase of IBI (for both clusters) at micromolar concentrations. With the purpose of better describing these results, we show in Figure 4
G (in one representative experiment) the IBI (left) and BD (right) cumulative histograms. The excitatory and inhibitory IBI data are shown both in control (lines) and with 30 μM ICA (circles) and are significantly different (p < 10−9). However, the similarity of the excitatory and inhibitory plots suggested a good network activity with the participation of all types of cells. On the contrary, in Figure 4
G right BD data for the two types of clusters in control and with 300 nM ICA (circles) are shown (p < 10−6 for all pairs, except p < 0.05 for pair control-excitatory/ICA-excitatory). The average BDs of excitatory cluster decreased from 98 ± 14 to 64 ± 8 ms after application of 100 nM ICA and also inhibitory neurons changed their BDs from 619 ± 82 to 280 ± 30 ms (about 240 bursts were averaged during control and 40 during each ICA dose test; see legend for other average data).
The previous results correspond to durations of up-states, but they do not tell us the intrinsic role of activity for the two clusters during the up-state. These histograms are shown in Figure 4
H as cSR of excitatory (left) and inhibitory (right) cells in control (thin lines), at 100 nM (medium lines) and at 10 μM ICA (thick lines), respectively. Interestingly, only early (5–40 ms) activity decreased in excitatory cells from control to 100 nM ICA (Kolmogorov–Smirnov test, p < 0.02; all the other pairs tests resulted not significant). This is confirmed by the data shown in the inset where the SR difference shows that already at 100 nM ICA a strong early up-state inhibition of activity is present, suggesting a putative and peculiar effect on the excitatory cells.
On the whole, these data indicate that, in all neurons (but with different efficacy between excitatory and inhibitory sets), these near-threshold currents represent powerful mechanisms of control of both the threshold triggering mechanisms of the up- and down-state.
Riluzole Affects Network Activity Both at Sub- and Micromolar Concentration
Since riluzole at high concentrations (10 μM) is known to block the persistent sodium current INaP in cultured cortical neurons (Zona et al., 2002
) and inhibit bursting in foetal rat spinal cord networks (Darbon et al., 2004
), we decided to test it in our networks. Riluzole (ril) was tested in the concentration range from 10 nM up to 10 μM. In all experiments (n = 4; 176 and 68 excitatory and inhibitory cells) 10 μM riluzole completely silenced the network with complete washout in 20–30 min (not shown). The dose-dependent normalized IBI and BD data shown in Figures 5
A,B resulted in an IBI increase at riluzole concentrations greater 1 μM (Figure 5
A), but a small BD decrease started to be significant from 30 nM and the action was statistically different between excitatory and inhibitory clusters (p < 0.025). In order to better investigate these latter effects, in Figure 5
C left and right (excitatory and inhibitory clusters, respectively) are shown the BD cumulative histograms in control (thin line), and 300 nM (medium line) and 5 μM riluzole (thick line) obtained from 1/4 MEA dish. These data suggest that ril at high concentration cause a strong left-shift of both the excitatory and inhibitory histogram curve (p < 0.001), namely a robust shortening of the active state in the 10–100 ms region, although this effect is only barely visible at 300 nM (medium curves, p < 0.08). Notably, at this concentration, no effects are seen in IBI values. When we investigated, in Fig. 5D, in each cluster the SR histogram during the lifetime of the burst, we noticed that the control peak activity was halved (p < 0.001). In 3/4 experiments, we noticed a clear effect already at 100 nM (not shown). This inhibition of early activity was stronger at 5 μM and was accompanied by a complete stop of burst firing at about 100 ms as it was already observed in Figure 5
C. Although our data confirm previous hypothesis on the inhibition of IBI activity, those observed at much lower concentration deserve a supplementary investigation (see Discussion)
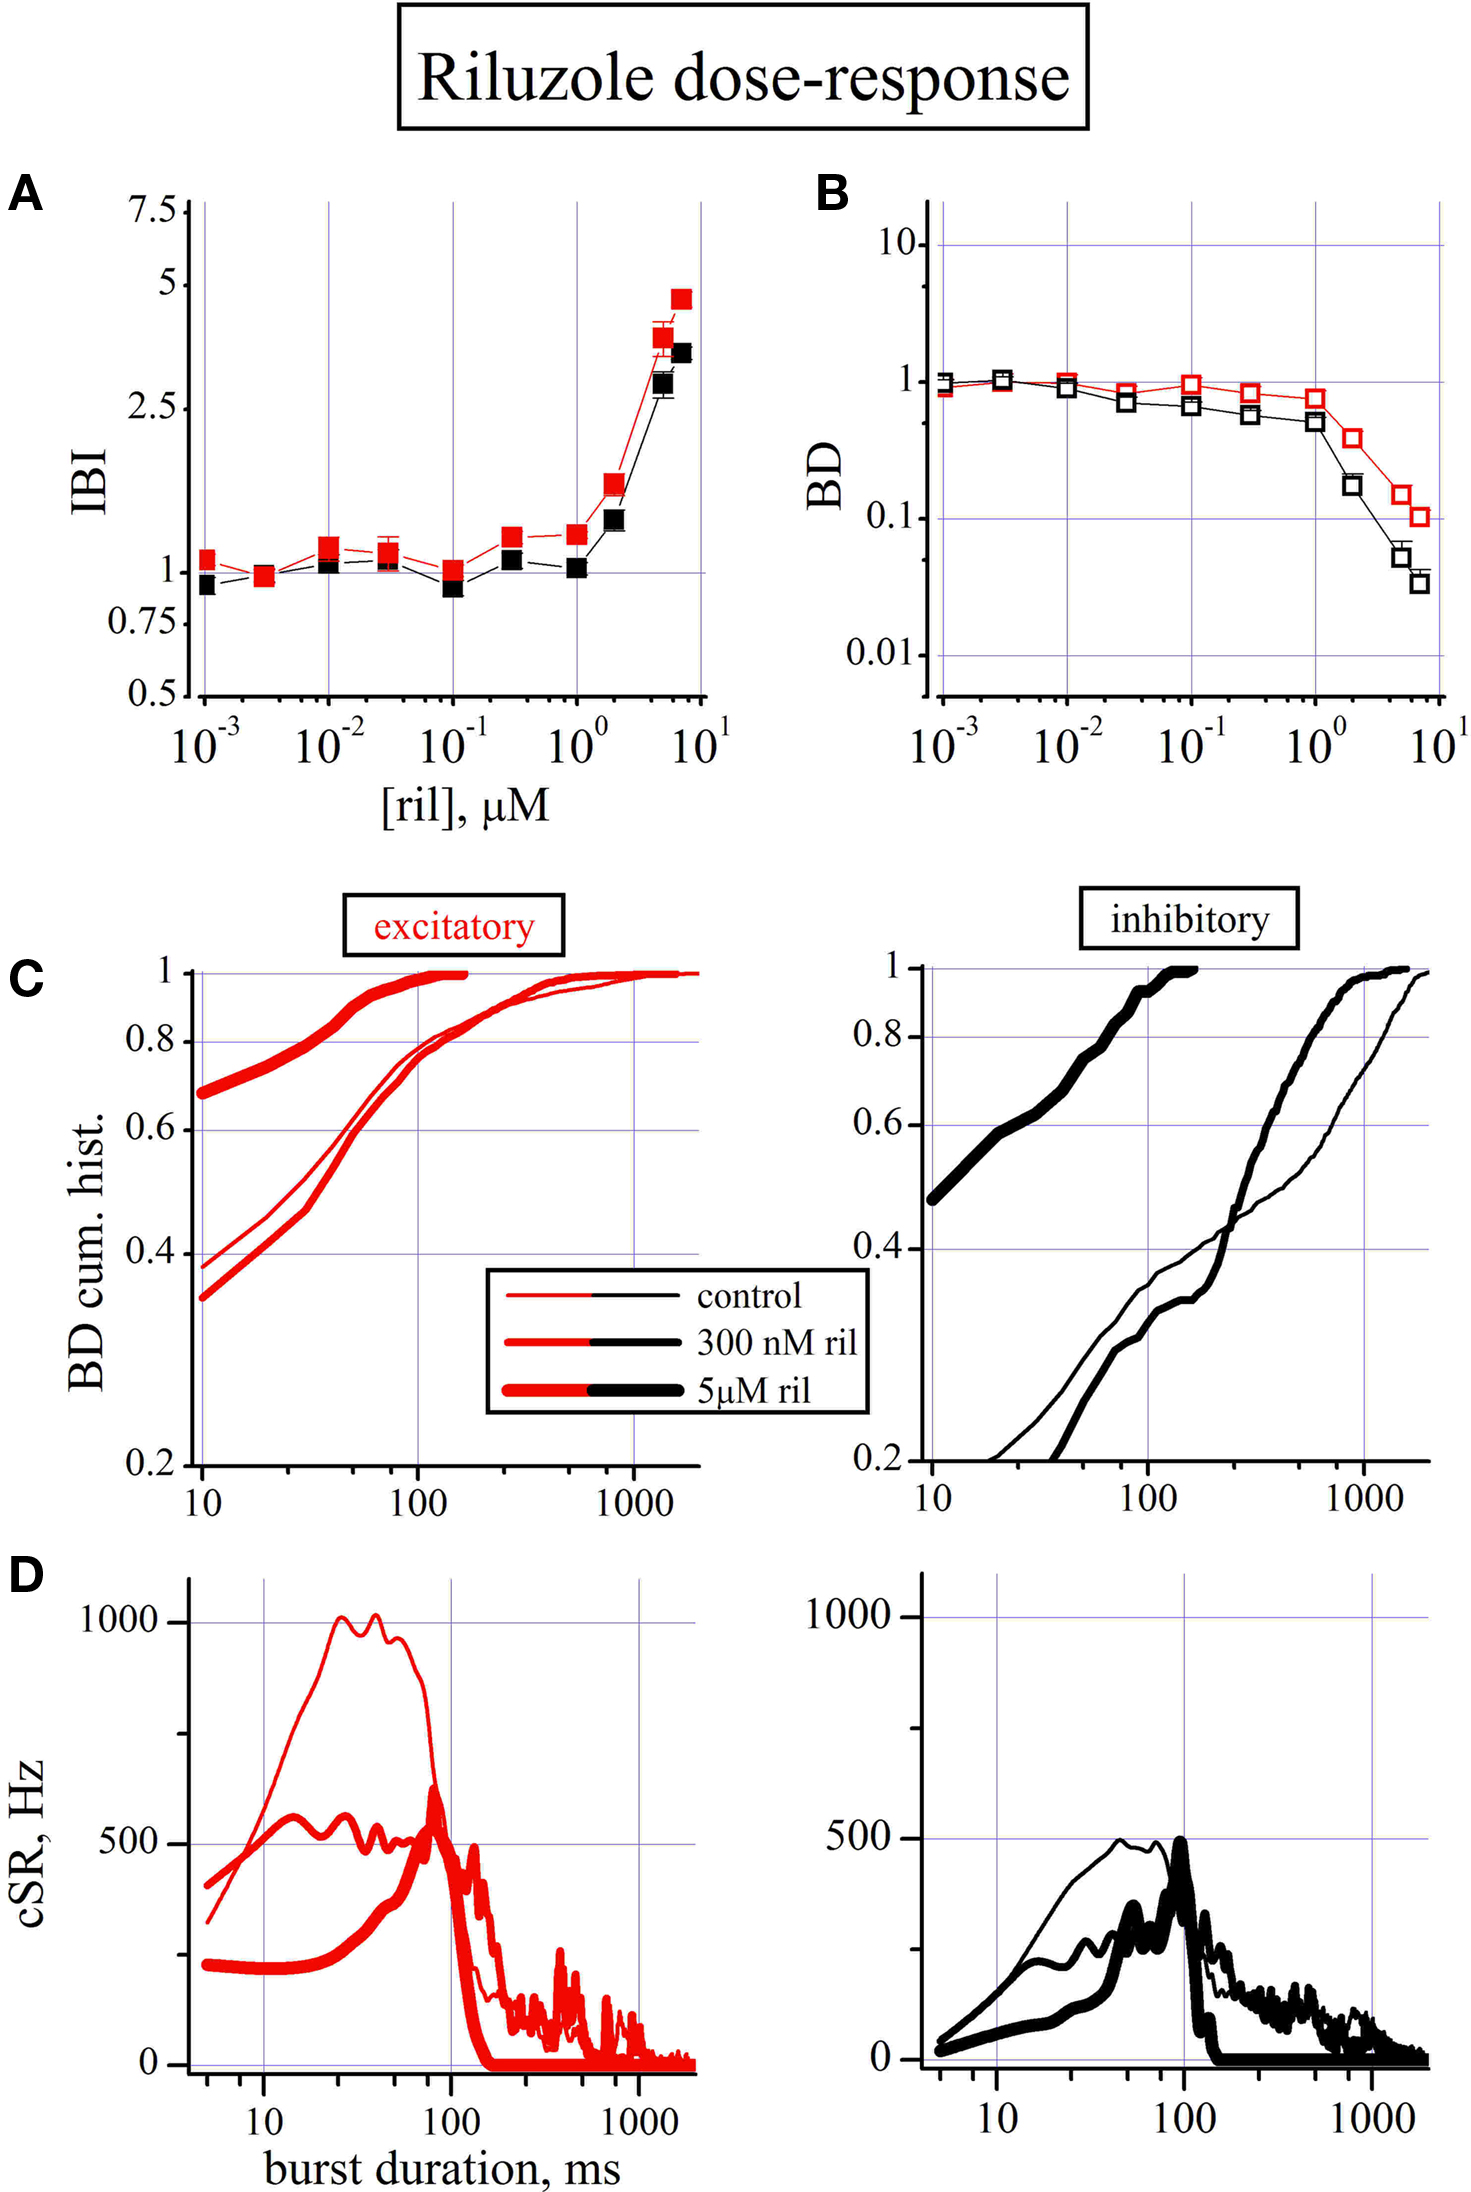
Figure 5. The dose–response effects of riluzole. (A,B) Dose–response curves for IBI and BD evaluated for the excitatory (red symbols) and inhibitory (black symbols) cluster of neurons (total number of cells: 176, 68, respectively). (C) BD cumulative histogram data from one representative experiment out of four experiments with 44 excitatory (left) and 17 inhibitory (right) cells. Data are shown in thin, medium and thick lines for control, 300 nM and 5 μM ril, respectively. For the single experiment shown, mean values of IBI and BD (in parenthesis the inhibitory cells) in control were, respectively: 25 ± 1.3 s, (23 ± 1.6); 100 ± 15 ms (602 ± 34). The values in 300 nM ril were: 31 ± 2 s, (26.8 ± 0.9); 83 ± 10 ms (331 ± 29) and in 5 μM ril were: 83.3 ± 6 s, (81.8 ± 8); 15 ± 2.6 ms (30 ± 9). (D) cSR is plotted versus burst duration, for excitatory (left) and inhibitory (right) cells. Data are shown in thin, medium and thick lines for control, 300 nM and 5 μM ril, respectively.
The dynamics and statistics of synchrony and the process of recruitment of neuronal activity has been intensively studied both experimentally and theoretically by various groups using the MEA technique on serum-conditioned cultures and neuronal avalanches were found to control these activity patterns (Beggs and Plenz, 2003
, 2004
; Eytan and Marom, 2006
). Moreover, the definition of “network spike” (NS), was used to characterize the exponential growth of activity during recruitments and allowed the authors to hypothesize a non-random hierarchical process with scale-free topology as predicted by theory (Eytan and Marom, 2006
).
On the contrary, waveform sorting and identification of firing units were less studied until recently (Gullo et al., 2009
) when use of the waveform identification, PCA analysis and Mahalanobis-controlled outliers removal was adopted as currently done by neurophysiologists in vivo (i.e. Barthò et al., 2004
).Furthermore, although GABAergic receptors have been suggested to govern the up- and down-state between population bursts recorded in slices with multiunit and patch-clamp techniques (Menendez de la Prida et al., 2006
; Mann et al., 2009
), few data were available in the form of dose–response curves by using large-scale multielectrodes recordings on long-term serum-free cultured cortical cells (Keefer et al., 2001
; Gramowski et al., 2004
; Tateno et al., 2005
). Almost completely lacking are data on the role of voltage-gated ion channels active near resting potential and threshold potential and those concerning the role of ligand-gated meta- and iono-tropic receptors in the phasic and tonic inhibitory mechanisms and [GABA]o homeostasis.
Recordings in each dish were done from ∼75 ± 4 (n = 15 dishes) neurons, but it should be stressed that ∼2000 cells are present in ∼2 mm2 area of MEA electrodes (this value is double of the counted cells in the immunocytochemistry data shown in Table 1
because in those experiments many cells were lost during the washing procedures and we plated less cells than normal to facilitate a safe cell detection). In conclusion, although our data originate from a relatively small NN as compared to those synapticallly linked and contributing to the spontaneous reverberating activity, the results should be considered a rather reproducible sample of activity, especially if compared to the best classical electrophysiology of two to three cells recorded in each experiment in slices (Mann et al., 2009
).
We have here examined the results of cellular and synaptic processes that govern both lifetime of network bursts and silent periods. Moreover, simultaneous recordings, in each MEA dish with hour-long durations, allowed us to describe, in a concentration–response mode, the action of several drugs targeted to change the inhibitory GABA transmission (A, B receptors and GABA transporter) and the near-threshold Na+ and K+ currents Ih, INaP and IM, respectively.
Postnatal Cortical Cultures
In our work, cortical murine cell cultures were obtained from P1 mice. Only recently this species has been used for such analysis, because of the increasing number of studies on experimental transgenic models of human neuropathologies. However, numerous papers on cultured cortical neurons both from mice (Lesuisse and Martin, 2002
; Sang and Tan, 2003
; Klueva et al., 2008
) and from rats (de Lima and Voigt, 1997
; de Lima et al., 2004
, 2007
, 2009
; Kato-Negishi et al., 2004
; Magnusson et al., 2008
) used embryonic cultures. In fact, postnatal cultures are more difficult to obtain, but the networks are functioning and mature after the first week in vitro (Gullo et al., 2009
). In particular, the GABAergic system, depolarizing during prenatal period (Owens and Kriegstein, 2002
; Kato-Negishi et al., 2004
), resulted already inhibitory in these cultures.
Two principal cellular components were identified in our cultures: GFAP-positive glial cells and MAP2-positive neurons. Also other studies using MEA in the electrophysiological approach (van Vliet et al., 2007
) detected both the cellular types, which are typical of mixed postnatal cultures frequently used for biochemical analysis (Misonou and Trimmer, 2005
). Moreover we also identified a small nestin-positive component (unpublished observations), that usually decreases during in vitro development (Magnusson et al., 2008
) and probably represents immature glial cells. GABA immunolabelling demonstrated the presence of scattered GABAergic neurons distributed in the cultures. In addition, we also observed two types of GABA-positive cells, confirming data obtained by previous morphological studies on rat cultures (de Lima and Voigt, 1997
; de Lima et al., 2009
). The total GABAergic population resulted almost 20% (19.2 ± 1.4% SEM), consistent with studies on the cortical GABAergic system both in vivo and in vitro (de Lima and Voigt, 1997
; Gabbott et al., 1997
; Sang and Tan, 2003
; Tsugorka et al., 2007
; de Lima et al., 2009
). In particular GABA-positive neurons counted in vitro in the second week generally varied from 10 to 24% of the total neuronal population (de Lima and Voigt, 1997
; de Lima et al., 2009
). Comparison of the morphological composition in our system with other studies in vitro are confounded due to the great variety of developmental stages, methods of obtaining cultures, different DIV, and the various media and trophic supports (such as glia) used by various labs (de Lima and Voigt, 1997
; Misonou and Trimmer, 2005
; Magnusson et al., 2008
; de Lima et al., 2009
).
The Contrasting Effects of Phasic and Tonic GABAA Disinhibition and the Control Conditions
The results shown in Figure 2
, covering a large range of concentrations from 20 nM to 10 μM GBZ, are in good agreement with the conclusions of Stell and Mody (2002)
that receptors mediating tonic inhibition have an affinity for GABA higher than the ones mediating phasic inhibition, although all receptors are bound by GBZ with approximately equal affinity. These modes of inhibition have been found in various CNS areas like cerebellum, hippocampus and thalamus (for reviews Semyanov et al., 2004
; Farrant and Nusser, 2005
). The observed GBZ effects can also be explained if the receptors mediating the two currents had different affinities for the antagonist, however there are reasons for favouring the first explanation (Stell and Mody, 2002
). In our experiments, the shortening of BD in the region 20–200 nM GBZ (∼50%) was very similar to that observed by Mann et al. (2009)
in rat cortical slices, but they increased the GBZ concentration only up to 500 nM and not up to our values, probably because these high values are difficult to analyze in their preparation. Indeed, in our networks only very high GBZ values create frequent network oscillations as shown in Figures 2
D,E.
The full statistical analysis of the recordings obtained by the MEA technique allowed us to show that in control conditions the total number of spikes generated in each cluster are almost equal but severe changes are produced during the concentration–response studies (see Table 2
). Moreover, it should be stressed that surprisingly, only about 10% of all of these spikes are produced during the early phase of the burst up to the SR peak, always positioned around 30 ms from the start. Similar data about the recruitment of spiking activity of a whole platform (no clusters identification) was previously studied showing how, in the early fraction of the network burst activity, an exponential growth equation fits the SR (Eytan and Marom, 2006
). Our data shown in Figure 2
could be tentatively fitted to a classical Hodgkin–Huxley equation (similar to that used for explaining the time-dependent Na+ conductance), i.e. SR = a × (1 − e−t/τex)3 × e−t/τinh, where a is a constant and τex and τinh are the time constants of the excitatory and inhibitory synapse connectivity. It is difficult to say if the changes of the empirical parameters found during the pharmacological changes could help the interpretation of the physiological processes taking place in the network.
Potentiation of GABABR Role
The observations that neurotransmitters depress Ca2+ currents in chick dorsal root ganglion cells and in sympathetic neurons (Dunlap and Fishbach, 1981
; Wanke et al., 1987
) suggested that a similar mechanism might operate at a GABAergic nerve terminal (Kajikawa et al., 2001
). Moreover, it has also been shown that a selective GABABR agonist activates a K+ current, namely IGIRK, in hippocampal neurons (Sodickson and Bean, 1996
; Leaney, 2003
) and in neocortical neurons (Sickmann and Alzheimer, 2003
; Sohn et al., 2007
). More recently, data indicate that both in hippocampus and in thalamo-cortical projections the presence of GABABRs are involved in the control of both glutamatergic and GABAergic release (Lei and McBain, 2003
; Porter and Nieves, 2004
; Yuan et al., 2009
).
The role of GABABRs in the CA3 disinhibited minislices has been previously considered important by Menendez de la Prida et al. (2006)
. They studied the population bursts by using intracellular recordings and both focal and MUA before, during and after each burst. Among the various interesting results, they demonstrated that GABABRs govern the IBIs and that a threshold mechanism is at the base of an all-or-none process.
Blocking the [GABA]O Homeostasis
A full blockade of GAT should produce a net increase of [GABA]o, which in turn could originate both an increase of GABAA-mediated tonic inhibition (more silent cells) and a further postsynaptic GABABRs-mediated inhibitory action (probably through the GIRK K+ channels) (Scanziani, 2000
). On the other hand, it is difficult to predict the consequences of partial GAT blockade. One should also take into account that GABABRs could control the transmitter release presynaptically not only in the GABAergic but also in glutamatergic terminals (Lei and McBain, 2003
; Porter and Nieves, 2004
).
Our data suggest that low concentrations of SKF are sufficient to unbalance the control activity by facilitating the firing of the excitatory neurons in the first 25 ms following the burst start. This finding suggests the possibility these cells are less inhibited (phasic) because the steady-state higher local [GABA]o activates the GABABR-induced decrease of neurotransmitter release. This situation is very similar to the effects observed in Figure 2
D when, at 200 nM GBZ, only the phasic GABAARs inhibition were blocked with the consequence that excitatory neurons, no longer inhibited, could fire at a higher rate.
Blocking the Pacing Role of Ih and the Dual Effect of Riluzole on Early Activity and Silencing
Depending on the cell type, Ih in the brain contributes to generation of rhythmic activity and determination of the resting membrane potential (McCormick and Pape, 1990
; Robinson and Siegelbaum, 2003
). The current is present from the first stages of development (Kilb and Luhman, 2000
) expressed in layer I cortical interneurons and layer V entorhinal cortex pyramidal neurons, and is modulated by dopamine (Wu and Hablitz, 2005
; Rosenkranz and Johnston, 2006
). Our data suggest that the IC50s of relevant physiological effects, such as BDs and rate, were obtained between 3 and 10 μM ZD. These results are in agreement with the reported capability of this drug to decrease epileptiform hyperexcitability (Inaba et al., 2006
) as we did in our experiments in a GBZ pre-conditioned network. Since the time constant for activation of Ih around the neuronal resting potential is greater than 1 s, it has been suggested that its partial blockade slightly hyperpolarizes the neurons and the synaptic bombardment is no longer able to reach the firing threshold.
Riluzole, besides being a INaP blocker, inhibits also Ca2+ and K+ currents (Duprat et al., 2000
; Ahn et al., 2005
). Recently it was observed to produce only oscillations in spinal cord networks when used at 1–2 μM (Yvon et al., 2007
), suggesting a different action with respect to reported results indicating a silencing action at high concentrations (Darbon et al., 2004
). More recently riluzole was described to inhibit glutamate release in hypoglossal motoneurons probably via presynaptic NMDARs (Lamanauskas and Nistri, 2008
). These authors, following an old indication (Noh et al., 2000
), showed that this action can be mimicked by protein kinase C blockers.
Taken together, these data indicate that the mechanisms of action of riluzole could be completely different at high or low concentrations during the quiescent and active states of the network. On one hand, at high concentrations the increase of IBI here demonstrated seems in line with the notion that riluzole blocks INaP, thus causing inhibition of firing because of the cell firing threshold increase. On the other hand, at low riluzole concentrations (in our case smaller that 300 nM, about one order of magnitude less than reported by others), we showed a pronounced SR peak decrement exactly when the excitatory neurons are supposed to maximally release glutamate. This result appears to be a novel result and putatively linked to the PKC inhibiting role (Noh et al., 2000
). Further experiments to verify that our results can be reproduced also by using specific PKC blockers are in progress.
Enhancing the Firing Accommodation Role of IM Current
The M-current is a K+ current (Kv7, KCNQ) tonically active at resting membrane potentials, which regulates the generation and frequency of APs (accommodation) and is a target of neuromodulatory action by mAChRs (Brown and Adams, 1980
; Cooper and Yan, 2003
). It has been identified in pyramidal and inhibitory neurons in both somatodendritic and axonal regions, as well as in nodes of Ranvier (Cooper et al., 2000
, 2001
; Schwarz et al., 2006
). Interestingly, human mutations in Kv7 subtypes were discovered and related to human generalized epilepsy called benign familial neonatal convulsions (BFNC, Charlier et al., 1998
; Dedek et al., 2001
). Our results clearly suggest a multi-mode of action because we found that two different physiological effects can be recorded in network activity. ICA-27243 (ICA) produced a maximal reduction of BD at about 100 nM as shown in Figures 4
E,F and a further strong increase of IBI beyond 10 μM. These values coarsely correspond to those reported for a selective action on KCNQ2/3 channels and for putative unselective action on KCNQ4 or KCNQ3/5 (Wickenden et al., 2008
). Interestingly, the maximal effects on BD observed at 100 nM are lower than the EC50 of 400 nM calculated by Wickenden et al. (2008)
measured at −40 mV, a membrane potential at which approximately 10% of the channels are open. The fact that we observed a significant effect at very low drug concentrations only during the up state could be explained by the peculiar role of this current in governing the spike frequency accommodation. Indeed, during long bursts the mean membrane potential is slightly higher than resting and the number of spikes is under the control of the negative feedback produced by the voltage-dependent properties of M-current. Potentiation of this current by ICA would hyperpolarize the membrane sufficiently enough to silence firing. On the other hand, immediately after a burst, the cells are slightly hyperpolarized and most M-channels are closed. Only then, the slow process of returning to the firing threshold can begin. Under these conditions, low concentrations of the drug are unable to produce any appreciable effect because the channels are at rest and only much higher concentrations are necessary to induce an IBI increase, as shown in our experiments.
Comparing HH Action Potential and CNS Bursts
Menendez de la Prida et al. (2006)
, concluded their study on the threshold and IBI of bursts recorded in the CA3 disinhibited hippocampus by comparing the hippocampal population burst with the Hodgkin–Huxley AP. They suggested that glutamatergic synaptic events and GABABR-mediated synaptic events may be analogous to Na+ and K+ channels openings. On the whole, our data also suggest that the spontaneous bursting in much simpler CNS networks has many of the functional properties of the AP in excitable membranes. However, we have evidence from MEA recordings at 1–3div that the initiation of the reverberation bursting has a threshold on the availability of synaptic connections because at these early culture ages, it is possible to record activity from neurons independently firing at random.
In Table 3
we characterized some of the relevant properties common to both physiological phenomena: AP or network burst (NB). The Na+ and K+ ion channels present in an excitable membrane (in a correct proportion of about 10:1, Conti et al., 1975
) have a strong linkage in their common voltage-dependence but the different kinetics for their opening favours the fast inward Na+ regenerative current against the K+ currents. Moreover, the balancing of the inward and outward resting currents, together with the regenerative properties fix a threshold for the all-or-none phenomenon. On the contrary, in the CNS networks, the large excess of excitatory versus inhibitory neurons and all their synaptic links produce a very fast activation of many cells firing at a high SR. This early activation occurs before a reasonably strong GABAA inhibitory action could take place and continue up to the end of the phasic inhibition.
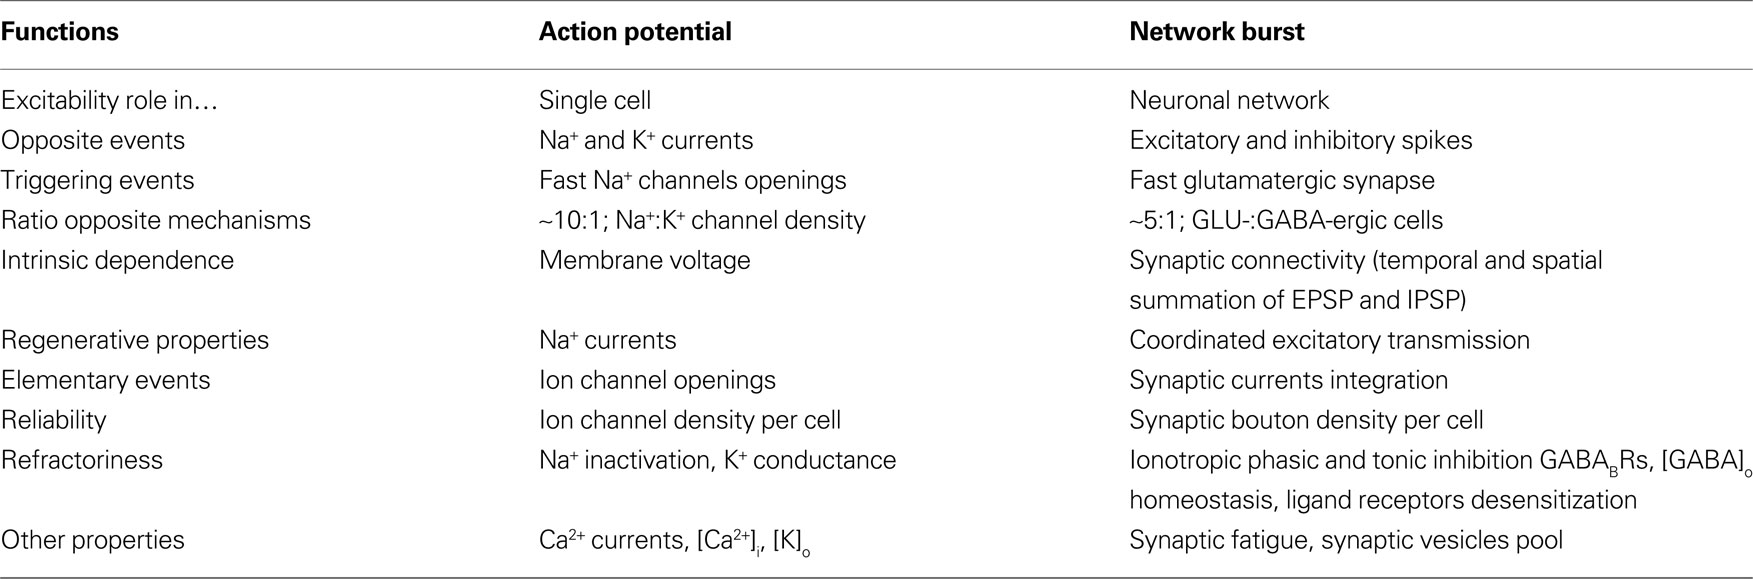
Table 3. Comparison between action potential and network burst.
It should be stressed that a remarkable difference exists between the opposite events during AP and burst because Na+ and K+ channels work “independently” of each others in 1 ms; on the contrary, in the burst (during 20–1000 ms) excitatory and inhibitory actions produce a dynamic exchange of effects because small range (10–100 μm) and fast propagation of synaptic connectivity allows a continuous swap over of information not only at level of different cells but also at the EPSP/IPSP summation of the large number of boutons present on each cell.
Only after this early period, the orchestra starts to play and all the instrumentalists begin to follow the “tempo” as it can be seen in Figure 2
D right and Figure 2
E when the slow oscillations at about 12–25 Hz synchronize the violinist and the double-bass players!
Conclusions and Future Perspectives
The novel results presented in the present work include: (1) a well-defined and stable serum-free conditioned network with inhibitory and excitatory cell ratio very close to that observed in vivo (see Cell Cultures and Immunocytochemistry), (2) a waveform sorting controlled by statistical conservative procedures (Gullo et al., 2009
), (3) a two-cluster statistical separation based on firing features extracted for each neuron (see Neuronal Cluster Identification and Normalization), (4) the NN belonging to each cluster fits the histochemical proven ratio (see Neuronal Cluster Identification and Normalization), (5) the cluster-dissected population burst histograms allowed to identify the time-dependent recruitment of excitatory and inhibitory spikes and (6) all the pharmacological manipulations with specific drugs were studied by describing the effects as dose–response relationships. To our knowledge, up to now, these properties were never included at the same time in any investigation studying the synchrony of neural cortical networks by using MEA techniques.
This analysis should be correct because in our recording system (60 electrodes confined in a 2-mm2) no wave-like directional propagation was never observed by us and others (Marom and Shahaf, 2002
; Eytan and Marom, 2006
) and because AP propagation in vivo has a speed of ∼1.7 mm/ms (Henze et al., 2000
). On the contrary, the development of large scale MEAs (9 or 60 mm on 250 electrodes at 200 or 500 μm inter-electrode spacing) will allow studies in which the role of activity propagation will be important and synchrony will no longer hold but specific spatio-temporal analysis will be implemented (we have evidence from preliminary experiments on 256–200 μm MEAs that this is the case). Moreover, the simultaneous analysis of LFPs and spike waveforms, which probably report the input synaptic bombardment and the output integrated information from one or more neurons will strongly help the comprehension of cortical mapping and computation of neural activity.
On the other hand, the development of high-density MEA systems (10 μm inter-electrode spacing; Berdondini et al., 2009
; Frey et al., 2009
) will allow a much more precise mapping of the interaction between adjacent cells.
The authors declare that the research was conducted in the absence of any commercial or financial relationships that could be construed as a potential conflict of interest.
This study was supported by grants from the Italian Ministero dell’Università e della Ricerca Scientifica e Tecnologica (MURST-COFIN 2007-2009) and Cariplo Foundation “Functional regeneration of the mesocorticolimbic dopaminergic system as a model to study novel neuro-reparative strategies” (2008.2907) to Enzo Wanke. Andrea Maffezzoli is a post-doc student and Elena Dossi is PhD student of the Milano-Bicocca PhD School.
The Supplementary Material for this article can be found online at http://www.frontiersin.org/neuralcircuits/paper/10.3389/fncir.2010.00011/