


- Department of Biological Sciences, Howard Hughes Medical Institute, Columbia University, New York, NY, USA
In one of the most remarkable feats of motor control in the animal world, some Diptera, such as the housefly, can accurately execute corrective flight maneuvers in tens of milliseconds. These reflexive movements are achieved by the halteres, gyroscopic force sensors, in conjunction with rapidly tunable wing steering muscles. Specifically, the mechanosensory campaniform sensilla located at the base of the halteres transduce and transform rotation-induced gyroscopic forces into information about the angular velocity of the fly’s body. But how exactly does the fly’s neural architecture generate the angular velocity from the lateral strain forces on the left and right halteres? To explore potential algorithms, we built a neuromechanical model of the rotation detection circuit. We propose a neurobiologically plausible method by which the fly could accurately separate and measure the three-dimensional components of an imposed angular velocity. Our model assumes a single sign-inverting synapse and formally resembles some models of directional selectivity by the retina. Using multidimensional error analysis, we demonstrate the robustness of our model under a variety of input conditions. Our analysis reveals the maximum information available to the fly given its physical architecture and the mathematics governing the rotation-induced forces at the haltere’s end knob.
Introduction
The true flies, insects of the order Diptera, are capable of astounding aerobatic feats of agility with only a single pair of wings. A male housefly can make corrective course changes to track a female fly within 30 ms (Land and Collett, 1974). This complex task requires substantial information processing but is performed in an organism whose brain contains only 100,000 neurons. As such, flies need an accurate circuit capable of detecting changes in body rotation. A highly specialized mechanical apparatus is used to provide appropriate information to these local circuits and enable flight stabilization with incredibly short response latencies. Mechanosensation of rotational stimuli is generated by the halteres, barbell-shaped appendages that evolved from hind wings. They function as gyroscopic sensors of rotational force by virtue of their constant oscillatory motion anti-phase to the wing (Nalbach, 1993; Pringle, 1948).
The halteres are positioned behind the forewings and are sheltered from many aerodynamic forces during flight (Nalbach, 1993; Dickinson, 1999). During a rotation, however, the halteres’ motion occurs in a non-inertial reference frame and the halteres are accordingly subjected to various forces and pseudoforces. Acceleratory rotations about the axes of the fly’s body generate centrifugal, Euler’s (due to angular acceleration), and Coriolis forces, among others, which put lateral strain on the moving haltere (with the lateral direction defined as perpendicular to the beating plane of the haltere.) The haltere oscillates approximately harmonically, generating forces in a sinusoidal fashion (see Nalbach 1993). During a rotation, the forces described above are thought to be detected by mechanoreceptor strain gauges called campaniform sensilla in the base of the halteres. Detection of these forces generates the input necessary to calculate the angular velocity of the fly’s body. The output of the halteres impinges on the steering muscles of the wing, causing them to stiffen or relax, changing the course of the wing and thus a change in the trajectory of the fly.
The flies only sense the lateral components of force acting on the halteres, as has been shown in experiments in which flies do not show any corrective responses to rotations around the axes of the halteres. Such rotations only generate forces in the radial direction, or along the axis of the haltere, with apparently no component projecting laterally from the haltere beat plane (Nalbach, 1993; Dickinson, 1999). In addition, haltere afferents likely evolved to detect only the lateral forces due to the massive, continuous presence of primary inertial forces in the radial and tangential directions, which outweigh the Coriolis forces in those directions by orders of magnitude. There are several anatomically distinct groups of campaniform sensilla; it is not clear whether all groups sense lateral force or only a subset (Fayyazuddin and Dickinson, 1996). These sensors are located at the haltere’s hinge, endowing them with maximal strain detection (Wu et al., 2002).
In this study, we sought to better understand the computations underlying these aspects of the fly’s motor control and modeled how the halteres could be transducing Coriolis forces into accurate measurements of angular velocity. The only angular variable correlated with wing beat amplitude that directly modulates the flight trajectory is angular velocity, implying that flies have access to this information (Dickinson, 1999). The complete aerodynamic system of the fly has been modeled previously (Dickson et al., 2008), but the neural architecture and computation that could produce reliable estimates of angular velocity from the lateral forces on the haltere during a body rotation have yet to be explored sufficiently. More recently, Thompson et al. (2009) also modeled how such a calculation could be performed, but it is unclear how their algorithm could be implemented neurobiologically.
The understanding of a complex information processing system such as this one requires multiple layers of analysis. In this system, the layer of analysis that has received the least attention is the algorithmic one (Marr, 1982): how does the hardware of the fly allow for the software to perform the necessary calculations? The question in this specific context is diagrammed in Figure 1. How does the fly’s neural architecture (Figure 1C) algorithmically produce the desired output, angular velocity, from the given input, i.e., the waveform of total lateral force on the left and right halteres (Figure 1B middle)? The neuromechanical model we propose in this paper not only explains observations of haltere structure and function but also yields novel and readily testable predictions. Our analytical approach underscores the power of incorporating the biomechanics of a physical system into a model of its function (Briggman and Kristan, 2008).
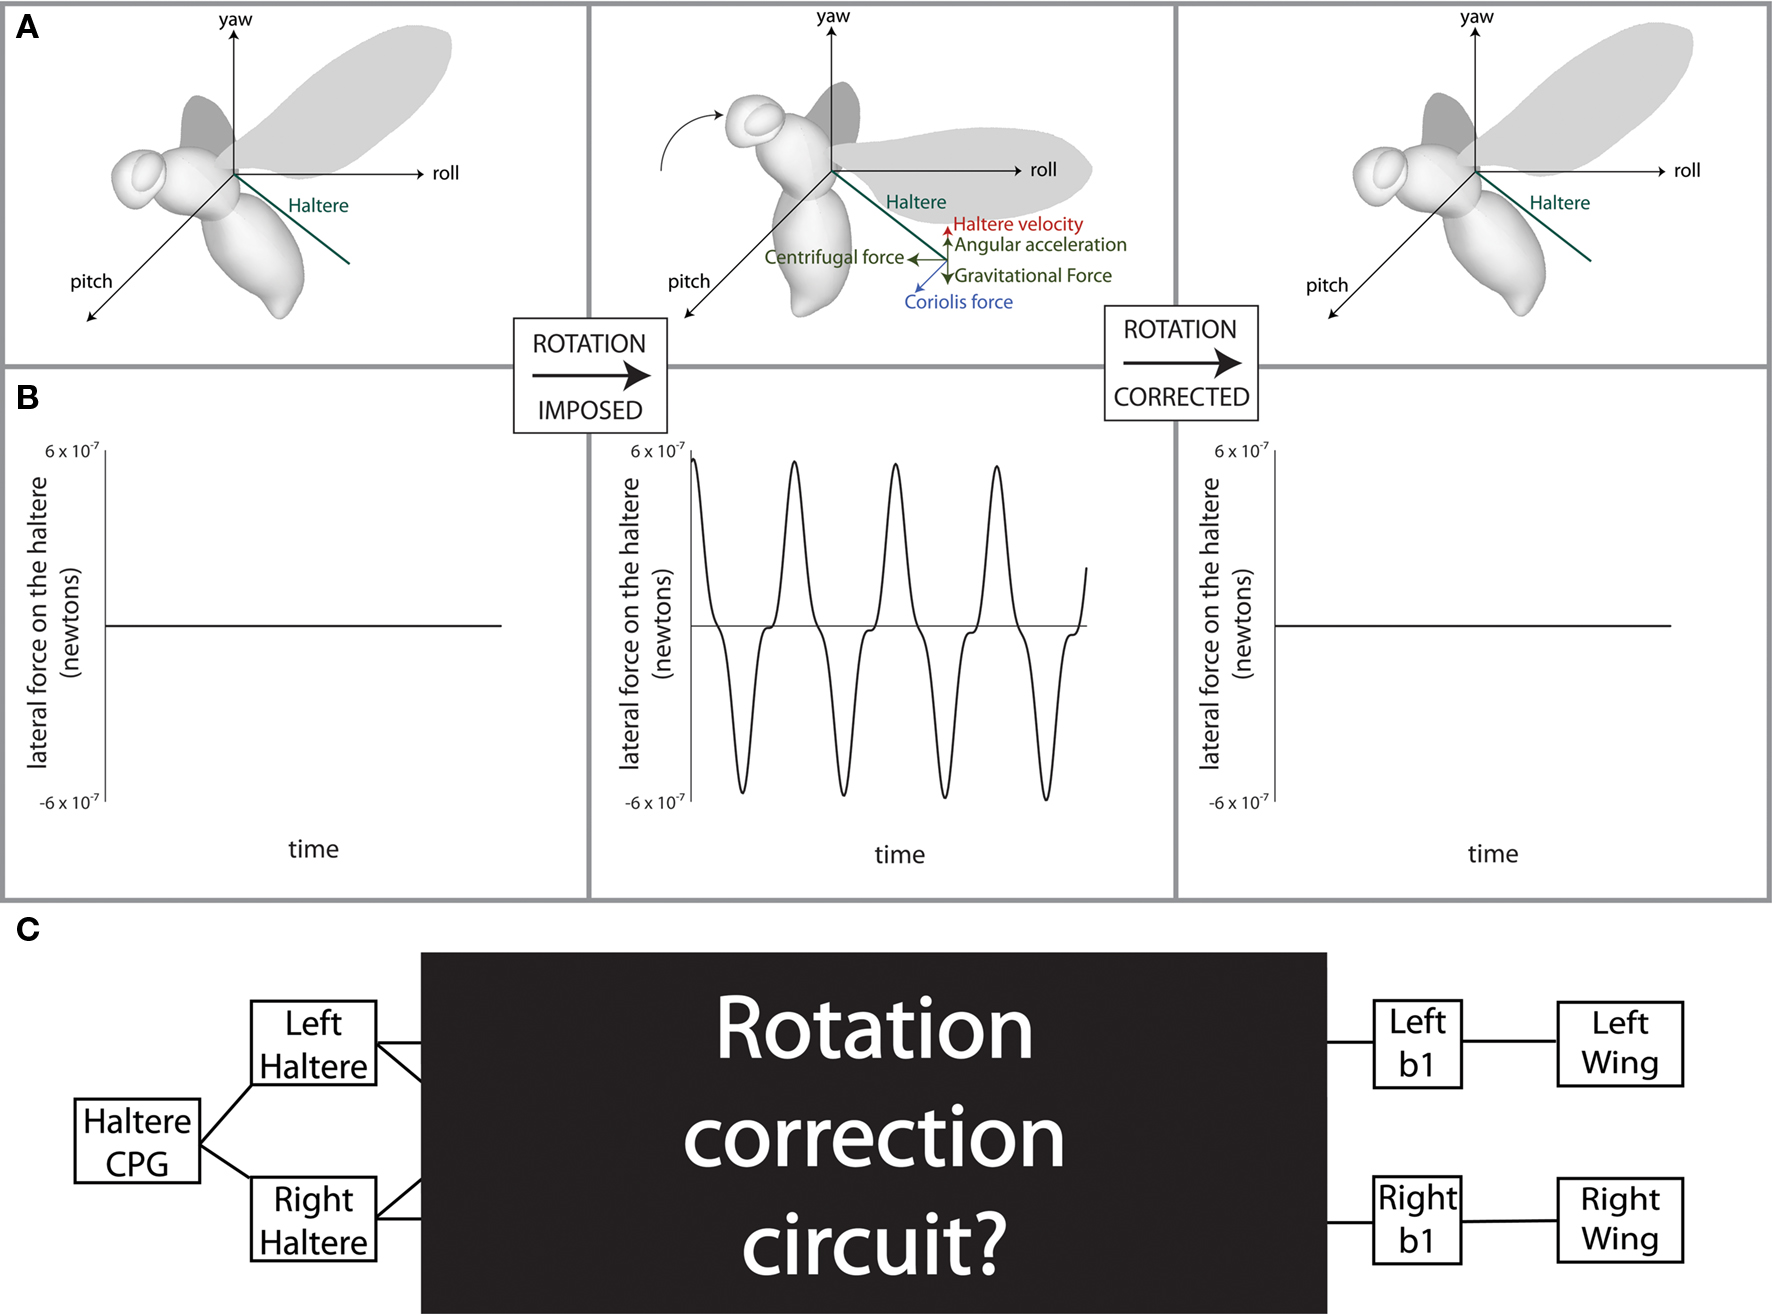
Figure 1. Force diagram and experimental goal. (A) Force diagrams and (B) plots are shown for a situation in which the fly is rotated in the pitch direction. (C) The location of the circuit which this study seeks to uncover situated within the known anatomy of the fly’s flight system. Modified from Dickson (2008).
Materials and Methods
Haltere Motion
Parameterization of the equation for simple harmonic motion1, Φ(t) = a sin(ωt + Φ), leads to the following expressions for the position of the left and right halteres. We define the x (pitch) axis to be the transverse axis of the fly, the y (roll) axis to be the longitudinal axis of the fly, and the z (yaw) axis to point orthogonally away from the other two axes. The following equations describe the position of the haltere in this coordinate system:
XL = A cos(Φ(t)) cos θ
XR = −A cos(Φ(t)) cos θ
YL = A cos(Φ(t)) sin θ
YR = A cos(Φ(t)) sin θ
ZL = A sin(Φ(t))
ZR = A sin(Φ(t))
where Φ(t) is the function describing the angle the haltere makes with the xy axis, a is the amplitude of the angular oscillation of the haltere, ω is the frequency of the haltere’s angular oscillation, Φ is the phase shift of the oscillation, A is the length of the haltere, and θ is the angle the haltere makes with the transverse axis, in the xy plane.
We now proceed to describe the forces which impinge on the haltere in a lateral direction. (Note: In this section we discuss only lateral forces, where the lateral direction is defined as orthogonal to the beat plane of the haltere. Positive and negative lateral directions are arbitrarily determined to be pointing toward and away from the fly’s thorax, respectively. The radial direction is along the stalk of the haltere, and the tangential direction is the direction of the tangential velocity of the haltere.)
The Coriolis Force on the Haltere in the Lateral Direction
Coriolis forces act on the mass of the moving haltere in a rotating reference frame. The Coriolis forces are the only forces which directly contain information about the angular velocity, so we focus on them in our algorithm to recover this value so critical to flight stabilization.
Notation: bold denotes a three-dimensional vector, e.g.,

a dot on top of a variable denotes a time derivate, e.g., 
The velocities of the left and right halteres are:
Given an angular rotation, Ω, defined as:

And the equation for the Coriolis force:
Fcoriolis = −2m(Ω × V)
We can solve for the Coriolis force on the left haltere:
To obtain the lateral component of the Coriolis force on the left haltere, project the force onto the vector defining the lateral projection of the haltere (−sinθ, cosθ, 0):
Grouping like terms:
Note that the yaw term Ωyaw reduces due to the trigonometric identity: sin2 θ + cos2 θ = 1
Leaving the following expression for the Coriolis force on the left haltere in the lateral direction only:
The calculation for the right haltere is similar except for minor changes in sign:
Other Forces on the Haltere in the Lateral Direction
During a rotation, three other forces – angular acceleration, centrifugal, and gravitational – have components which project laterally. These forces can be derived using the same trigonometric identity as in the derivation for the Coriolis force.
Angular Acceleration: 
The lateral components of the angular acceleration force generated by pitch, roll, and yaw rotations are equal to :
where m is the mass of the haltere,  is the angular acceleration of the fly’s body, and r is the position of the haltere within the rotating reference frame.
Centrifugal: Fcf = −m(Ω × (Ω×r))
The lateral components of the centrifugal force generated from roll and pitch rotations are equal to:
Gravitational: Fg = mg sin Ψ
The gravitational force depends on Ψ, the angle the lateral direction with respect to the haltere makes with the gravitational force. g is the acceleration due to gravity. Because Ψ depends on the lateral direction of the haltere, it is affected only by the angular position of the fly’s body with respect to the ground, not by the position of the haltere with respect to the fly’s body. We use quaternions to calculate the lateral direction of the haltere. From the initial angular velocities and angular accelerations, an axis in space and an angle Θ are computed through which the fly rotates about during the time until the required measurement is taken. The vector indicating the lateral direction with respect to the haltere’s beat plane is derived with quaternion multiplication:
where 〈μ〉 is a vector representing the three-dimensional Euclidian direction of the axis around which the fly rotates, Θ is the angle through which the fly rotates, 〈ν0〉 is the initial, three-dimensional Euclidian direction of the lateral direction with respect to the haltere beat plane, and p2 is a quaternion equal to (0, 〈p〉), a vector indicating the final three-dimensional direction of the lateral direction with respect to the haltere beat plane. Note: During our simulations, the fly often begins from a pitched and rolled position in space, so the pitch, roll, and yaw axes must be recalculated with respect to the fly’s body, not to the ground. The pitch, roll, and yaw axes must be rotated to maintain their definition with respect to the fly’s body. This is calculated via quaternion multiplication as well.
At any point during a rotation, a haltere is exposed to a sum of these forces. Forces due to angular acceleration, or Euler’s forces, are orders of magnitude smaller than Coriolis forces except at low angular velocities. The gravitational force, Fg, only has a lateral component when the fly’s body is angled relative to flat ground. The lateral component of the gravitational force, however, is not constant during a rotation as has been claimed previously (Nalbach, 1993; Wu et al., 2002) but rather changes depending on the angular position of the fly’s body in space.
The total lateral component of the forces on the left and right halteres during a rotation is the sum of the lateral components of each of the four forces described above:
Results
Algorithm
If pitch, roll, and yaw rotations generate forces with lateral components, and the campaniform sensilla are sensitive only to forces in the lateral direction, how can the different rotations be distinguished from one another? In effect, how can the fly generate labeled lines for the pitch, roll, and yaw angular velocity components of a rotation when none are inherent to the haltere? The answer to these questions requires extracting meaningful measurements of the magnitude and direction of the body’s rotation from the complex waveforms of the total lateral forces on each haltere, described by the equations above.
To recover the pitch component of the angular velocity, Ωpitch, the total lateral forces on each haltere are added. This removes the contributions of the roll and yaw Coriolis and angular acceleration forces to the signal, as they are out of phase between the left and right halteres. This results in twice the lateral force due to pitch rotation, as well as other, smaller-magnitude terms, whose contribution may be removed via means mentioned in the Section “Discussion”.
This expression has a sinusoid time dependence at the wing beat frequency, ω/2π. The information about the pitch component of angular velocity is conveyed in the changing amplitude of this waveform, as can be seen in Figure 2B. Ωpitch can be recovered by taking amplitude measurements of this signal at specific times (equivalent to convolving the summed force signal with a delta function, see Appendix for details) and division by a constant, k:
where  for all positive integers n and tp,0 is the first time at which the force due to pitch rotation reaches an extremum value. This time corresponds to a particular angular position of the haltere, Φp, for the pitch component (Figure 2A). k is the constant of proportionality between the angular velocity and the Coriolis force. See “Appendix” for details about Φp. This constant of proportionality must be built-in, arising through evolutionary selection (producing flies with increasingly accurate velocity readings) and/or tuned by some learning mechanism, not treated here. This constant may also include additional constants of proportionality relating to the strain detection by which the campaniform sensilla mechanically transduce the Coriolis forces.
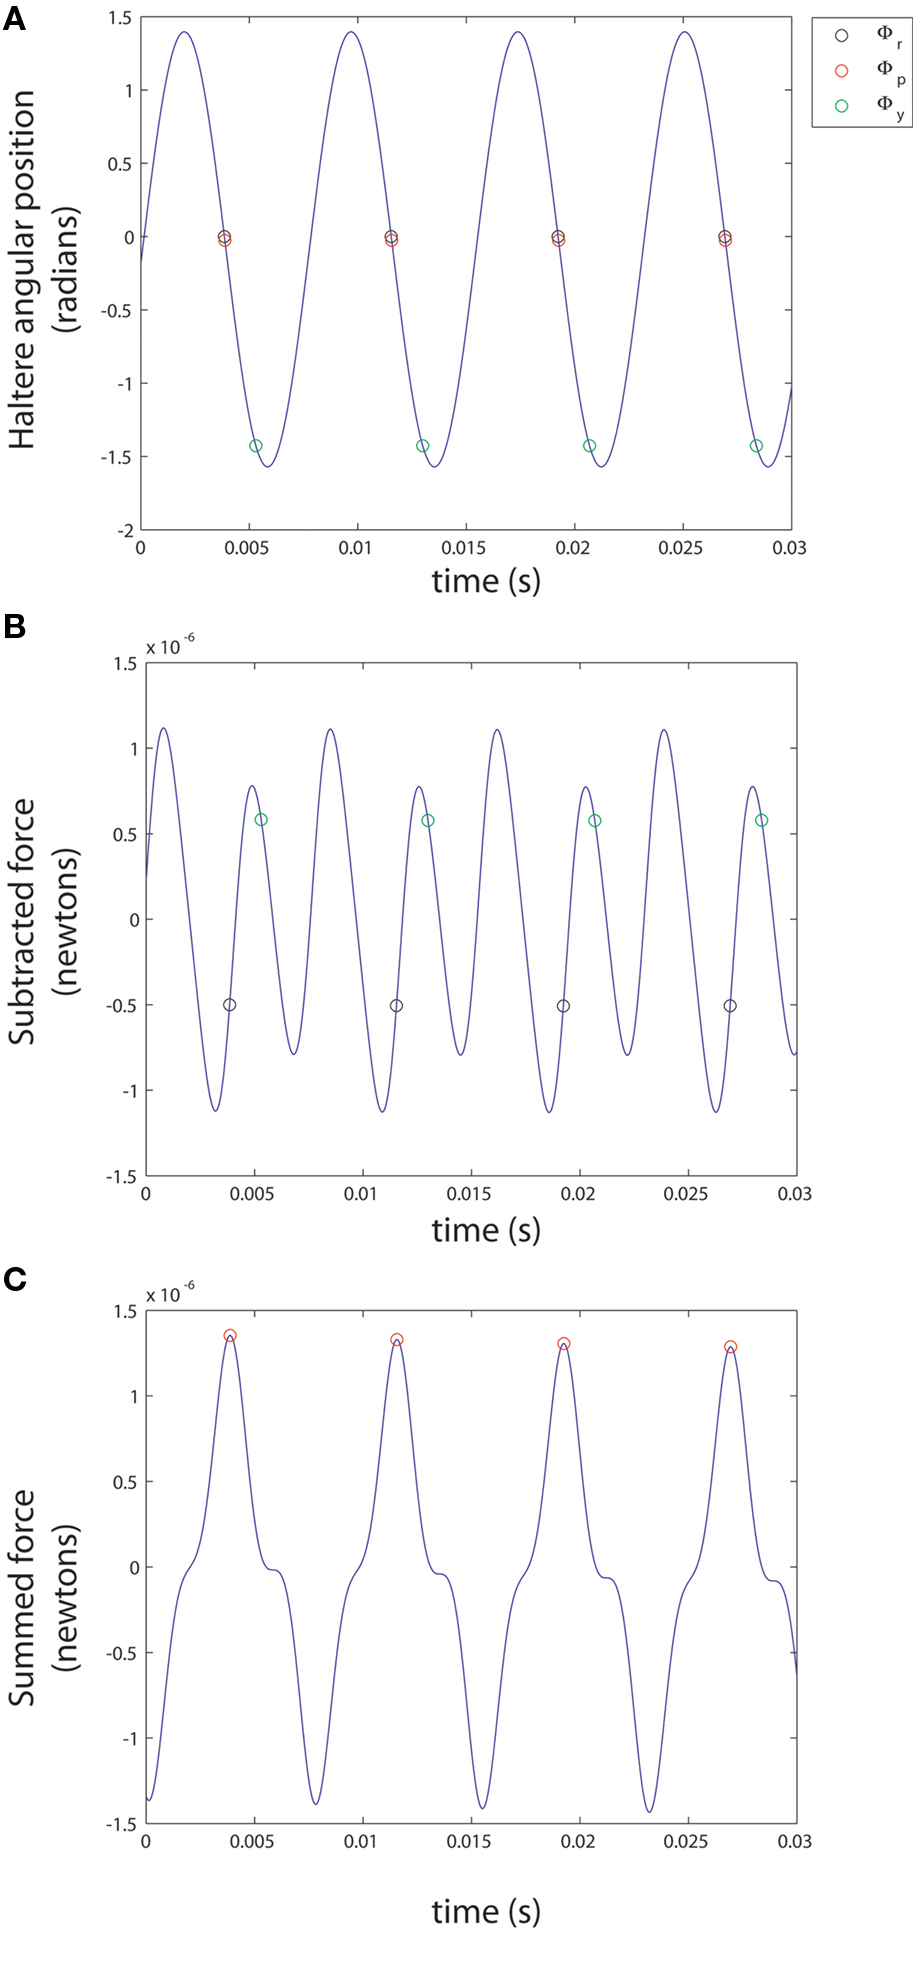
Figure 2. Analysis of variables. (A) The sample points for pitch, roll, and yaw (Φp, Φr and Φy) are plotted against time on the graph of the haltere’s position (Φ) given an initial haltere angle of 0°. (B,C) Φp, Φr, and Φy are plotted against time on the graphs of the equations for FL - FR and FL + FR given a constant applied angular velocity with pitch, roll, and yaw components of 30 radians/s2 each.
The lateral component of the gravitational force changes during a pitch, roll, or yaw rotation, is sinusoidal with respect to the body’s pitch angle, and remains a somewhat significant source of error in measuring the pitch angular velocity. Because the remaining pitch angular acceleration term is multiplied by sin Φ(t), sampling at a Φp near 0 radians effectively removes the angular acceleration pitch term. Though the lateral centrifugal force term is not removed, it is significantly smaller than the Coriolis force at most velocities. In addition, during a rotation with similar roll and pitch velocity components, this term will be effectively zero.
To recover the roll and yaw components of an applied angular velocity, the total lateral forces on the right haltere are subtracted from the left. Though it is more difficult to envision a neural manifestation of the subtraction operation, it is certainly not impossible. For example, ON/OFF cells in the visual system perform an algorithmically similar operation by employing inhibition and signed labeled lines (Ballard and Jehee, 2008). Subtraction of total lateral force on the right haltere from that induced on the left haltere yields the following equation:
The roll and yaw angular acceleration forces are not removed from the subtraction, as they are out of phase between the left and right halteres. They are, however, an order of magnitude smaller than the Coriolis force, and because they are not proportional to angular velocity, they only cause significant error in rotation detection at very low angular velocities.
This subtraction removes the Coriolis force due to pitch as well as the centrifugal force, as these forces are in phase between the halteres. This expression has a more complex time dependence, as is seen in Figure 2B. Though difficult to discern by eye, the resulting waveform has two frequency components, including the forces generated by both roll and yaw rotations. The roll component yields an oscillation at the wingbeat frequency, ω/(2π), while the yaw component yields an oscillation at twice the wingbeat frequency, ω/π. Again, amplitude measurements of this signal at appropriate intervals, as shown in Figure 2B followed by divisions with separate constants approximate Ωroll and Ωyaw. The sample points were chosen to minimize the effects of the angular velocity component not being detected.
To detect roll, the force signal is sampled at Φr = 0 radians, and to detect yaw the signal is sampled at Φy = 5π/11 radians, so for roll detection only yaw angular acceleration terms will be non-zero, and for yaw detection, only roll angular acceleration terms will be non-zero. These cause significant error in roll and yaw detection respectively only at very low angular velocities and non-zero angular accelerations. See “Appendix” for further description of the motivations for choosing these sample points and constants.
Neural Circuit
We can now posit a reasonable model for the circuitry in the black box in Figure 1. The algorithm we have proposed can be implemented in neural hardware conforming to the already known nervous system organization of the fly. The series of amplitude measurements can be taken assuming a neuron that fires in a phase-locked pattern with respect to the haltere’s angular position (Figure 3). This signal may be simply an efferent copy from the central pattern generator (CPG) setting the rhythmic motion of the haltere or wing. The CPG may be driven or modulated by the opposing stretch-activated muscles that power the haltere. The signal from the CPG biases the intermediate cells performing the measurement, called Npitch, Nroll, and Nyaw. These cells then drive the mnb1 motor neurons which act directly on the wing steering muscle, b1. At different stages in this diagram, inherent biophysical properties of neurons could easily provide the necessary subtractions and divisions required by the computational model. Certainly, the number of synapses here is small enough such that the required computation could be performed within the time restrictions imposed by the fly’s quick reaction time.
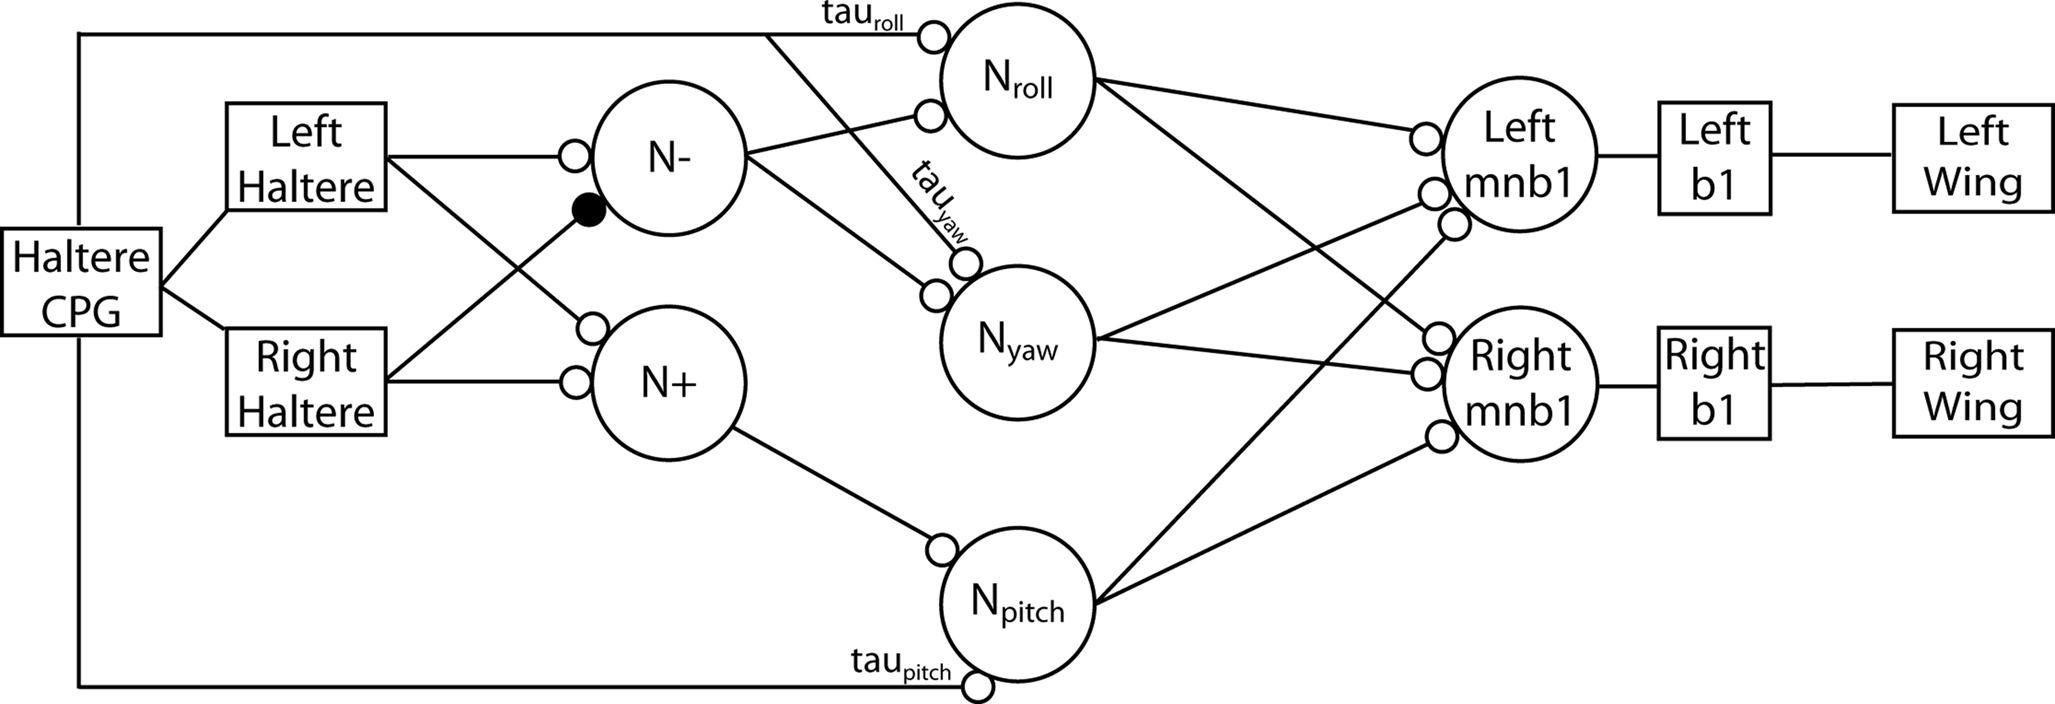
Figure 3. Neural circuit for angular velocity computation. Squares – anatomical structures; circles – neurons; smaller open circles – excitatory connections; smaller filled circle – inhibitory connection. The haltere CPG drives the left and right halteres which sense lateral forces. These force signals are summated at the neuron labeled N+ and subtracted at the neuron labeled N−. The signals from these neurons are then transmitted to three intermediate neurons: Npitch, Nroll, and Nyaw. These cells are biased by the time delays τpitch, τroll, and τyaw via delay lines from the haltere’s phase-locked CPG. These delays must be set by the angular position of the halteres such that the three intermediate neurons take measurements at the appropriate times. The results of this computation are fed to each wing via the mnb1 cells which control the b1 steering muscles.
Some of the anatomical connections between the haltere afferents and the steering muscles that would be necessary to implement this neural model have already been delineated in the fly. Contralaterally projecting haltere afferents, which would be necessary for addition and subtraction of the lateral force on each haltere, are provided by the contralaterally projecting haltere interneurons, or cHINs, identified by dye injections into haltere afferents (Strausfeld and Seyan, 1985; Trimarchi and Murphey, 1997).
Error Analysis
This model mathematically produces accurate estimates of angular velocity for many types of physiologically relevant angular acceleratory and angular velocity inputs in all directions, but also yields systematic errors in conditions that have yet to be tested experimentally. We determined eight parameters which most affect the fly’s ability to recover angular velocity. These parameters are the initial angular velocity and acceleration in three dimensions as well as the initial pitch and roll angles of the fly with respect to ground. We systematically tested 10 different values for each of these eight parameters. This required running our model with 108 different initial conditions. We tested initial angular velocities from −16.1 to 19.9 radians/s as well as initial angular accelerations from −50 to 62.5 radians/s2 in the three orthogonal directions corresponding to pitch, roll, and yaw. We also tested initial pitch and roll angles of the fly’s body relative to the ground from −50 to 60°. After allowing the position and velocity of the fly to change from their initial values and calculating the relevant forces, we recovered angular velocities with our proposed model at the first available sample points (Φp, Φr, Φy).
For each combination of conditions, we calculated the absolute and relative errors of the recovered angular velocity. For each of the pitch, roll, and yaw components of the recovered angular velocity, we generated 108 absolute error values in radians and 108 relative error values in percentage of actual velocity at that particular sample point. Visualizing this data is inherently difficult, as the error values we generated depend on eight independent variables, which would require nine spatial dimensions to represent graphically. To solve this issue, we use the same graphing technique for visualizing data in high-dimensional spaces used by Taylor et al. (2006) This method, based on clutter-based dimension reordering (Peng et al., 2004; Peng, 2005) and dimensional stacking, produces a figure in which the dimensions containing the least variability are compressed within the other dimensions. The dimensions are arranged such that salient trends in the data can be most clearly seen. The basics of this method are explained graphically in Figure 4. Akin to visualizing a three-dimensional stack as a set of two-dimensional slices, the method yields a “montage of montages” such that each of the eight axes are embedded inside each other. The color of the pixel corresponds to the error at that particular set of conditions.
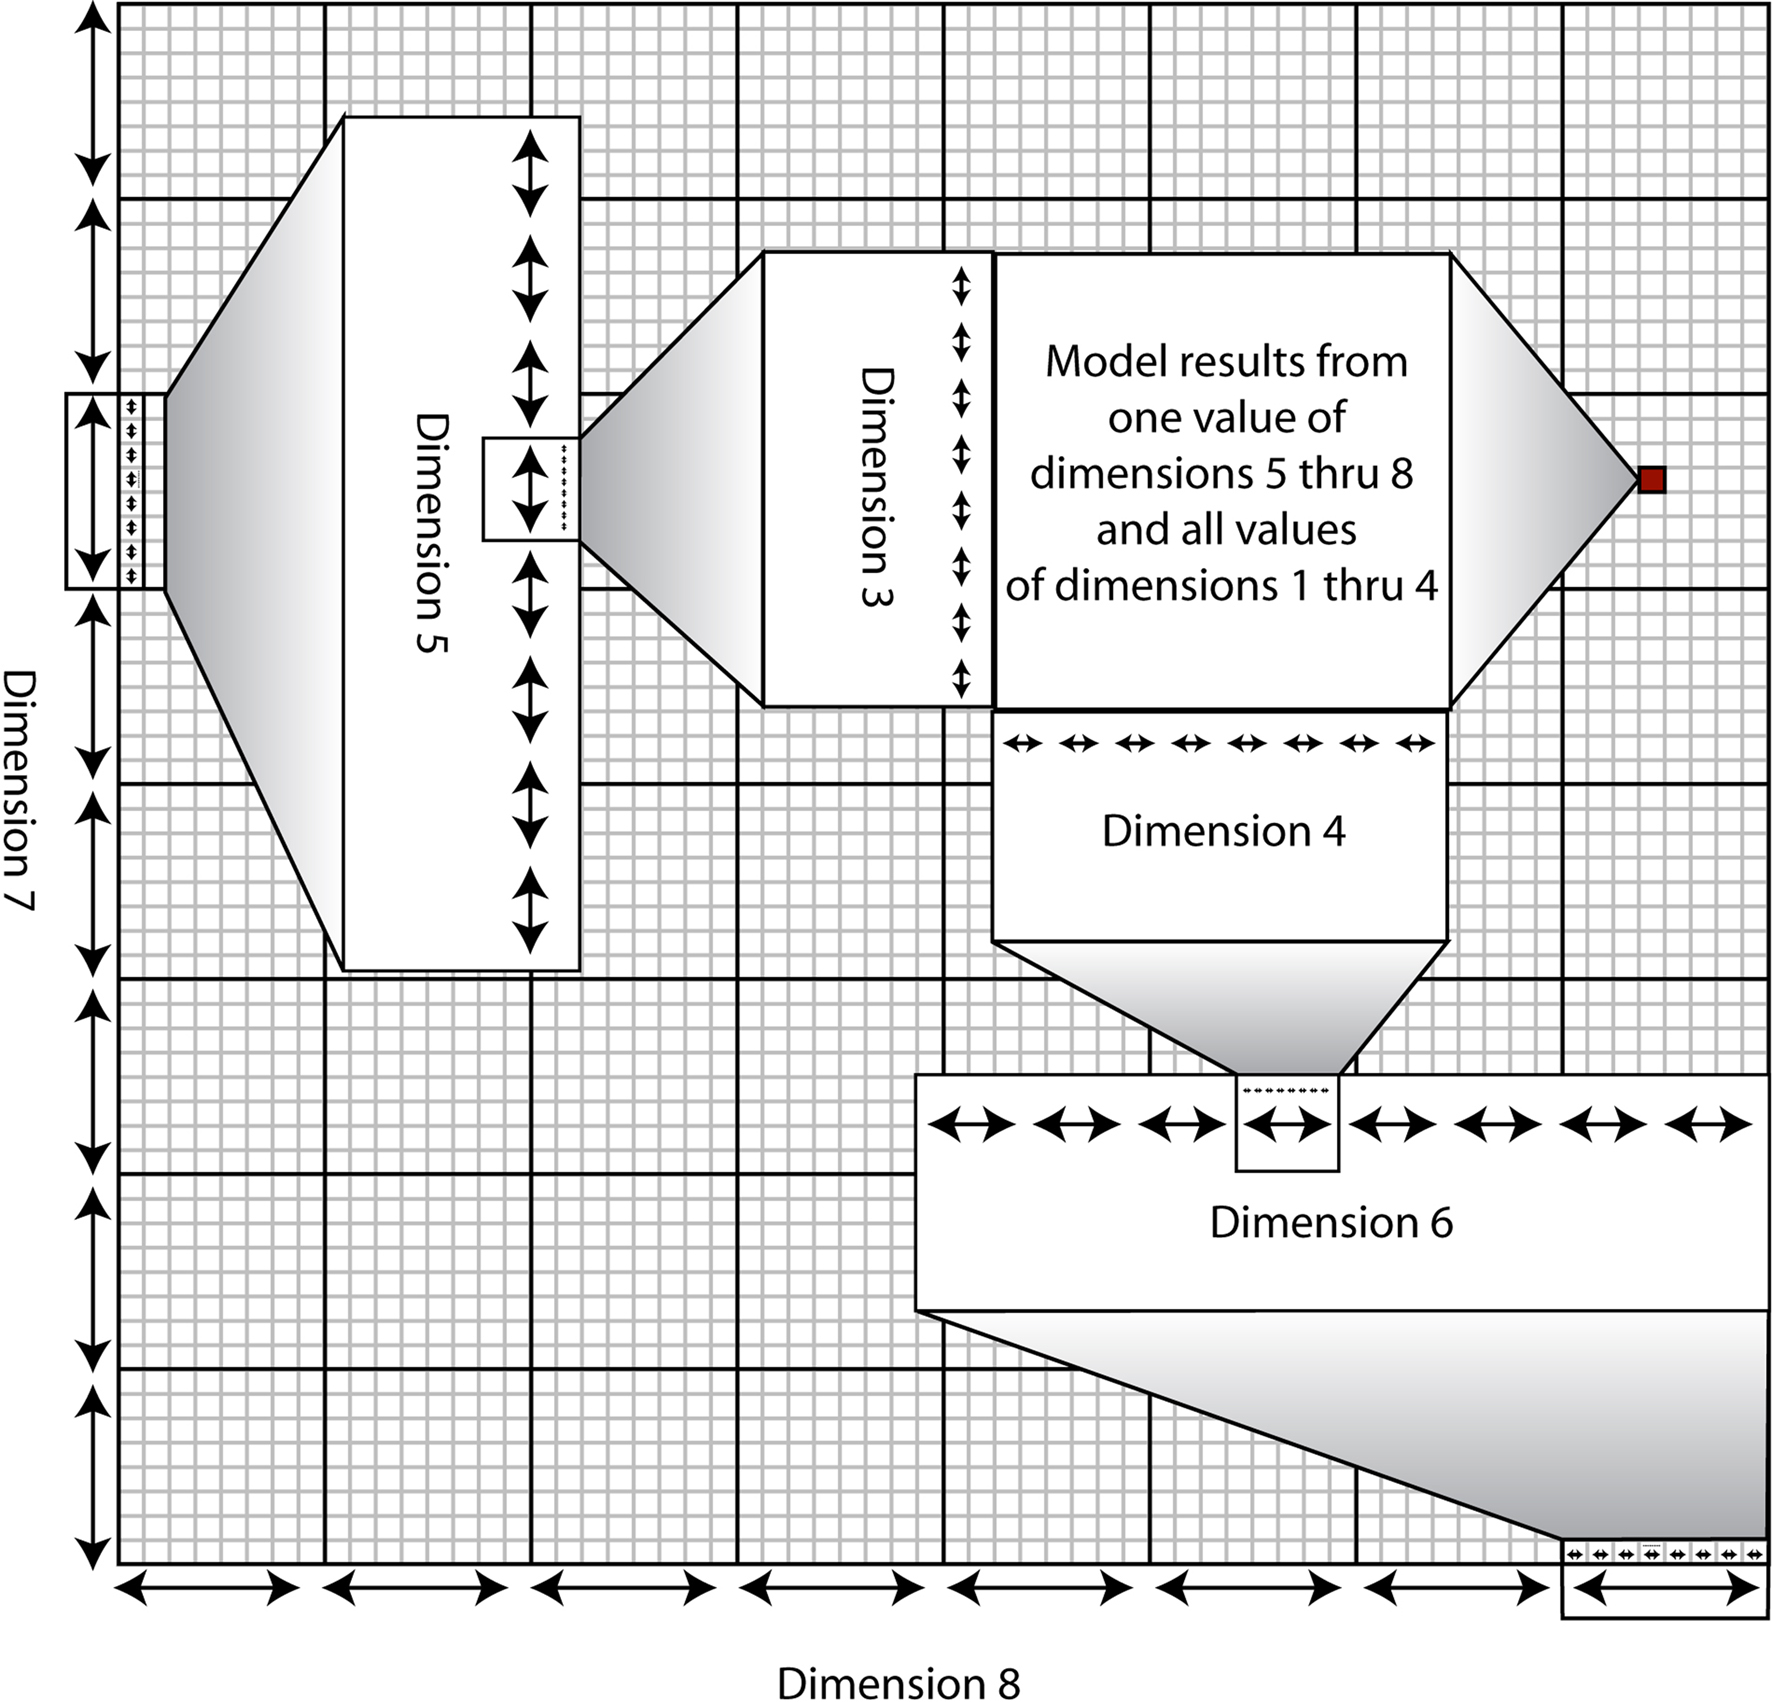
Figure 4. Visualization of the dimensional stacking technique. A standard rectangular coordinate system has two axes defining a plane on which a point is uniquely specified by two values equal to the distance of the point from each axis. A three-dimensional coordinate system has three axes defining a cube but can only be drawn on a two-dimensional surface by making use of perspective. An eight-dimensional coordinate system is impossible to visualize in three dimensions but would function the same as any other coordinate system by specifying eight unique values for a given point in space. Here, in order to visualize such a coordinate system in two dimensions, we have “collapsed” the dimensions beyond the first two inside the other dimensions in a recursive fashion. This so-called “dimensional stacking” technique allows one to visualize trends in a high-dimensional space. The dimensions are collapsed in a specific order such that similar output values from the given multidimensional inputs are clustered together. In the example shown here, the red square defines a coordinate system over which the first through fourth dimensions vary for given values of dimensions five through eight. (Specifically, those values are the last value of dimension eight, the sixth value of dimension seven, the fourth value of dimension six, and the fifth value of dimension five.)
Figure 5A shows that the proposed model is worst at recovering roll velocities near zero, as indicated by the red horizontal stripe. Here, the center square of the figure is not entirely red, and further inspection shows that roll velocities near zero can be recovered more accurately if imposed alongside initial roll angles and pitch angles near zero (which are respectively defined by the center of the largest horizontal axis and second largest vertical axis.) This makes sense: the fly’s mechanical apparatus is best at encoding roll when it is flying straight and level, the condition in which it is most often found. The largest horizontal axis, (βr), indicates that a large absolute initial roll angle can cause significant error in roll velocity detection; this can be seen by noting the warmer colors of the left- and right-most columns of the figure. Additionally, all of the variables on the smallest axes – yaw velocity, roll acceleration, pitch acceleration, and pitch velocity – do not contribute significantly to error in recovering roll velocity. As was shown in the equation for FL-FR and the sample phase delay, Φr, the angular acceleration force from the yaw component of an angular acceleration remains when recovering roll angular velocity. Looking at the grid defined by the set of second largest horizontal and vertical axes, it is clear the error resulting from the magnitude of the yaw component of the imposed acceleration and the initial pitch angle is derived from a non-linear relationship between the two terms, and that the polarity of this relationship is defined by the sign of the initial roll angle (the position to the left or the right of the largest vertical axis). Figure 5A makes clear that the lowest relative errors (indicated by the cooler colors) occur for large absolute roll angular velocities and low absolute initial roll angles.
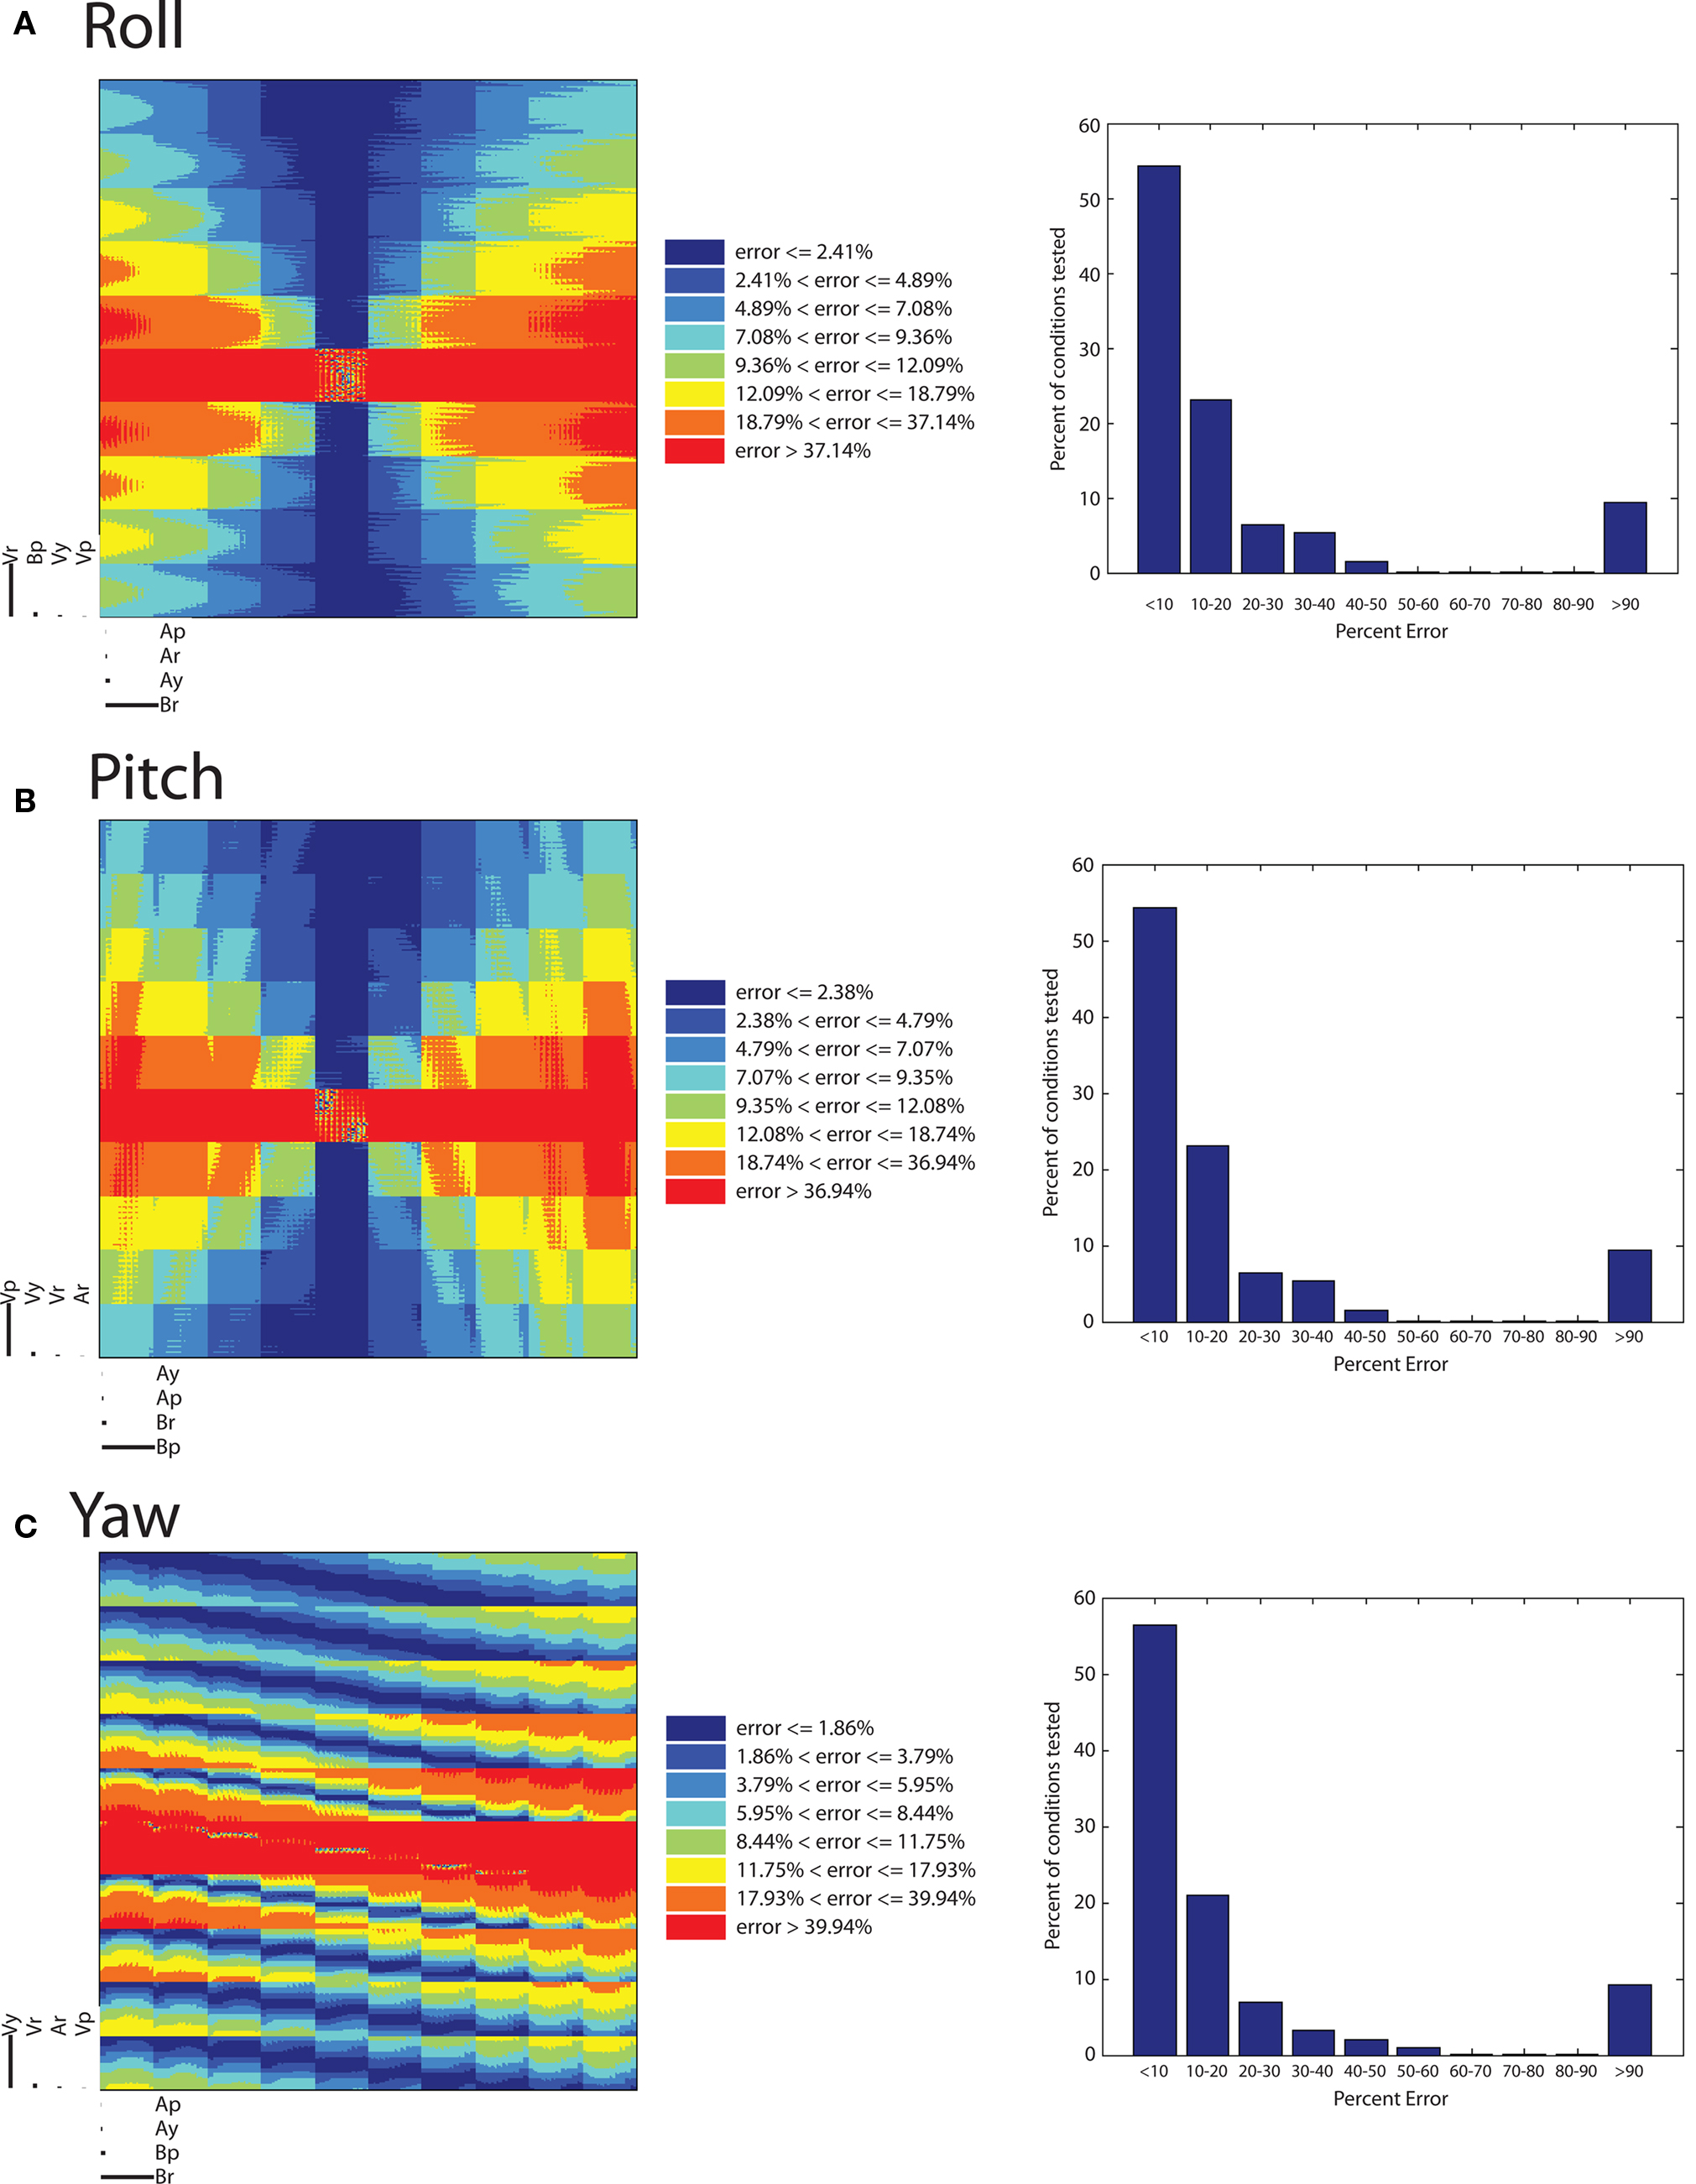
Figure 5. Error analysis. (A–C) Dimensional stacks and histograms of the relative error in roll, pitch, and yaw recovery. 10 values of each parameter were used: initial velocities (Vr, Vp, Vy) from −16.1 to 19.9 radians/s, angular accelerations (Ar, Ap, Ay) from −50 to 62.5 radians/s2, initial body pitch angle (βp) and initial body roll angle (βr), from −50 to 60°.
The relative error results for recovering pitch are displayed in Figure 5B. The red horizontal stripe in the center shows the conditions in which pitch detection is worst (greater than 36.94% error). This shows that the fly makes the worst assessment of its angular velocity in the pitch direction when the angular velocity in that direction is near zero, regardless of whatever other initial conditions may be present.
Continuing to analyze Figure 5B shows that as for large absolute values of pitch angle (βp), error in pitch rotation detection increases, due to the increased lateral gravitational force in these conditions. This can be deduced from the figure by noting the warmer colors in the left- and right-most columns of Figure 5B. Some of the boxes that checker the figure have a change in color that depends on the second largest horizontal and vertical axis, corresponding to initial roll angle, βr, and initial yaw velocity respectively. The error appears to depend on whether the values of initial roll angles and yaw velocities fall along a line of a certain slope. The magnitude of the slope of this line appears to increase with the magnitude of the initial pitch angle, and the slope switches from positive to negative as the initial pitch angle switches from negative to positive. One example of a testable prediction that can be gleaned from such a detailed investigation of this figure is that for negative initial pitch angles, the error is generally higher when initial roll angles and yaw velocities are positively correlated. As the magnitude of the initial pitch angle increases, the recovery error is generally lower as the magnitude of the initial roll angle increases.
Finally, Figure 5C, similar to Figures 5A,B, with the red horizontal stripe running across the middle, reveals that recovering yaw velocity is worst at initial yaw velocities near zero, regardless of the other conditions. The trend of warmer colors in the left- and right-most columns reveals that yaw recovery is more error prone as the magnitude of the initial roll angle increases. There is also a large dependence on the values of the second largest vertical axes, the initial imposed roll velocity. The polarity of the relationship of initial roll velocity to error is defined by the magnitude of the initial roll angle. The areas of lowest error in yaw recovery are low magnitude initial roll angles and high magnitude initial yaw velocities.
Predictions
There are a number of testable predictions resulting from our algorithm and error analysis. For one, the fly should also have different response latencies (on the order of milliseconds) to applied angular velocities depending on the angular position of the haltere when the velocity is imposed. Additionally, flies with increasing pitch angle, but lower pitch angular velocities, should significantly over-estimate pitch velocity. The same is true for roll, with increasing body roll angle, but lower roll angular velocities. With increasing body roll angle and low yaw angular velocities, yaw angular velocity will be significantly under-estimated by the fly. If the haltere input is not down-weighted at low angular velocities, these could lead to excessive or insufficient corrective rotations, because a larger lateral gravitational force component will partially obscure an accurate force measurement. A similar phenomenon is observed in the desert ant Cataglyphis fortis, whose error in their ability to calculate their home-direction vector increases with experimentally imposed large-angle turns at their feeding site (Muller and Wehner, 1988).
One general trend in the error graphs is the poor performance of this model at angular velocities below 4 radians/s. Current experimental data suggests that at low angular velocities, mechanosensory input is relied upon less than with visual input. At low angular velocities (around 200 degrees/s, or ∼3.5 radians/s), providing mechanosensory stimulation alone triggers a minimal corrective response in the fly, while providing visual input alone yields an appropriate corrective response (Sherman and Dickinson, 2004). This trend is reversed at larger-magnitude angular velocities, for example above 500 degrees/s or 8.7 radians/s in the pitch direction. Sherman and Dickinson have experimentally determined that the haltere’s mechanosensory apparatus only responds to angular velocities within a certain range. This analysis offers a potential reason for their observation. At low angular velocities of the fly’s body, other lateral forces on the haltere overwhelm Coriolis forces, preventing accurate angular velocity measurements. Though our model predicts why haltere output may not be accurate for low angular velocities, it does not treat how the gain of this input is differentially reduced in favor of visual inputs in such conditions. The mechanism could incorporate two non-mutually exclusive means: (1) the biomechanical properties of the campaniform sensilla, which could set an appropriately high threshold for lateral strain detection, or (2) top-down neural architecture which combines visual and haltere input.
Discussion
We have proposed a neurobiologically plausible model of how the fly can have accurate readings of pitch, roll, and yaw angular velocities with only information about the total lateral forces on the left and right halteres. Following the work of Dickinson explaining how the fly can integrate different types of signals to generate a flight correction pattern, we now seek to identify and delineate the elements inside their “black box” that are used to compute the angular velocity. Specifically, our model assumes a simple scenario that can be implemented in agreement with the already known nervous system organization of the fly. One assumption is that a neuron fires in a phase-locked pattern with respect to the haltere’s angular position and that this signal biases the intermediate cells performing the measurement. These cells would then directly drive the motor neurons of the wing steering muscle.
Our model does not assume labeled lines for pitch, roll, and yaw at the level of the campaniform sensilla. Indeed, we feel that this is a gross over-simplification of the mechanism of the haltere’s action. The directional components of the forces generated by the different rotations overlap significantly. There is no direction in which any physical sensor could be oriented to set up a line only sensitive to a particular rotational direction at this level of the architecture. As our circuit shows, these forces must be discriminated downstream of the campaniform sensilla. It is important to note that while we chose a three-dimensional orthogonal system to complete the analysis, it is possible the fly’s axes are not orthogonal and thus somewhat redundant. In fact, previous work has shown that flies are least sensitive to yaw rotations, perhaps indicating that the reference system used by the flies encodes variability in yaw the least (Sherman and Dickinson, 2003). We could have chosen any coordinate system – for example, spherical or cylindrical – to complete this physical analysis.
As we show using error analysis, the model appears robust. Moreover, our model not only fits a majority of the data about fly flight mechanosensation, but also points to future experiments that may further elucidate this highly complex information processing system. The general computational framework proposed in this paper has broader implications for any system that relies on accurate estimates of a complex time-varying signal. For example, the asymmetric crossed inhibition resembles the crossed interaction of the “correlation model” proposed for fly motion detection (Egelhaaf et al., 1989). In fact, one could abstract the actual input and appreciate the similarities between the computation of an angular velocity signal and the directional selectivity signals in the two systems.
Relation to Past Work
As mentioned in the Section “Introduction,” Thompson and colleagues recently proposed a model that attempted to tackle this problem (Thompson et al., 2009). This work represents a very salient contribution to the problem and nicely complements our approach, where we further elaborate on its potential solution. In their algorithm, the halteres could obtain accurate measurements of the pitch, roll, and yaw components of an imposed, constant angular velocity. In modeling haltere motion in response to an imposed angular velocity, they lifted the assumption of infinite lateral rigidity, and modeled the lateral motion of the haltere as a point mass “on a rigid massless structure with a torsional spring and damper at the base” (Thompson et al., 2009). Though they model the out-of-plane displacement of the haltere with a system of non-linear (with respect to imposed angular velocity and acceleration) differential equations, it is assumed that the halteres’ out-of-plane displacements are linearly related to strain generated in the campaniform sensilla field. We did not model strain directly, but if it is linearly related to the displacement, our model is sufficient. Thompson et al. (2009) claim that accurate measurements of the pitch, roll, and yaw components of the angular velocity of the fly’s body can be obtained by haltere position-specific average strain and average strain-rate measurements.
The authors do not discuss exactly how many haltere oscillations it takes for the out-of-plane displacement to reach a steady state. Out of 40 oscillations of the haltere, only the last 20 are used to produce the out-of-plane displacement versus haltere position plots. This suggests that the out-of-plane displacement of the halteres is not the same for the first 20 oscillations, and the motion has not reached steady state. Since their proposed method of velocity decoupling relies on averaged out-of-plane motion (strain) measurements, if the phase plot does not converge on a single loop within a few haltere oscillations, the fly will recover erroneous readings of angular velocity. How is the haltere capable of delaying strain measurement until the phase-plane trajectory has stabilized, meaning the out-of-plane motion has reached a repeating pattern with respect to in-plane oscillation? What would prevent the haltere from taking a measurement at the appropriate point in the stroke as soon as any out-of-plane motion is experienced?
In addition, it is difficult to determine a neurobiologically feasible way to measure average strain and average strain rate between two points in a stroke cycle. Taking an average displacement value is potentially feasible, if one measurement were stored until the next measurement were taken, or with an afferent campaniform sensillae acting as a low-pass filter, as they suggest, but encoding an instantaneous derivative of displacement is more difficult to imagine in the physiology of the campaniform sensillae. They list several methods which are common in engineering but have no known neural correlates. Interestingly, they mention the “feasibility of encoding and reconstructing the full body rate vector using only discreet (sic) compressive strain magnitude measurements to describe the symmetric and asymmetric aspects of the haltere trajectory.” This is indeed similar to our proposed method.
Finally, Thompson et al. (2009) test their model with constant angular velocities, but including only two different roll velocity components, 0 and 5 radians/s. They also exclude gravitational acceleration in their equation for out-of-plane displacement. In contrast, we show that the gravitational force has a significant effect on the accuracy of angular velocity recovery, and test 108 different parameters.
Future Directions
Our model could be tested by further anatomical and functional measurements of neurons in the haltere circuitry, to determine if there are units that behave as we predict. While the exact neuronal components and circuits are still mysterious, paradoxically, there is an electrical synapse between certain haltere afferents and the b1 steering muscle (Fayyazuddin and Dickinson, 1996; Trimarchi and Murphey, 1997). However, it is difficult to fathom an algorithm by which the haltere afferents could be electrically coupled via these gap junctions directly to the steering muscles and produce accurate reflexes to imposed angular velocities. But both of the above studies also found a slower, chemical, poly-synaptic pathway to b1 from the haltere afferents. It is not clear which single pathway, if not both, campaniform sensilla use to convey information. The gap junctions may simply function to set the phase of the wingbeat relative to the halteres. To alter the flight trajectory, a wingbeat phase advance or recession could come through the chemical, poly-synaptic pathway. The computation that would enable a correct alteration to the flight path does not seem possible without slightly more complex circuitry than direct electrical coupling.
Recently, the output of the haltere nerve has been recorded directly. It has been shown to be directionally selective and fire with sub-millisecond jitter (Fox and Daniel, 2008). Additionally, recordings from neck motor neurons have been shown to receive phase-locked output from the halteres at physiological frequencies up to 105 Hz (Huston and Krapp, 2009). These experimental data confirm that our model, which requires precise timing and phase-locking, is plausible. One important future step will be to add random noise modeled on the known jitter of the haltere output to our analysis, which has so far only revealed the systematic errors due to the physical nature of the system.
More complex analyses could make use of two genetic mutants that affect the sensors or the neural circuit directly. The Ultrabithorax mutant yields anomalous campaniform sensilla structures in the halteres (Roch and Akam, 2000). The shaking-B2 mutant disrupts electrical synapses from haltere afferents (Trimarchi and Murphey, 1997). One could test, for example, whether Ultrabithorax or shaking-B2 mutant flies show corrective responses to mechanically imposed angular velocities. While these flies have proven unable to fly, (not surprising given their absolute lack of electrical synapses), one wonders if their haltere-mediated reflex system is at least partially intact. This would implicate the haltere/b1 chemical-synapse pathway in angular velocity detection. The ability to discriminate between sensory deficits versus neural circuitry deficits will certainly aid further elucidation of the engineering principles at work.
One last remaining question is how the fly can distinguish externally generated rotations from internally generated rotations. If the fly initiates a rotation, it must also inhibit the reflexive correction automatically calculated by the haltere circuitry. In addition, when reflexively responding to a stimulus, the fly should not respond to angular velocity information generated by the haltere during the corrective rotation. It seems unlikely inhibition of this counter-reflexive action would be a regulatory property of the flight control system given the speed of the reflex. If a top-down “stop steering” command were given (perhaps via inhibition of mnb1), it would have to be timed with extraordinary precision. Alternatively, the counter-reflexive action could simply be an inherent property of the reflex. Perhaps the biophysical properties of the b1 muscle driver neurons are simply unresponsive to haltere input during a short (few ms) refractory period after performing a corrective maneuver.
Our model assumes a train of delta functions at the specific phase-delayed times is convolved with the summed and subtracted force signals. One improvement to our model would be to actually deconvolve the summed and subtracted force signals and find the best filters for extracting the different signals.
Finally, it is known the visual system can impact the motion of the haltere directly in order to transform visual-mediated corrections into rotation corrections. It may also be possible that a horizontal attitude indicator signal is sent from the visual system to the haltere in order to allow for a correction of gravity. Our scheme allows for both modifications – inhibition of self-initiated movements and gravity correction – by simply allowing for another incoming signal to subtract from the force estimates before that are fed back to the wing.
Conflict of Interest Statement
The authors declare that the research was conducted in the absence of any commercial or financial relationships that could be construed as a potential conflict of interest.
Acknowledgments
We thank Sweta Agrawal and other inverterbrate neurobiology seminar students at Columbia, members of the Yuste laboratory and the Center for Theoretical Neuroscience at Columbia University for help and comments. Supported by the Kavli Institute for Brain Science.
Footnote
- ^The oscillation of the haltere is more like a square wave than a sinusoid (Nalbach, 1993). However, for the purposes of this model simple harmonic motion produces sufficient detail.
References
Ballard, D., and Jehee, J. (2008). On the coding of negative quantities in cortical circuits. Nat. Precedings. Available at: http://hdl.handle.net/10101/npre.2008.1938.1
Briggman, K. L., and Kristan, W. B. (2008). Multifunctional pattern-generating circuits. Annu. Rev. Neurosci. 31, 271–294.
Dickinson, M. H. (1999). Haltere-mediated equilibrium reflexes of the fruit fly, Drosophila melanogaster. Philos. Trans. R. Soc. Lond. 354, 903–916.
Dickson, W., Straw, A., and Dickinson, M. (2008). Integrative model of Drosophila flight. AIAA J. 46, 2150–2164.
Egelhaaf, M., Borst, A., and Reichardt, W. (1989). Computational structure of a biological motion-detection system as revealed by local detector analysis in the fly’s nervous system. J. Opt. Soc. Am. A 6, 1070–1087.
Fayyazuddin, A., and Dickinson, M. H. (1996). Haltere afferents provide direct, electrotonic input to a steering motor neuron in the blowfly, Calliphora. J. Neurosci. 16, 5225–5232.
Fox, J. L., and Daniel, D. L. (2008). A neural basis for gyroscopic force measurement in the halteres of Holorusia. J. Comp. Physiol. A 194, 887–897.
Huston, S. J., and Krapp, H. G. (2009). Nonlinear integration of visual and haltere inputs in the fly neck motor neurons. J. Neurosci. 29, 13097–13105.
Land, M. F., and Collett, T. S. (1974). Chasing behaviour of houseflies (Fannia canicularis). J. Comp. Physiol. 89, 331–357.
Marr, D. (1982). Vision: A Computational Investigation into the Human Representation and Processing of Visual Information (San Francisco, NY: W.H. Freeman).
Muller, M., and Wehner, R. (1988). Path integration in desert ants, Cataglyphis fortis. Proc. Natl. Acad. Sci. U.S.A. 85, 5287–5290.
Peng, W. (2005). Clutter-Based Dimension Reordering in Multi-Dimensional Data Visualization. Master’s thesis, Worcester Polytechnic Institute, Worcester, MA.
Peng, W., Ward, M. O., and Rundensteiner, E. A. (2004). “Clutter reduction in multidimensional data visualization using dimensional reordering,” in Proceedings of the IEEE Symposium on Information Visualization 2004, ed. A. Keahey, Austin, TX, 89–96.
Pringle, J. W. S. (1948). The gyroscopic mechanism of the halteres of Diptera. Philos. Trans. R. Soc. Lond., B, Biol. Sci. 233, 347–384.
Roch, F., and Akam, M. (2000). Ultrabithorax and the control of cell morphology in Drosophila halteres. Development 127, 97–107.
Sherman, A., and Dickinson, M. H. (2003). A comparison of visual and haltere-mediated equilibrium reflexes in the fruit fly Drosophila melanogaster. J. Exp. Biol. 206, 295–302.
Sherman, A., and Dickinson, M. H. (2004). Summation of visual and mechanosensory feedback in Drosophila flight control. J. Exp. Biol. 207(Pt 1), 133–142.
Strausfeld, N. J., and Seyan, H. S. (1985). Convergence of visual, haltere, and prosternal inputs at neck motor neurons of Calliphora erythrocephala. Cell Tissue Res. 240, 601–615.
Taylor, A. L., Hickey, T. J., Prinz, A. A., and Marder, E. (2006). Structure and visualization of high-dimensional conductance spaces. J. Neurophysiol. 96, 891–905.
Thompson, R. A., Wehling, M. F., Evers, J. H., and Dixon, W. E. (2009). Body rate decoupling using haltere mid-stroke measurements for inertial flight stabilization in Diptera. J. Comp. Physiol. 195, 99–112.
Trimarchi, J. R., and Murphey, R. K. (1997). The shaking-B2 mutation disrupts electrical synapses in a flight circuit in adult Drosophila. J. Neurosci. 17, 4700–4710.
Keywords: Diptera, haltere, mechanosensory, reflex, flight, angular velocity, rotation, coriolis
Citation: Snider SB, Yuste R and Packer AM (2010) A neural circuit for angular velocity computation. Front. Neural Circuits 4:123. doi: 10.3389/fncir.2010.00123
Received: 11 January 2010;
Accepted: 11 November 2010;
Published online: 30 December 2010.
Edited by:
Abdel El Manira, Karolinska Institute, SwedenReviewed by:
Alexander Borst, Max Planck Institute of Neurobiology, GermanyCopyright: © 2010 Snider, Yuste and Packer. This is an open-access article subject to an exclusive license agreement between the authors and the Frontiers Research Foundation, which permits unrestricted use, distribution, and reproduction in any medium, provided the original authors and source are credited.
*Correspondence: Adam M. Packer, Department of Biological Sciences, Howard Hughes Medical Institute, Columbia University, 1212 Amsterdam Avenue, Box 2435, New York, NY 10027, USA. e-mail:YXAyNDE2QGNvbHVtYmlhLmVkdQ==