 Fahmeed Hyder1,2,3,4*
 Basavaraju G. Sanganahalli1,2,3
 Peter Herman1,2,3
 Daniel Coman1,2,3
 Natasja J. G. Maandag1,3
 Kevin L. Behar1,2,5
 Hal Blumenfeld6,7,8
 Douglas L. Rothman1,2,3,4
- 1 Magnetic Resonance Research Center, School of Medicine, Yale University, New Haven, CT, USA
- 2 Core Center for Quantitative Neuroscience with Magnetic Resonance, School of Medicine, Yale University, New Haven, CT, USA
- 3 Department of Diagnostic Radiology, School of Medicine, Yale University, New Haven, CT, USA
- 4 Department of Biomedical Engineering, School of Engineering and Applied Science, Yale University, New Haven, CT, USA
- 5 Department of Psychiatry, School of Medicine, Yale University, New Haven, CT, USA
- 6 Department of Neurology, School of Medicine, Yale University, New Haven, CT, USA
- 7 Department of Neurosurgery, School of Medicine, Yale University, New Haven, CT, USA
- 8 Department of Neurobiology, School of Medicine, Yale University, New Haven, CT, USA
Functional magnetic resonance imaging (fMRI) with blood-oxygenation level dependent (BOLD) contrast is an important tool for mapping brain activity. Interest in quantitative fMRI has renewed awareness in importance of oxidative neuroenergetics, as reflected by cerebral metabolic rate of oxygen consumption  for supporting brain function. Relationships between BOLD signal and the underlying neurophysiological parameters have been elucidated to allow determination of dynamic changes in
  by “calibrated fMRI,” which require multi-modal measurements of BOLD signal along with cerebral blood flow (CBF) and volume (CBV). But how do changes, steady-state or transient, derived from calibrated fMRI compare with neural activity recordings of local field potential (LFP) and/or multi-unit activity (MUA)? Here we discuss recent findings primarily from animal studies which allow high magnetic fields studies for superior BOLD sensitivity as well as multi-modal CBV and CBF measurements in conjunction with LFP and MUA recordings from activated sites. A key observation is that while relationships between neural activity and sensory stimulus features range from linear to non-linear, associations between hyperemic components (BOLD, CBF, CBV) and neural activity (LFP, MUA) are almost always linear. More importantly, the results demonstrate good agreement between the changes in and independent measures of LFP or MUA. The tight neurovascular and neurometabolic couplings, observed from steady-state conditions to events separated by <200 ms, suggest rapid oxygen equilibration between blood and tissue pools and thus calibrated fMRI at high magnetic fields can provide high spatiotemporal mapping of changes.
Introduction
In the adult mammalian brain glucose oxidation provides majority of the ATP needed to support normal function of neurons and astrocytes (Shulman et al., 2004). Since endogenous energy reserves are at μM to mM levels (Hyder, 2009), timely delivery of energy substrates (i.e., glucose and oxygen) from blood to support neural activity is essential (Paulson et al., 2010). Variations in neural activity trigger a cascade of responses that collectively adjust delivery of energy substrates to meet the local ATP demand (Riera et al., 2008). “Neurovascular coupling” relates local changes in neural activity and constriction/dilation of blood vessels to decrease/increase cerebral blood flow (CBF) and/or volume (CBV) to a region, whereas “neurometabolic coupling” relates focal alterations in neural activity to cerebral metabolic rate of oxygen consumption  to keep pace with cellular ATP demand.
Recently there has been renewed interest in mapping as a close approximation for brain work (Hyder et al., 2002). Positron emission tomography (PET) measures non-invasively, but requires use of multiple radioactive tracers (Ito et al., 2005). Magnetic resonance spectroscopy (MRS) utilizing detection of non-radioactive 17O isotope can also measure non-invasively (Zhu et al., 2009), whereas 13C MRS used in conjunction with different 13C-labeled substrates (e.g., glucose or acetate) can distinguish between energetics of neurons and astrocytes (Hyder et al., 2006). Both of these MRS techniques, however, have lower spatial resolution compared to magnetic resonance imaging (MRI) and PET, whereas all of these techniques have relatively poor temporal resolution. Measurements of tissue oxygen tension (pO2) can be used to infer local dynamics of uncoupling between oxygen delivery (i.e., CBF) and its subsequent utilization (i.e., ) (Ances et al., 2001), but its invasiveness limits translation to humans.
Because functional MRI (fMRI) has good spatiotemporal resolution and allows non-invasive imaging of almost the entire brain, it has great translational possibilities (Matthews et al., 2006). The blood-oxygenation level dependent (BOLD) signal, however, reports indirectly on neural activity because it measures the hyperemic response (Ogawa et al., 1993). But it is feasible to calculate  from the BOLD signal (S) provided that it is calibrated by combining CBF and CBV measurements (Hoge and Pike, 2001; Hyder et al., 2001) according to the relationship
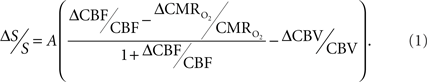
The basis for  mapping with “calibrated fMRI” is that it reflects the oxidative ATP demanded for neural work (Davis et al., 1998; Hoge et al., 1999). Recent non-human studies report that magnitudes of derived from calibrated fMRI are commensurate with changes in neural firing under steady-state conditions (Smith et al., 2002; Kida et al., 2006; Maandag et al., 2007). However both the neurovascular and neurometabolic couplings remain to be established for Eq. 1.
The first and second terms on the right-hand side of Eq. 1 reflect changes in oxygenation and volume, respectively, where for ΔS/S > 0 the first term has to exceed the second term. Because arterial blood is almost fully oxygenated, functional hyperemia – and thus, by inference, BOLD signal – manifests oxygenation and volume changes primarily at the venous end (Hoge and Pike, 2001; Hyder et al., 2001). Although magnitudes of the two terms on the right-hand side of Eq. 1 are typically on the order of 0.1–0.2 for functional studies (Hoge and Pike, 2001; Hyder et al., 2001), the metabolic  and hemodynamic (ΔCBF/CBF) factors which together contribute to the first term can be much larger.
For increased oxygenation ΔCBF/CBF has to be greater than  Because increased blood oxygenation is proportional to decreased tissue oxygen extraction at steady-state according to Fick’s principle, an embedded assumption in
  time courses derived from calibrated fMRI is that oxygen is equilibrated between blood and tissue pools (Hyder et al., 1998). To date, steady-state assumptions of Eq. 1 are extended into the dynamic regime without experimental evidence of rapid oxygen equilibration between blood and tissue pools. For dynamic modeling from calibrated fMRI, both neurometabolic and neurovascular couplings have to be examined to establish if the same linearity of terms in Eq. 1 vs. neural activity can be used for event-related paradigms all the way up to block-design paradigms.
The second term of Eq. 1, which reflects changes in venous blood volume (ΔCBV/CBV), is typically much smaller than changes in the  metabolic and hemodynamic (ΔCBF/CBF) terms (Hoge and Pike, 2001; Hyder et al., 2001). Despite the small magnitude of this term, independent measurement is important because its dynamic evolution is significantly different from measured time courses of CBF and BOLD signal (Kida et al., 2007; Shen et al., 2008). In non-human studies ΔCBV is usually measured independently (Hyder et al., 2001), whereas in human studies ΔCBV is usually estimated from an assumed relationship with ΔCBF (Hoge and Pike, 2001). To date, changes in hematocrit are either neglected and/or lumped into the second term (Hyder et al., 2001), an assumption which needs further testing (Herman et al., 2009b).
The parameter A in Eq. 1, as originally described by Ogawa et al. (1993) in describing the BOLD model (and similar to the parameter M in other calibrated fMRI reports; see Hoge and Pike, 2001 for details), is a magnetic field dependent constant. It has been reported to be 0.1–0.2 for gray matter at 1.5T and 0.3–0.4 at 7.0T, respectively, where human and animal calibrated fMRI studies are typically conducted (Hoge and Pike, 2001; Hyder et al., 2001). Because the parameter A (or M) may vary regionally, and also depends on the echo time used in gradient-echo or spin-echo fMRI experiments, independent measurements are required for different experimental conditions (Chiarelli et al., 2007; Leontiev et al., 2007; Ances et al., 2009b).
Early calibrated fMRI studies, both in humans (Davis et al., 1998; Kim et al., 1999; Hoge and Pike, 2001; Restom et al., 2008; Ances et al., 2009a) and animals (Kida et al., 1999, 2000; Hyder et al., 2001; Shen et al., 2008), focused on high resolution  maps. Because neural activity measurements were not available, these reports excluded assessment of neurovascular and neurometabolic couplings which are embedded in the interpretation of calibrated fMRI results. A critical issue in estimating
  derived from calibrated fMRI to represent changes in neural activity, especially in a dynamic manner, is whether changes in oxygen extraction affect the observed neurovascular and neurometabolic couplings differently for transient and steady-state events. This issue is particularly important for calculating the temporal evolution of
  with dynamic calibrated fMRI because it is unclear whether couplings of the different parameters in Eq. 1 vs. neural activity can be assumed to be the same for event-related and block-design paradigms. To address this unresolved issue in the interpretation of calibrated fMRI results, we conducted calibrated fMRI studies at high magnetic field (11.7T) for superior BOLD sensitivity and included extracellular measurements of local field potential (LFP) and multi-unit activity (MUA) from the activated sites. Our findings lend confidence in the measurement of
  transients with dynamic calibrated fMRI at high magnetic fields (Herman et al., 2009a; Sanganahalli et al., 2009).
Multi-Modal Methods for Calibrated fMRI and Neural Activity
Today, MRI can be used to measure CBF, CBV, and the BOLD signal in the same session with relatively high spatiotemporal resolution (Kida and Hyder, 2006). Of these methods, BOLD is the easiest to implement and apply because it requires no exogenous MRI contrast agent. CBV requires an exogenous MRI contrast agent, whereas CBF needs additional radio frequency (RF) hardware to selectively label arterial blood water. The temporal resolution of BOLD and CBV can be increased with marginal sensitivity losses (Kida et al., 2007; Shen et al., 2008), but dynamic measurements of CBF experience significant loss in signal-to-noise ratio (SNR) with fast imaging (Silva and Kim, 1999; Kida et al., 2004). Each method is generally believed to have superior SNR at higher magnetic field strengths, whereas the intravascular component of BOLD signal is reduced at higher magnetic fields (Ugurbil et al., 2000).
Oxyhemoglobin is diamagnetic and deoxyhemoglobin is paramagnetic, allowing BOLD image-contrast to be generated by conventional spin-echo or gradient-echo images which are sensitive to magnetic properties of blood (Kennan et al., 1994; Weisskoff et al., 1994). Deoxyhemoglobin in blood behaves as an endogenous MRI contrast agent, creating local magnetic field gradients which extend into the surrounding tissue and dephase magnetization of tissue water protons. Local gradients outside blood vessels enhance dephasing of tissue water protons which is detected by decreased signals in both spin-echo or gradient-echo images due to attenuation of transverse relaxation rates of tissue water protons (1/T2).
The CBV image-contrast by MRI is similar to BOLD in the sense that it is also based on magnetic susceptibility (Kennan et al., 1998; Mandeville et al., 1998). In non-human subjects changes in CBV are usually measured by utilizing plasma-borne intravascular paramagnetic MRI contrast agents, which are nanoparticles composed of oxides of iron or other metals, that affect the transverse relaxation rates of tissue water protons. If the MRI contrast agent is uniformly distributed in the vascular system and has a long half-life of elimination, then changes in spin-echo or gradient-echo images acquired before and after the MRI agent injection can be interpreted straightforwardly as CBV changes within the entire vascular network (CBVt).
However, because the volume term in Eq. 1 is localized to the venous compartment (CBVv) the use of ΔCBVt in place of ΔCBVv in Eq. 1 may over represent contributions of the volume term to some extent, thus causing a slight underestimation of  from calibrated fMRI. Using slightly different MRI methods to separate arterial (CBVa) and venous (CBVv) compartments (Kim and Kim, 2005), recent studies in non-human subjects show that changes in CBVa may dominate (Kim et al., 2007). However it is yet unclear how to incorporate changes of ΔCBVa vs. ΔCBVv into Eq. 1 for calibrated fMRI.
The CBF sensitivity by MRI is achieved by arterial spin labeling (ASL), where magnetic labeling by RF pulses of flowing spins in arterial blood water (e.g., by inversion or saturation) functions as an endogenous tracer (Detre et al., 1992; Williams et al., 1992). The labeled spins of blood water mix with unlabeled stationary spins of tissue water to attenuate the apparent longitudinal relaxation time of tissue water. Although ASL techniques suffer from poor temporal resolution because of the waiting period required for exchange of labeled and unlabeled spins, alternative labeling methods can be used to improve CBF temporal resolution, albeit with some sensitivity losses (Silva and Kim, 1999; Kida et al., 2004).
 estimated from calibrated fMRI requires measurements of BOLD signal, CBF, and CBV in the same subject and preferably in the same session. BOLD and CBF methods do not differ when applied to human and non-human subjects. However CBV methods vary significantly between human (e.g., see Stefanovic and Pike, 2005) and non-human (e.g., see Lu et al., 2005) subjects because MRI contrast agents cannot be repeatedly injected into humans. When changes in BOLD signal, CBF, and CBV are measured in the same session in non-human subjects, CBV is measured last because injection of the MRI contrast agent affects the other imaging signals. Because of difficulties with the CBV measurement in human subjects, Grubb’s relationship (Grubb et al., 1974) is usually used to estimate this component from measured CBF changes, where CBV = CBFφ. While a high Φ value (e.g., 0.4 as in Grubb’s original observation with hypercapnia challenge in primates; Grubb et al., 1974) has been typically assumed in some calibrated fMRI studies (Davis et al., 1998; Hoge et al., 1999; Chiarelli et al., 2007; Leontiev et al., 2007; Ances et al., 2009b), measured Φ values during functional activation are typically much smaller (Kida et al., 2007; Jin and Kim, 2008; Shen et al., 2008).
To estimate  from calibrated fMRI in relation to dynamic changes in neural activity, it is necessary to examine neurovascular and neurometabolic couplings for transient and steady-state events. If oxygen equilibrates rapidly between blood and tissue pools, then the same linearity of terms in Eq. 1 vs. neural activity can be used for event-related paradigms all the way up to block-design paradigms. Thus, for event-related and block-design paradigms, we measured high SNR hyperemic (BOLD, CBV, CBF) responses from the rat somatosensory cortex and related these imaging signals to neural activity (LFP, MUA) (Figure 1). The forepaw stimulation model in the α-chloralose anesthetized rat is extensively used because the time-dependent stimulus parameters (duration, frequency, etc.) can be easily and reproducibly manipulated (Van Camp et al., 2006; Sanganahalli et al., 2008) to compare activation responses in a dynamic manner (Herman et al., 2009a; Sanganahalli et al., 2009). To examine dynamic variations of neurometabolic and neurovascular couplings both the number of stimulus pulses (i.e., single event to steady-state) and the stimulus interval between pulses (i.e., low to high frequency) were varied. Because the ASL measurement of CBF dynamics lacks sensitivity compared with the BOLD and CBV measurements, we employed laser-Doppler flowmetry to measure red blood cell flux (Silva and Kim, 1999; Kida et al., 2004) and which can be easily combined with electrical measurements in rat brain (Trubel et al., 2006; Schridde et al., 2008).
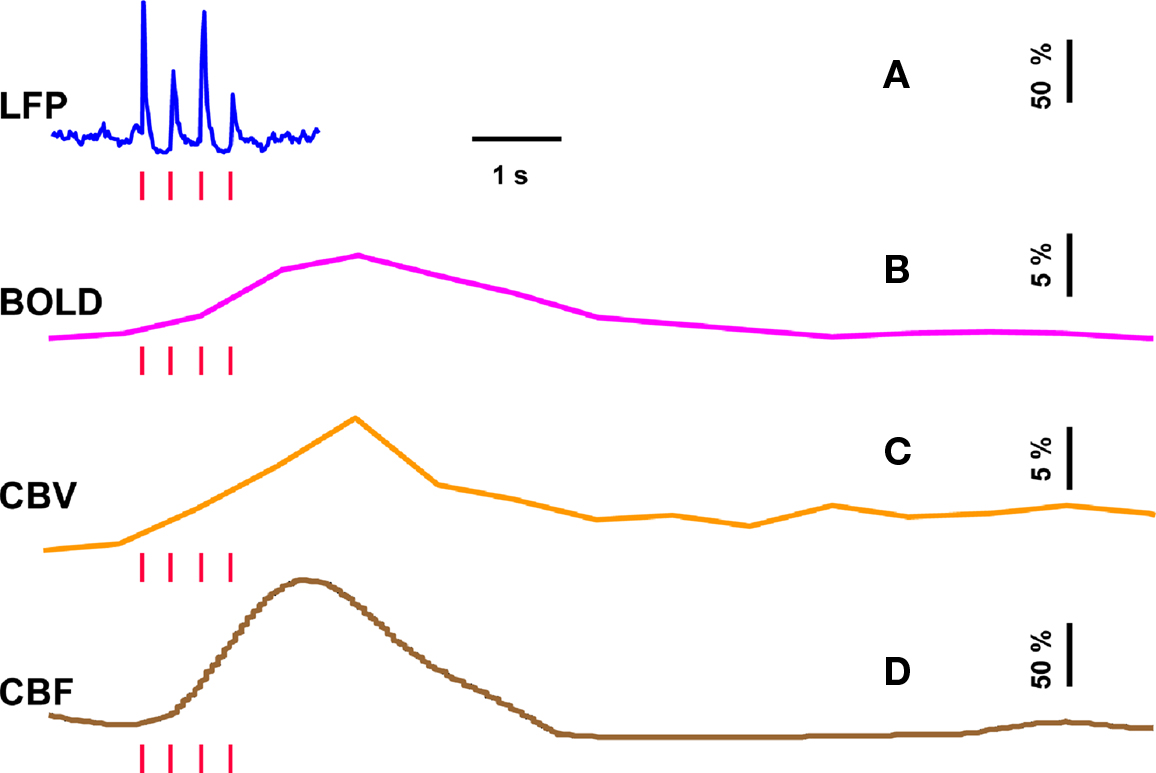
Figure 1. Single trial multi-modal data. Representative neural [(A); LFP] and imaging [(B–D); BOLD, CBV, CBF] signals for short forepaw stimuli (vertical bars). While there was an evoked LFP for each stimulus pulse, alternate LFP’s were not identical. A similar trend was observed for MUA (data not shown). Modified from results published in Herman et al. (2009a).
In our laboratory we use a dual-sensor device consisting of adjacent but isolated electrical and optical probes to simultaneously measure neural and CBF signals, respectively (Herman et al., 2009a; Sanganahalli et al., 2009). LFP and MUA, measured simultaneously with a high impedance microelectrode (>2 MΩ), are obtained by splitting the extracellular signal into low (<150 Hz) and high (0.4–10 kHz) frequency bands. Laser-Doppler signals are measured with respect to the pre-stimulus baseline, where the intensity of the optical signal (with 3 Hz forepaw stimulation) was calibrated to CBF data collected with the ASL technique (3 Hz, 2 mA, 0.3 ms, 96 pulses) as previously described (Kida et al., 2004). The high temporal resolution neural signals were integrated into 0.02 s running bins (equivalent to 50 Hz sampling of the laser-Doppler signal for CBF) allowing comparison with the lower temporal resolution BOLD and CBV data. All fMRI data were obtained on an 11.7T horizontal-bore spectrometer using a 1H surface coil RF probe and high SNR gradient-echo contrast pulse sequence with repetition and echo time of 1000 and 15 ms, respectively (Herman et al., 2009a; Sanganahalli et al., 2009).
The basis of using calibrated fMRI to represent neuronal transients with dynamic  is to test the temporal relationships between hyperemic components (BOLD, CBV, CBF) and neural activity (LFP, MUA), both for transient and steady-state events. If these relationships are linear within the stimuli ranges examined, then the respective transfer functions (of BOLD, CBV, CBF) would be considered time invariant (Boynton et al., 1996; Ances et al., 2000). Convolution theory states that the input signal, i(t), when convolved with a transfer function, h(t), produces an output signal, r(t). In our experiments we measure both i(t) and r(t) with high spatiotemporal resolution (Herman et al., 2009a; Sanganahalli et al., 2009). LFP or MUA were used as the neural signal, whereas BOLD, CBV, and CBF represented the independent hyperemic responses. The transfer function, h(t), can be achieved by a deconvolution between r(t ) and i( t ). If the frequency domain representations of i(t), r(t), and h(t) are given by I(ω), R(ω), and H(ω), respectively, then it can be shown that:

where t and ω are time and frequency domains, respectively, and inverse Fourier transform of H(ω) gives h(t). The gamma variate function is widely used for transfer function modeling. We used a slightly different form of the original equation (Madsen, 1992) so that the fitting parameters are independent from each other (Herman et al., 2009a; Sanganahalli et al., 2009). To find the best applicable transfer function we used a least-square mean Gauss–Newton fitting method which has three steps: (i) a transfer function is created with initial parameters; (ii) a transfer function is convolved with the input; (iii) a residual signal is created by differencing the predicted and measured signals. If the predicted signal is significantly different from the measured signal, then the parameters of the transfer function are changed and the process is continued from the first step. The fitting process is typically completed within a few hundred iterations and the last applied parameters are used to define the transfer function. Residuals are found acceptable if all of their values are within the range of uncertainty of the corresponding measured signal, as represented by the standard deviation (SD) about the mean.
Relationship Between Neural and Hyperemic Responses
Trends of electrophysiological recordings of LFP and MUA from the contralateral somatosensory cortex averaged across six subjects are shown in Figure 2A. The patterns of the LFP and MUA data were generally similar and in both cases the evoked neural responses to multiple stimuli were normalized to the response of the first stimulus pulse. At the lowest stimulation frequency of 1.5 Hz, each evoked neural response for individual stimulus pulses was quite similar to the prior ones with minimal neural response attenuation for additional stimulus pulses.
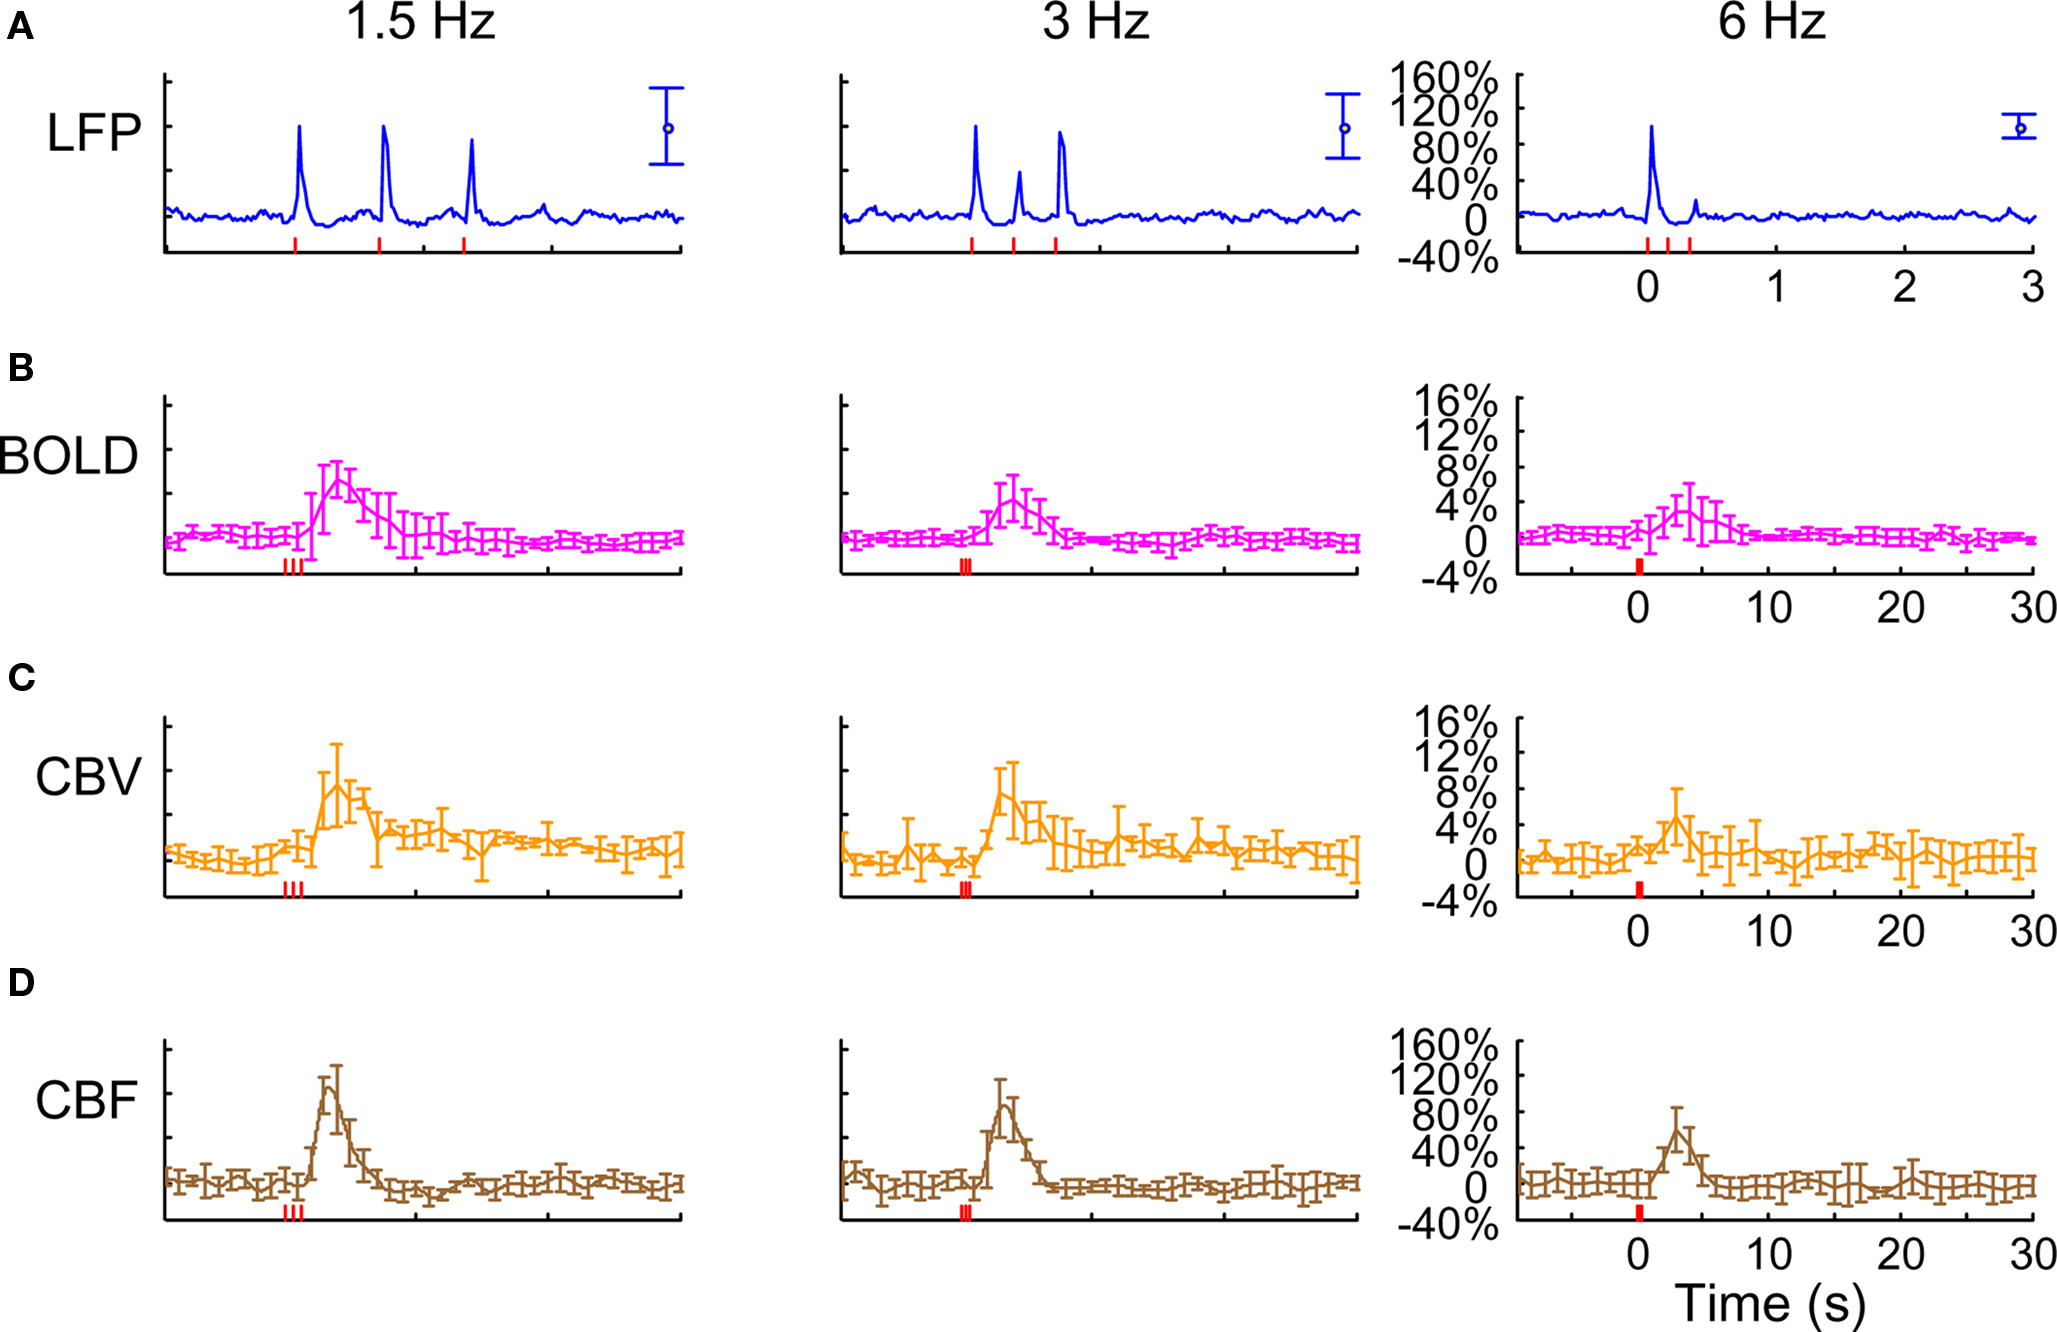
Figure 2. Neural and hyperemic responses to varying transient stimuli. LFP (A) simultaneously recorded with MUA (data not shown) from the contralateral somatosensory cortex. Responses to subsequent stimuli were normalized to the response of the first stimulus pulse. At stimulation frequency of 1.5 Hz, each evoked response for individual stimulus pulses was quite similar to the prior ones. At stimulation frequency of 3.0 Hz, alternate responses to subsequent stimuli were significantly attenuated compared to the response of the first stimulus pulse. At stimulation frequency of 6.0 Hz, the responses to subsequent stimuli were significantly attenuated. As the number of stimulus pulses increased, the responses were augmented for stimulation frequencies of 1.5 and 3.0 Hz but not for 6.0 Hz (data not shown). BOLD (B), CBV (C), and CBF (D) recorded from the contralateral somatosensory cortex. The CBF data were obtained simultaneously with the LFP (and MUA) data. In correspondence with the neural data, as stimulation frequency increased the hyperemic responses became attenuated. However the degree of attenuation was different for each modality. The vertical bars represent the stimuli ± SD from the mean. All data shown for three stimulus pulses indicated by red vertical bars. Neural and hyperemic traces are in 4 and 40 s duration, respectively. Modified from results published in Sanganahalli et al. (2009).
In contrast, at the highest stimulation frequency of 6.0 Hz there were small or negligible evoked neural responses detected for multiple stimulus pulses (i.e., there was mainly one large evoked response with the first stimulus pulse). For the intermediate stimulus frequency of 3.0 Hz, alternate evoked neural responses to subsequent stimulus pulses were significantly attenuated compared to the neural response of the previous stimulus pulse. Stimulus frequency dependent variations in neural activity are consistent with studies using various anesthetics (Nemoto et al., 2004; Ureshi et al., 2004) including α-chloralose (Matsuura and Kanno, 2001; Sheth et al., 2004). In summary, at a stimulus frequency of 6.0 Hz increasing the stimulus number changed the evoked response very little (from the response with a single stimulus pulse), whereas at lower stimulus frequencies increasing the stimulus number augmented the evoked responses linearly (Herman et al., 2009a; Sanganahalli et al., 2009).
Trends of hyperemic responses (BOLD, CBV, CBF) from the contralateral somatosensory cortex averaged across eight subjects are shown in Figures 2B–D. Although the BOLD, CBV, and CBF data generally behaved similarly (e.g., augmentation with higher stimulus number or attenuation with higher stimulus frequency), the temporal patterns of each varied indicating their dissimilar physiologic origins. Both the intensity and width of each hyperemic response augmented with increasing stimulus number (Herman et al., 2009a; Sanganahalli et al., 2009). For stimulus frequencies of 1.5 and 3.0 Hz, the hyperemic response grew linearly with increasing number of stimulus pulses, whereas for the same number of stimulus pulses the hyperemic response decreased with higher stimulus frequency (Herman et al., 2009a; Sanganahalli et al., 2009). At stimulus frequencies of 1.5 and 3.0 Hz, enhancement of the response with increase in stimulus number is correlated with the increase in neural activity. For a stimulus frequency of 6.0 Hz, the responses were nearly identical for different numbers of stimulus pulses, similar to the neural data.
Each hyperemic response was measured with respect to the pre-stimulus baseline. The mean time-to-peak in BOLD responses was ∼3.9 s, peaking at ∼8%, ∼5%, and ∼4%, respectively, for stimulation frequencies of 1.5, 3.0, and 6.0 Hz. This is due to the stimulus frequency tuning responses under α-chloralose anesthesia (Sanganahalli et al., 2008). The mean time-to-peak in CBV responses was ∼3.3 s, peaking at 11%, 10%, and 4%, respectively, for stimulation frequencies of 1.5, 3.0, and 6.0 Hz. Optical studies using the combination of oxy- and deoxyhemoglobin signals to estimate CBV changes demonstrate similar dependencies with variations in stimulus frequency and duration (Sheth et al., 2003; Nemoto et al., 2004). The mean time-to-peak in CBF responses was ∼3 s, peaking at ∼100%, ∼101%, and ∼53%, respectively, for stimulation frequencies of 1.5, 3.0, and 6.0 Hz. Our observation of the CBF trends with variations in stimulus duration and frequency is in agreement with prior observations (Ances et al., 2000; Martindale et al., 2003). The time course of cessation of the hyperemic response was different for each modality, with CBV having the slowest decay to pre-stimulation baseline values. Generally, the characteristics of CBF responses (intensity, width) were similar to the BOLD and CBV data, but with some caveats. For example, the non-linearity of the CBF response (vs. stimulus number with different stimulus frequency) was different than that observed with BOLD or CBV.
Since each signal is a function of varying amplitude over time, we measured response strength as the integral of the signal over the entire neural and hyperemic responses (Figure 3). We plotted normalized responses to quantify the relationships between hyperemic components (BOLD, CBV, CBF) and neural activity (LFP, MUA). Since neural and hyperemic signals at stimulus frequency of 6 Hz showed very little change with increasing stimulus number, this analysis was omitted here. Figures 3A,B show the relationships between LFP and MUA vs. hyperemic responses (at stimulation frequencies of 1.5 and 3.0 Hz). Because the comparisons in Figure 3 are of signal integrals (i.e., intensity and width) between the hyperemic components (BOLD, CBV, CBF) and neural activity (LFP, MUA) – which occur over quite dissimilar time scales (e.g., see Figure 1) – the intercepts on the vertical and horizontal axes are slightly different. While these findings are generally consistent with other reports (Sheth et al., 2004; Ureshi et al., 2004; Van Camp et al., 2006), the current results are unique in that the relationship for all components of neurovascular and neurometabolic couplings were investigated for very small temporal changes of the stimuli.
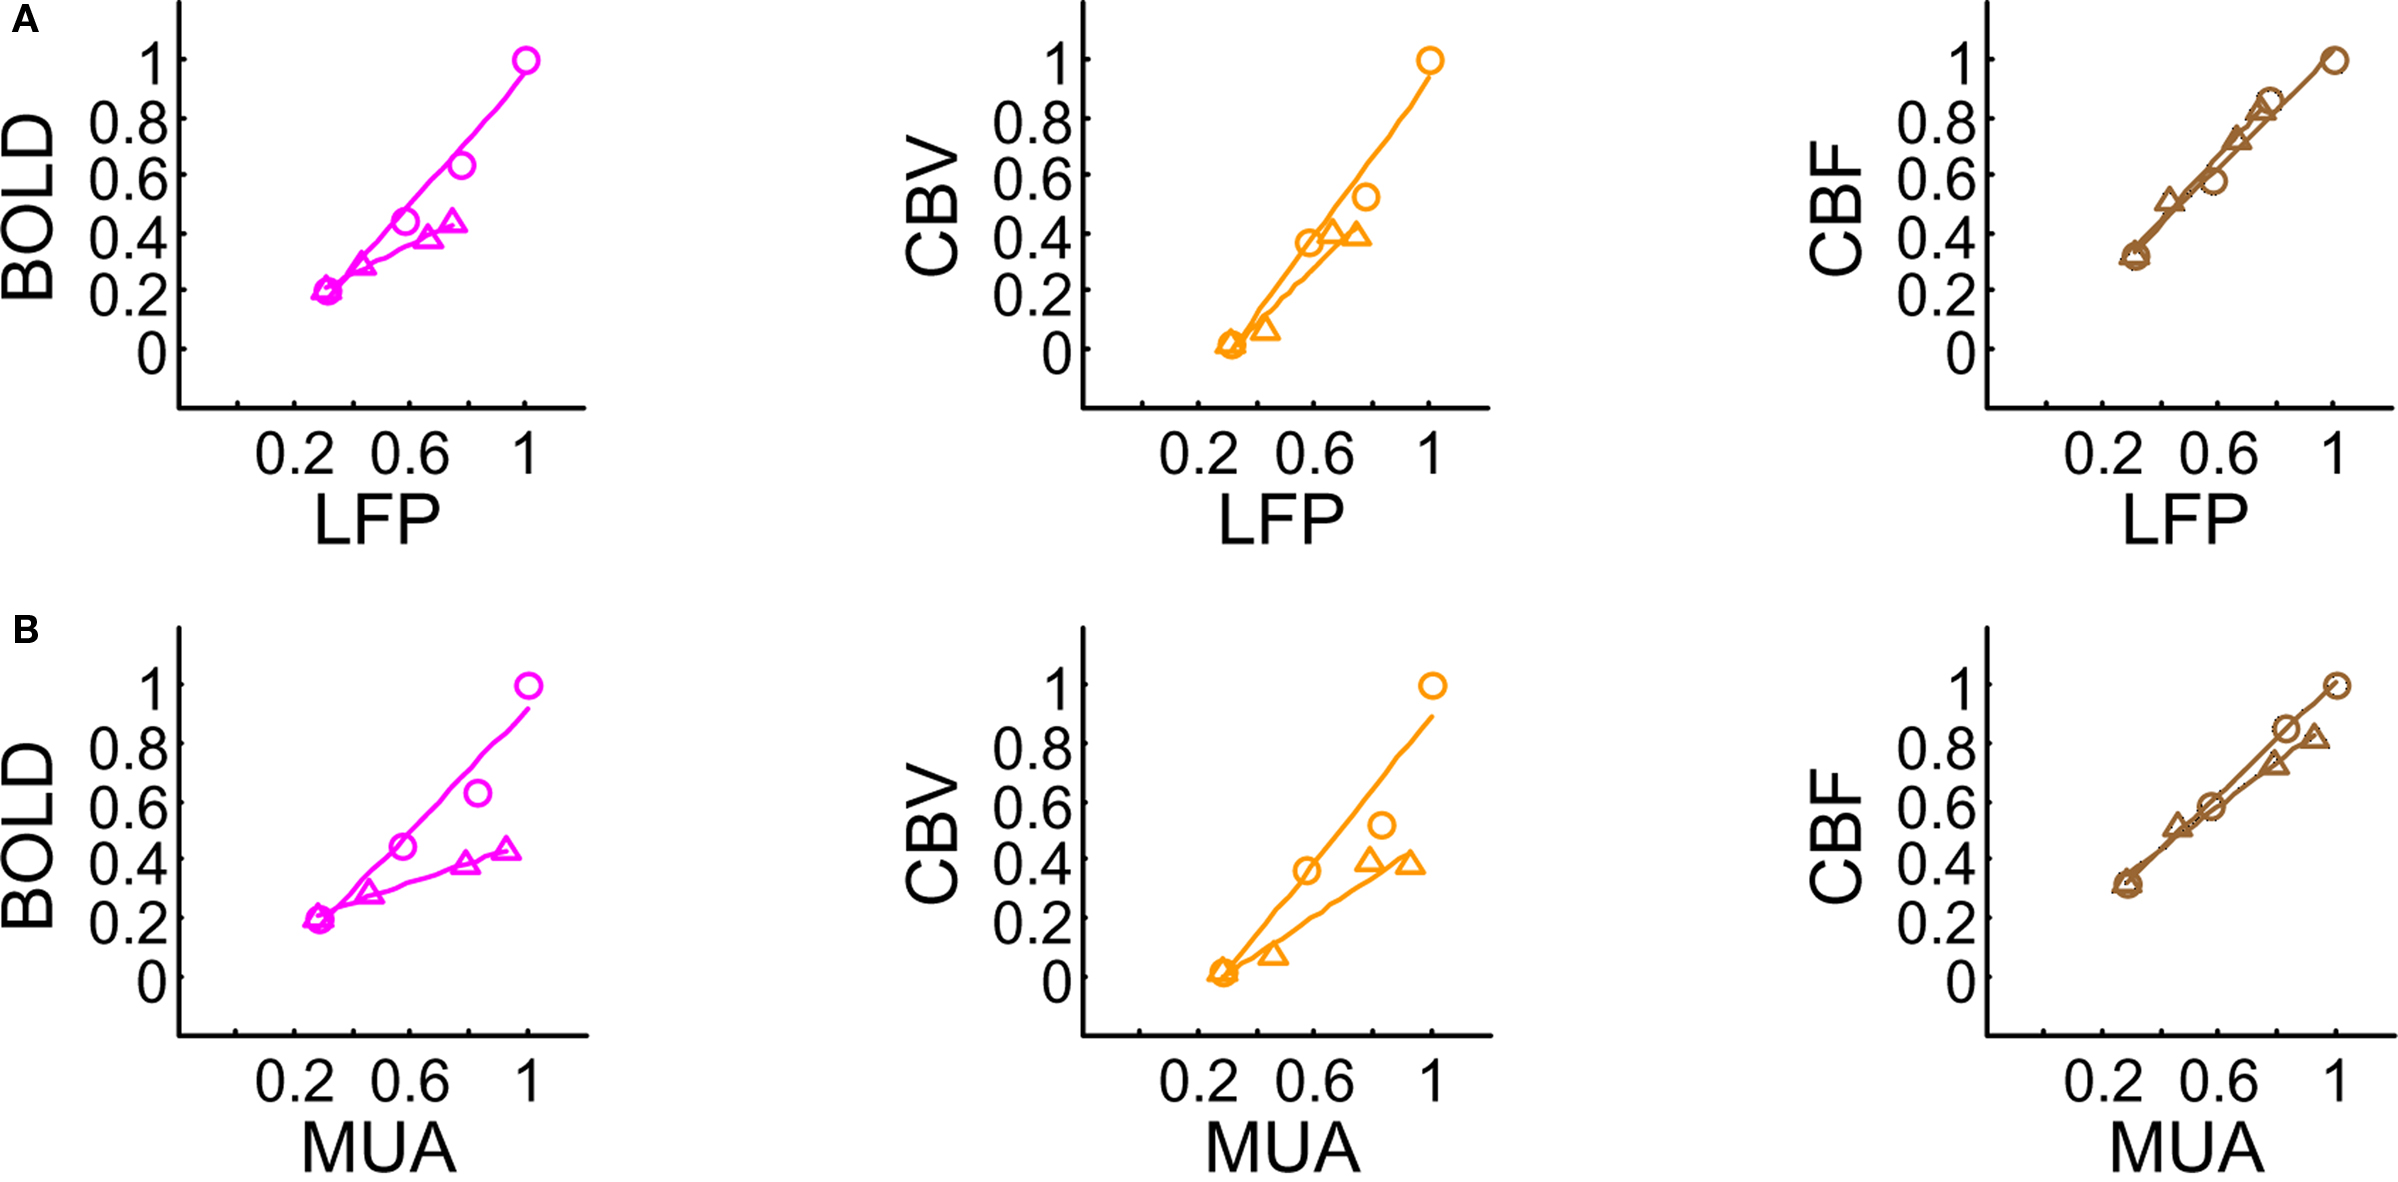
Figure 3. Relationships between multi-modal imaging signals vs. LFP (A) and MUA (B). For a stimulus frequency of 6.0 Hz the hyperemic responses changed minimally with increasing number of stimulus pulses (data not shown), whereas linear trends were observed for stimulus frequencies of 1.5 Hz (O) and 3.0 Hz (Δ). These linear trends resulted in universal transfer functions for each of the hyperemic responses. For each signal type (i.e., BOLD, CBV, CBF), because the same transfer function was successfully able to simulate the raw signal for various temporal events, the results and their analysis verified that the measured hyperemic responses were linear for the applied stimuli. All of the transfer functions were described with one (BOLD, CBF) or two (CBV) gamma variate functions. The scale of the CBF transfer function was a magnitude greater than the other transfer functions. CBF h(t) peaks the earliest (1.83 s), whereas BOLD h(t) peaks the latest (2.57 s). Both of these transfer functions have shorter tails to reach baselines (within ∼4 and ∼8 s, respectively, after peaking), whereas CBV h(t) has a very long tail (requiring ∼1 min to reach baseline). CBV h(t) peaks about the same time as the CBF h(t) (2.16 s). Modified from results published in Sanganahalli et al. (2009) and Herman et al. (2009a).
 Transients with Dynamic Calibrated fMRI
We used convolution analysis to find a transfer function that connects the neural signal to each hyperemic component, the effectiveness of which was characterized by the residual signal as given by the difference between the measured and predicted signals. If temporal fluctuations of the residual signal were smaller than the uncertainty of the measured signal over time (i.e., SD of the experimental measurement), the convolution process would produce a universal impulse response function. This is extremely important as it suggests that the respective transfer function should be time invariant within the temporal regime of the stimulus parameters.
We parameterized the transfer function with a gamma variate for each hyperemic component (Herman et al., 2009a; Sanganahalli et al., 2009). Briefly, the transfer functions generated by convolution analysis with LFP and MUA were quite similar in shape and the time-to-peak for BOLD, CBV, and CBF impulses were ∼2.6, ∼2.1, and ∼1.8 s, respectively. The systematic difference between the time-to-peak of each measured response and each transfer function is consistent with prior observations (Ances et al., 2000; Buracas and Boynton, 2002; Silva et al., 2007), but prior studies did not include neural data or used interpolated neural data for deconvolution. We used the strength of the neural data to specifically target the delicate non-linear trends of neural data over time and their impact on the impulse response function.
Past studies applied convolution analysis with the BOLD response to report either linearity (Boynton et al., 1996) or non-linearity (Vazquez and Noll, 1998), but these studies used the stimulus itself as the input due to lack of neural activity recordings. Recent studies which include neural activity measurements reveal specific trends that agree with our observations (Matsuura and Kanno, 2001; Sheth et al., 2004), but only a few have applied convolution analysis with CBF and CBV (Ances et al., 2001; Martin et al., 2006; Silva et al., 2007). In general, the transfer functions generated for BOLD, CBV, and CBF are in good agreement with literature reports. Since a detailed discussion of each transfer function is not the goal here, the general observations are as follows: the CBF impulse peaks the earliest whereas the BOLD and CBF impulses are different in shape compared to the CBV impulse which has a very long tail.
While results from prior studies are insightful about convolution theory, they should be interpreted with caution because of the use of an interpolation procedure between consecutive evoked neural signals (Ances et al., 2000; Mathiesen et al., 2000), whereas we used the signal strength. Interpolating between separate neural events creates the impression of a more weighted neural signal. For long stimulus durations this process may have minimal impact on deconvolution because smoothing changes the signal envelope (or shape) very little. In contrast, however, for brief stimuli this approach could generate non-linearity from deconvolution because smoothing creates a signal that is quite different from the actual response. In our studies, treatment of each evoked neural response was a key feature utilized in both linearity assessments across different measurements and demonstration of the time invariance of the transfer functions.
Demonstration of time invariance of the transfer function was based on two different systematic comparisons of the predicted and measured signals (Herman et al., 2009a; Sanganahalli et al., 2009). In one comparison, the root-mean-square (RMS) of the residual signal was compared with the SD of the measurement. The RMS of the residual signal was averaged across the entire data set and compared with the average of the measurement SD over the same duration. In each case, the comparison showed that the residual “noise” in modeling was smaller than the measurement uncertainty. In another comparison, only the hyperemic phase (i.e., the first 10 s of data after stimulation onset) was compared. This representation, similar to the RMS vs. SD comparison, showed that the predicted and measured signals were well correlated in each case, thereby suggesting time invariance of transfer functions.
The electrical and imaging data (Figure 2) revealed linear relationships between neural activity and each of the hyperemic components (Figure 3). A comprehensive convolution analysis revealed that the respective transfer functions (of BOLD, CBV, CBF) are time invariant for extremely brief events (separated by less than 200 ms) and all the way up to steady-state events (Herman et al., 2009a; Sanganahalli et al., 2009). These results enable calibrated fMRI to be utilized in a dynamic manner for calculating  transients (Figure 4, upper panel). To estimate
  from our multi-modal data we used a value of 0.5 for A in Eq. 1, which is expected based on prior observations of rat cerebral cortex at magnetic fields higher than 7.0T (Kida et al., 1999, 2000; Hyder et al., 2001; Englot et al., 2008; Schridde et al., 2008).
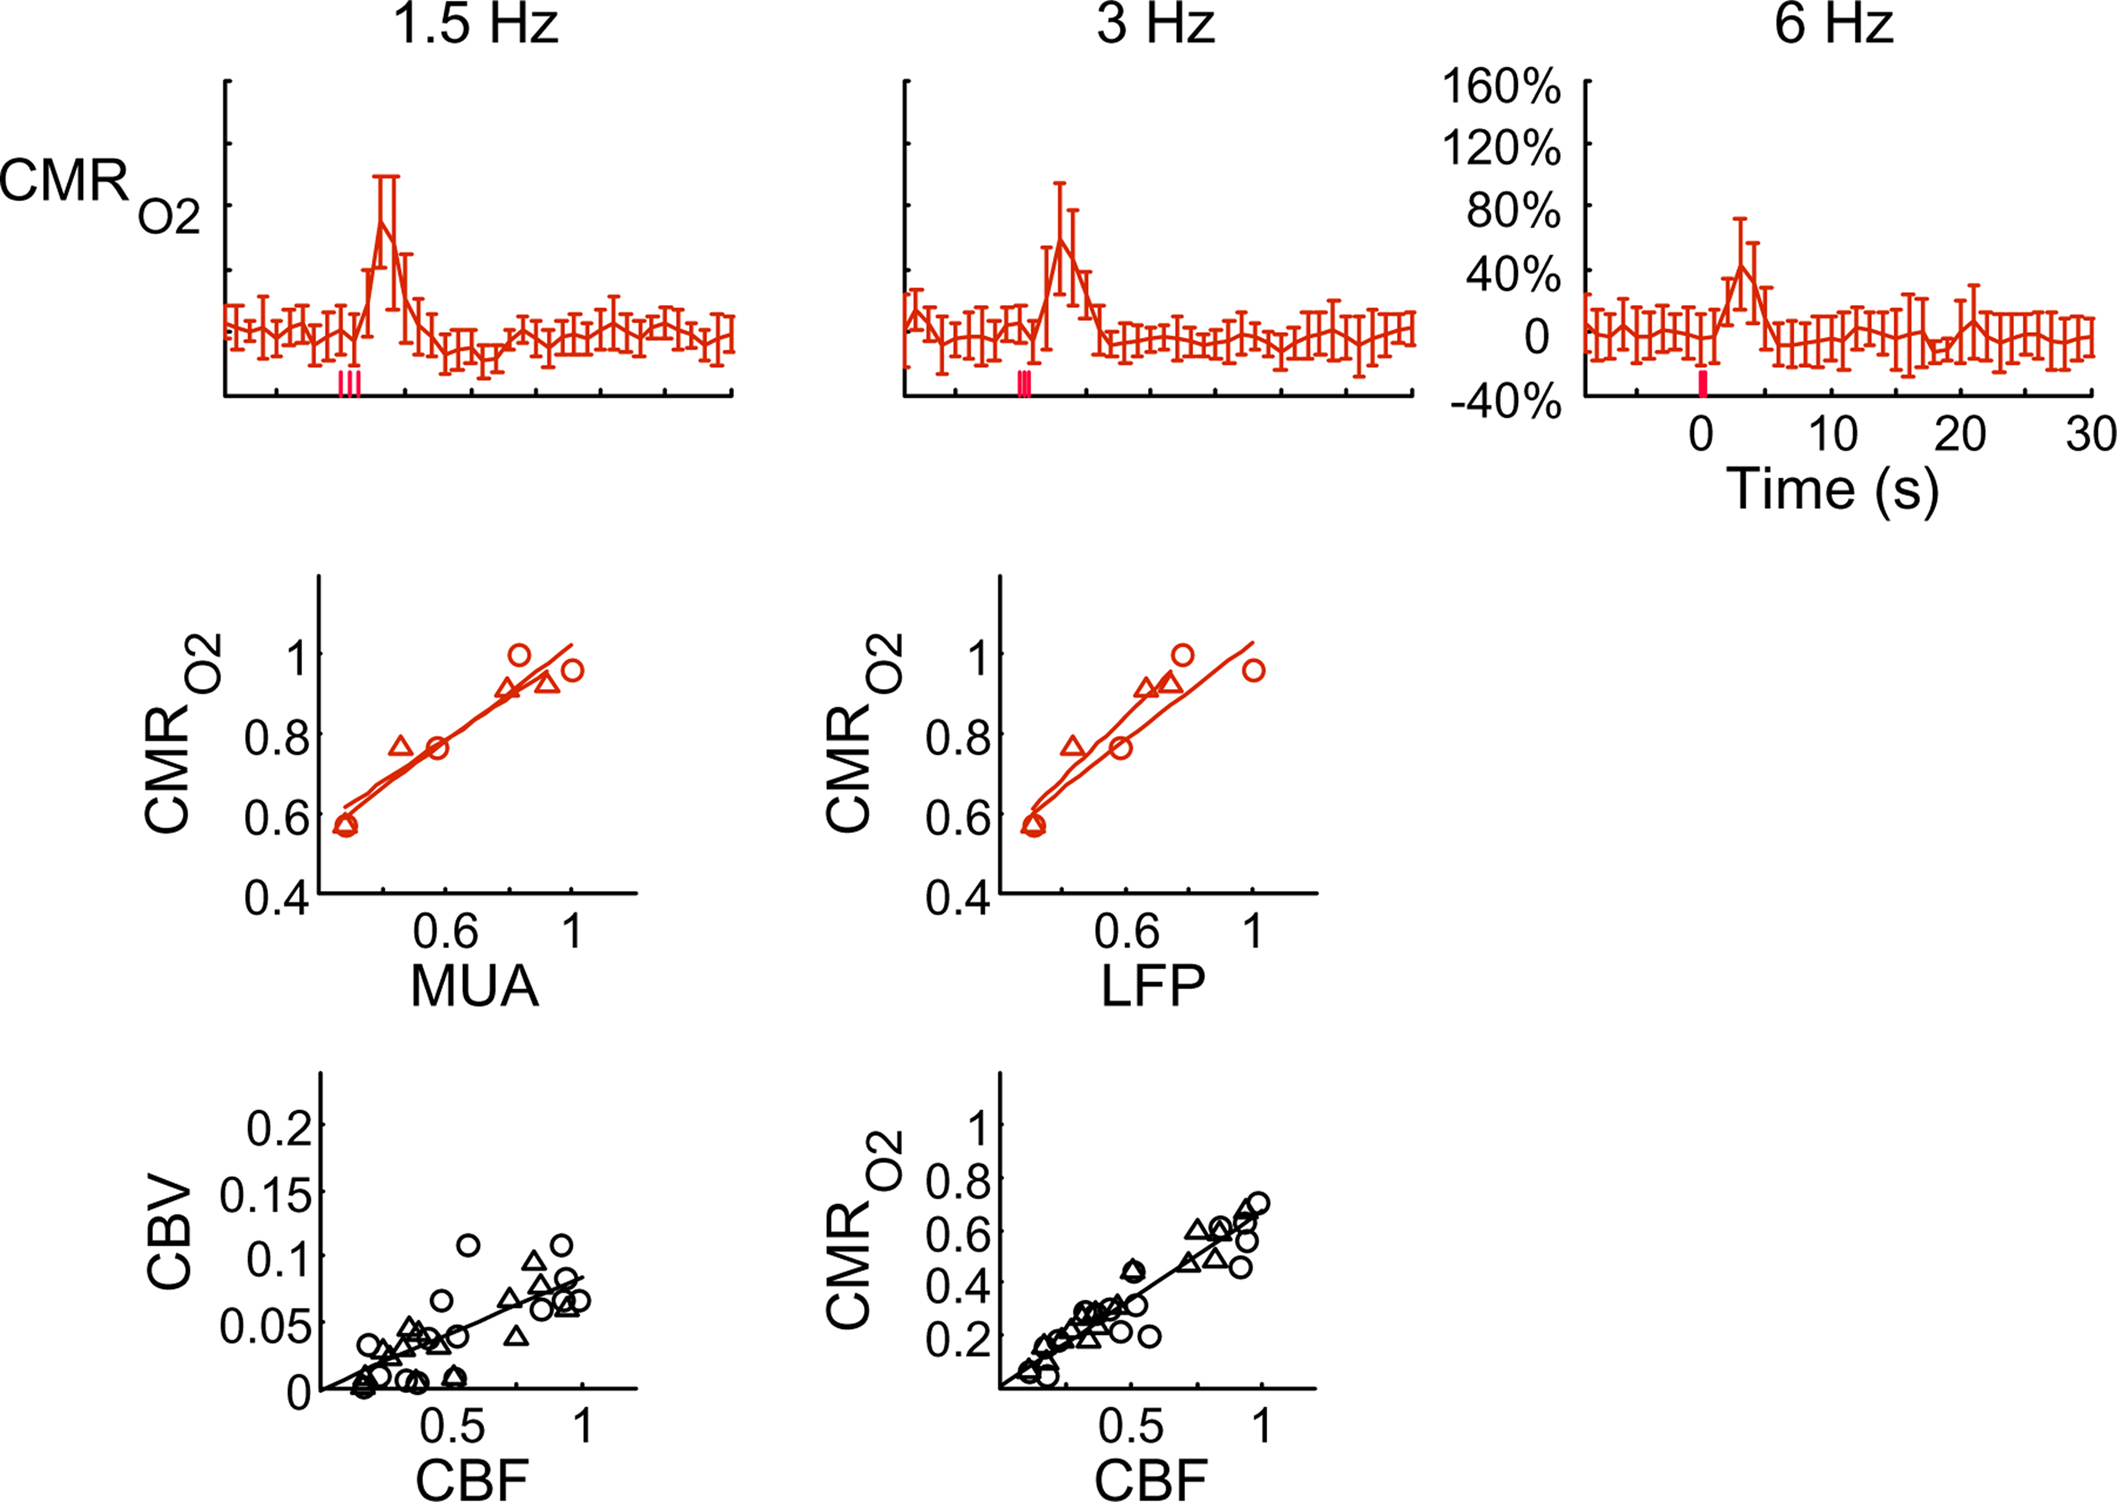
Figure 4. Dynamic calibrated fMRI.  dynamics (top) and relationships with neural (middle) and hemodynamic (bottom) responses. Time courses of
  responses (top) from the contralateral somatosensory cortex during variation of stimulation frequency (with three stimulus pulses indicated by red vertical bars). In correspondence with the neural data, as stimulation frequency increased the energetic responses were attenuated. For stimulus frequencies of 1.5 and 3.0 Hz the energetic responses increased linearly with higher number of stimulus pulses, whereas for stimulus frequency of 6.0 Hz the energetic responses were nearly identical for different number of stimulus pulses (data not shown). Each trace is 40 s in duration.
  values were calculated using Eq. 1. Relationships between
  vs. neural (middle) and
  vs. hemodynamic (bottom) data. Modified from results published in Sanganahalli et al. (2009) and Herman et al. (2009a).
Relaxation measurements in different brain regions suggest that the T2 nearly halves from 4.0T to 11.7T (de Graaf et al., 2006) – from about 65 ms to about 35 ms – thereby suggesting that the A value in Eq. 1 may vary significantly at lower and higher magnetic fields. Using the data acquired at 11.7T, when the A value is halved from 0.5 then the  is reduced by nearly the same magnitude, whereas when the A value is doubled from 0.5 then the
  is only marginally increased. Employing a lower value for A (e.g., 0.10–0.15, gray matter at 1.5T) with the current 11.7T data leads to a reduction in
  to a very low values, which would be in clear disagreement with steady-state 13C MRS data for the same rat model where significant changes in
  have been reported with forepaw stimulation (Hyder et al., 1996, 2000). Furthermore, the energetic changes measured with 13C MRS are in agreement with neural firing at steady-state (Smith et al., 2002; Kida et al., 2006; Maandag et al., 2007).
Human calibrated fMRI experiments use a brief hypercapnia challenge to estimate the A value in Eq. 1 (Davis et al., 1998; Hoge et al., 1999). If  is assumed with hypercapnia, then the A value can be estimated by measurements of BOLD signal and CBF with hypercapnia where CBV is assumed from CBF based on Grubb’s relationship (Grubb et al., 1974). In non-human subjects, however, the A value can be measured in conjunction with independent assessment of the
  with 13C MRS (see Shulman et al., 2002 for details), bypassing the need for hypercapnia (Kida et al., 2000; Hyder et al., 2001). Measurements of BOLD signal, CBF, CBV, and
  (by 13C MRS) at different physiological conditions allow the A value to be validated. This latter approach, however, is limited by the spatial resolution of MRS at high magnetic fields, which for the rat currently enables calibrated fMRI to the more homogenous cerebral cortex.
Figure 4 shows the  time courses obtained from group averaged data (upper panel), as well as the relationships of
  with neural (middle panel) and hemodynamic (lower panel) responses. For stimulus frequencies of 1.5 and 3.0 Hz, the
  response (intensity, width) increased linearly with higher number of stimulus pulses, whereas for the same number of stimulus pulses the
  response decreased with higher stimulus frequency (Herman et al., 2009a; Sanganahalli et al., 2009). For a stimulus frequency of 6.0 Hz, the
  responses were nearly identical for different numbers of stimulus pulses. The mean time-to-peak in
  responses was ∼3.5 s, which is slightly delayed in comparison to CBF.
  responses for four stimulus pulses were largest at a stimulus frequency of 1.5 Hz (63 ± 38%) and 3.0 Hz (68 ± 39%), as compared to 6.0 Hz (38 ± 27%). Because existing pO2, PET, and other MRS methods do not provide high temporal resolution
  data, the good agreement between
  vs. neural activity (middle panel) provides the best validation available, although still indirect, of the use of dynamic calibrated fMRI for calculating
  (Hyder et al., 2002).
All hyperemic (BOLD, CBV, CBF) and neural (LFP, MUA) relationships used integrated (i.e., intensity and width) values (Figure 3). Since we do not know the nominal SNR of each of these measured signals, it is difficult to discuss linearity or non-linearity trends in the integral plots beyond the applied stimuli. Therefore linearity or non-linearity trends from these plots should be limited to the range of stimuli conditions examined. However the slightly different intercepts for hyperemic vs. neural (Figure 3) and  vs. neural plots (Figure 4, middle panel) correspond to larger experimental error in
  prediction, which can be described by error propagation (Herman et al., 2009a; Sanganahalli et al., 2009). If we assume all hyperemic and neural signals have the same SNR for stimuli shorter than what we applied, it would suggest that
  experimental accuracy is insufficient to predict a response for such short stimuli. However it is also possible that
  vs. neural plot may indicate a slight non-linearity for shorter events than our current single event.
Overall, linear relationships were observed for  vs. neural activity, with either LFP or MUA. Recent studies in primates imply that LFP and MUA respectively correspond to the neural input (pre-synaptic) and output (post-synaptic) signaling (Logothetis et al., 2001), which roughly approximates pre-synaptic and post-synaptic signaling. As stated earlier, LFP and MUA generally behaved similarly as a function of stimulus number within the range of stimulus frequencies tested. Therefore, the linear relationships between
  vs. neural activity depicted in Figure 4 (middle panel) suggest that the coupled pre-synaptic and post-synaptic activities corresponding to the forepaw stimuli are roughly equally weighted for the rat somatosensory cortex, which is in good agreement with theoretical predictions (Attwell and Laughlin, 2001). Moreover, the commonality of relationships between hyperemic components (BOLD, CBV, CBF) and neural activity (LFP, MUA), with either LFP or MUA, depicted in Figure 3 using the signal strength (not the signal amplitude) in each case suggests that LFP and MUA are equally well correlated with the neuroimaging signals. This finding in rat brain (Herman et al., 2009a; Sanganahalli et al., 2009) stands in contrast to prior findings in primate brain (Logothetis et al., 2001).
The impacts of CB V and CBF on the calculated values of  (Eq. 1) are important because they have different dynamic relationships to the BOLD signal (Figure 2). The Grubb relationship (Grubb et al., 1974), defined as CBV = CBFφ, shows that the value of the exponent,Φ as calculated for the entire hyperemic phase was approximately 0.15 (Figure 4, lower left panel). This value is in close agreement with recent animal studies (Jin and Kim, 2008; Shen et al., 2008) but is far smaller than what is typically assumed in human calibrated fMRI experiments (Davis et al., 1998; Hoge et al., 1999). However, we note that the value of Φ was allowed to vary over time for the dynamic
  calculation (Kida et al., 2007). A tight CBF–
 dynamic coupling, ranging between 3:2 and 5:2 (Figure 4, lower right panel), was also observed. The CBF–
 coupling of about 2:1 is in agreement with predictions of oxygen transport models (Hyder et al., 1998; Herman et al., 2006; Huppert et al., 2007) and results from steady-state calibrated fMRI studies (Hoge et al., 1999; Uludag et al., 2004; Chiarelli et al., 2007). Although the characteristics of CBF dynamics appear to be quite similar to
  transients, careful examination of these two impulse response functions shows that oxygen delivery is fitted by a gamma variate (CBF), whereas oxygen use is not
  The transfer functions were parameterized by a constrained non-linear half-order rational equation, where
  transients generated with LFP or MUA as the input were indistinguishable (Herman et al., 2009a; Sanganahalli et al., 2009).
Limitations of Dynamic Calibrated fMRI
To consolidate measurements from a single probe (e.g., electrical, optical) with high resolution fMRI data, it is important to realize that results pertain mainly to these focal sites. Because sampling from larger spatial regions with microelectrodes is not practical, our electrical data were confined to the middle cortical layers, which were then related to fMRI voxels located in similar cortical regions. Preliminary electrophysiology work (data not shown) suggests that the current results may be extended to layers above, but not necessarily layers below. Moreover, these cortical results should not be extrapolated to sub-cortical regions without additional experimental evidence of the neurometabolic and neurovascular couplings. Our results provide temporal transfer functions, although studies are underway to obtain the spatial transfer functions which span the somatosensory cortex tangentially in a specific cortical layer.
An important issue for estimating transients from calibrated fMRI is whether changes in oxygen extraction affect the observed neurovascular and neurometabolic couplings differently for transient and steady-state events. The different components of Eq. 1 were linearly correlated with neural activity and furthermore the transfer functions of each of the components of Eq. 1 were time invariant. Together, these findings imply that oxygen equilibrates quickly between tissue and blood pools and thus all points of the hyperemic phase carry nearly the same calibration in Eq. 1 in relation to neural activity. First, we had to experimentally assess if linearity exists between each hyperemic component and neural activity. Here we used the strength of each signal type. Second, we tested the universality of the respective transfer functions to accurately predict the measured responses. With linearity and time invariance demonstrated from the multi-modal data, we identified a BOLD component for transient  changes, from single events to steady-state (Figure 5). The transfer functions (for BOLD, CBV, CBF) generated for short-lasting events accurately predicted the response to long-lasting events.
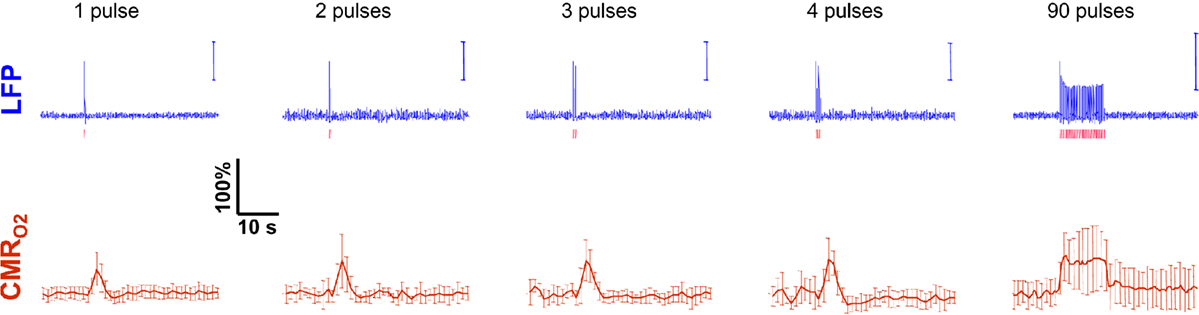
Figure 5. Measured LFP and calculated  signals for short- and long-lasting stimuli. Convolution analysis of the universal transfer functions suggests linearity of the hyperemic responses with neural activity. Similar trends were observed with MUA (data not shown). Modified from results published in Sanganahalli et al. (2009) and Herman et al. (2009a).
These findings for  transients raise the issue of the early dip observed with a variety of methods, including recordings of tissue pO2, optical imaging of deoxyhemoglobin, and/or BOLD signal. The prior studies suggest the possibility of even an earlier
  increase (within the first 500–700 ms after stimulation onset). The early tissue pO2 dip has been observed in anesthetized rats and cats (Ances et al., 2001; Thompson et al., 2003). Although optical imaging of deoxyhemoglobin have reported the early dip (Malonek and Grinvald, 1996), some inconsistencies remain about its visibility (Jones et al., 2001; Lindauer et al., 2001). The early dip in the BOLD signal has been noted primarily in some human studies (Menon et al., 1995; Hu et al., 1997), but it remains unclear whether this observation is specific to humans because no rat (Silva et al., 2000) or monkey (Logothetis et al., 2001) studies have reported the early dip, whereas some cat studies have reported the dip (Kim et al., 2000) and others have not (Jezzard et al., 1997). Moreover the early BOLD signal dip may be sensitive to blood pCO2 (Harel et al., 2002). Despite the fact that the magnitude of the dip is near detection threshold of most techniques, its observation remains a very important topic of research (Ances, 2004). Future fMRI sensitivity improvements (e.g., better RF coils) may allow measurement of the early BOLD signal dip and earlier
  increases to be assessed.
Of the many factors that affect the BOLD signal in Eq. 1, the common approach in calibrated fMRI has been not to include hematocrit (Buxton et al., 1998). At steady-state,  calculation by calibrated fMRI assumes that volume (or discharge) hematocrit is unchanged, an assumption which has been partly confirmed by comparing kinetics of red blood cell and plasma volume changes (Herman et al., 2009b). However, dynamically different velocities of red blood cell and plasma compartments may become exaggerated in capillaries, which in turn could affect the flow (or tube) hematocrit (Pries et al., 1986). Thus, an important consideration for future calibrated fMRI studies is the possible involvement of transient hematocrit changes (Fahraeus, 1929) on the dynamic BOLD contrast, and which in turn may account for small deviations in the residual signals that have been observed.
Conclusion
The results discussed above show that comparing signal strength of measured neural (LFP, MUA) and hyperemic (BOLD, CBV, CBF) components, over a wide range of stimuli time epochs, shows strong neurometabolic and neurovascular couplings that subsequently lead to dynamic calibrated fMRI to be performed. In the rat brain,  increases within 1 s of stimulus onset and even for single event the energy demand peaks to nearly the same value as that obtained for steady-state stimuli. The early increase in
  suggests that the energy expended by neural activity is primarily generated through oxidative metabolism. Thus, we find no significant mismatch between oxidative and non-oxidative energy consumption at early times during dynamic changes in neural activity. Although
  transients appear slower than the actual neural responses, their coupling for events separated by less than 200 ms highlights the sensitivity of high magnetic field dynamic calibrated fMRI for high resolution mapping of oxidative energetics.
Conflict of Interest Statement
The authors declare that the research was conducted in the absence of any commercial or financial relationships that could be construed as a potential conflict of interest.
Acknowledgments
The authors thank scientists and engineers at MRRC (mrrc.yale.edu), and QNMR (qnmr.yale.edu). This work was supported by grants from National Institutes of Health (R01 MH-067528, R01 CA-140102, R01 EB-011968, R01 NS-049307, R01 NS-055829, R01 NS-051854, R01 AG-034953, P30 NS-52519, P01 NS-062686) and Juvenile Diabetes Research Foundation (Pilot Award 42004807).
References
Ances, B. M. (2004). Coupling of changes in cerebral blood flow with neural activity: what must initially dip must come back up. J. Cereb. Blood Flow Metab. 24, 1–6.
Ances, B. M., Buerk, D. G., Greenberg, J. H., and Detre, J. A. (2001). Temporal dynamics of the partial pressure of brain tissue oxygen during functional forepaw stimulation in rats. Neurosci. Lett. 306, 106–110.
Ances, B. M., Liang, C. L., Leontiev, O., Perthen, J. E., Fleisher, A. S., Lansing, A. E., and Buxton, R. B. (2009a). Effects of aging on cerebral blood flow, oxygen metabolism, and blood oxygenation level dependent responses to visual stimulation. Hum. Brain Mapp. 30, 1120–1132.
Ances, B. M., Sisti, D., Vaida, F., Liang, C. L., Leontiev, O., Perthen, J. E., Buxton, R. B., Benson, D., Smith, D. M., Little, S. J., Richman, D. D., Moore, D. J., and Ellis, R. J. (2009b). Resting cerebral blood flow: a potential biomarker of the effects of HIV in the brain. Neurology 73, 702–708.
Ances, B. M., Zarahn, E., Greenberg, J. H., and Detre, J. A. (2000). Coupling of neural activation to blood flow in the somatosensory cortex of rats is time-intensity separable, but not linear. J. Cereb. Blood Flow Metab. 20, 921–930.
Attwell, D., and Laughlin, S. B. (2001). An energy budget for signaling in the grey matter of the brain. J. Cereb. Blood Flow Metab. 21, 1133–1145.
Boynton, G. M., Engel, S. A., Glover, G. H., and Heeger, D. J. (1996). Linear systems analysis of functional magnetic resonance imaging in human V1. J. Neurosci. 16, 4207–4221.
Buracas, G. T., and Boynton, G. M. (2002). Efficient design of event-related fMRI experiments using M-sequences. Neuroimage 16, 801–813.
Buxton, R. B., Wong, E. C., and Frank, L. R. (1998). Dynamics of blood flow and oxygenation changes during brain activation: the balloon model. Magn. Reson. Med. 39, 855–864.
Chiarelli, P. A., Bulte, D. P., Gallichan, D., Piechnik, S. K., Wise, R., and Jezzard, P. (2007). Flow-metabolism coupling in human visual, motor, and supplementary motor areas assessed by magnetic resonance imaging. Magn. Reson. Med. 57, 538–547.
Davis, T. L., Kwong, K. K., Weisskoff, R. M., and Rosen, B. R. (1998). Calibrated functional MRI: mapping the dynamics of oxidative metabolism. Proc. Natl. Acad. Sci. U.S.A. 95, 1834–1839.
de Graaf, R. A., Brown, P. B., McIntyre, S., Nixon, T. W., Behar, K. L., and Rothman, D. L. (2006). High magnetic field water and metabolite proton T1 and T2 relaxation in rat brain in vivo. Magn. Reson. Med. 56, 386–394.
Detre, J. A., Leigh, J. S., Williams, D. S., and Koretsky, A. P. (1992). Perfusion imaging. Magn. Reson. Med. 23, 37–45.
Englot, D. J., Mishra, A. M., Mansuripur, P. K., Herman, P., Hyder, F., and Blumenfeld, H. (2008). Remote effects of focal hippocampal seizures on the rat neocortex. J. Neurosci. 28, 9066–9081.
Grubb, R. L. Jr., Raichle, M. E., Eichling, J. O., and Ter-Pogossian, M. M. (1974). The effects of changes in PaCO2 on cerebral blood volume, blood flow, and vascular mean transit time. Stroke 5, 630–639.
Harel, N., Lee, S. P., Nagaoka, T., Kim, D. S., and Kim, S. G. (2002). Origin of negative blood oxygenation level-dependent fMRI signals. J. Cereb. Blood Flow Metab. 22, 908–917.
Herman, P., Sanganahalli, B. G., Blumenfeld, H., and Hyder, F. (2009a). Cerebral oxygen demand for short-lived and steady-state events. J. Neurochem. 109(Suppl. 1), 73–79.
Herman, P., Sanganahalli, B. G., and Hyder, F. (2009b). Multimodal measurements of blood plasma and red blood cell volumes during functional brain activation. J. Cereb. Blood Flow Metab. 29, 19–24.
Herman, P., Trubel, H. K., and Hyder, F. (2006). A multiparametric assessment of oxygen efflux from the brain. J. Cereb. Blood Flow Metab. 26, 79–91.
Hoge, R. D., Atkinson, J., Gill, B., Crelier, G. R., Marrett, S., and Pike, G. B. (1999). Linear coupling between cerebral blood flow and oxygen consumption in activated human cortex. Proc. Natl. Acad. Sci. U.S.A. 96, 9403–9408.
Hoge, R. D., and Pike, G. B. (2001). Oxidative metabolism and the detection of neuronal activation via imaging. J. Chem. Neuroanat. 22, 43–52.
Hu, X., Le, T. H., and Ugurbil, K. (1997). Evaluation of the early response in fMRI in individual subjects using short stimulus duration. Magn. Reson. Med. 37, 877–884.
Huppert, T. J., Allen, M. S., Benav, H., Jones, P. B., and Boas, D. A. (2007). A multicompartment vascular model for inferring baseline and functional changes in cerebral oxygen metabolism and arterial dilation. J. Cereb. Blood Flow Metab. 27, 1262–1279.
Hyder, F., Chase, J. R., Behar, K. L., Mason, G. F., Siddeek, M., Rothman, D. L., and Shulman, R. G. (1996). Increased tricarboxylic acid cycle flux in rat brain during forepaw stimulation detected with 1H[13C]NMR. Proc. Natl. Acad. Sci. U.S.A. 93, 7612–7617.
Hyder, F., Kennan, R. P., Kida, I., Mason, G. F., Behar, K. L., and Rothman, D. (2000). Dependence of oxygen delivery on blood flow in rat brain: a 7 tesla nuclear magnetic resonance study. J. Cereb. Blood Flow Metab. 20, 485–498.
Hyder, F., Kida, I., Behar, K. L., Kennan, R. P., Maciejewski, P. K., and Rothman, D. L. (2001). Quantitative functional imaging of the brain: towards mapping neuronal activity by BOLD fMRI. NMR. Biomed. 14, 413–431.
Hyder, F., Patel, A. B., Gjedde, A., Rothman, D. L., Behar, K. L., and Shulman, R. G. (2006). Neuronal-glial glucose oxidation and glutamatergic-GABAergic function. J. Cereb. Blood Flow Metab. 26, 865–877.
Hyder, F., Rothman, D. L., and Shulman, R. G. (2002). Total neuroenergetics support localized brain activity: implications for the interpretation of fMRI. Proc. Natl. Acad. Sci. U.S.A. 99, 10771–10776.
Hyder, F., Shulman, R. G., and Rothman, D. L. (1998). A model for the regulation of cerebral oxygen delivery. J. Appl. Physiol. 85, 554–564.
Ito, H., Ibaraki, M., Kanno, I., Fukuda, H., and Miura, S. (2005). Changes in cerebral blood flow and cerebral oxygen metabolism during neural activation measured by positron emission tomography: comparison with blood oxygenation level-dependent contrast measured by functional magnetic resonance imaging. J. Cereb. Blood Flow Metab. 25, 371–377.
Jezzard, P., Rauschecker, J. P., and Malonek, D. (1997). An in vivo model for functional MRI in cat visual cortex. Magn. Reson. Med. 38, 699–705.
Jin, T., and Kim, S. G. (2008). Improved cortical-layer specificity of vascular space occupancy fMRI with slab inversion relative to spin-echo BOLD at 9.4 T. Neuroimage 40, 59–67.
Jones, M., Berwick, J., Johnston, D., and Mayhew, J. (2001). Concurrent optical imaging spectroscopy and laser-Doppler flowmetry: the relationship between blood flow, oxygenation, and volume in rodent barrel cortex. Neuroimage 13, 1002–1015.
Kennan, R. P., Scanley, B. E., Innis, R. B., and Gore, J. C. (1998). Physiological basis for BOLD MR signal changes due to neuronal stimulation: separation of blood volume and magnetic susceptibility effects. Magn. Reson. Med. 40, 840–846.
Kennan, R. P., Zhong, J., and Gore, J. C. (1994). Intravascular susceptibility contrast mechanisms in tissues. Magn. Reson. Med. 31, 9–21.
Kida, I., and Hyder, F. (2006). Physiology of functional magnetic resonance imaging: energetics and function. Methods Mol. Med. 124, 175–195.
Kida, I., Hyder, F., Kennan, R. P., and Behar, K. L. (1999). Toward absolute quantitation of bold functional MRI. Adv. Exp. Med. Biol. 471, 681–689.
Kida, I., Kennan, R. P., Rothman, D. L., Behar, K. L., and Hyder, F. (2000). High-resolution CMR(O2) mapping in rat cortex: a multiparametric approach to calibration of BOLD image contrast at 7 Tesla. J. Cereb. Blood Flow Metab. 20, 847–860.
Kida, I., Maciejewski, P. K., and Hyder, F. (2004). Dynamic imaging of perfusion and oxygenation by functional magnetic resonance imaging. J. Cereb. Blood Flow Metab. 24, 1369–1381.
Kida, I., Rothman, D. L., and Hyder, F. (2007). Dynamics of changes in blood flow, volume, and oxygenation: implications for dynamic functional magnetic resonance imaging calibration. J. Cereb. Blood Flow Metab. 27, 690–696.
Kida, I., Smith, A. J., Blumenfeld, H., Behar, K. L., and Hyder, F. (2006). Lamotrigine suppresses neurophysiological responses to somatosensory stimulation in the rodent. Neuroimage 29, 216–224.
Kim, D. S., Duong, T. Q., and Kim, S. G. (2000). High-resolution mapping of iso-orientation columns by fMRI. Nat. Neurosci. 3, 164–169.
Kim, S. G., Rostrup, E., Larsson, H. B., Ogawa, S., and Paulson, O. B. (1999). Determination of relative CMRO2 from CBF and BOLD changes: significant increase of oxygen consumption rate during visual stimulation. Magn. Reson. Med. 41, 1152–1161.
Kim, T., Hendrich, K. S., Masamoto, K., and Kim, S. G. (2007). Arterial versus total blood volume changes during neural activity-induced cerebral blood flow change: implication for BOLD fMRI. J. Cereb. Blood Flow Metab. 27, 1235–1247.
Kim, T., and Kim, S. G. (2005). Quantification of cerebral arterial blood volume and cerebral blood flow using MRI with modulation of tissue and vessel (MOTIVE) signals. Magn. Reson. Med. 54, 333–342.
Leontiev, O., Dubowitz, D. J., and Buxton, R. B. (2007). CBF/CMRO2 coupling measured with calibrated BOLD fMRI: sources of bias. Neuroimage 36, 1110–1122.
Lindauer, U., Royl, G., Leithner, C., Kuhl, M., Gold, L., Gethmann, J., Kohl-Bareis, M., Villringer, A., and Dirnagl, U. (2001). No evidence for early decrease in blood oxygenation in rat whisker cortex in response to functional activation. Neuroimage 13, 988–1001.
Logothetis, N. K., Pauls, J., Augath, M., Trinath, T., and Oeltermann, A. (2001). Neurophysiological investigation of the basis of the fMRI signal. Nature 412, 150–157.
Lu, H., Soltysik, D. A., Ward, B. D., and Hyde, J. S. (2005). Temporal evolution of the CBV-fMRI signal to rat whisker stimulation of variable duration and intensity: a linearity analysis. Neuroimage 26, 432–440.
Maandag, N. J., Coman, D., Sanganahalli, B. G., Herman, P., Smith, A. J., Blumenfeld, H., Shulman, R. G., and Hyder, F. (2007). Energetics of neuronal signaling and fMRI activity. Proc. Natl. Acad. Sci. U.S.A. 104, 20546–20551.
Madsen, M. (1992). A simplified formulation of the gamma variate function. Phys. Med. Biol. 37, 1597–1600.
Malonek, D., and Grinvald, A. (1996). Interactions between electrical activity and cortical microcirculation revealed by imaging spectroscopy: implications for functional brain mapping. Science 272, 551–554.
Mandeville, J. B., Marota, J. J., Kosofsky, B. E., Keltner, J. R., Weissleder, R., Rosen, B. R., and Weisskoff, R. M. (1998). Dynamic functional imaging of relative cerebral blood volume during rat forepaw stimulation. Magn. Reson. Med. 39, 615–624.
Martin, C., Martindale, J., Berwick, J., and Mayhew, J. (2006). Investigating neural-hemodynamic coupling and the hemodynamic response function in the awake rat. Neuroimage 32, 33–48.
Martindale, J., Mayhew, J., Berwick, J., Jones, M., Martin, C., Johnston, D., Redgrave, P., and Zheng, Y. (2003). The hemodynamic impulse response to a single neural event. J. Cereb. Blood Flow Metab. 23, 546–555.
Mathiesen, C., Caesar, K., and Lauritzen, M. (2000). Temporal coupling between neuronal activity and blood flow in rat cerebellar cortex as indicated by field potential analysis. J. Physiol. (Lond.) 523(Pt 1), 235–246.
Matsuura, T., and Kanno, I. (2001). Quantitative and temporal relationship between local cerebral blood flow and neuronal activation induced by somatosensory stimulation in rats. Neurosci. Res. 40, 281–290.
Matthews, P. M., Honey, G. D., and Bullmore, E. T. (2006). Applications of fMRI in translational medicine and clinical practice. Nat. Rev. Neurosci. 7, 732–744.
Menon, R. S., Ogawa, S., Hu, X., Strupp, J. P., Anderson, P., and Ugurbil, K. (1995). BOLD based functional MRI at 4 Tesla includes a capillary bed contribution: echo-planar imaging correlates with previous optical imaging using intrinsic signals. Magn. Reson. Med. 33, 453–459.
Nemoto, M., Sheth, S., Guiou, M., Pouratian, N., Chen, J. W., and Toga, A. W. (2004). Functional signal- and paradigm-dependent linear relationships between synaptic activity and hemodynamic responses in rat somatosensory cortex. J. Neurosci. 24, 3850–3861.
Ogawa, S., Menon, R. S., Tank, D. W., Kim, S. G., Merkle, H., Ellermann, J. M., and Ugurbil, K. (1993). Functional brain mapping by blood oxygenation level-dependent contrast magnetic resonance imaging. A comparison of signal characteristics with a biophysical model. Biophys. J. 64, 803–812.
Paulson, O. B., Hasselbalch, S. G., Rostrup, E., Knudsen, G. M., and Pelligrino, D. (2010). Cerebral blood flow response to functional activation. J. Cereb. Blood Flow Metab. 30, 2–14.
Pries, A. R., Ley, K., and Gaehtgens, P. (1986). Generalization of the Fahraeus principle for microvessel networks. Am. J. Physiol. 251, H1324–H1332.
Restom, K., Perthen, J. E., and Liu, T. T. (2008). Calibrated fMRI in the medial temporal lobe during a memory-encoding task. Neuroimage 40, 1495–1502.
Riera, J. J., Schousboe, A., Waagepetersen, H. S., Howarth, C., and Hyder, F. (2008). The microarchitecture of the cerebral cortex: functional neuroimaging models and metabolism. Neuroimage 40, 1436–1459.
Sanganahalli, B. G., Herman, P., Blumenfeld, H., and Hyder, F. (2009). Oxidative neuroenergetics in event-related paradigms. J. Neurosci. 29, 1707–1718.
Sanganahalli, B. G., Herman, P., and Hyder, F. (2008). Frequency-dependent tactile responses in rat brain measured by functional MRI. NMR. Biomed. 21, 410–416.
Schridde, U., Khubchandani, M., Motelow, J. E., Sanganahalli, B. G., Hyder, F., and Blumenfeld, H. (2008). Negative BOLD with large increases in neuronal activity. Cereb. Cortex 18, 1814–1827.
Shen, Q., Ren, H., and Duong, T. Q. (2008). CBF, BOLD, CBV, and CMRO2 fMRI signal temporal dynamics at 500-msec resolution. J. Magn. Reson. Imaging 27, 599–606.
Sheth, S., Nemoto, M., Guiou, M., Walker, M., Pouratian, N., and Toga, A. W. (2003). Evaluation of coupling between optical intrinsic signals and neuronal activity in rat somatosensory cortex. Neuroimage 19, 884–894.
Sheth, S. A., Nemoto, M., Guiou, M., Walker, M., Pouratian, N., and Toga, A. W. (2004). Linear and nonlinear relationships between neuronal activity, oxygen metabolism, and hemodynamic responses. Neuron 42, 347–355.
Shulman, R. G., Hyder, F., and Rothman, D. L. (2002). Biophysical basis of brain activity: implications for neuroimaging. Q. Rev. Biophys. 35, 287–325.
Shulman, R. G., Rothman, D. L., Behar, K. L., and Hyder, F. (2004). Energetic basis of brain activity: implications for neuroimaging. Trends Neurosci. 27, 489–495.
Silva, A. C., and Kim, S. G. (1999). Pseudo-continuous arterial spin labeling technique for measuring CBF dynamics with high temporal resolution. Magn. Reson. Med. 42, 425–429.
Silva, A. C., Koretsky, A. P., and Duyn, J. H. (2007). Functional MRI impulse response for BOLD and CBV contrast in rat somatosensory cortex. Magn. Reson. Med. 57, 1110–1118.
Silva, A. C., Lee, S. P., Iadecola, C., and Kim, S. G. (2000). Early temporal characteristics of cerebral blood flow and deoxyhemoglobin changes during somatosensory stimulation. J. Cereb. Blood Flow Metab. 20, 201–206.
Smith, A. J., Blumenfeld, H., Behar, K. L., Rothman, D. L., Shulman, R. G., and Hyder, F. (2002). Cerebral energetics and spiking frequency: the neurophysiological basis of fMRI. Proc. Natl. Acad. Sci. U.S.A. 99, 10765–10770.
Stefanovic, B., and Pike, G. B. (2005). Venous refocusing for volume estimation: VERVE functional magnetic resonance imaging. Magn. Reson. Med. 53, 339–347.
Thompson, J. K., Peterson, M. R., and Freeman, R. D. (2003). Single-neuron activity and tissue oxygenation in the cerebral cortex. Science 299, 1070–1072.
Trubel, H. K., Sacolick, L. I., and Hyder, F. (2006). Regional temperature changes in the brain during somatosensory stimulation. J. Cereb. Blood Flow Metab. 26, 68–78.
Ugurbil, K., Adriany, G., Andersen, P., Chen, W., Gruetter, R., Hu, X., Merkle, H., Kim, D. S., Kim, S. G., Strupp, J., Zhu, X. H., and Ogawa, S. (2000). Magnetic resonance studies of brain function and neurochemistry. Annu. Rev. Biomed. Eng. 2, 633–660.
Uludag, K., Dubowitz, D. J., Yoder, E. J., Restom, K., Liu, T. T., and Buxton, R. B. (2004). Coupling of cerebral blood flow and oxygen consumption during physiological activation and deactivation measured with fMRI. Neuroimage 23, 148–155.
Ureshi, M., Matsuura, T., and Kanno, I. (2004). Stimulus frequency dependence of the linear relationship between local cerebral blood flow and field potential evoked by activation of rat somatosensory cortex. Neurosci. Res. 48, 147–153.
Van Camp, N., Verhoye, M., and Van der Linden, A. (2006). Stimulation of the rat somatosensory cortex at different frequencies and pulse widths. NMR. Biomed. 19, 10–17.
Vazquez, A. L., and Noll, D. C. (1998). Nonlinear aspects of the BOLD response in functional MRI. Neuroimage 7, 108–118.
Weisskoff, R. M., Zuo, C. S., Boxerman, J. L., and Rosen, B. R. (1994). Microscopic susceptibility variation and transverse relaxation: theory and experiment. Magn. Reson. Med. 31, 601–610.
Williams, D. S., Detre, J. A., Leigh, J. S., and Koretsky, A. P. (1992). Magnetic resonance imaging of perfusion using spin inversion of arterial water. Proc. Natl. Acad. Sci. U.S.A. 89, 212–216.
Keywords: glia, glucose, glutamate, mitochondria, neuron, oxygen transport
Citation: Hyder F, Sanganahalli BG, Herman P, Coman D, Maandag NJG, Behar KL, Blumenfeld H and Rothman DL (2010) Neurovascular and neurometabolic couplings in dynamic calibrated fMRI: transient oxidative neuroenergetics for block-design and event-related paradigms. Front. Neuroenerg. 2:18. doi: 10.3389/fnene.2010.00018
Received: 04 March 2010;
Paper pending published: 19 April 2010;
Accepted: 02 July 2010;
Published online: 19 August 2010
Edited by:
David Boas, Massachusetts General Hospital, USA; Massachusetts Institute of Technology, USA; Harvard Medical School, USAReviewed by:
Richard Buxton, University of California San Diego, USAAlberto L. Vazquez, University of Pittsburgh, USA
Copyright: © 2010 Hyder, Sanganahalli, Herman, Coman, Maandag, Behar, Blumenfeld and Rothman. This is an open-access article subject to an exclusive license agreement between the authors and the Frontiers Research Foundation, which permits unrestricted use, distribution, and reproduction in any medium, provided the original authors and source are credited.
*Correspondence: D. S. Fahmeed Hyder, N143 TAC (Magnetic Resonance Research Center), 300 Cedar Street, Yale University, New Haven, CT 06520, USA. e-mail:ZmFobWVlZC5oeWRlckB5YWxlLmVkdQ==