


- 1 Department of Biomedical Engineering, University of Minnesota, Minneapolis, MN, USA
- 2 Department of Physiology and Biophysics, University of Miami, Miami, FL, USA
We review the use of optical coherence tomography (OCT) for detection of neural activity, and present a new approach for depth-localization of neural action potentials (APs) using voltage-sensitive dyes as contrast agents in OCT. A stained squid giant axon is imaged by spectral-domain OCT. Changes in the intensity and phase of back-scattered light coming from regions around the membrane are measured during AP propagation. The depth-resolved change in back-scattered intensity coincides with the arrival of AP at the measurement area, and is synchronous with the changes in transmitted light intensity and reflection-mode cross-polarized light intensity measured independently. The system also provides depth-resolved phase changes as an additional indication of activity. With further investigation our results could open a new era in functional imaging technology to localize neural activity at different depths in situ.
Introduction
Indications of neural activity are usually classified in “slow” and “fast” categories. The slow signals occur in a few seconds to minutes, and, as e.g., hemodynamic response probed by functional magnetic resonance imaging, they represent indirect measurements of neural activity. On the other hand, the fast signals occur in the millisecond timescale and are directly correlated to changes in membrane potential. Electrical measurements of membrane potential using external or internal electrodes are studied widely for neural activity, but the use of electrodes in many applications is not feasible, and its invasive nature can easily induce irreversible damage to nerve fibers. Besides, spatial resolution of the external electrical measurements is typically low. As the development of new methods that directly assess neural activity becomes a pressing need, a variety of optical techniques and contrasts are being investigated for imaging neural structure and function with high spatial and temporal resolutions.
The use of optical instrumentation to study neural activity dates to late 1940s. During action potential (AP) propagation in neural tissue light scattering, absorption, birefringence, fluorescence, and volume changes have been reported (Cohen, 1973). Imaging with voltage-sensitive dyes has become an important part of neuroscience for observing membrane potential in single and multiple neurons (Homma et al., 2009). However, the techniques have not produced information to locate the APs at different depths. Development of new techniques and improvement of current approaches are essential to obtain a useful test for neural function. For instance, imaging the activity with optical slices rather than in physical slices (e.g., brain slices) would be a major advancement in functional assessment of neural tissue.
Optical coherence tomography (OCT) is a non-invasive technique that uses reflected/back-scattered light to construct depth-resolved images of tissue. Recent OCT based techniques have potential to study AP related minute changes at different depths. The techniques have the additional advantage of being less invasive than many other measurements, because they work in reflection geometry, which means the source and detector are on the same side of the nerve. Here, we review the related work in this area, and present new data for depth-localization of neural activity in squid giant axons (SGA) stained with a voltage-sensitive near-infrared dye. Real-time cross-sectional images of a spectral-domain OCT (SD-OCT) system were used to select center portion of the SGA for functional interrogation. By monitoring the same depth profile over time, we acquired M-mode SD-OCT images while electrical current stimulus pulses were applied to the axon to initiate propagated APs. Analysis of the intensity and phase of the interferometric signal showed local changes on a millisecond time scale. The results are also compared with the changes in transmitted light intensity, reflection-mode cross-polarized light intensity and electrical APs, which are recorded simultaneously with the SD-OCT signal. Since the dye approach is known to be extremely fast and linear, our technique may be developed as a depth-resolved optical voltmeter measuring local changes in membrane potential.
Materials and Methods
Optical Coherence Tomography
Optical coherence tomography is a depth-resolved, high-resolution, non-invasive technique that employs low-coherence interferometry to image biological tissue up to a depth of a few millimeters. It is similar to ultrasound imaging except that reflected/back-scattered near-infrared light is used rather than acoustic waves. Figure 1 illustrates a basic fiber-based OCT system in time and spectral domains. The systems can be implemented in bulk optical setups or with single mode fibers. Light from a broadband source such as a superluminescent diode or mode-lock Ti:Sapphire laser is typically split into the reference and sample arms. Interference of light returning from these arms to the fiber coupler (or beamsplitter) produces the axial information. Time-domain OCT (Huang et al., 1991) utilizes both axial (A-line) and lateral (B-line) scanners to construct cross-sectional images from amplitude of the photo-detector signal. At a given time, the photo-detector signal represents a single depth location when the optical path length of the reference arm matches that of the location within the sample. Thus, this method may have limited use for detecting neural activity.
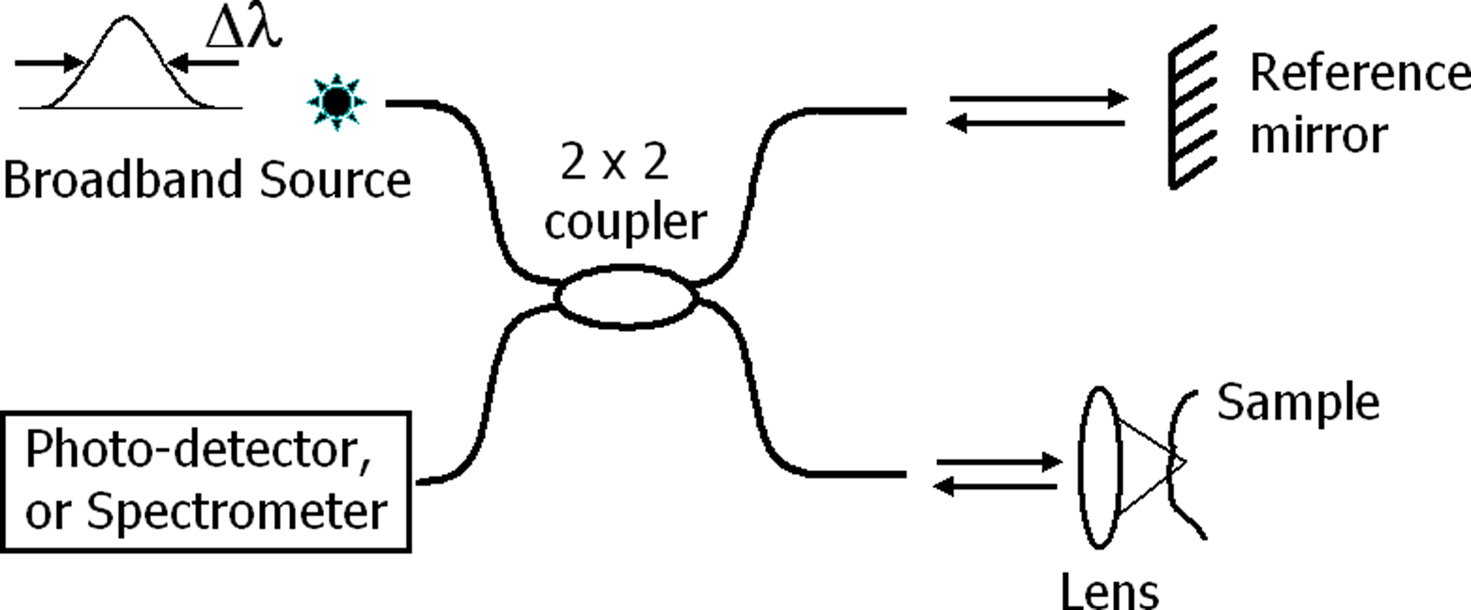
Figure 1. Generic system for optical coherence tomography (OCT). In time-domain OCT, a photo-detector detects interferometric fringes while the reference mirror is scanned in axial direction. In spectral-domain OCT, the reference mirror is stationary, and a spectrometer records the modulations on the optical spectrum due to interference, which is then used in calculation of the axial information for all depth points, simultaneously.
The axial resolution Δz (∼2–20 μm) of the OCT systems is determined by the center wavelength λ0 and spectral bandwidth Δλ of the light source. For a Gaussian spectrum, Δz is given by  . High axial resolution requires a short temporal coherence provided by broad bandwidth light sources. The lateral resolution Δx, on the other hand, is determined by sample path optics that focuses the beam on the sample, and given by Δx = 4λf/πd, where d is the spot size on the lens with the focal length f. High lateral resolution requires a lens with high numerical aperture (NA), and correspondingly a small beam spot at the focus.
Unlike in time-domain OCT, the reference mirror of the Michelson interferometer is not scanned in SD-OCT (also known as Fourier-domain OCT). Instead, SD-OCT uses a spectrometer to record interference of back-scattered light from all depth points simultaneously (Fercher et al., 1995). Then, a Fourier transform algorithm relates the spectral modulations in k-space to information along the axial direction. This allows imaging a depth profile (A-line) in ∼10–50 μs (integration time of the spectrometer); thus, provides adequate temporal resolution for the fast signals of neural activity for a full depth profile. To show the operation of SD-OCT, a reflector was placed in the sample arm. Interference between the reference and sample light resulted in modulations on the optical spectrum (Figure 2A). After spectral shaping, which is not required, the Fourier transform algorithm produced the spatial information along an A-line. Figure 2B shows the magnitude of the signal in linear scale. The peak at 220 μm is the envelope of the coherence function and corresponds to the reflection from the sample surface. The width of the coherence function determines the axial resolution. By scanning the beam over a sample, SD-OCT produces real-time images, which helps selecting a particular region of neural tissue for functional study.
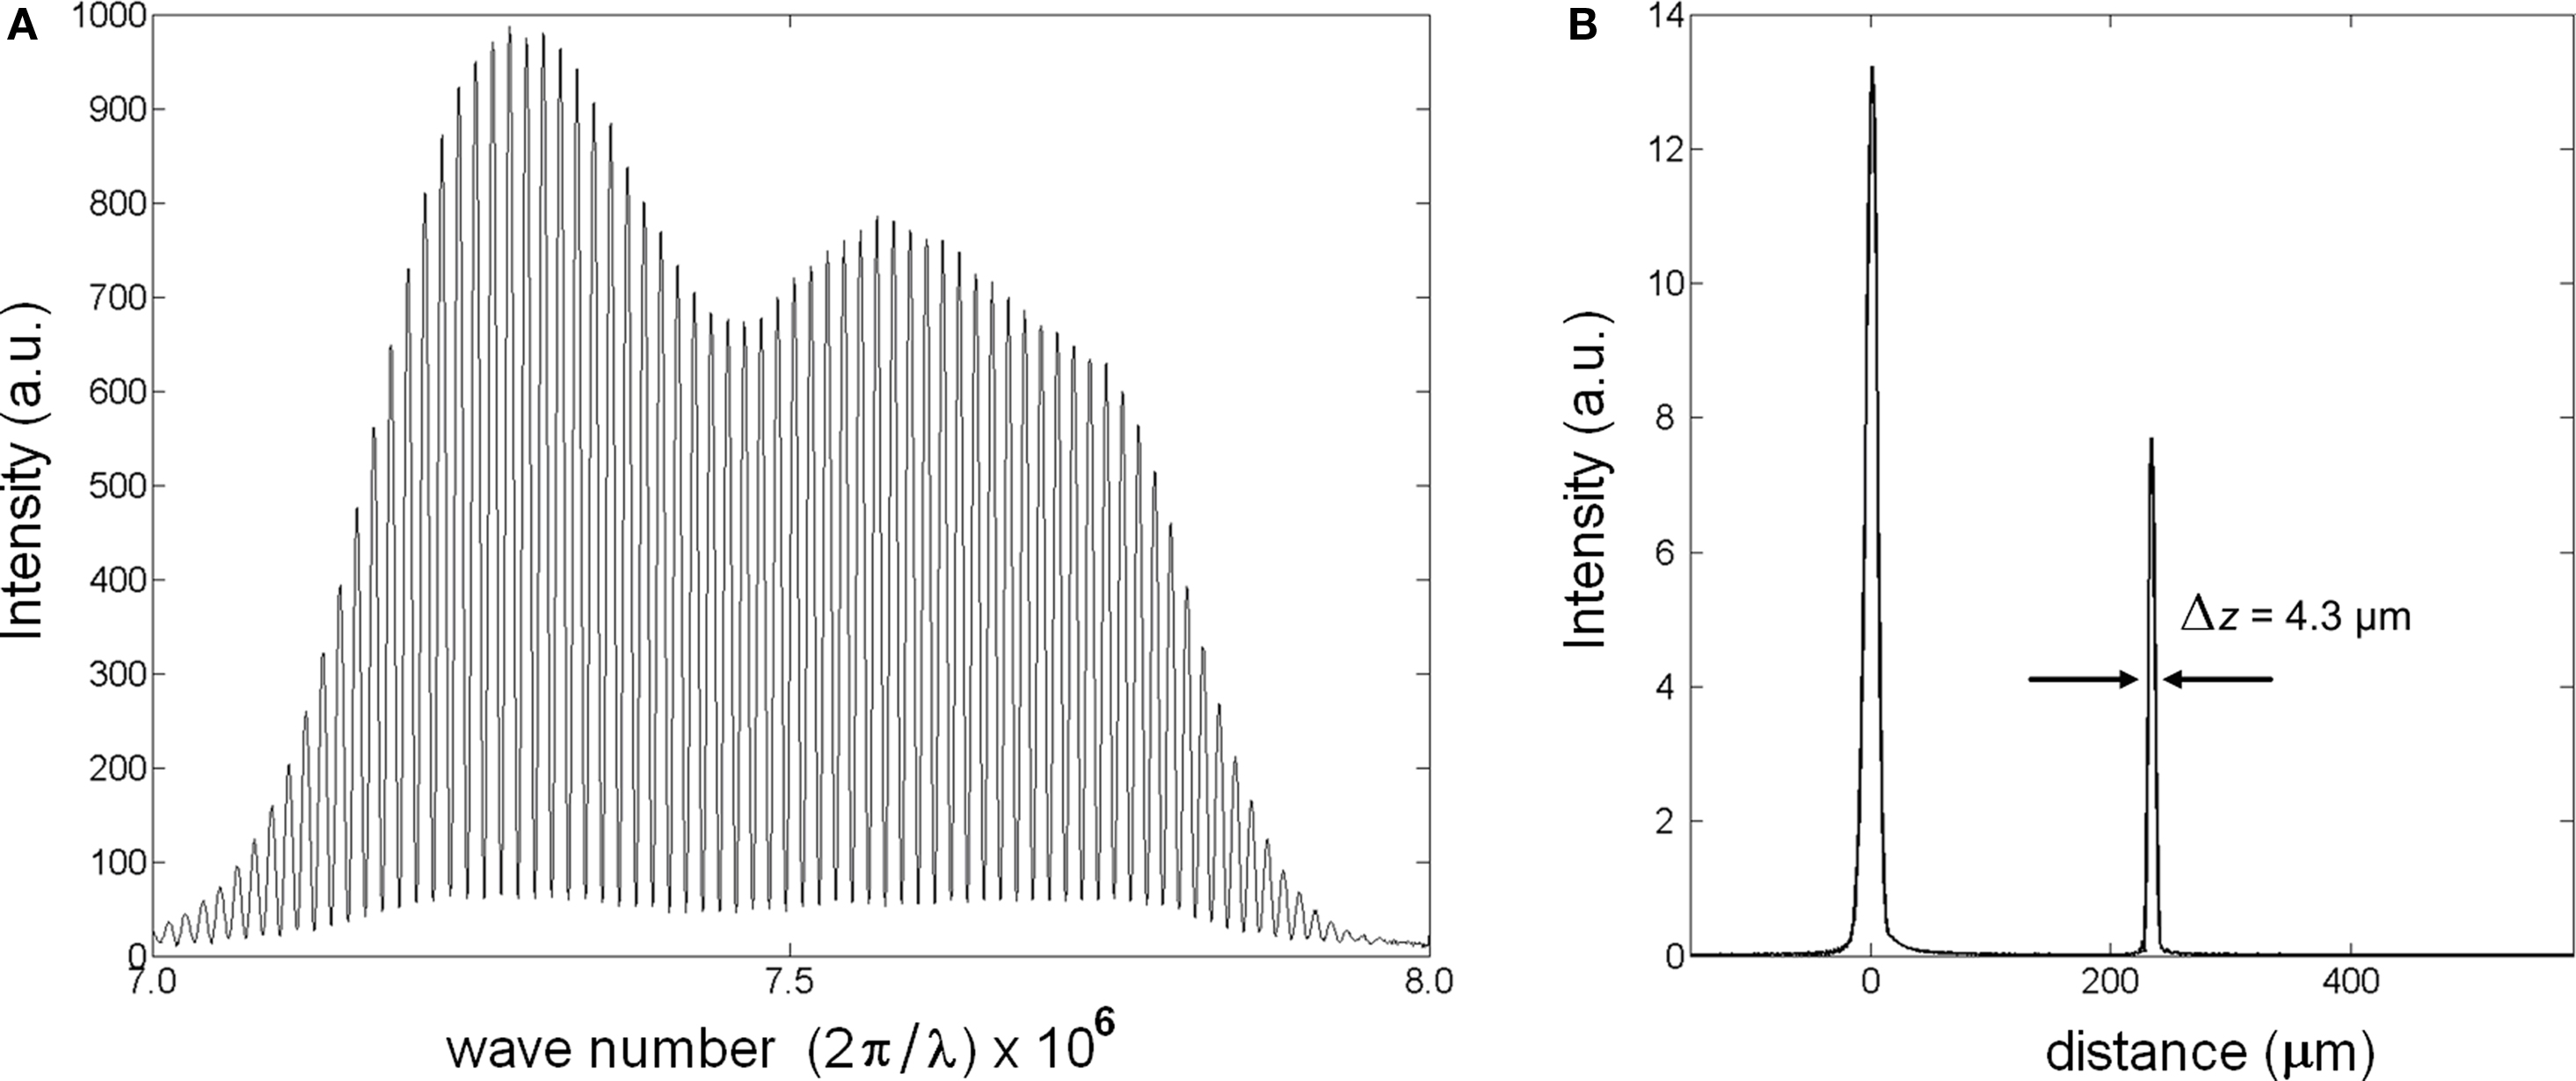
Figure 2. Description of SD-OCT measurement. (A) Strong modulation on optical spectrum (λ = 835 nm; Δλ = 75 nm) is due to a reflective surface in the sample arm. (B) The peak at 0 is a Fourier transform of the source spectrum, the peak at 220 μm is the reflector causing modulations on the spectrum.
There are various types of OCT that use intensity, phase or polarization properties of light for imaging microstructure, blood flow, or birefringence properties of tissues. The readers are referred to review articles (e.g., Fercher et al., 2003) or books (e.g., Drexler and Fujimoto, 2008) for detailed description of the concepts and principles.
Phase-Sensitive Optical Coherence Tomography
Coherence functions consist of interferometric fringes. Let us consider a time-domain system. For low coherent light sources with Gaussian spectral density, the interference term I can be described by a Gaussian envelope and sinusoidal fringes as

where τ is the temporal delay between light in sample and reference paths, a = (ln2)1/2/Δω and Δω is angular optical frequency width of the source, f is the frequency of fringes that is determined by the scanner or a modulator in the reference arm, φ is the phase carrying physically relevant information about a sample, and φN is the phase noise in the interferometer due to environmental perturbations. For a reliable phase measurement, phase noise should be cancelled by a common-mode phase noise rejection scheme. This can be achieved by a common path interferometric setup or a differential phase operation provided by dual channel interferometers. In the latter approach noise φN is cancelled by computing phase difference between two channels/points, Δφ = φ1 − φ2. Δφ is proportional to the optical path length difference (Δp) between the observation points, Δp = (λ0/4π)Δφ. As a result, the Δp measurement yields sub-wavelength sensitivity, which is useful to monitor minute changes in refractive index or geometrical size of samples. This approach has been utilized for detecting AP related minute changes from a single point in crustacean nerve (Akkin et al., 2004; Fang-Yen et al., 2004).
The phase information is readily available in SD-OCT, as well (Choma et al., 2005; Joo et al., 2005). By using the phase of the complex valued depth profile, which is obtained by a discrete Fourier transform algorithm, changes in optical path length can be quantified for a full depth profile simultaneously. SD-OCT can reject the phase noise by common path implementations that doesn’t utilize a separate reference arm or by measuring phase difference between two depth locations. The latter was used to report Δp response due to AP propagation in crustacean nerve (Akkin et al., 2007) and SGA (Akkin et al., 2009). Using a fiber-based SD-OCT, we recorded interference between the front and back surfaces of a fixed glass slide for 1 s with a temporal resolution of 34.l μs. The standard deviation of the phase measurement (∼0.75 mrad) suggested about 50 pm noise for Δp measurements. Signal-to-noise ratio degradation in biological tissue and motion artifacts may worsen the sensitivity; nevertheless, SD-OCT has the time resolution and sensitivity to study the transient changes related to AP propagation at all points along a depth profile. Furthermore, development of single-shot two-dimensional techniques at high imaging speeds (Witte et al., 2009) is promising for functional investigation of neural tissue in cross-sectional optical slices.
Previous Work on Detecting Neural Activity Using OCT Techniques
Intensity Measurements
Time-domain OCT can be applied to detect slow changes in reflectivity/back-scattering during neural activity. OCT was used to detect visually evoked cortical functions of a cat brain in vivo (Maheswari et al., 2002, 2003; Rajagopalan and Tanifuji, 2007). Neural activity related local reflectivity changes occurring in a small volume revealed that the optical response was about 1 s or more after the onset of visual stimulus, and lasted for duration of a few seconds (Maheswari et al., 2003). In another study, time-domain OCT reflectance measurements from rat somatosensory cortex during forepaw electrical stimulation showed a functional signal with a time course corresponding to the hemodynamic signal (Aguirre et al., 2006; Chen et al., 2009). Time-domain OCT was also used to report a scattering increase from nerve fibers from abdominal ganglion of sea slug, which was repetitively stimulated over several minutes (Lazebnik et al., 2003). Using the same model, scattering intensity from single neurons was recorded by SD-OCT (Graf et al., 2009).
The most developed medical application of OCT is imaging the anatomy of retinal layers in real-time at micron scale resolution. Since visible light activates retina and induces changes related to the physiology and circuitry of the retina, OCT with its near-infrared beam has potentials for detecting layer-specific retinal activity. Isolated frog retina was used to demonstrate OCT measurement of light-activated near-infrared scattering changes in photoreceptor and ganglion layers (Yao et al., 2005). Then, light-activated reflectivity changes in isolated rabbit retina were observed in the inner/outer segments of the photoreceptor layer and the plexiform layers using time-domain OCT (Bizheva et al., 2006). By using SD-OCT, reflectivity measurements demonstrated non-invasive functional imaging of rat retina in vivo (Srinivasan et al., 2006).
Phase Measurements
Conventional time-domain OCT is insensitive to fast (millisecond) and small (nanometer) changes due to AP propagation. On the other hand, differential phase implementations of the technique can probe a single nerve location in depth and a reference surface nearby at the same time with microsecond temporal resolution and sub-nanometer optical path length resolution. Using a phase-sensitive optical low-coherence reflectometer, depth-resolved surface and subsurface changes from nerve bundles dissected from crayfish claw was recorded during AP propagation (Akkin et al., 2004). The measured Δp response was about 1 nm in amplitude, 1 ms in duration and occurred at about the AP arrival time to the optical measurement site. Initial direction of the Δp response was either an increase or a decrease. This may be supported by contact-mode measurements reporting a contraction followed by a slow swelling for a crayfish giant axon (Hill et al., 1977), and swelling followed by contraction for squid giant axon (Iwasa and Tasaki, 1980) due to AP propagation. Using a different differential phase interferometer probing a lobster nerve surface, swelling of about 5 nm in about 10 ms duration was reported (Fang-Yen et al., 2004). SD-OCT was also demonstrated to be able to measure these changes from lobster and crayfish nerve preparations, which showed 0.5–2.5 nm Δp responses within the nerves (Akkin et al., 2007).
More recent SD-OCT phase measurements showed details of the transient changes on SGA during activity (Akkin et al., 2009). Experiments were performed at room and cold temperatures, and in hypertonic solutions to analyze transformation and amplification of the optical (Δp) response. To demonstrate how well the Δp response matches with the electrical AP, and to describe the measurements better, here we present Figures 3 and 4. After real-time SD-OCT imaging of axonal cross-sections in a nerve chamber, axonal surfaces as well as a reference glass above the axon were monitored during AP propagations initiated by electrical current pulses. Figure 3 illustrates the depth profile probed in this experiment, and the Δp responses of many points chosen from the top and bottom surfaces of the axon. The glass surface was used for differential phase measurement to cancel the noise on the signals acquired from a level in the top (Figure 3B) or bottom (Figure 3C) surfaces of the axon, and not needed for the Δp response (Figure 4A) between the top and bottom surfaces of the axon. In Figure 3, an upward change in Δp indicates a decrease, and a downward change indicates an increase in optical path length between a surface and the reference glass. In Figure 4A, an upward change in Δp indicates an increase in optical path length between the top and bottom surfaces of the axon, and a downward change represents a decrease. These figures also show repeatability of the response as a train of three pulses were applied as shown together with the corresponding AP recording in Figure 4B. The arrival of each AP to the optical recording area is approximately at the zero-crossings of the electrical signal (9.5, 19.5, and 29.5 ms). Each trace in Figures 3 and 4 is an average of 250 records and has 5 kHz bandwidth. The shape and timing of the AP related responses were similar for those points located on the same surface. Clearly, the signal-to-noise ratio was better for the points having higher amplitudes, which are plotted and labeled in the insets of Figure 3A. Dots in the insets are about 1.1 μm apart.
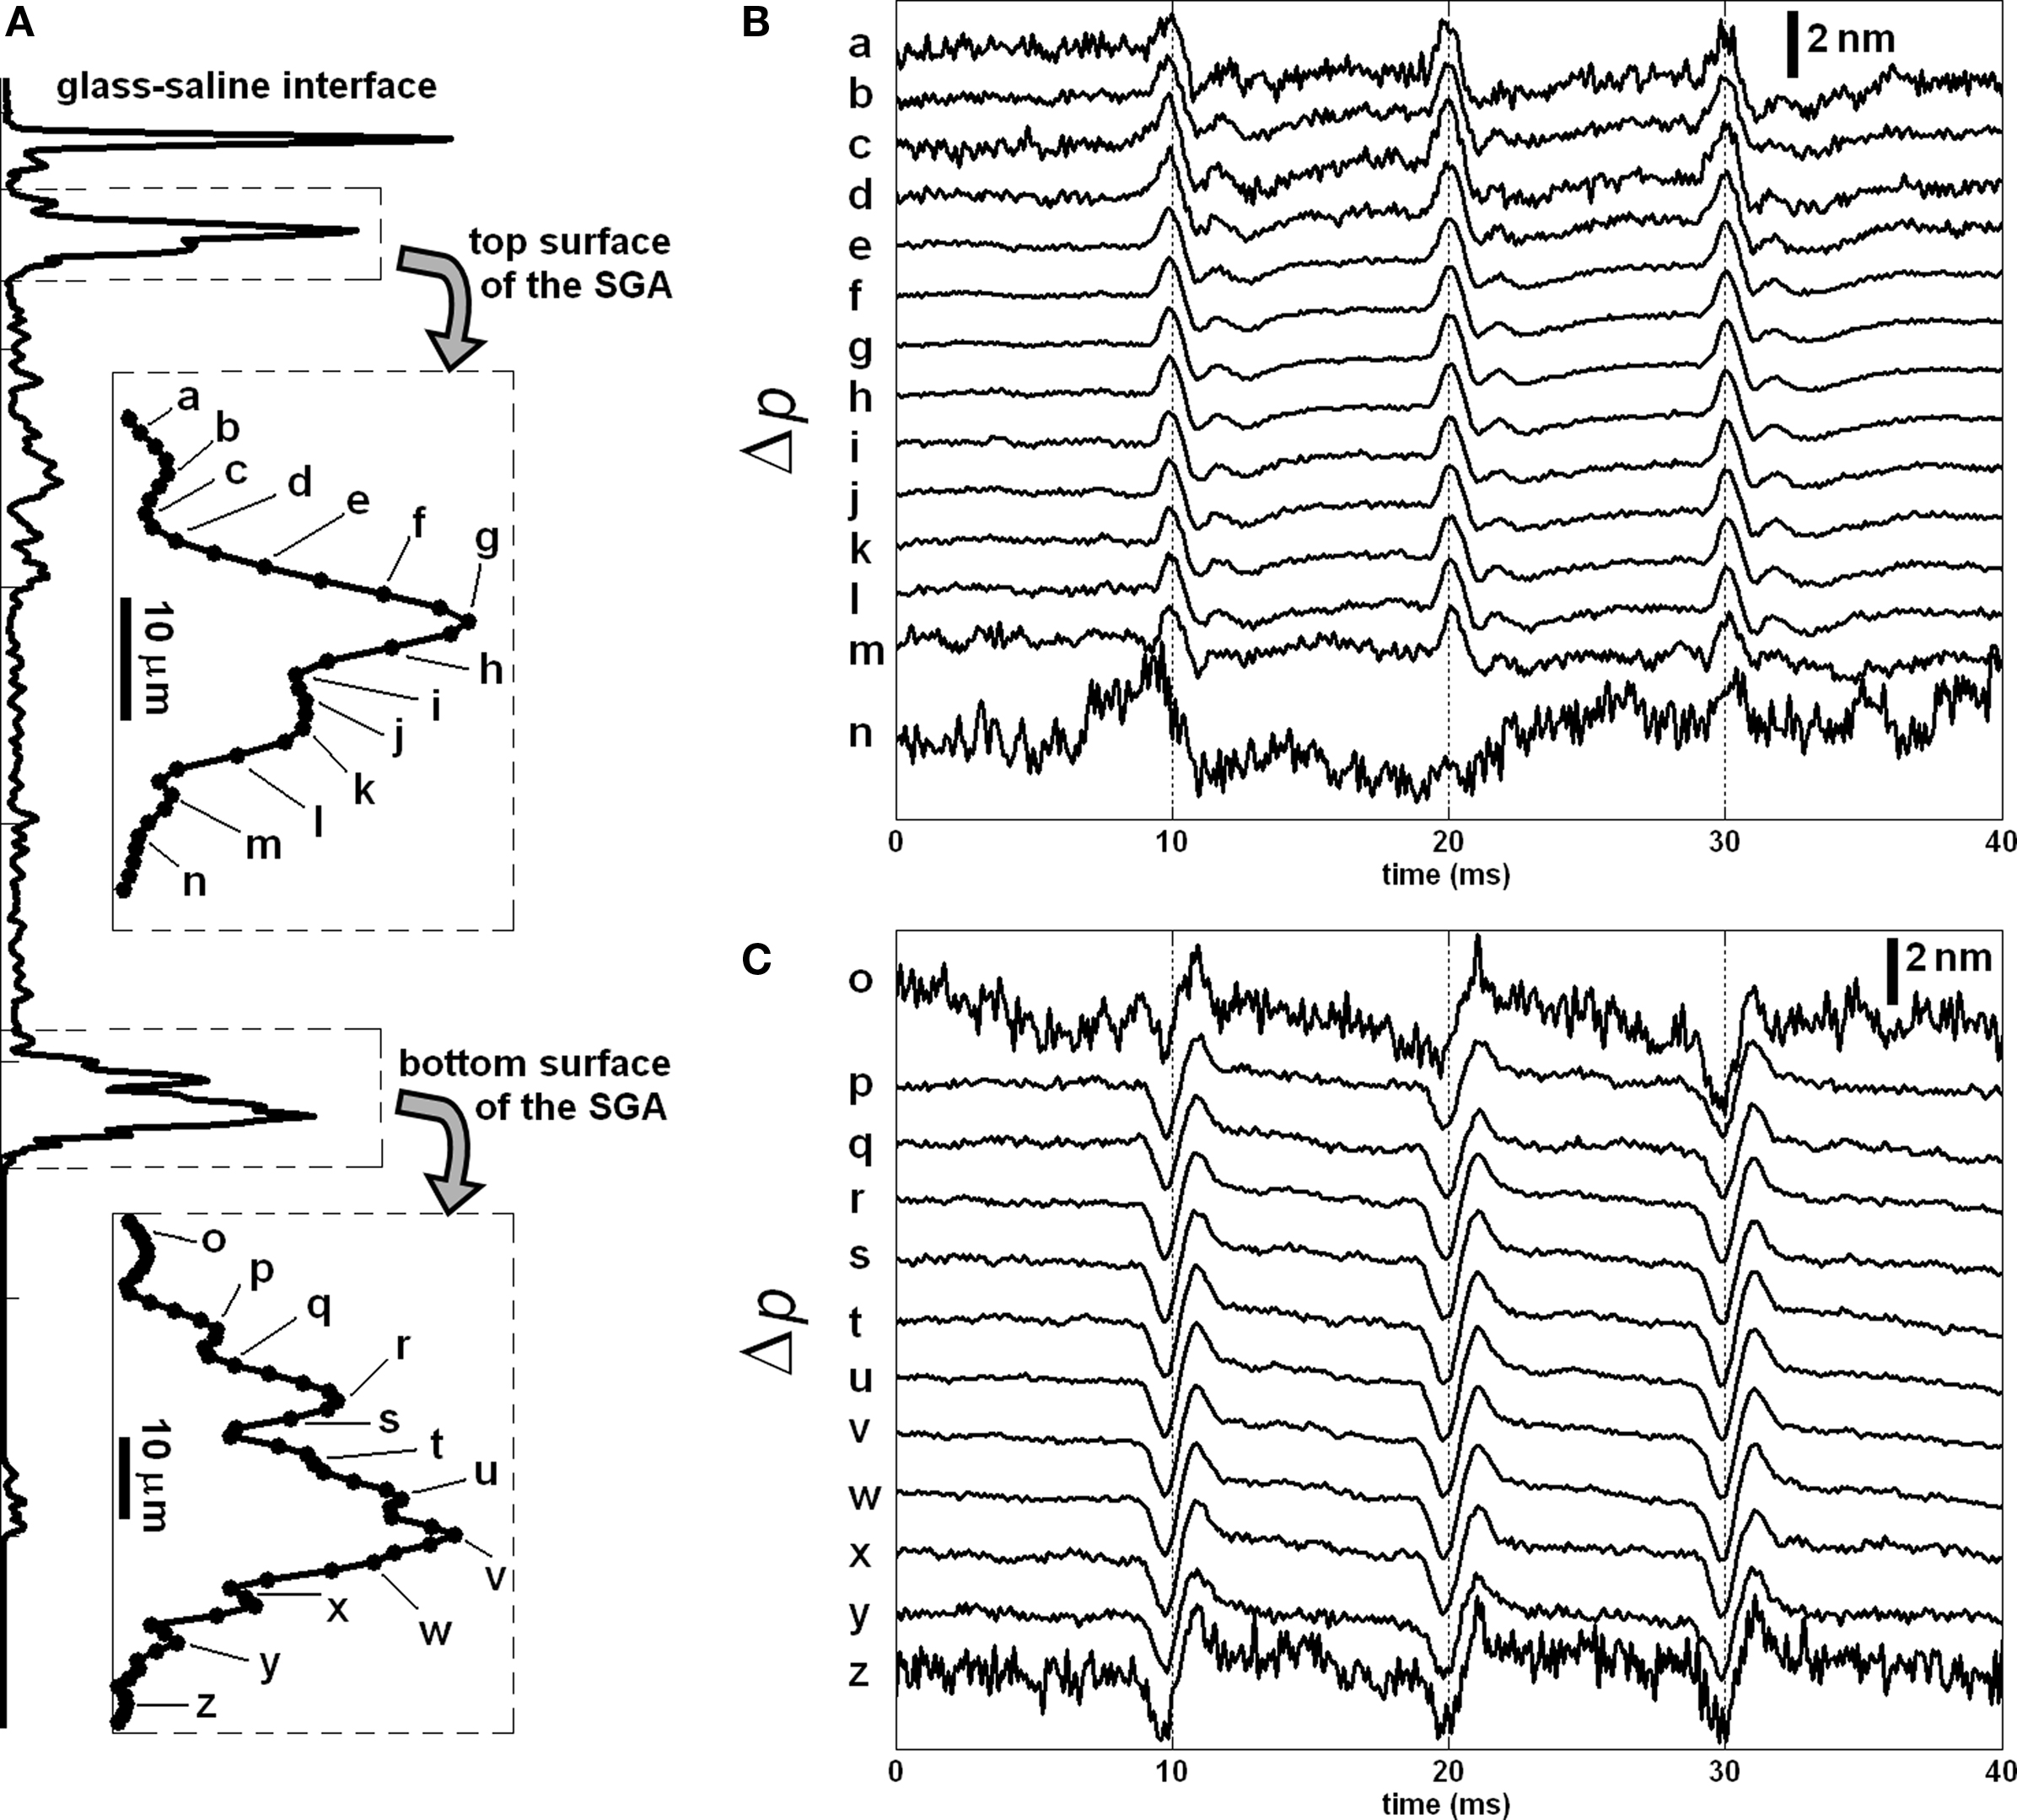
Figure 3. Depth profile of a squid giant axon probed by the SD-OCT (A); the insets show the labels of points, whose responses are given in (B,C), and in Figures 4 and 5. Δp traces in (B,C) are recorded from top and bottom surfaces of the axon with respect to the reference glass, respectively. Each trace in (B,C) is an average of 250 responses, and has 5 kHz bandwidth. Diameter of the axon was 410 μm. Saline solution was cold seawater (temperature: 2°C). The timing of the electrical stimulation and electrical AP recording is given in Figure 4B.
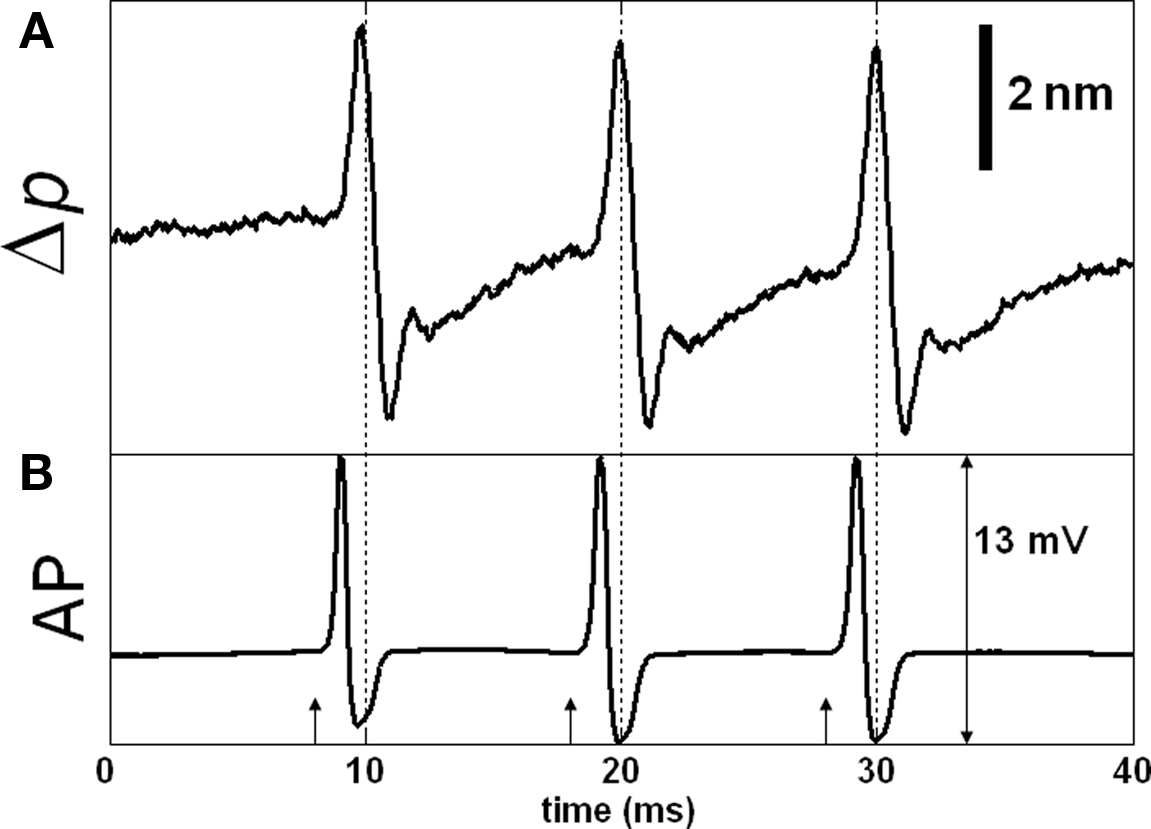
Figure 4. SD-OCT measurement of action potential (AP) related path length change (Δp). Δp trace in (A) is measured between the top and bottom surfaces of the axon (points g and v) and is equivalent to subtraction of the corresponding Δp traces in Figure 3. The optical response is relatively large compared to most of our results. (B) Shows the externally and differentially recorded AP; arrows indicate stimuli (500 μA, 50 μs). Each trace is an average of 250 responses, and has 5 kHz bandwidth.
Results showed that the Δp response measured between the top and bottom surfaces of the axon ranged from sub-nanometers to 21 nm on a millisecond time scale (Akkin et al., 2009). The responses were mostly biphasic. The initial direction of the first event was constant for a given location, but alternated for different locations in about equal frequency of occurrence. Hence, these transient events appeared to have local characteristics. Mean values of Δp response was 1.1 nm at room temperature (20–21°C) and 1.65 nm in cold (∼2°C). For most of the Δp responses, which were below 1.2 nm, the mean values at room temperature and in the cold were 0.57 and 0.68 nm, respectively. This suggests that cooling for most of squid giant axon data increased the Δp response by about 19%. Increasing the NaCl levels in saline solution (seawater) decreased the diameter of the axon as expected and produced significantly larger Δp responses during AP propagation. These SD-OCT phase measurements and possible mechanisms are discussed in Akkin et al. (2009). However, the mechanistic origins of the changes producing the optical signals are not yet conclusive. The lack of knowledge hampers improvements in the assessment of activity for both simple and complex neural tissues.
In addition to the phase measurements (Δp response), we analyzed the same SD-OCT data set used in Figures 3 and 4 to obtain an AP indicator based on changes in back-scattered/reflected light intensity. Figure 5 shows the variations in the SD-OCT intensity signal (ΔI) for many points on the top surface of the squid giant axon. The intensity traces in Figure 5 are also averages of 250 records and have 5 kHz bandwidth. It is clear that the ΔI traces are noisier compared to the Δp traces of Figure 3. All ΔI responses were less than 1% of the intensity level given in Figure 4A. Moreover, the shapes and directions of the ΔI traces varied significantly between the points. No ΔI response was observed for the bottom surface and the other points on the top surface of the axon. We did not observe a ΔI response frequently, which is consistent with the very small (10−6 to 10−5) changes in light scattering observed without depth resolution by Cohen et al. (1972).
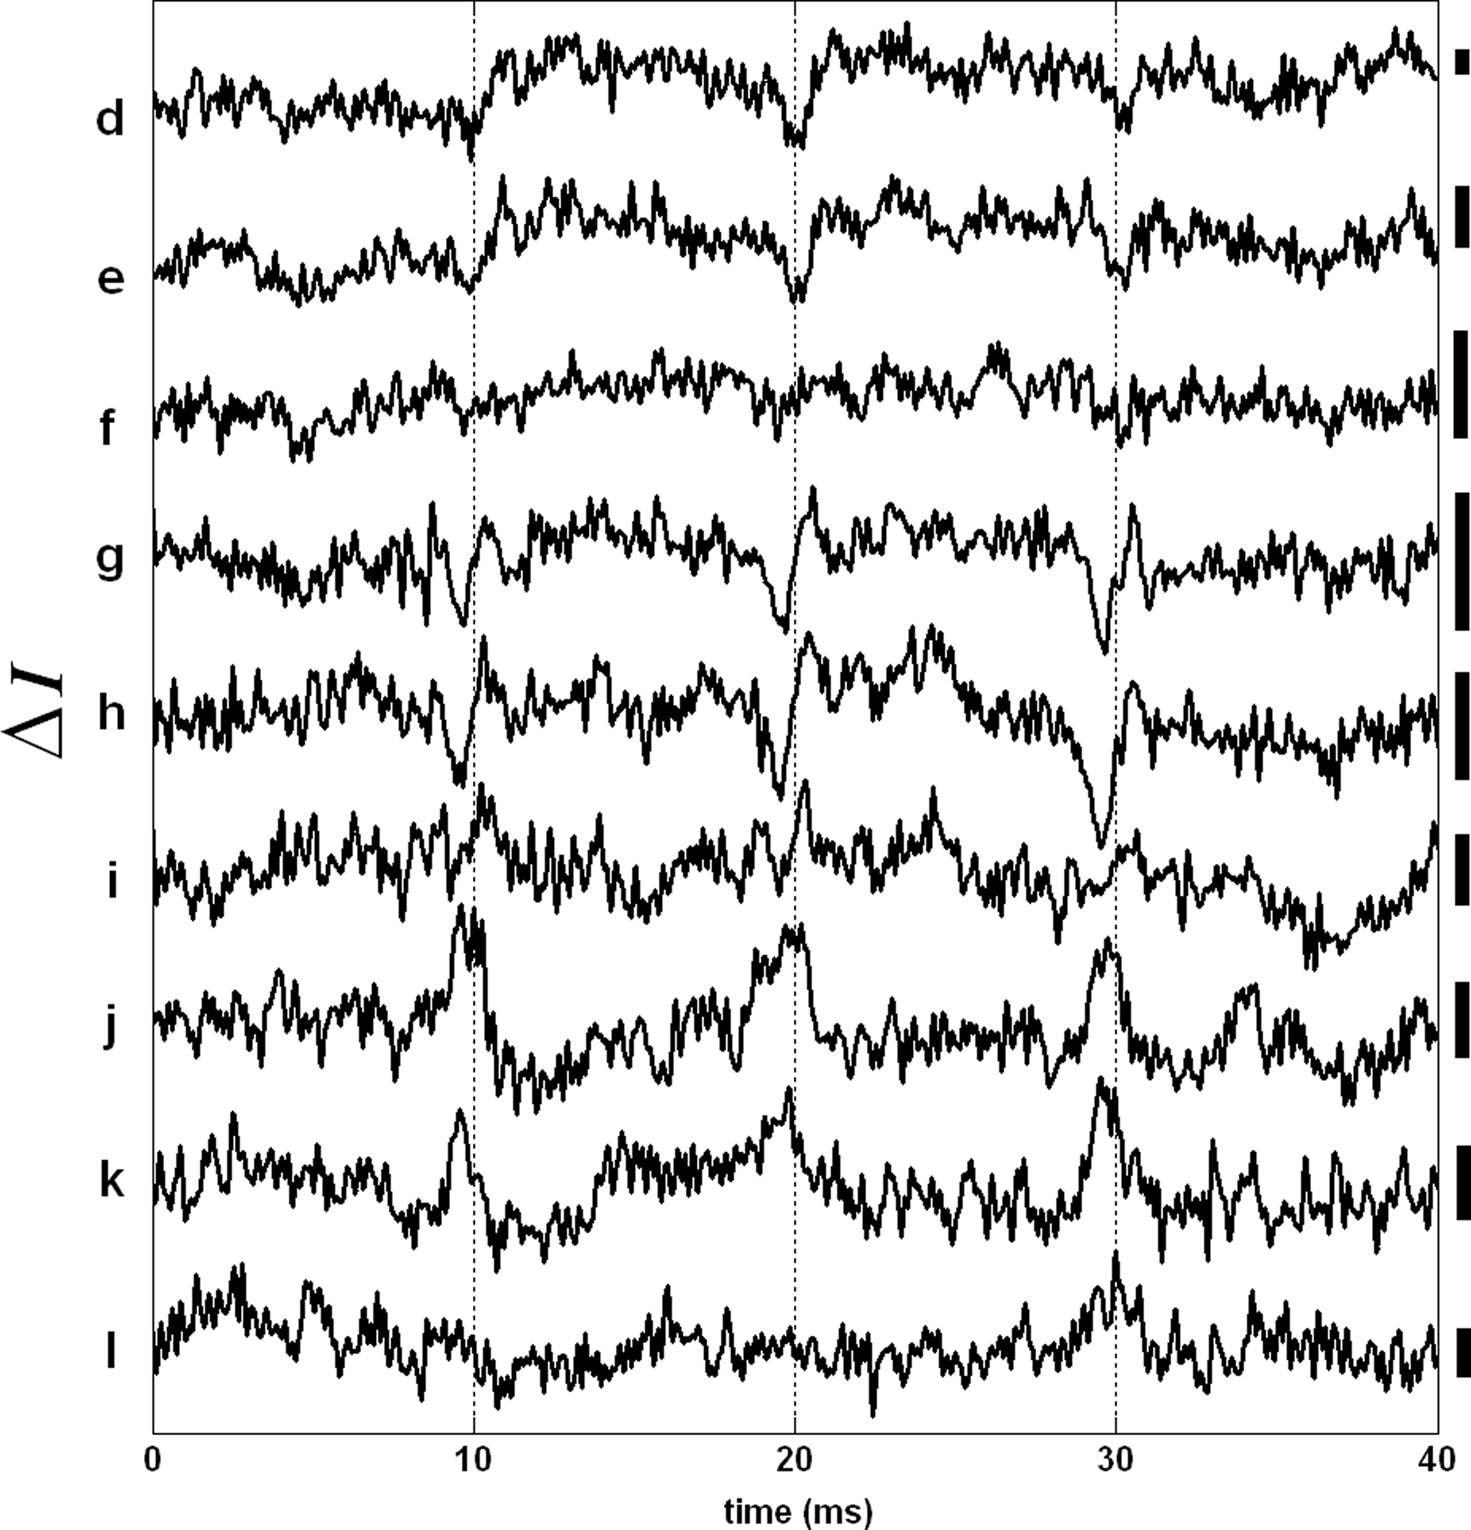
Figure 5. AP related changes in the SD-OCT intensity signal (ΔI response). Each trace has a label that corresponds to a particular level in the depth profile shown in Figure 3A. Bars on the right represent 0.25% change of the corresponding intensity level. Other locations did not produce a detectable ΔI response. Each trace is an average of 250 responses, and has 5 kHz bandwidth.
Dye Contrast in OCT
Most intrinsic optical signals of neural activity are small and require signal averaging. On the other hand, imaging with voltage-sensitive dyes has increasingly become an important part of neuroscience for studying neural activity in various models. Many dyes are commercially available, and there is a demand for near-IR dyes as the longer wavelengths can penetrate more in the scattering tissue. Near-IR dyes will also be good for retinal studies, since they don’t excite the photoreceptor cells. The fluorescence dyes, because of use in reflection geometry, are more desirable for many applications. Function in neurons in a superficial plane can be imaged by conventional techniques, but axial (depth) sectioning is not inherently provided. In other words, function of cells lying behind other cells in the light path could not be distinguished. We believe that OCT is a potential candidate to fill this gap. Although OCT does not require exogenous chemicals, we used a voltage-sensitive dye as an OCT contrast agent for depth-resolved detection of neural activity. The preliminary data presented here is encouraging and shows feasibility of the approach.
Figure 6A illustrates the sample arm configuration of our fiber-based SD-OCT system, which was not polarization sensitive, but we used polarization optics to observe reflection-mode cross-polarized light intensity with detector DR. Another detector (DT) was used to observe AP related changes in transmitted light intensity due to absorption or scattering changes. Collimated light (λo: 835 nm, Δλ: 75 nm) with a diameter of 2.4 mm enters to a Wollaston prism at its divergence angle; therefore, linearly polarized light is directed and focused on a squid giant axon that is oriented 45° with respect to the incoming polarization state.
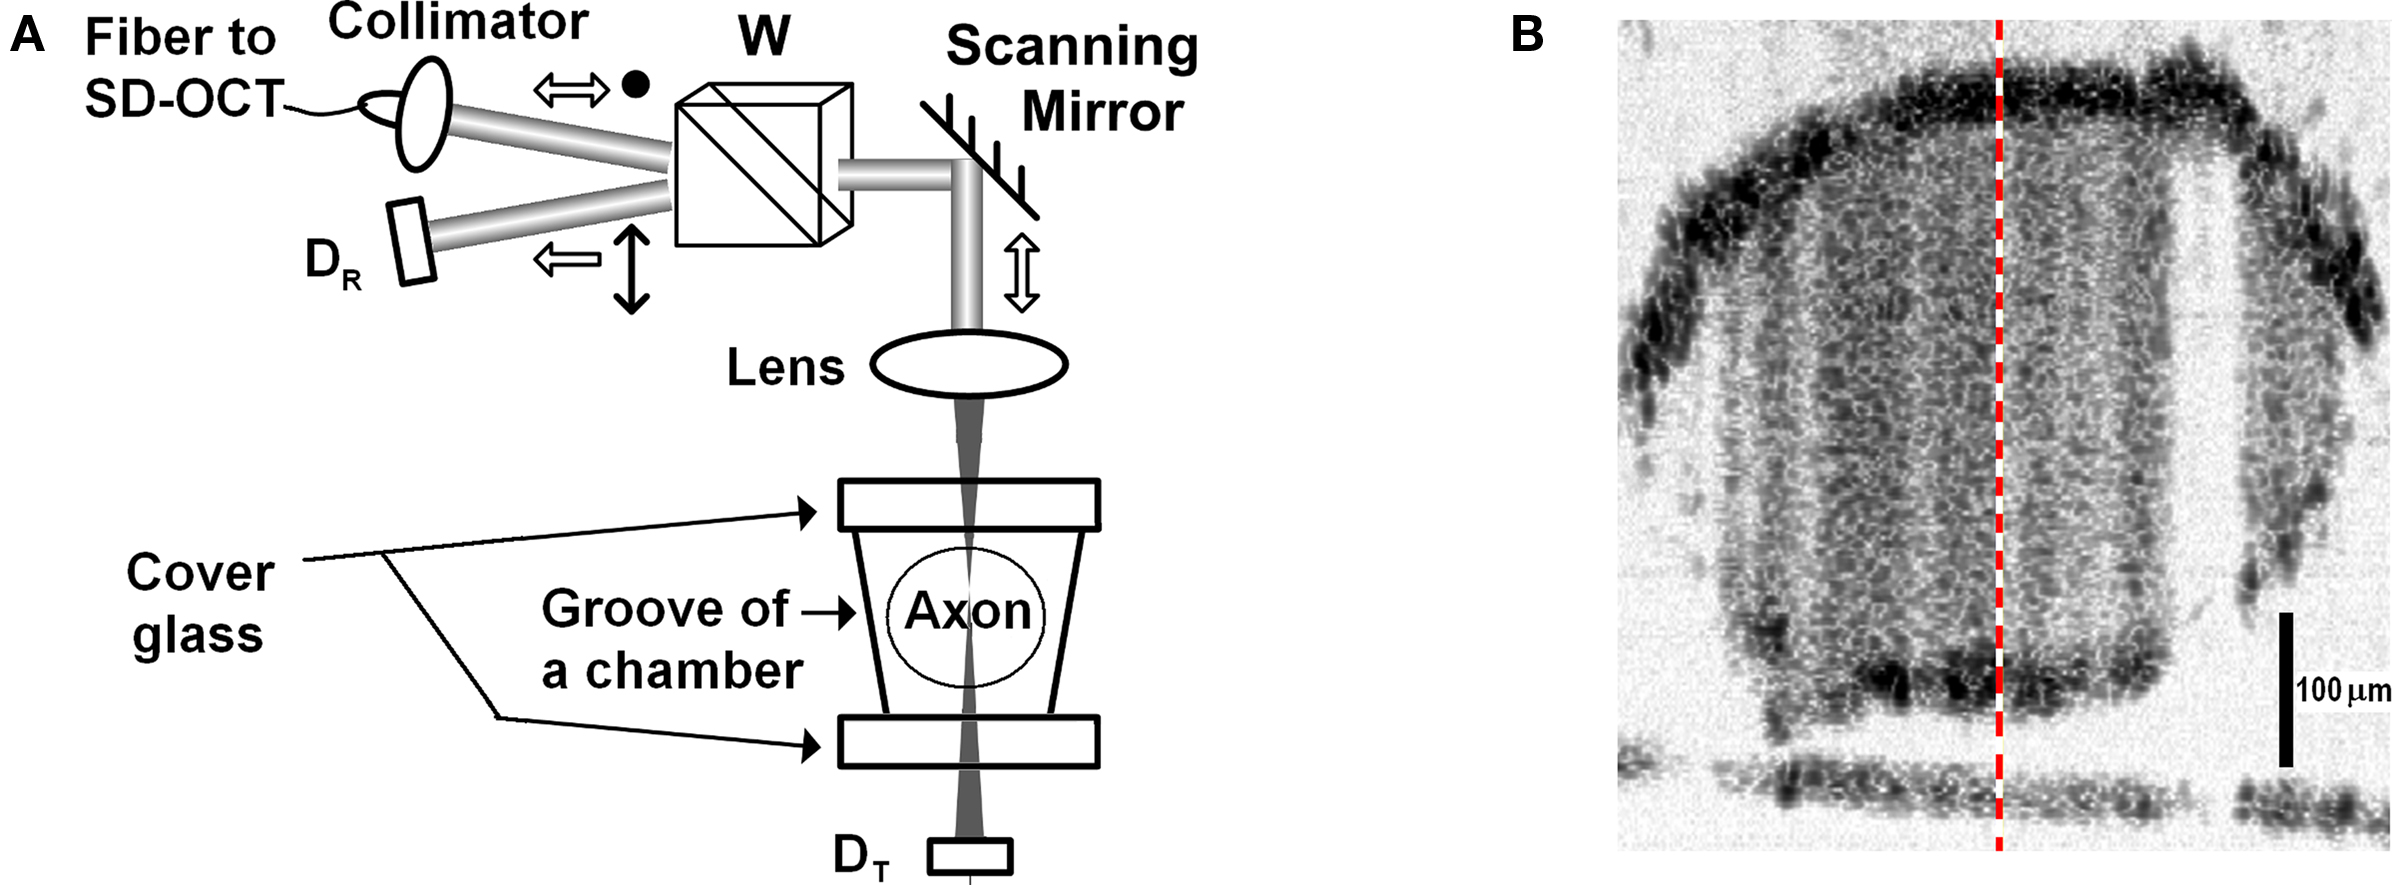
Figure 6. (A) SD-OCT sample arm configuration, D: detector, W: Wollaston prism. (B) Image of a 420-μm diameter stained squid giant axon. The-dashed line indicates the A-line probed in the experiment.
Light from two broadband superluminescent diodes were combined to improve the axial resolution. The envelope of Figure 2A suggests the spectral characteristics of the combined source and Figure 2B shows the corresponding axial resolution. The reference arm of the SD-OCT consisted of an attenuator and a stationary reflector. In the detection arm, a custom built spectrometer contains a 75-mm achromatic collimator, 1200 lines/mm transmission grating and 100 mm achromatic lens, which focuses the optical spectrum on a line scan CCD camera.
The experiment was performed at Marine Biological Laboratory (Woods Hole, MA, USA). A dissected giant axon of squid (Loligo pealeii) was stained with a near-infrared dye (IR-144, Eastman Kodak Co., 1 mg/ml in sea water). Structures and characteristics of IR-144 and several other IR dyes can be found in Webb et al. (1975). The axon was placed in a nerve chamber (description in Akkin et al., 2009) and kept in a cold environment (∼2°C) during the experiment. By scanning the beam over the sample, the SD-OCT system displayed cross-sectional images of the axon in real-time. Figure 6B shows the logarithmic representation of the reflectivity image with 43 dB dynamic range. The axial and lateral resolutions were 4.3 μm in tissue (5.9 μm in air) and 21 μm, respectively. The optical power on the axon did not exceed 1 mW. After selecting the center of the axon, the beam was stationary at the center (M-mode imaging) to observe the AP related changes.
Simultaneous with the SD-OCT measurement, the two detectors (DR, DT) measured changes in transmitted light intensity and reflection-mode cross-polarized light intensity. Figure 7 shows the photo-detector signals that are not depth-resolved, and the differentially and externally recorded electrical AP. The arrows represent the current pulses (500 μA, 50 μs) applied to the squid giant axon. Each record consisted of three stimuli to show the repeatability of the responses. Each trace is an average of 250 records to reveal the details. With the arrival of each AP to the optical recording area (approximately zero-crossings at 10, 20, and 30 ms), the transmitted light intensity (Figure 7A) was temporarily reduced by about 0.15% followed by an increase making the response biphasic. The back-scattered cross-polarized signal (Figure 7B) resulted in a detectable signal as well. Since this signal was not detectable for the unstained axon studied above, it may indicate an enhancement of the dye for the reflected signal. An earlier study (Ross et al., 1977) reported transmission-mode cross-polarized intensity change from the edge of an axon stained with merocyanine-rhodamine, but did not show a detectable signal at the center of the axon. Therefore, the cross-polarized signal measured at the center of the axon in reflection geometry may be enhanced further by utilizing the edges. Moreover, Figure 7B suggests the use of polarization-sensitive OCT systems for functional neural imaging.
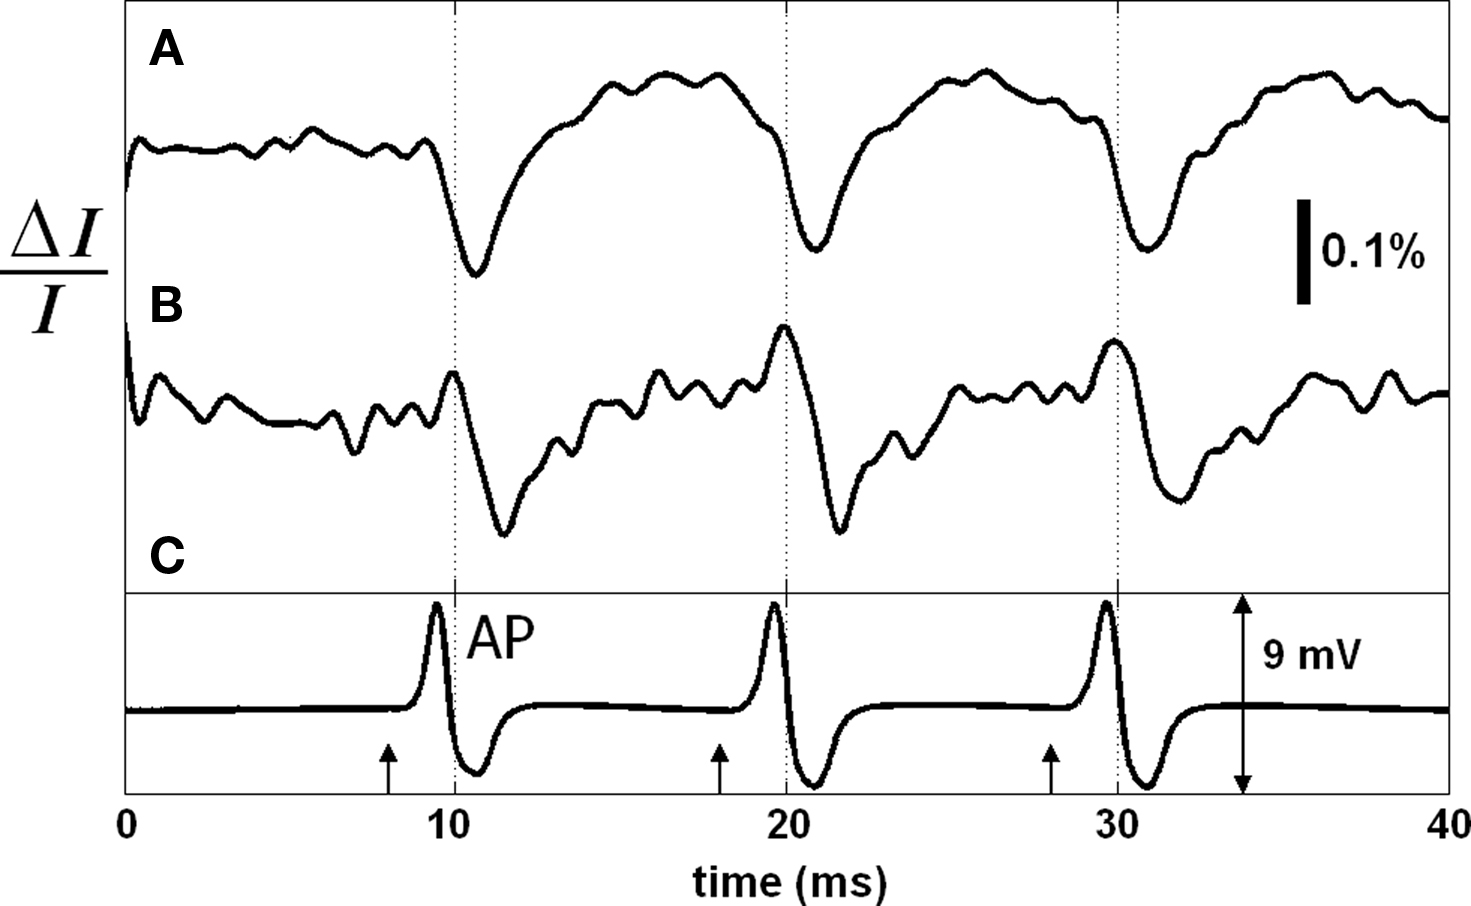
Figure 7. Transmitted light intensity change (A), and reflected cross-polarized light intensity change (B) during AP propagation in the stained squid giant axon. Electrical action potential recording is in (C); arrows indicate stimuli (500 μA, 50 μs). Each trace is an average of 250 responses. Saline solution was cold seawater (temperature: 2°C).
We used SD-OCT to look for dye dependent changes in back-scattered light intensity near the surfaces of the stained squid giant axon because the largest voltage changes occur across the axon membrane. We simultaneously measured intensity and phase changes of the SD-OCT signals from the same axon. Figure 8A shows the depth profile probed in this experiment with labels indicating points, whose responses were presented in this and next figures. To utilize the phase signals, common-mode phase noise was removed by subtracting the phase of a glass–saline interface above the squid giant axon from the phase of the measurement points. Then the phase difference (Δφ) was converted to single-pass optical path length change (Δp) for convenience, Δp(z) = (λ0/4π)Δφ(z), and plotted as a function of time. The Δp traces in Figure 8B shows similar responses for the four points chosen from the top surface of the axon. Other points on the same surface produced similar Δp responses, as well. Such traces may also be obtained without the use of dye (Akkin et al., 2009). The top surface of the axon produced less than 1% intensity change for a few points as shown in Figure 8C; whereas multiple points for the bottom surface produced different results.
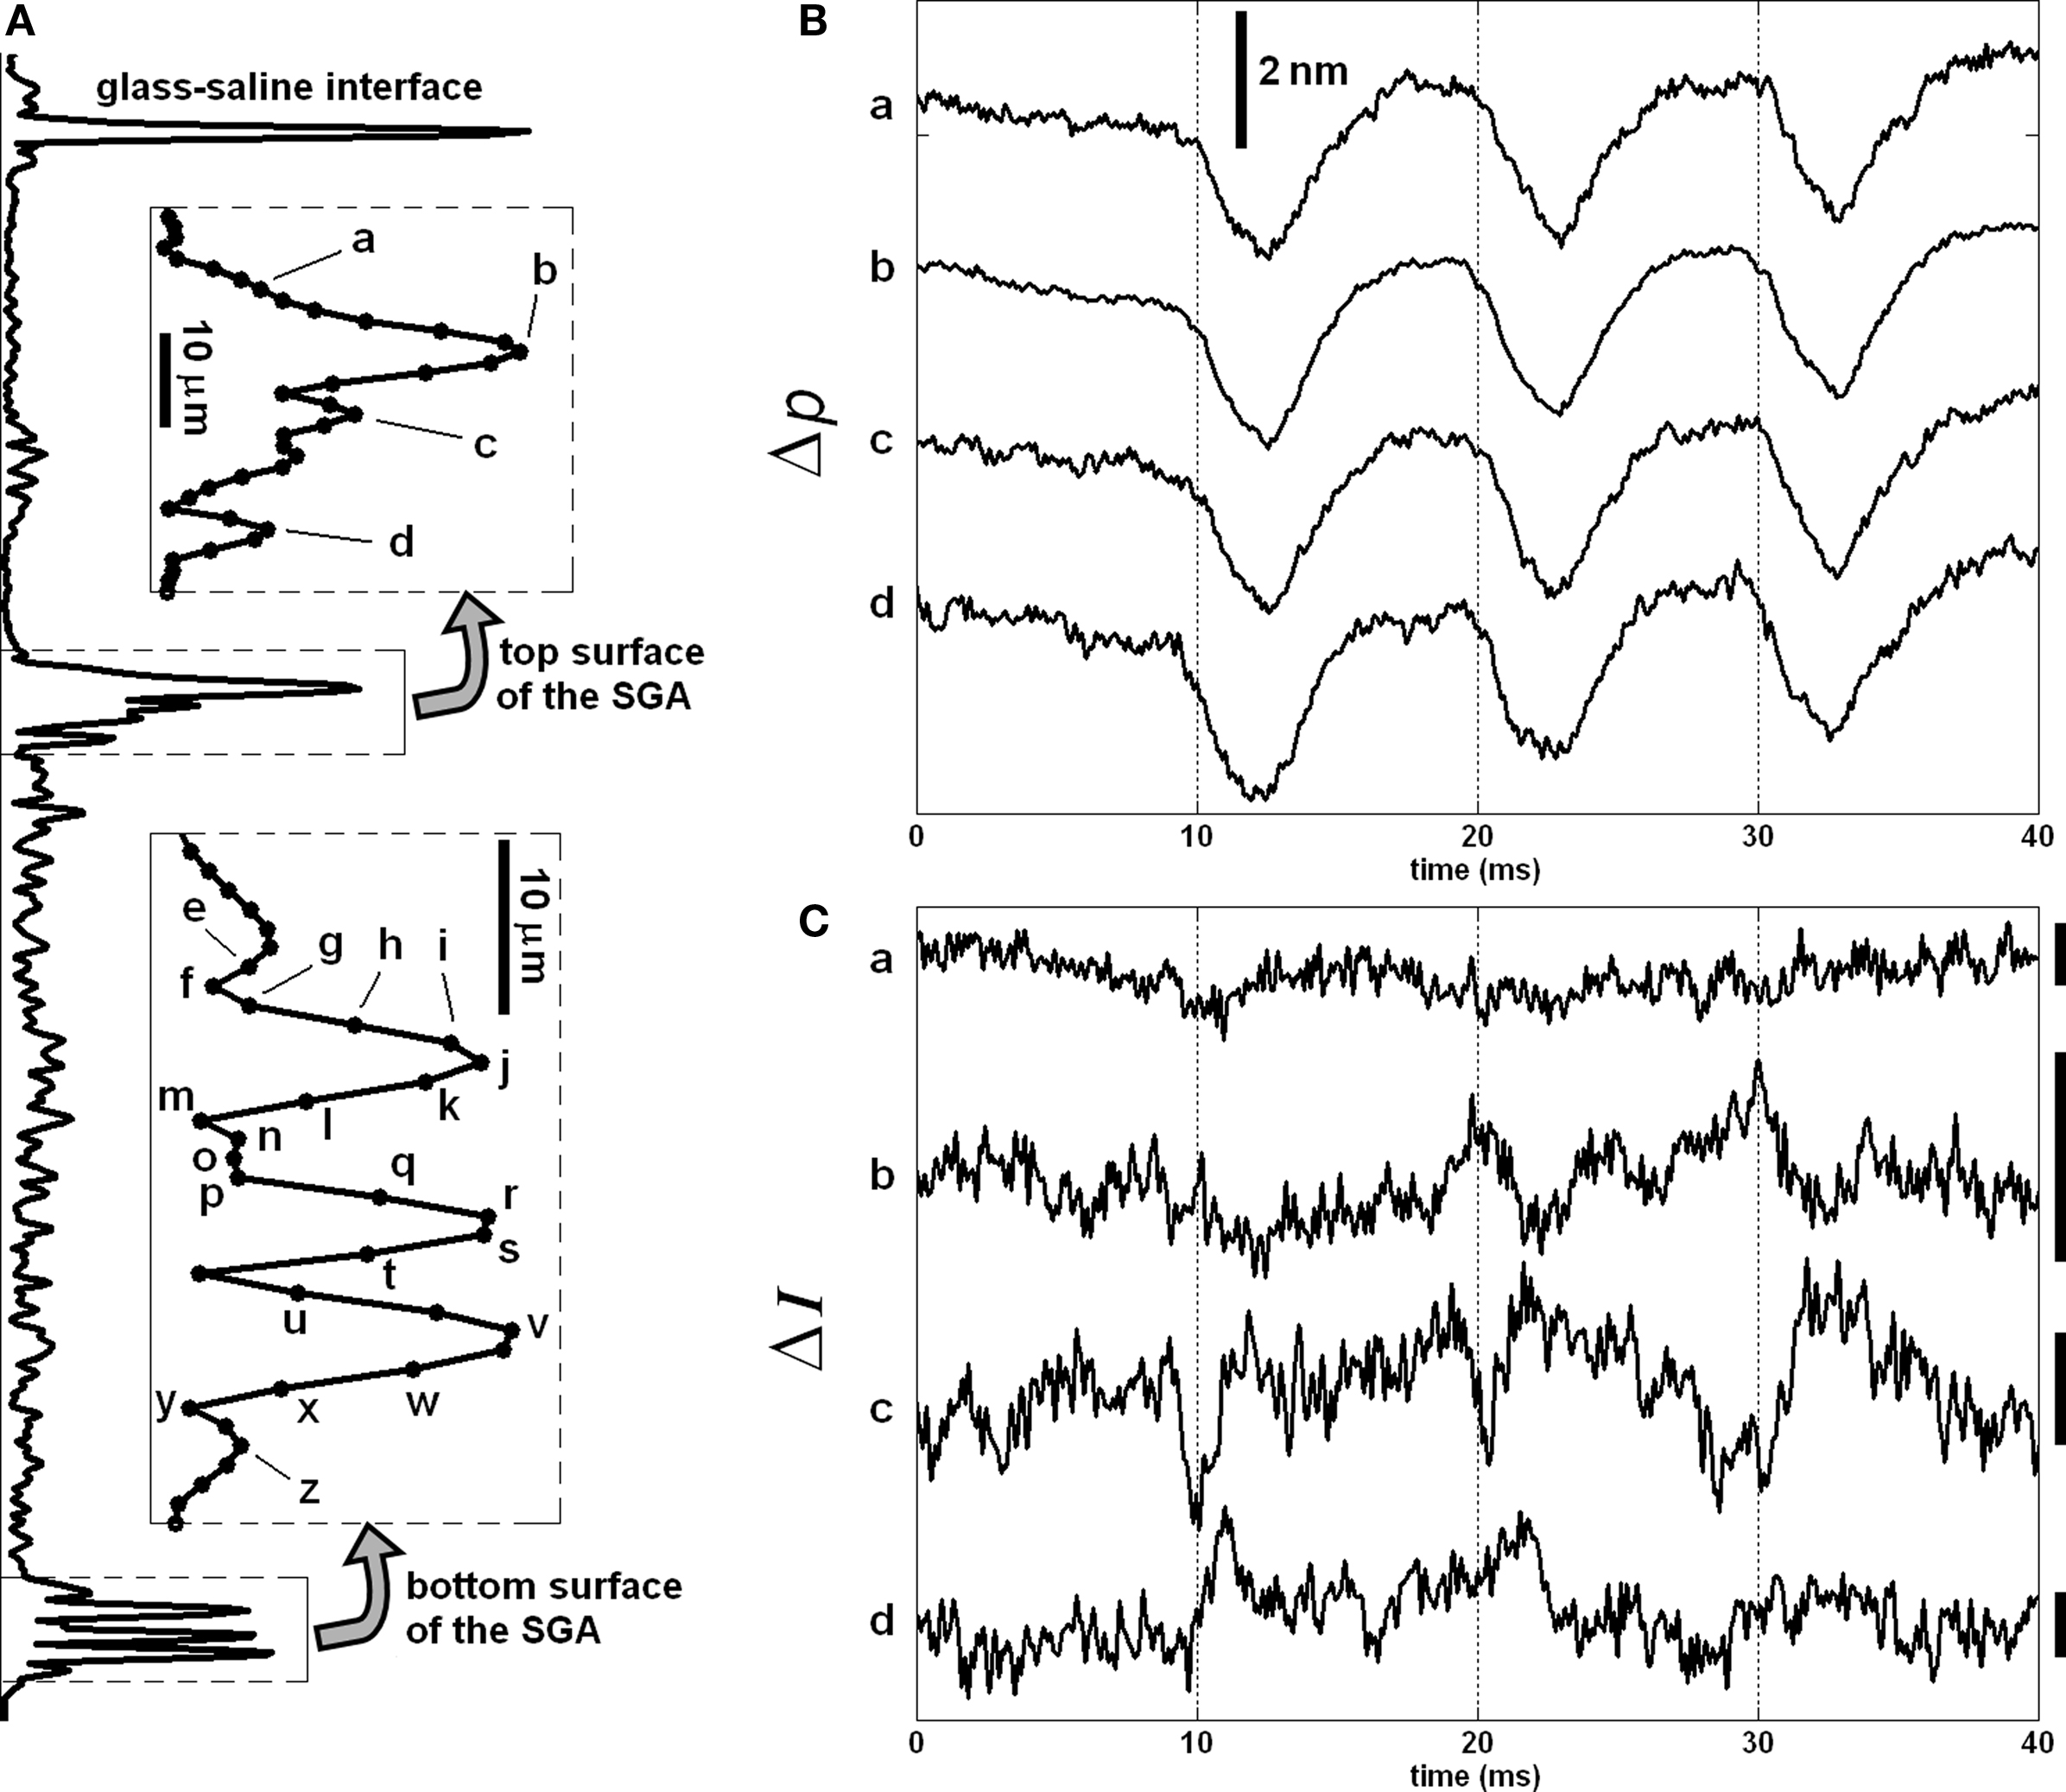
Figure 8. Depth profile of the stained squid giant axon probed by the SD-OCT (A), and Δp (B) and ΔI (C) responses of the top surface of the axon. The insets show the labels of points, whose responses are given in (B,C), and the next figures. Bars in (C) represent 0.5% change of the corresponding intensity level. Each trace is an average of 250 responses, and has 5 kHz bandwidth. The AP is given in Figure 7C.
Figure 9 shows the intensity and phase signals of SD-OCT for eight points located at the inner side of the bottom surface of the axon. Even though separations of the points are less than the axial resolution, we provide these to describe the nature of the responses. Both Δp and ΔI responses are highly correlated with the arrival of APs to the measurement area (simultaneously recorded APs are shown in Figure 7C). The Δp traces for the eight points are similar to each other (Figure 9A). The intensity traces are shown in Figure 9B. The amplitude and sign of the ΔI responses varied for different points. Moreover, the biphasic feature observed for the Δp response was not apparent for most of the ΔI responses. By normalizing the ΔI responses by the intensity at the corresponding levels, we obtained the peak-to-peak normalized intensity changes as shown in the right side of the figure. These values represent a large increase in the signal-to-noise ratio over the results obtained with unstained axons.
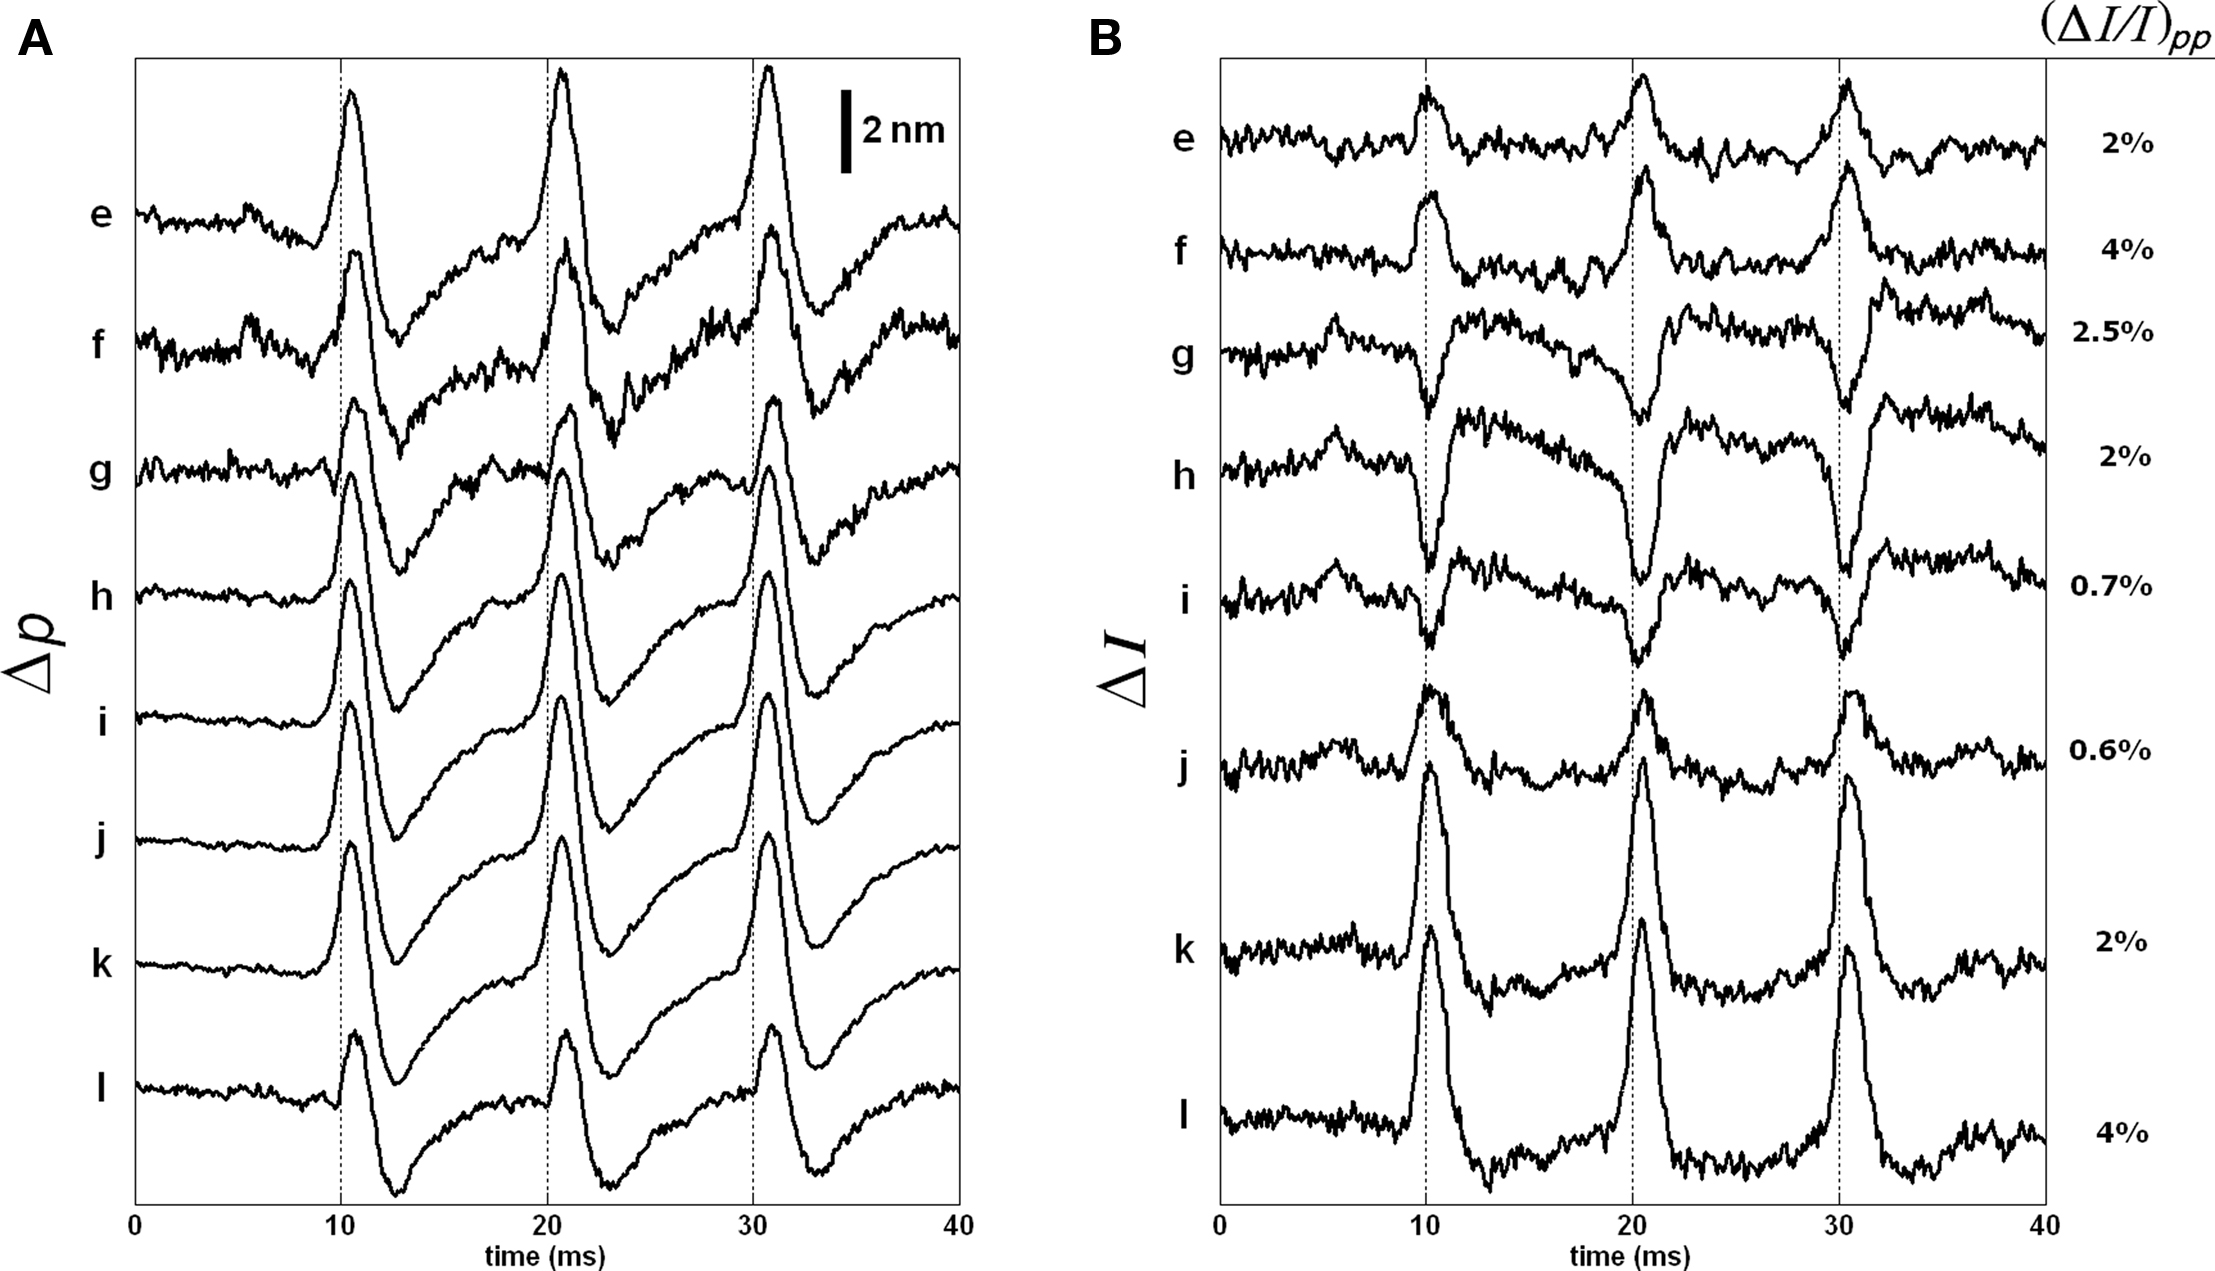
Figure 9. Δp (A) and ΔI (B) responses of the eight points located at the inner side of the bottom surface of the stained axon. Each trace is an average of 250 responses, and has 5 kHz bandwidth. The AP is given in Figure 7C.
The responses of points m, n, o, and p are shown in Figure 10 as they represent different characteristics. The Δp responses of points m and p are very much different than the Δp responses of all other points. The point m with the smallest intensity level produced the largest normalized intensity change that was about 13%. For this point, the shape and timing of the Δp and ΔI responses were comparable, which is perhaps related to the low intensity level. Point p, on the other hand, produced a triphasic Δp response, but not a detectable ΔI response. Points n and o produced large Δp responses (about 13 nm and 11 nm, respectively) in the same direction, but the signs of their ΔI responses were in opposite directions. The sign of the intensity change was different at different locations within the coherence length. This requires further investigation.
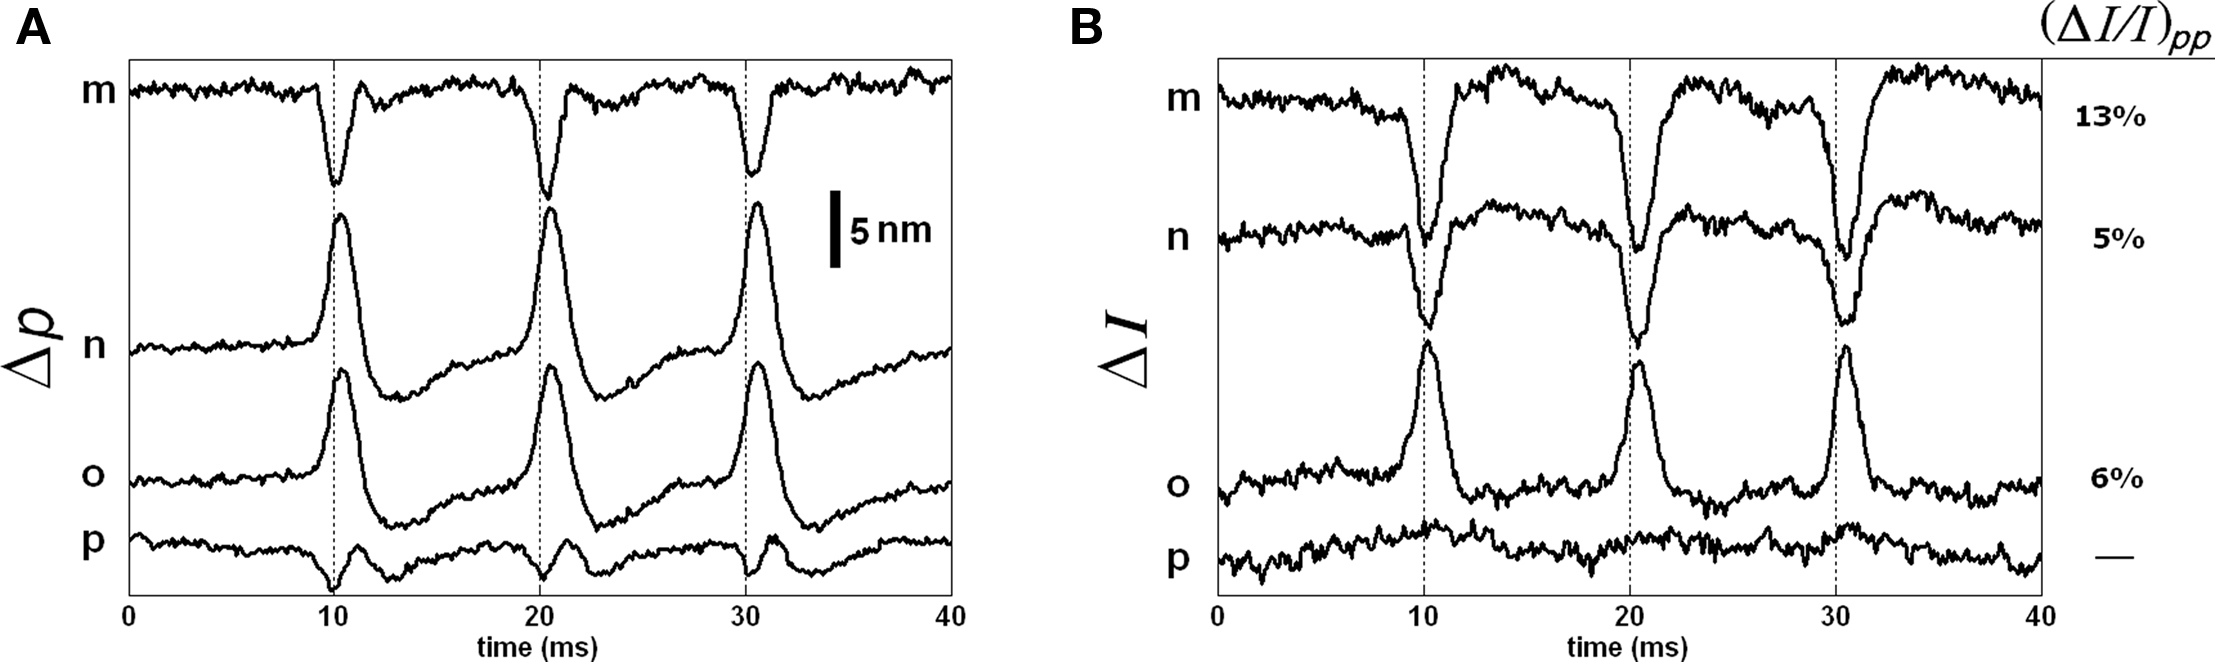
Figure 10. Δp (A) and ΔI (B) responses of the four points located within the bottom surface of the stained axon. Each trace is an average of 250 responses, and has 5 kHz bandwidth. The AP is given in Figure 7C.
Figure 11 shows the responses of the remaining points. The Δp traces were similar to those in Figure 9A. The ΔI responses and their normalized peak-to-peak changes are given in Figure 11B. As shown, the ΔI responses for points on the outer side of the bottom surface were difficult to detect.
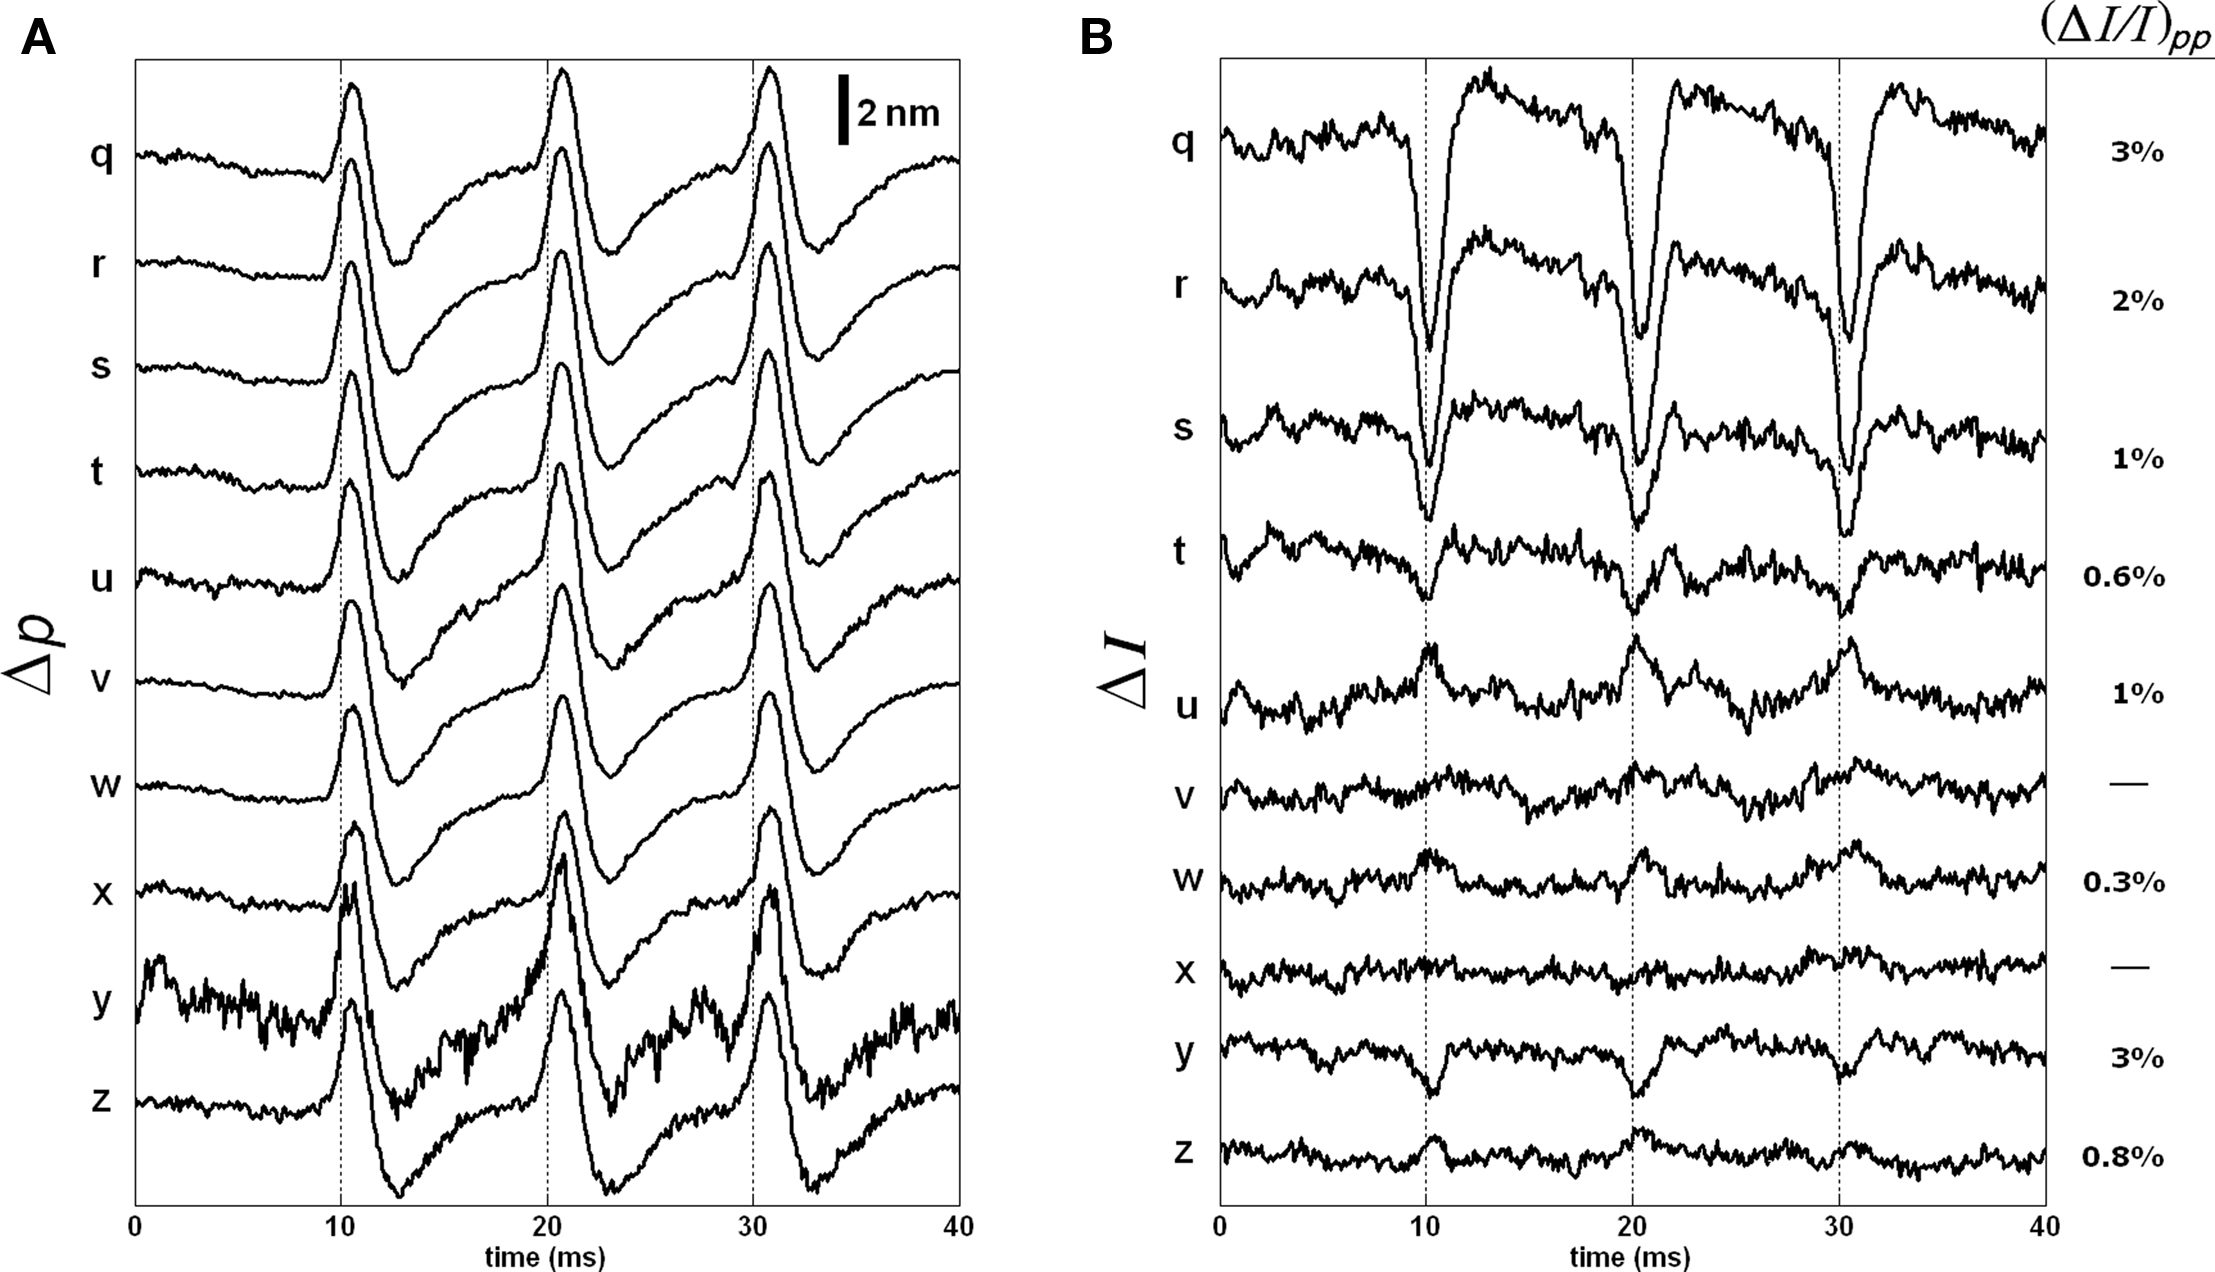
Figure 11. Δp (A) and ΔI (B) responses of the 10 points located at the outer side of the bottom surface of the stained axon. Each trace is an average of 250 responses, and has 5 kHz bandwidth. The AP is given in Figure 7C.
Figures 9–11 reveal an unexpected complexity of signals associated with APs at different depths within the cellular sheath that surrounds the squid giant axon. Assuming the Δp responses were caused by displacements, the observed intensity changes are too large to be explained by about 6 nm shift of a 4.3-μm coherence function, which should produce about 0.4% change at the full-width-half maxima and less at the higher levels. Another important point is that the timing and the shape of these dye intensity and phase signals are different. The phase signals peaked little after (0.3–0.5 ms) the intensity signals and lasted longer for most points. This suggests that the dye intensity signal may be directly related to the local potential changes, and the phase signal may result from AP-induced structural changes. While more work is needed to understand the mechanisms of the AP related phase and intensity signals of OCT, its depth-resolved signals clearly provides more information than the conventional transmission-mode recording, and it works in reflection geometry.
Conclusion
We utilized SD-OCT intensity measurement on a squid giant axon stained with a voltage-sensitive dye to localize the activity in depth. Although OCT does not require exogenous chemicals, preliminary data demonstrated that the stained axon produce significant change in local back-scattered light intensity around the membrane during AP propagation. The phase signals of SD-OCT are available as well, and changes in transmitted light intensity and reflected cross-polarized light intensity were also reported for the same axon. The results suggest a need for the development of new dyes for specific wavelength regions that OCT systems operate; so that voltage induced changes in absorption or scattering properties can be captured in reflection geometry and with depth-sectioning capability. More work will be needed to understand the mechanism underlying these optical signals associated with the passage of APs. The development of the SD-OCT technique to identify functional and dysfunctional areas within the nerve has tremendous advantages in functional neural imaging. The technique would enable us to compare the local structural and potential changes with high spatial and temporal resolutions, and be used as an alternative or supportive tool to electrophysiology. The approach has potential to produce critical data, which could increase the understanding of functioning nerve and aid future diagnostic applications.
Conflict of Interest Statement
The authors declare that the research was conducted in the absence of any commercial or financial relationships that could be construed as a potential conflict of interest.
Acknowledgments
This work was supported in part by a research grant from the NIH (EB006588, co-funded by National Institute of Biomedical Imaging and Bioengineering (NIBIB) and National Eye Institute (NEI)), and by the Hartline and MacNichol Jr. Fellowship at the Marine Biological Laboratory, Woods Hole, MA, USA. Authors thank Dr. L. B. Cohen for his encouragement and support that include providing the dye.
References
Aguirre, A. D., Chen, Y., Fujimoto, J. G., Ruvinskaya, L., Devor, A., and Boas, D. A. (2006). Depth-resolved imaging of functional activation in the rat cerebral cortex using optical coherence tomography. Opt. Lett. 31, 3459–3461.
Akkin, T., Davé, D. P., Milner, T. E., and Rylander, H. G. III. (2004). Detection of neural activity using phase-sensitive optical low-coherence reflectometry. Opt. Express 12, 2377–2386.
Akkin, T., Joo, C., and de Boer, J. F. (2007). Depth resolved measurement of transient structural changes during action potential propagation. Biophys. J. 93, 1347–1353.
Akkin, T., Landowne, D., and Sivaprakasam, A. (2009). Optical coherence tomography phase measurement of transient changes in squid giant axons during activity. J. Membr. Biol. 231, 35–46.
Bizheva, K., Pflug, R., Hermann, B., Povazay, B., Sattmann, H., Qiu, P., Anger, E., Reitsamer, H., Popov, S., Taylor, J. R., Unterhuber, A., Ahnelt, P., and Drexler, W. (2006). Optophysiology: depth-resolved probing of retinal physiology with functional ultrahigh-resolution optical coherence tomography. Proc. Natl. Acad. Sci. U.S.A. 103, 5066–5071.
Chen, Y., Aguirre, A. D., Ruvinskaya, L., Devor, A., Boas, D. A., and Fujimoto J. G. (2009). Optical coherence tomography (OCT) reveals depth-resolved dynamics during functional brain activation. J. Neurosci. Methods 178, 162–173.
Choma, M. A., Ellerbee, A. K., Yang, C., Creazzo, T. L., and Izatt, J. A. (2005). Spectral-domain phase microscopy. Opt. Lett. 30, 1162–1164.
Cohen, L. B. (1973). Changes in neuron structure during action potential propagation and synaptic transmission. Physiol. Rev. 53, 373–418.
Cohen, L. B., Keynes, R. D., and Landowne, D. (1972). Changes in light scattering that accompany the action potential in squid giant axons: potential-dependent components. J. Physiol. 224, 701–725.
Drexler, W., and Fujimoto, J. G. (eds). (2008). Optical Coherence Tomography: Technology and Applications. New York, NY: Springer.
Fang-Yen, C., Chu, M. C., Seung, H. S., Dasari, R. R., and Feld, M. S. (2004). Noncontact measurement of nerve displacement during action potential with a dual-beam low-coherence interferometer. Opt. Lett. 29, 2028–2030.
Fercher, A. F., Drexler, W., Hitzenberger, C. K., and Lasser, T. (2003). Optical coherence tomography – principles and applications. Rep. Prog. Phys. 66, 239–303.
Fercher, A. F., Hitzenberger, C. K., Kamp, G., and Elzaiat, S. Y. (1995). Measurement of intraocular distances by backscattering spectral interferometry. Opt. Commun. 117, 43–48.
Graf, B. W., Ralston, T. S., Ko, H.-J., and Boppart, S. A. (2009). Detecting intrinsic scattering changes correlated to neuron action potentials using optical coherence imaging. Opt. Express 17, 13447–13457.
Hill, B. C., Schubert, E. D., Nokes, M. A., and Michelson, R. P. (1977). Laser interferometer measurement of changes in crayfish axon diameter concurrent with action potential. Science 196, 426–428.
Homma, R., Baker, B. J., Jin, L., Garaschuk, O., Konnerth, A., Cohen, L. B., Bleau, C. X., Canepari, M., Djurisic, M., and Zecevic, D. (2009). Wide-field and two-photon imaging of brain activity with voltage- and calcium-sensitive dyes. Methods Mol. Biol. 489, 43–79.
Huang, D., Swanson, E. A., Lin, C. P., Schuman, J. S., Stinson, W. G., Chang, W., Hee, M. R., Flotte, T., Gregory, K., Puliafito, C. A., and Fujimoto, J. G. (1991). Optical coherence tomography. Science 254, 1178–1181.
Iwasa, K., and Tasaki, I. (1980). Mechanical changes in squid giant axons associated with production of action potentials. Biochem. Biophys. Res. Commun. 95, 1328–1331.
Joo, C., Akkin, T., Cense, B., Park, B. H., and de Boer, J. F. (2005). Spectral-domain optical coherence phase microscopy for quantitative phase-contrast imaging. Opt. Lett. 30, 2131–2133.
Lazebnik, M., Marks, D. L., Potgieter, K., Gillette, R., and Boppart, S. A. (2003). Functional optical coherence tomography for detecting neural activity through scattering changes. Opt. Lett. 28, 1218–1220.
Maheswari, R. U., Takaoka, H., Homma, R., Kadono, H., and Tanifuji, M. (2002). Implementation of optical coherence tomography (OCT) in visualization of functional structures of cat visual cortex. Opt. Commun. 202, 47–54.
Maheswari, R. U., Takaoka, H., Kadono, H., Homma, R., and Tanifuji, M. (2003). Novel functional imaging technique from brain surface with optical coherence tomography enabling visualization of depth resolved functional structure in vivo. J. Neurosci. Methods 124, 83–92.
Rajagopalan U. M., and Tanifuji, M. (2007). Functional optical coherence tomography reveals localized layer-specific activations in cat primary visual cortex in vivo. Opt. Lett. 32, 2614–2616.
Ross, W. N., Salzberg, B. M., Cohen, L. B., Grinvald, A., Davila, H. V., Waggoner, A. S., and Wang, C. H. (1977). Changes in absorption, fluorescence, dichroism, and birefringence in stained giant axons: optical measurement of membrane potential. J. Membr. Biol. 33, 141–183.
Srinivasan, V. J., Wojtkowski, M., Fujimoto, J. G., and Duker, J. S. (2006). In vivo measurement of retinal physiology with high-speed ultrahigh-resolution optical coherence tomography. Opt. Lett. 31, 2308–2310.
Webb, J. P., Webster, F. G., and Plourde, B. E. (1975). Sixteen new IR laser dyes. IEEE J. Quantum Electron. 11, 114–119.
Witte S., Baclayon, M., Peterman, E. J., Toonen, R. F., Mansvelder, H. D., and Groot, M. L. (2009). Single-shot two-dimensional full-range optical coherence tomography achieved by dispersion control. Opt. Express 17, 11335–11349.
Keywords: OCT, spectral domain, neural activity, voltage-sensitive, fast signals
Citation: Akkin T, Landowne D and Sivaprakasam A (2010) Detection of neural action potentials using optical coherence tomography: intensity and phase measurements with and without dyes. Front. Neuroenerg. 2:22. doi: 10.3389/fnene.2010.00022
Received: 19 February 2010;
Paper pending published: 31 March 2010;
Accepted: 14 July 2010;
Published online: 06 August 2010
Edited by:
David Boas, Massachusetts General Hospital, USA; Massachusetts Institute of Technology, USA; Harvard Medical School, USAReviewed by:
Vivek Srinivasan, Massachusetts General Hospital, USARicky Wang, Oregon Health and Science University, USA
Copyright: © 2010 Akkin, Landowne and Sivaprakasam. This is an open-access article subject to an exclusive license agreement between the authors and the Frontiers Research Foundation, which permits unrestricted use, distribution, and reproduction in any medium, provided the original authors and source are credited.
*Correspondence: Taner Akkin, Department of Biomedical Engineering, University of Minnesota, 7-105 Hasselmo Hall, 312 Church Street SE, Minneapolis, MN 55455, USA. e-mail:YWtraW5AdW1uLmVkdQ==