

- 1 Institut de Neurosciences Cognitives de la Méditerranée – Centre National de la Recherche Scientifique Unité Mixte de Rechereche 693, Aix-Marseille Université, Marseille, France
- 2 Gonda Brain Research Center, Bar-Ilan University, Ramat Gan, Israel
Interpreting fMRI data relies on the assumption that hemodynamic responses reflect neuronal activity. Some recently reported results seem to suggest that this assumption might be less robust than what has been thought so far. Data by Schummers et al. (2008) suggest that hemodynamic responses depend on functional properties of astrocytes as mediators of neuronal activity to blood vessels, and therefore reflect neuronal tuning properties only indirectly. The question is how much the final outcome differs from a linear integration of the local neuronal responses.
In more specific visual stimulus designs involving perceptual suppression of a physically present visual stimulus (Maier et al., 2008), BOLD responses and neuronal ones have been reported to not always go “hand in hand”, suggesting that the relationship between hemodynamic and neuronal responses might depend on stimulus characteristics and behavioral task.
Finally, “anticipatory” hemodynamic responses have been reported (Sirotin and Das, 2009) in V1 of a monkey performing a fixation-on-off task. Importantly, the authors failed to predict the recorded hemodynamic changes from local neuronal activity. But does this rule out the latter as cause for the former? Is it conceivable that complex, modulatory phenomena such as attention involve complex links between neuronal and vascular activity, other than those acting in the case of a salient visual stimulus? What is the relation between eye movements, hemodynamic responses and local neuronal activity? Answers to these questions may help to better understand the main observations in (Sirotin and Das, 2009) and its implications for functional brain imaging.
A central assumption underlying the interpretation of fMRI data is that hemodynamic responses correspond to local neuronal activity and that they reflect its functional properties. Indeed, numerous studies conducted with optical imaging of intrinsic signals and fMRI, and more recently with optogenetic methods (Lee et al., 2010) have permitted remarkable insights into the organization of brain activity and the underlying neuronal mechanisms, suggesting that, within reasonable approximation, this assumption is correct. However, recent reports seem to challenge this assumption. How much?
Schummers et al. (2008) recently reported that hemodynamic responses depend on astrocytic rather than on neuronal activity. The tuning properties of hemodynamic responses would thus reflect those of astrocytic populations rather than of neuronal ones. How different are those? Schummers et al. find that the tuning curves of nearby astrocytes and neurons are centered on the same maximum. Yet, astrocytes are somewhat more narrowly tuned, which would introduce some non-linearity in the translation of the neuronal into the hemodynamic response. More data and extensive simulation work are needed to determine the amplitude of this effect – in particular under anesthesia, which the authors report to affect neurons and astrocytes differently. However, hemodynamic responses integrate over comparatively large neuronal – and thus astrocytic – populations (at least the size of a cortical column). Moreover, both neuronal and astrocytic tuning curves are in most cases symmetric around their maximum. Therefore, at least the spatial bias introduced by the astrocytic filter is likely to be small. In other words, assuming that the hemodynamic responses reflect a linear integration over the neuronal tuning curves of a local population of neurons is probably not such a bad approximation – at least when it comes down to determine what kind of stimulus with respect to another a given patch of cortex is preferably responsive to.
In more specific visual stimulus designs, involving perceptual suppression of a physically present visual stimulus (Maier et al., 2008), BOLD responses and neuronal ones (spikes and LFP, in particular the high frequency range) have been reported to not always go “hand in hand”, but to co-vary differently with visual perception. Although a caveat exists here with respect to the lack of detailed knowledge about the local network activity (Nir et al., 2007), these results suggest that hemodynamic responses might be coupled to the different neuronal processes in a stimulus-dependent way. Put differently: the relationship between hemodynamic and neuronal responses is not rigid, but can depend on the specific circumstances and the task.
Finally, in a recent study performed by Sirotin and Das (2009) in awake monkey V1 it has been reported that hemodynamic responses can even anticipate events in the task structure. Importantly, the authors failed to predict those responses from the local neuronal activity recorded by a microelectrode, although they tried a good number of standard approaches to do so. They thus conclude to have found an “exception to the assumption that hemodynamic signals uniformly imply equivalent underlying neuronal activity”. Are the hemodynamic signals detected in Sirotin’s study to be explained by mechanisms other than local neuronal activity?
Recent commentaries (Tan, 2009; Kleinschmidt and Müller, 2010; Leopold, 2010) took different positions. Kleinschmidt and Müller argue that the measured hemodynamic and electrophysiological signals originated from substantially different sizes of neuronal populations and therefore cannot be compared. They suggest that the fixation task performed by the monkeys in Sirotin’s study strongly deploys attention. Its spatial profile would be shaped as a Mexican hat centered on the tiny fixation point – where maximal attentional facilitation takes place – and suppressive in a large off-center part. When passing from facilitation to suppression, the Mexican hat obviously has a “zero crossing” and this gets important when one considers that: (i) on the one hand, in Sirotin’s study the electrical activity (LFP and MUA) was sampled only locally, precisely at about 1.5–2° off fixation, that is, where the zero crossing of the attentional modulation is likely to be (Heinemann et al., 2009). (ii) On the other hand, the hemodynamic signal was averaged over the entire imaged area. Kleinschmidt and Müller therefore suggested that improved spatial sampling of the electrophysiological signal, far from the zero-crossing point of spatial attention, would show the neuronal fingerprint of facilitating or suppressive activity and thus resolve the discrepancies between the two recorded signal modalities.
Alternatively, a recent commentary by Tan (2009) suggests a “dopamine hypothesis” as explanation of the reported anticipatory changes in regional cerebral hemodynamic signal. Indeed, the dopaminergic neurons of the brain stem (substantia nigra and the VTA, ventral tegmental area) exhibit reward-related anticipatory responses that can be adaptively timed (Schultz, 2007). Moreover, it has been suggested that dopamine has a direct effect on the microvasculature, mediated through dopamine receptors (Choi et al., 2006). Given the existence of dopaminergic innervations of the visual cortex arising from the VTA (Phillipson et al., 1987), Tan suggests that regional anticipatory hemodynamic changes in the target area, i.e., the visual cortex, may actually result from anticipatory dopaminergic responses.
We would like to point out another possible effect that might have contributed to the hemodynamic signals recorded in Sirotin and Das’s study. Figures 1C,D of their paper shows an intriguing correlation between eye movements (fixation break and acquire but also smaller movements) and the hemodynamic signals: the temporal pattern of acquiring and breaking fixation signal appears to be closely related to the temporal pattern of the hemodynamic signal. This relationship being nearly one-to-one in the shown example, the question arises of whether the recorded hemodynamic signals might not be evoked by one or more neuronal events linked to eye movements. Admittedly, hemodynamic responses in correspondence to several, temporally close, eye movements are less clearly defined. Also, the true time-lag of the intrinsic signal onset with respect to the putative corresponding eye movement is some cases difficult to determine. For instance, one might argue that especially at 605 nm, in some cases, the time course appears to begin its downwards deflection very (if not too) early to be traced back to an oculomotor event (e.g., in the first and the fifth cycle in Figures 1C,D). However, it must be kept in mind that there are well known difficulties in determining the exact timing of the hemodynamic signal in such cyclic protocols (see, e.g., Kleinschmidt and Müller, 2010). Since eye movements tend to align to the trial structure, also here, interactions between two subsequent hemodynamic responses are likely, making it difficult to determine their exact onset. Some insights on this issue, including on the unusually large amplitude of the 605 nm signal (Figure 1D in Sirotin and Das, 2009: 2–5 times larger than usually, see Vanzetta et al., 2004), might be obtained from analyzing the eye movement patterns corresponding to the hemodynamic responses recorded during protocols that used different timings of trials. Unfortunately those are not provided. In any case, it would be interesting to look at the correlation between eye movements and hemodynamic responses, as well as to see whether the time-series of the former could predict the latter in the non-stimulated trials.
A last issue concerns the related (or unrelated) neuronal activity. In Sirotin’s study, eye movements could in principle induce neuronal activity by shifting the fixation point over the retina, and specifically through the receptive fields of cells located in the imaged area. Indeed, we have previously shown that the dislocation of small visual stimuli on the retina, induced by large saccadic eye movements, evokes population activity in V1 (Slovin et al., 2002, Figure 11). Alternatively, it is possible that eye movements by themselves contribute to neuronal activation in V1 by extra-retinal modulation (Kagan et al. 2008). Indeed, fixation onset initiated by an eye movement, induces neural modulation in V1 as shown by our own data in Figure 1 below. Whatever is the case, the question arises why this was not seen in the electrophysiological recordings.
First, cortical activation induced by eye movements due to retinal stimulation is limited to the trajectory traced by the small fixation point stimulating over V1, which might not have crossed the receptive fields of the neurons sampled by the recording electrode – at least not in every trial – but which might be visible when integrating over a much larger area, as is done in the case of the hemodynamic signals.
A second explanation appears possible when looking at the low frequency part of the LFP (lo-LFP) measurements presented in Sirotin and Das’s paper. The authors note that the lo-LFP band is a poor predictor not only of trial-related hemodynamics, but also of visually evoked one. This result is somewhat surprising given that: (i) other studies (Siegel and König, 2003; Henrie and Shapley, 2005) reported that visual stimuli induce large increase in power over both high and low frequency bands of the LFP and that (ii) the study of Maier et al. (2008) reported lo-LFP band (<30 Hz) to be the only neuronal parameter correlated with the BOLD signal during perceptual suppression in the GFS paradigm. In this latter study, the weak predictive power of the high frequency LFP (hi-LFP) is somewhat surprising but might be attributed to the specific cortical layers from which the signals were recorded. Conversely, the question of why in Sirotin and Das’ study neither the high- nor (and especially not) the low-LFP band could be used as a reliable predictor – even for the stimulated condition – might find an answer by a careful inspection of the recorded LFP patterns:
First, the trial-averaged LFP response in their Figure 2A (bottom left panel) shows large activity in the low frequency band in the stimulated trials already before stimulus onset, at or even before the onset of the “acquire fixation” instruction (the red–yellow “flame” during the left half of the green bar), followed by a much smaller rebound just after the onset of the stimulus (the small yellow “spike” right above the leftmost quarter of the red bar). Second, this large activity is absent in the dark trials (Figure 2A, bottom right panel).
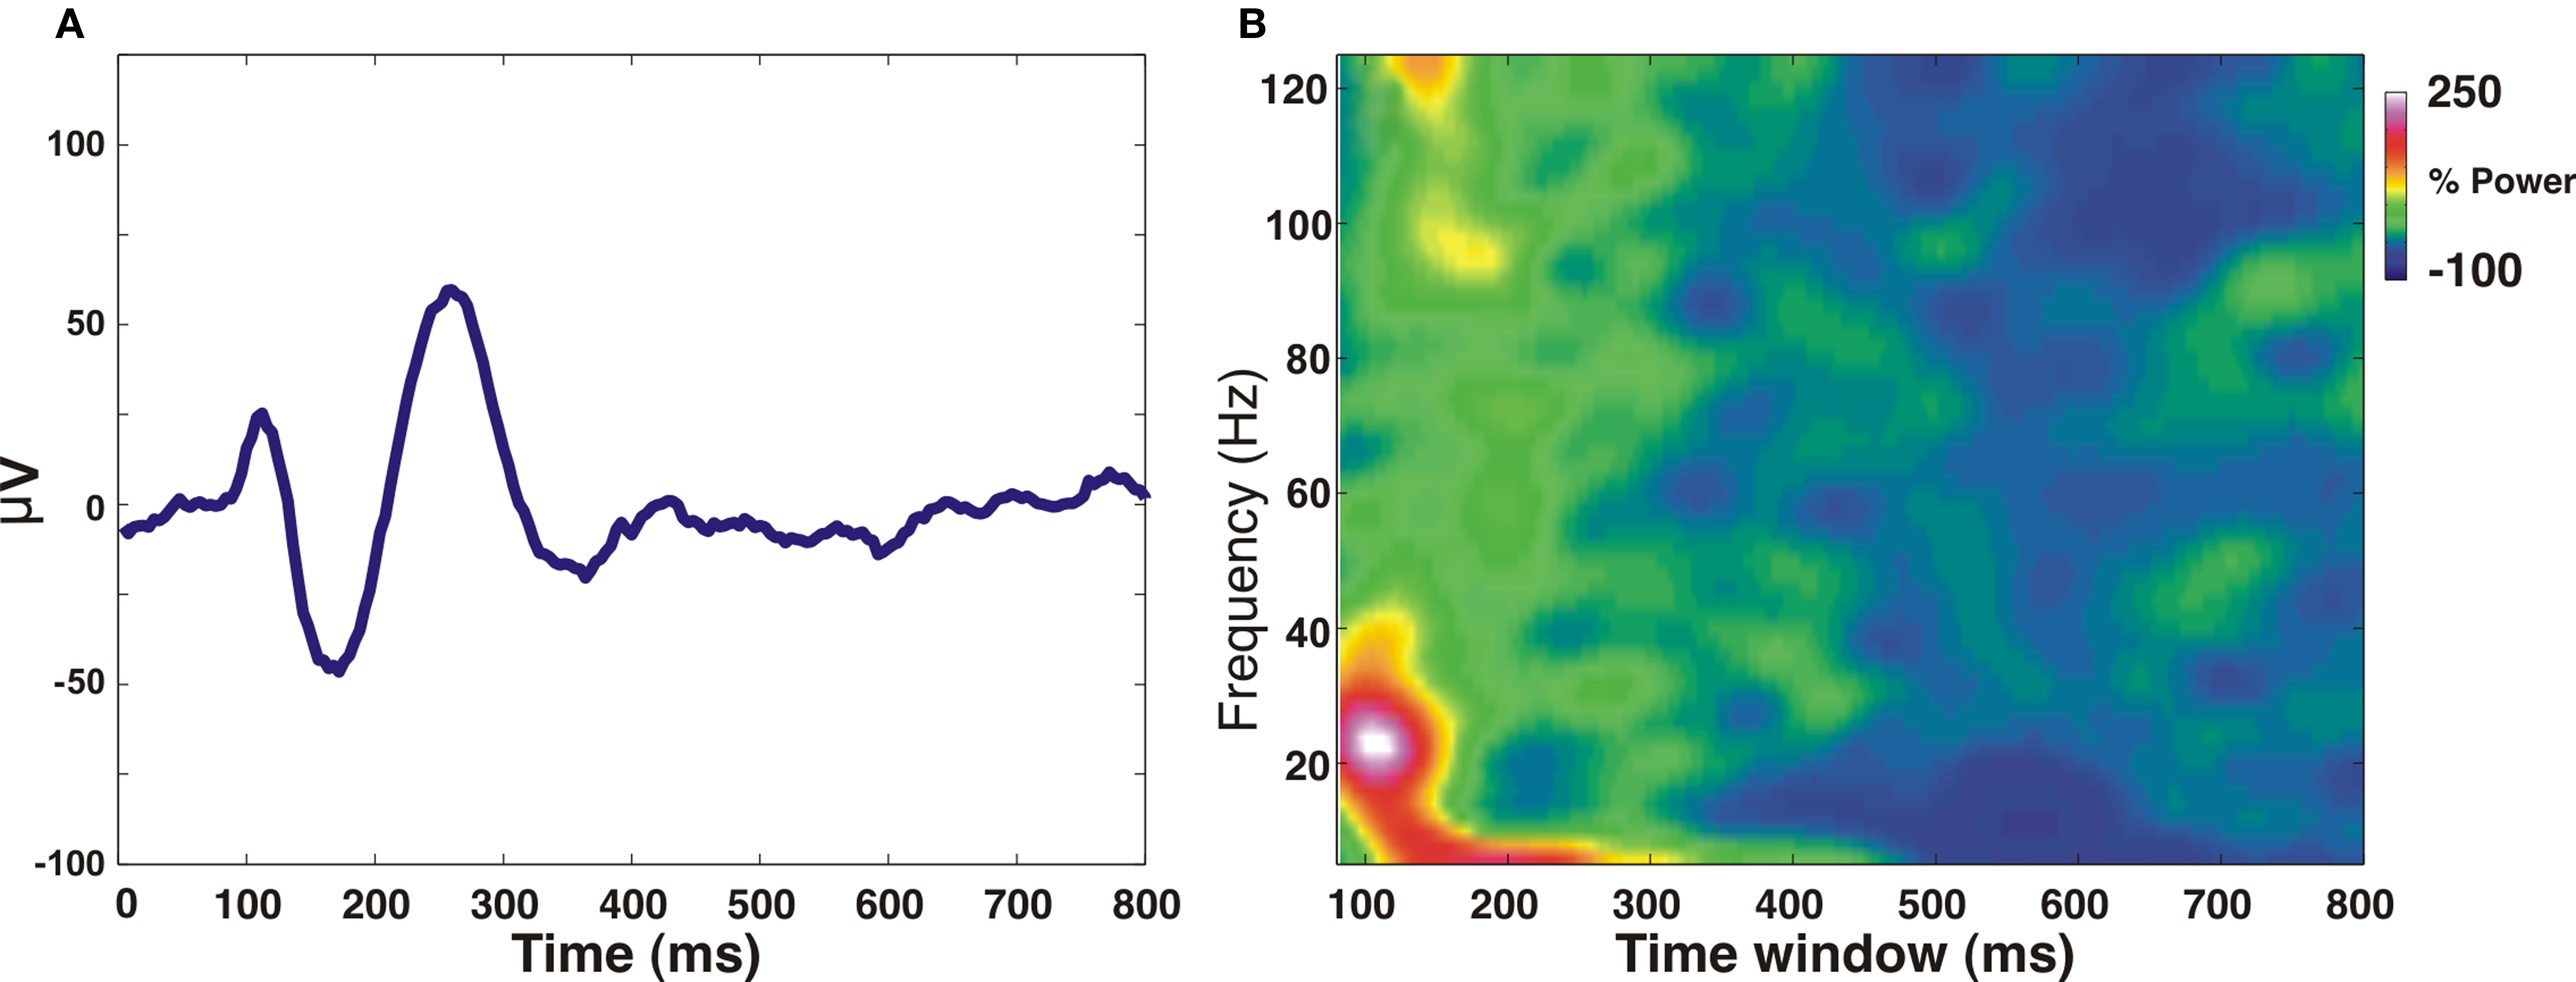
Figure 1. Trial-averaged Local field potential (LFP) changes as a result of “fixation acquire” eye movement, measured in awake monkey V1. LFP was measured using a microelectrode inserted into the upper layers of V1, eccentricity: 1° below the horizontal meridian and 0.5° from the vertical meridian. In each trial, data acquisition started at the very moment (“fixation acquire”: t = 0) when the monkey begun fixating on the fixation dot displayed on an otherwise black CRT screen. (A) The trial-averaged LFP signal (baseline value has been subtracted) shows a clear transient locked to the “fixation acquire” event (t = 0). (B) Time-dependent Fourier transform (spectrogram) analysis of the LFP signal shown in (A). The analysis was done using a sliding hamming window of 160 ms (very similar results were obtained using a sliding window of 80-ms width); LFP power was normalized to baseline activity (t = 1200–1600 ms after acquiring fixation). A clear increase of power can be observed in the low-LFP band (8–50 Hz), much larger than the increase in the high-LFP band (60–120 Hz). Note that, typically, the onset of a visual stimulus induces a substantial gamma band (25-100 Hz) activity (Siegel and König, 2003; Henrie and Shapley, 2005), whereas here this activity is comparatively low, supporting the concept that the measured LFP signals are not (purely) visually evoked.
The first observation suggests that, in stimulated trials, the hemodynamic response function (HRF) is actually the response to a combination of neuronal responses to (at least) two events, which could have some temporal overlap and which are not necessarily coupled with the same strength to the hemodynamic response. Importantly, at the single trial level, the relative amplitude and timing of these neuronal responses might well be different from one trial to another, therefore eliciting different hemodynamic responses – even if the LFP power integrated over a given time interval (e.g., the duration of the stimulus) remains the same. This would question the applicability of the “best neuro-to-hemo fit”, according to which the HRF is obtained (their Supplementary Figure S2) and could explain the low predictive power of the lo-LFP for stimulated trials. The second observation then leads to speculate that – somehow in analogy to Maier’s study, this HRF obtained from stimulated trials is even less applicable to predict hemodynamic responses in the dark, because the neuronal responses are qualitatively different even for the “fixation-only” part, as can be seen by their average (Figure 2A: compare the two bottom panels).
As compared to lo-LFP, in hi-LFP the ratio between fixation-only and stimulus-on activity appears to be much smaller, which would mean that the HRF is more accurate in agreement with the better predictive power of the high part of the LFP frequency spectrum. However, also for hi-LFP, differences can be seen between stimulated and dark trials during the fixation-only part. Although smaller than in the case of lo-LFP, these differences might again explain why predicting the hemodynamic signals in dark trials from HRFs derived from stimulated trials did not work using hi-LFP, either.
What about the dark-fitted HRFs? At the single trial level, it is hard to see any clear change in either spiking activity nor in the power of any of the two considered large LFP bands that could explain the corresponding hemodynamic response. Might some of those such changes become visible upon careful, more narrow band selection of the LFP? Whatever the answer, at the average level, a periodic activity change in the LFP (both in high and low frequencies) during dark trials clearly exists (e.g., the vertical bands in the time-frequency plane in Figure 2A, bottom right). Since also the average hemodynamic responses show the same periodicity, the two signals must be correlated above chance level. Nevertheless, the attempt to predict the hemodynamic responses from these neuronal signals results in a fairly inaccurate hemodynamic time-series (their Supplementary Figures S3 and S7). The most straightforward explanation is a low information content of the electrical recordings, which could result from small spatial sampling and an unfortunate positioning of the microelectrode as suggested by Kleinschmidt and Müller. These hypotheses can be checked directly by careful analysis of the hemodynamic maps, or by measuring, at the same spatial sites, both the neuronal and hemodynamic responses locally (Vanzetta et al., 2010). It should also be kept in mind that neuronal activity in itself is not to be identified with its measurement, which, depending on the method used, can emphasizes certain aspects while missing others. For instance, voltage-sensitive dye (VSD) signals have been obtained at cortical locations from which clear LFP responses were absent (Devor et al., 2007), possibly because VSD signals are very sensitive to polarization changes in layer 1, and, in contrast to LFP, they do not have constrains related to the geometry of currents.
Another – more speculative – possibility is that instantaneous firing rate, LFP activity power and the like might not always be the correct neuronal counterpart to a hemodynamic response, in particular in the presence of complex modulatory phenomena involving enhancement and suppression, such as attention. It might be possible that a different, more specific selection of LFP bands would allow to better capture such phenomena (e.g., could the LFP power suppression observed between 10 and 20 Hz both in stimulated and dark trials predict a brightening of the cortex? See Figure 2 in Sirotin and Das’ paper, as well as the comments by Kleinschmidt and Müller, 2010).
Importantly, inhibitory and excitatory neurons might be coupled differently to hemodynamics, and the relative weight of excitatory and inhibitory neurons might even be different in each trial – in particular in attention-involving tasks, from which some degree of intrinsic variability is difficult to eliminate. If this should turn out to be true, correctly selecting the “elementary” neuronal event from which to extract an HRF able to predict a measured hemodynamic time-series might be very difficult, if not impossible. Yet, this would still not suffice to invalidate the long-standing assumption of coupling between hemodynamic responses and local electrical activity. For instance, the neuronal correlates to the trial-related hemodynamic signal might be found in neuronal correlations (as was suggested by Nir et al., 2007) or in other more complex encoding of neuronal activity (firing patterns, coherence, etc.). Innovative technologies such as optogenetics (Gunaydin et al., 2010), which has recently been coupled with fMRI (Lee et al., 2010), might turn out to be very valuable to provide evidence for the existence or not of such specific links between the hemodynamic response and activation of specific neuronal populations – including that of remote monoaminergic ones (Attwell and Iadecola, 2002).
Acknowledgments
We thank Hadar Edelman and Ariel Gilad for sharing their data, and Drs. Christian G. Bénar, Guillaume S. Masson and Rafael Malach for discussions and feedback on the manuscript.
References
Attwell, D., and Iadecola, C. (2002). The neural basis of functional brain imaging signals. Trends Neurosci. 25, 621–625.
Choi, J. K., Chen, Y. I., Hamel, E., and Jenkins, B. G. (2006). Brain hemodynamic changes mediated by dopamine receptors: role of the cerebral microvasculature in dopamine-mediated neurovascular coupling. Neuroimage 30, 700–712.
Devor, A., Tian, P., Nishimura, N., Teng, I. C., Hillman, E. M., Narayanan, S. N., Ulbert, I., Boas, D. A., Kleinfeld, D., and Dale, A. M. (2007). Suppressed neuronal activity and concurrent arteriolar vasoconstriction may explain negative blood oxygenation level-dependent signal. J. Neurosci. 27, 4452–4459.
Gunaydin, L. A., Yizhar, O., Berndt, A., Sohal, V. S., Deisseroth, K., and Hegemann, P. (2010). Ultrafast optogenetic control. Nat. Neurosci. 13, 387–392.
Heinemann, L., Kleinschmidt, A., and Müller, N. G. (2009). Exploring BOLD changes during spatial attention in non-stimulated visual cortex. PLoS One 4, e5560. doi: 10.1371/journal.pone.0005560.
Henrie, J. A., and Shapley, R. (2005). LFP power spectra in V1 cortex: the graded effect of stimulus contrast. J. Neurophysiol. 94, 479–490.
Kagan, I., Gur, M., and Snodderly, D. M. (2008). Saccades and drifts differentially modulate neuronal activity in V1: effects of retinal image motion, position, and extraretinal influences. J. Vis. 8, 1–25.
Kleinschmidt, A., and Müller, N. G. (2010). The blind, the lame, and the poor signals of brain function–a comment on Sirotin and Das (2009). Neuroimage 50, 622–625.
Lee, J. H., Durand, R., Gradinaru, V., Zhang, F., Goshen, I., Kim, D. S., Fenno, L. E., Ramakrishnan, C., and Deisseroth, K. (2010). Global and local fMRI signals driven by neurons defined optogenetically by type and wiring. Nature 465, 788–792.
Maier, A., Wilke, M., Aura, C., Zhu, C., Ye, F. Q., and Leopold, D. A. (2008). Divergence of fMRI and neural signals in V1 during perceptual suppression in the awake monkey. Nat. Neurosci. 11, 1193–1200.
Nir, Y., Fisch, L., Mukamel, R., Gelbard-Sagiv, H., Arieli, A., Fried, I., and Malach, R. (2007). Coupling betwee -neuronal firing rate, gamma LFP, and BOLD fMRI is related to interneuronal correlations. Curr. Biol. 17, 1275–1285.
Phillipson, O. T., Kilpatrick, I. C., and Jones, M. W. (1987). Dopaminergic innervation of the primary visual cortex in the rat, and some correlations with human cortex. Brain Res. Bull. 18, 621–633.
Schultz, W. (2007). Multiple dopamine functions at different time courses. Annu. Rev. Neurosci. 30, 259–288.
Schummers, J., Yu, H., and Sur, M. (2008). Tuned responses of astrocytes and their influence on hemodynamic signals in the visual cortex. Science 320, 1638–1643.
Siegel, M., and König, P. (2003). A functional gamma-band defined by stimulus-dependent synchronization in area 18 of awake behaving cats. J. Neurosci. 23, 4251–4260.
Sirotin, Y. B., and Das, A. (2009). Anticipatory haemodynamic signals in sensory cortex not predicted by local neuronal activity. Nature 457, 475–479.
Slovin, H., Arieli, A., Hildesheim, R., and Grinvald, A. (2002). Long-term voltage-sensitive dye imaging reveals cortical dynamics in behaving monkeys. J. Neurophysiol. 88, 3421–3438.
Tan, C. O. (2009). Anticipatory changes in regional cerebral hemodynamics: a new role for dopamine? J. Neurophysiol. 101, 2738–2740.
Vanzetta, I., Flynn, C., Ivanov, A. I., Bernard, C., and Bénar, C. G. (2010). Investigation of linear coupling between single-event blood flow responses and interictal discharges in a model of experimental epilepsy. J. Neurophysiol. 103, 3139–3152.
Citation: Vanzetta I and Slovin H (2010) A BOLD assumption. Front. Neuroenerg. 2:24. doi: 10.3389/fnene.2010.00024
Received: 01 July 2010;
Accepted: 16 July 2010;
Published online: 05 August 2010
Copyright: © 2010 Vanzetta and Slovin. This is an open-access article subject to an exclusive license agreement between the authors and the Frontiers Research Foundation, which permits unrestricted use, distribution, and reproduction in any medium, provided the original authors and source are credited.
*Correspondence: aXZvLnZhbnpldHRhQGluY20uY25ycy1tcnMuZnI=