


- 1 Center for Biomedical Imaging, Ecole Polytechnique Fédérale de Lausanne, Lausanne, Switzerland
- 2 Faculty of Biology and Medicine, University of Lausanne, Lausanne, Switzerland
- 3 Department of Radiology, University of Lausanne, Lausanne, Switzerland
- 4 Department of Radiology, University of Geneva, Geneva, Switzerland
Cerebral metabolism is compartmentalized between neurons and glia. Although glial glycolysis is thought to largely sustain the energetic requirements of neurotransmission while oxidative metabolism takes place mainly in neurons, this hypothesis is matter of debate. The compartmentalization of cerebral metabolic fluxes can be determined by 13C nuclear magnetic resonance (NMR) spectroscopy upon infusion of 13C-enriched compounds, especially glucose. Rats under light α-chloralose anesthesia were infused with [1,6-13C]glucose and 13C enrichment in the brain metabolites was measured by 13C NMR spectroscopy with high sensitivity and spectral resolution at 14.1 T. This allowed determining 13C enrichment curves of amino acid carbons with high reproducibility and to reliably estimate cerebral metabolic fluxes (mean error of 8%). We further found that TCA cycle intermediates are not required for flux determination in mathematical models of brain metabolism. Neuronal tricarboxylic acid cycle rate (VTCA) and neurotransmission rate (VNT) were 0.45 ± 0.01 and 0.11 ± 0.01 μmol/g/min, respectively. Glial VTCA was found to be 38 ± 3% of total cerebral oxidative metabolism, accounting for more than half of neuronal oxidative metabolism. Furthermore, glial anaplerotic pyruvate carboxylation rate (VPC) was 0.069 ± 0.004 μmol/g/min, i.e., 25 ± 1% of the glial TCA cycle rate. These results support a role of glial cells as active partners of neurons during synaptic transmission beyond glycolytic metabolism.
Introduction
Cerebral function depends on coordinated interaction of distinct cell types, namely neurons and glial cells, and relies on high metabolic activity that is supported by continuous and adequate supply of glucose and oxygen from the blood stream (Siesjo, 1978). Regulation of neuronal-glial cooperation at metabolic level involves the mechanism of deactivation of the major excitatory neurotransmitter, glutamate, through glial uptake and conversion to electrophysiologically inactive glutamine, which is then transported back to the neuron to replenish the neurotransmitter pool of glutamate (see revision by Zwingmann and Leibfritz, 2003). The maintenance of this exchange of glutamate and glutamine between neurons and glia requires energy provided by glucose oxidation in glycolysis and tricarboxylic acid (TCA) cycle (e.g., Sibson et al., 1998).
Although brain activity relies on blood glucose, it is not excluded the possibility of lactate exchange between metabolic compartments. In fact, a putative lactate shuttle is thought to exist from astrocytes to neurons (Magistretti et al., 1999). According to this hypothesis, most glucose is oxidized to lactate in astrocytes and the resulting adenosine-5′-triphosphate (ATP) suffices to maintain glutamate clearance from the synaptic cleft and conversion to glutamine. The produced lactate is transferred to neurons for oxidative degradation (Pellerin and Magistretti, 1994; Magistretti et al., 1999). Based on this hypothesis, glial metabolism has been thought to be mostly glycolytic (Sibson et al., 1998; Shulman et al., 2003), which is controversial (e.g., Dienel and Hertz, 2001; Gjedde and Marrett, 2001; Simpson et al., 2007; Mangia et al., 2009). Furthermore, astrocytic uptake of glutamate could also be fueled by ATP of mitochondrial origin (Dienel and Hertz, 2001) and, in fact, the glial TCA cycle was found to account for 30% of total TCA cycle activity in the conscious rat brain (Oz et al., 2004). A substantial fraction of mitochondrial oxidation in astrocytes occurs through pyruvate carboxylase and was suggested to increase with cerebral activity (Sibson et al., 1998; Choi et al., 2002; Oz et al., 2004).
The compartmentalization of these metabolic pathways and inter-compartmental interactions have been studied by non-invasive 13C nuclear magnetic resonance (NMR). Dynamic in vivo 13C NMR spectroscopy combined with the infusion of 13C-enriched substrates and followed by appropriate mathematical modeling was proved to be a powerful tool for studying the compartmentalized cerebral metabolism. Although brain cells have the ability of using several substrates, glucose is well established as the main fuel for cerebral metabolism (Siesjo, 1978). The most determined metabolic rates upon infusion of 13C-enriched glucose include glucose utilization (CMRglc), neuronal, and glial TCA cycles (VTCA), the malate–aspartate shuttle activity (Vx), apparent neurotransmission flux (VNT), i.e., glutamate–glutamine cycle, and glial anaplerotic pyruvate carboxylation (VPC) (e.g., Sibson et al., 1998; Gruetter et al., 2001; Oz et al., 2004; Patel et al., 2005). However, strong debate is continuously generated on the relative values for these metabolic fluxes and how should they be properly determined (Shestov et al., 2007; Uffmann and Gruetter, 2007; Shen et al., 2009). Many assumptions are generally used for in vivo determination of metabolic fluxes and concern has been raised on the reliability of estimated fluxes from experiments using 13C-enriched glucose as metabolic tracer (Shestov et al., 2007; Shen et al., 2009).
We tested the hypothesis that high sensitivity and resolution achieved in 13C NMR spectra at 14.1 T leads to increased reliability in detected 13C enrichment time courses and thus allows us to determine accurate metabolic fluxes. In fact, the present data was acquired with high temporal resolution, during approximately 6 h and with low noise level, which are conditions required for accurate flux estimation (Shestov et al., 2007). In addition, although most mathematical models were designed with many unknown metabolic pools, namely for TCA cycle intermediates, a simplification has been proposed and resulted in a mathematical model where flux estimation is mostly dependent on 13C enrichment of measured metabolites (Uffmann and Gruetter, 2007). The comparison between these two approaches was now performed. For the first time we show experimental evidence supporting that TCA cycle intermediates are not required in mathematical models of cerebral metabolism, as previously suggested by mathematical simulations (Uffmann and Gruetter, 2007).
In this study, metabolic fluxes were determined with higher precision than in previous 13C NMR studies in the brain of rodents (e.g., Choi et al., 2002; Patel et al., 2005) or humans (e.g., Gruetter et al., 2001), as depicted by an average associated error of 8%. We identified substantial pyruvate carboxylation and glial TCA cycle rates that together accounted for more than half of neuronal VTCA, suggesting high glial oxidative metabolism.
Materials and Methods
Animals
All experimental procedures involving animals were approved by the local ethics committee. Male Sprague-Dawley rats (276 ± 11 g, n = 5, obtained from Charles River Laboratoires, France) were prepared as previously described (Duarte et al., 2009a). Briefly, after fasting for 6 h, rats were anesthetized using 2% isoflurane (Attane, Minrad, NY, USA) in 30% oxygen in air, and then intubated with an endotracheal catheter and ventilated with a pressure-driven ventilator (MRI-1, CWE incorporated, PA, USA). Catheters were inserted into a femoral artery for monitoring blood gases, glucose, lactate, and arterial blood pressure, and into a femoral vein for infusion of saline solutions containing α-chloralose (Acros Organics, Geel, Belgium) or [1,6-13C]glucose (Isotec, Sigma-Aldrich, Basel, Switzerland).
Animals were immobilized in a homebuilt holder with a bite bar and two ear inserts to minimize potential motion. Body temperature was maintained between 37.0 and 37.5°C with a warm water circulation system based on the feedback obtained from a homebuilt rectal temperature probe. Arterial blood pressure, heart rate, and respiratory rate were continuously monitored with an animal monitoring system (SA Instruments, NY, USA). Before inserting the animal in the bore of the magnet, anesthesia was switched to α-chloralose (intravenous bolus of 80 mg/kg and continuous infusion rate of 28 mg/kg/h). Arterial pH and pressures of O2 and CO2 were measured using a blood gas analyzer (AVL Compact 3, Diamond Diagnostics, MA, USA). Plasma glucose and lactate concentrations were quantified with the glucose or lactate oxidase methods, respectively, using two multi-assay analyzers (GW7 Micro-Stat, Analox Instruments, London, UK).
The glucose infusion procedure was adapted from the protocol described by Henry et al. (2003a). Briefly, a bolus of 99.9% enriched [1,6-13C]glucose (1.1 M in saline solution) was given at a 5-min exponential decay based on the measured basal glycemia and aiming at 70% plasma fractional enrichment (FE). After the bolus, 70% enriched [1,6-13C]glucose (1.1 M in saline solution) was infused at a rate equivalent to the whole body glucose disposal rate of 33.2 mg/kg/min (Jucker et al., 2002) and adjusted based on concomitantly measured arterial plasma glucose concentrations. Plasma samples were stored at −80°C for determination of substrate FE. Arterial pH and blood gases were maintained within the normal physiological range by adjusting respiratory rate and volume.
In vivo NMR Spectroscopy
All in vivo NMR experiments were carried out in a DirectDrive spectrometer (Varian, Palo Alto, CA, USA) interfaced to a 14.1 T magnet with a 26-cm horizontal bore (Magnex Scientific, Abingdon, UK), using a homebuilt coil consisting of a 1H quadrature surface coil and a 13C linearly polarized surface coil. The rat brain was positioned in the isocenter of the magnet and fast-spin-echo images with repetition time of 5 s, echo time of 52 ms and echo train length of eight allowed to identify anatomical landmarks, which were used to place the volume of interest (VOI) of 320 μL in the brain. Shimming was performed with FAST(EST)MAP (Gruetter and Tkác, 2000). Localized 1H NMR spectra were acquired using SPECIAL (Mlynárik et al., 2006) with echo time of 2.8 ms and repetition time of 4 s. 13C NMR spectra were acquired using semi-adiabatic distortionless enhancement by polarization transfer (DEPT) combined with 3D-ISIS 1H localization (Henry et al., 2003a).
Spectral analysis was carried out using LCModel (Stephen Provencher Inc., Oakville, ON, Canada) for both 1H (Mlynárik et al., 2006) and 13C NMR spectra (Henry et al., 2003b). Simulation of basis spectra for the observable isotopomers was performed in Matlab (The MathWorks, Natick, MA, USA) as described by Henry et al. (2003b). The scaling of dynamically measured 13C concentrations was based on the FE of glutamate C3, which was determined through the multiplicity of glutamate C4, and the total glutamate concentration obtained from 1H NMR spectra. In other words, FE of glutamate C3 was determined from the C4 resonance in 13C spectra from the last 20 min, assuming steady-state for C4 enrichment and FE(C3) = C4D34/(C4S + C4D34). Then, relative intensities in 13C NMR spectra were used to scale 13C concentration for all carbon resonances through all time courses. Additionally, in vitro13C NMR spectra from brain extracts and standard solutions including the metabolites of interest allowed correcting for the relative differences in signal enhancement by polarization transfer in DEPT.
In vitro NMR Spectroscopy
After each experiment, rats were sacrificed using a focused microwave fixation device (Gerling Applied Engineering, Inc., Modesto, CA, USA) at 4 kW for 2 s. Brain tissue excluding cerebellum was immediately stored at −80°C until extraction. Water-soluble metabolites from brain and plasma samples were extracted with 7% (v/v) perchloric acid (PCA) as previously described (Duarte et al., 2007) and dried with a sample concentrator (SpeedVac DNA 120, Thermo Fisher Scientific, Wohlen, Switzerland). The dried extracts were dissolved in 2H2O (99.9% 2H, Sigma-Aldrich) and 1.2 mmol sodium fumarate (Sigma-Aldrich) was added as internal standard for quantification by 1H NMR spectroscopy. 1H and 13C NMR spectra were acquired on a 14.1 T DRX-600 spectrometer equipped with a 5-mm cryoprobe (Bruker BioSpin SA, Fallanden, Switzerland) as previously described (Duarte et al., 2007). Peak areas were quantified by curve fitting.
Determination of Metabolic Fluxes
Kinetic modeling of [1,6-13C]glucose metabolism was performed with basis on the mathematical model of compartmentalized cerebral metabolism described by Gruetter et al. (2001). Figure 1 depicts metabolic pools and fluxes defined in our model, which is detailed in Section “Appendix.” An alternative model was designed to eliminate the non-measurable 13C enrichment of TCA cycle intermediates (Uffmann and Gruetter, 2007).
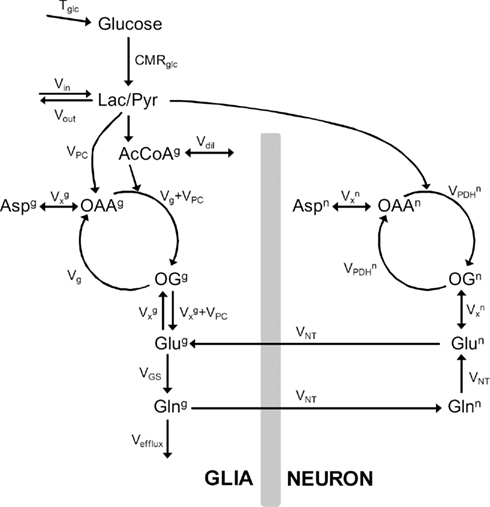
Figure 1. Model of compartmentalized brain metabolism adapted from Gruetter et al. (2001). Glucose transport is here represented by Tglc. CMRglc is the cerebral metabolic rate of glucose. Pyruvate (Pyr) originated from glucose consumption is in fast equilibrium with lactate (Lac) that is exchanged between neurons and glia and is diluted with extra-cerebral lactate through Vout/Vin.  is the neuronal TCA cycle, Vg + VPC is the total glial TCA cycle, VPC is the rate of pyruvate carboxylase. In the glial compartment, the dilution of label at the level of acetyl-CoA (AcCoA) by glial specific substrates is accounted by Vdil. TCA cycle intermediates oxaloacetate (OAA) and 2-oxoglutarate (OG) exchange with aminoacids through the exchange flux VX. The apparent glutamatergic neurotransmission (i.e., glutamate–glutamine cycle) is VNT and glutamine synthetase rate is VGS. Finally, efflux of labeling from the metabolic system occurs through the rate of glial glutamine loss Vefflux. The superscripts g and n distinguish metabolic pools or fluxes in the glial and neuronal compartments, respectively.
Each model was fitted to the 13C enrichment curves over time using the Levenberg–Marquardt algorithm for non-linear regression, coupled to a Runge–Kutta method for non-stiff systems to obtain numerical solutions of the ordinary differential equations (see Appendix). Significance of the fitted parameters (fluxes) was inferred from t-statistics. F-statistics was used for assessment of fit quality and for inter-model comparison. Reliability of determined fluxes was evaluated by Monte-Carlo analysis, in which Gaussian noise with the same variance of fit residuals was added to the best fit and initial conditions were randomly generated within confidence interval of the obtained value. Typically, 500 simulated datasets were created for each individual analysis. All numerical procedures were performed in Matlab.
The estimated metabolic fluxes are shown as mean ± SD, being the SD resulting from Monte-Carlo simulations. Other results are shown as mean ± SEM of n = 5 experiments.
Results
The specific protocol of 13C-enriched glucose infusion raised plasma glucose from 100 to 350 mg/dL in 5 min and then remained constant (Figure 2A), leading to a step function in plasma glucose FE of ∼70% (Figure 2B). Concentration of lactate in plasma varied during the experiment as consequence of the variable glucose infusion rate that aimed at a stable plasma glucose level (Figure 2A). FE of lactate increased at the onset of [1,6-13C]glucose and was maintained constant over time (Figure 2B), and may contribute to brain metabolism. For example, at the end of the experiment, the FE of plasma glucose and lactate were 0.67 ± 0.01 and 0.50 ± 0.01, respectively. FE in plasma alanine and acetate increased over the experimental time course and seemed to reach a steady-state after 300 min, respectively achieving a FE of 0.45 ± 0.02 and 0.33 ± 0.01 (Figure 2C). Therefore, the influx of 13C labeling from extra-cerebral lactate and acetate was included in the model (see Appendix). Plasma alanine was considered to have minor contribution to brain metabolism since it exists at only 11.2 ± 3.2% of lactate concentration (quantified in PCA extracts of plasma samples by in vitro NMR spectroscopy). This is further supported by the relative low rate of alanine transport into the brain and contribution to metabolism (Bröer et al., 2007).
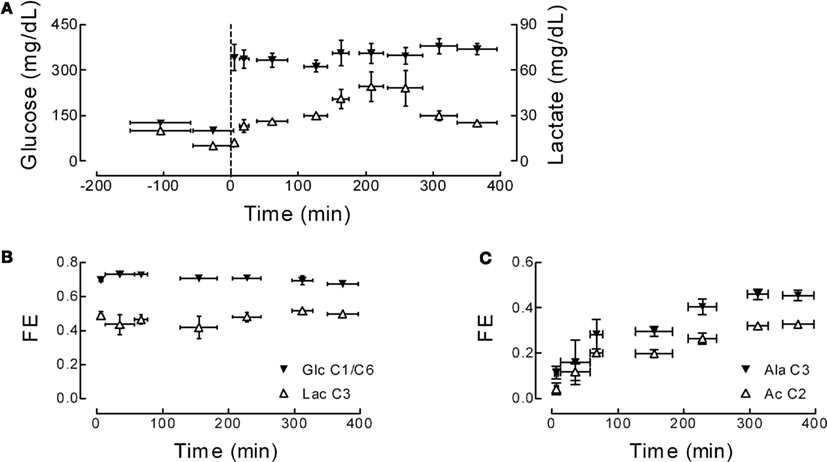
Figure 2. Concentration and fractional enrichment (FE) of plasma glucose, lactate, alanine, and acetate upon infusion of [1,6-13C]glucose. (A) Shows glucose (filled symbols) and lactate (open symbols) concentration determined during the entire time course. (B) Depicts FE of glucose and lactate determined by in vitro1H NMR spectroscopy. FE of alternative brain substrates alanine and acetate were determined in 1H NMR spectra of plasma samples (C).
The in vivo spectral quality achieved at 14.1 T can be appreciated from Figure 3. A major improvement was the increased sensitivity relative to lower fields and the full separation of the carbon positions of glutamate and glutamine C3 which was not possible at, for example, 9.4 T (Henry et al., 2003b). The 13C resonances of glucose, glutamate, glutamine, and aspartate were determined with a temporal resolution of 5.3 min (Figures 3 and 4). Total concentration of these amino acids was determined in vivo and found to be 8.5 ± 0.4 μmol/g for glutamate, 5.1 ± 0.5 μmol/g for glutamine, and 2.4 ± 0.3 μmol/g for aspartate.
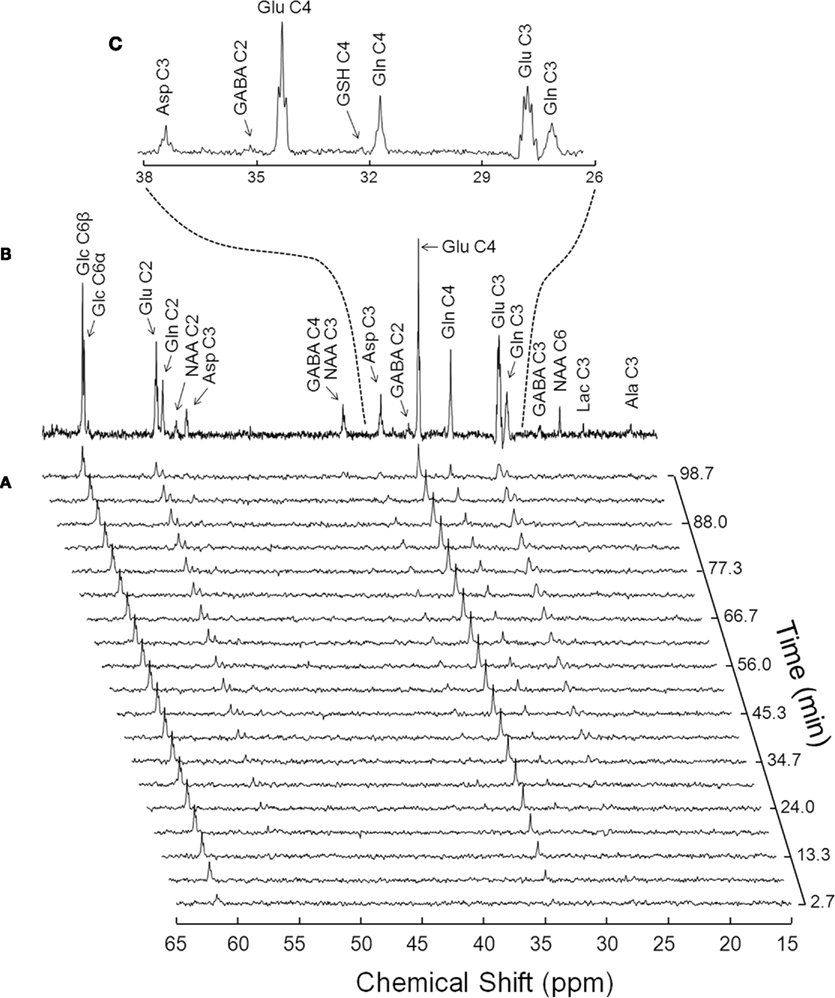
Figure 3. Typical in vivo 13C NMR spectra acquired at 14.1 T from a 320-μ L volume in the rat brain upon infusion of [1,6-13C]glucose. (A) Shows the initial 100 min of a time course of 13C enrichment of brain metabolites from plasma [1,6-13C]glucose, with a temporal resolution of 5.3 min (128 scans with TR of 2.5 s). The spectrum in (B) was acquired for 1.8 h, starting 3.5 h after the onset of [1,6-13C]glucose infusion. (C) Depicts the expansion of (B) from 26 to 38 ppm, where are visible the multiplets originated by the different isotopomers of glutamine (Gln), glutamate (Glu), and aspartate (Asp). For resolution enhancement, Lorentzian–Gaussian apodization was applied before Fourrier transformation [lb = 7, sb = 0.12, and sbs = 0.02 for (A); sb = 0.12 and sbs = 0.02 for (B,C)].
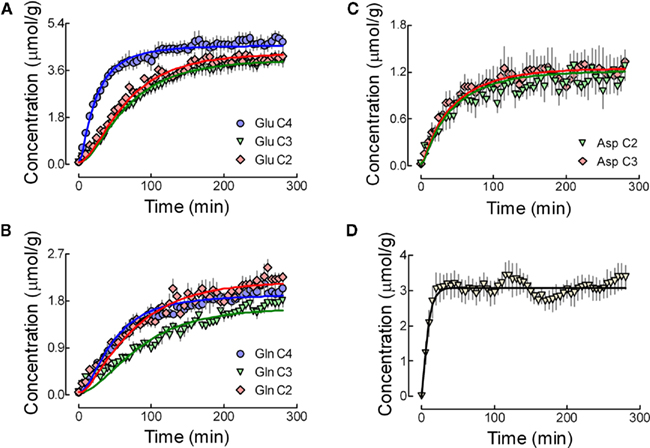
Figure 4. Concentration of enriched glutamate (A), glutamine (B), and aspartate (C) carbons detected in vivo during infusion of [1,6-13C]glucose. For glutamate and glutamine, blue, green, and red lines represent best fit to the 13C enrichment curves for C4, C3, and C2, respectively. For aspartate, green and red lines depict C2 and C3. Exact overlap was observed for the best fit curves with both metabolic models, i.e., with and without the inclusion of TCA cycle intermediates. This particular fits were performed with the inclusion of aspartate resonances. Although some experiments were conducted over a longer period (Figure 2), the data used for flux estimation was averaged for 280 min. (D) Shows the concentration of glucose C6 determined in vivo and the fit result of the dynamic reversible Michaelis–Menten model described in Duarte et al. (2009b).
In brain extracts, prepared at the end of the experiment, FE was 0.70 ± 0.02 for glucose, 0.53 ± 0.02 for lactate, and 0.54 ± 0.01 for alanine. Therefore, a significant dilution flux Vout must occur, leading to different FE in brain glucose and the end products of glycolysis, namely lactate. Lactate homeostasis resides in a balance between production, consumption and exchange between brain parenchyma, and extra-cerebral lactate equivalents. Plasma lactate was labeled at a different enrichment than that of plasma glucose (Figure 2), thus contributing to brain lactate through Vin. However, the redundancy between contributions of [1,6-13C]glucose and [3-13C]lactate enriched at different levels to metabolism in mitochondria leads to a high correlation between Vout, glucose transport (Tmax), and consumption (CMRglc) (Figure 5). Therefore, glucose transport was determined from the experimental data with a dynamic version of the reversible Michaelis–Menten model described by Duarte et al. (2009b) and transport parameters used to simulate glucose transport that feeds the pyruvate pool: Tmax = 0.91 ± 0.03 μmol/g/min, CMRglc = 0.50 ± 0.02 μmol/g/min, and Kt = 0.32 ± 0.10 mM. The constraint of parameters directly involved in glucose homeostasis was devoid of significant effects on the remaining metabolic fluxes, with the obvious exception of Vout.
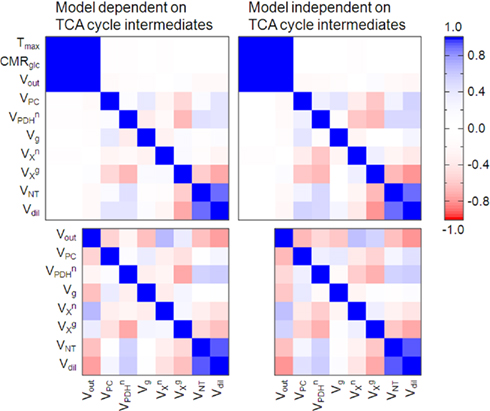
Figure 5. Correlation matrices showing the covariances between estimated metabolic fluxes. Metabolic modeling was performed with all measurable 13C enrichment curves for glutamate, glutamine, and aspartate either including (left plots) or excluding (right plots) TCA cycle intermediate pools. Due to high correlation found between Tmax, CMRglc, and Vout, glucose transport kinetics was then determined as described in Duarte et al. (2009b) and simulated in the present model (bottom matrices).
The compartmentalized model of brain metabolism previously proposed (Gruetter et al., 2001) was adapted to include a non-zero concentration of aspartate in the glial compartment and a dilution factor at the level of glial acetyl-CoA (see Appendix). Non-linear regression of the model to the determined 13C enrichment curves is shown in Figure 4. Following the suggestion that TCA cycle intermediates can be excluded from the mathematical model, at least for the non-compartmentalized case (Uffmann and Gruetter, 2007), we further tested the fit of such model (derived in Appendix) with successful results. In any of the cases, the non-linear regressions were performed without imposing any constraint to the eight fluxes of intermediary metabolism that were estimated. Precision of the estimated fluxes was determined by Monte-Carlo simulations and the resulting probability was fitted with a gamma function that, for all estimated fluxes, approached a Gaussian distribution. For the sake of comparison, estimated fluxes with both models are shown in Table 1. As the increasing number of experimental 13C enrichment time courses used in the fitting process may increase the accuracy of estimated fluxes, as suggested by numerical simulations (Shestov et al., 2007), we fitted both models providing or not the aspartate C2 and C3 turnover curves (Table 1). Although increased precision was found to be associated with the number of fitted 13C enrichment curves, estimated fluxes did not diverge significantly.
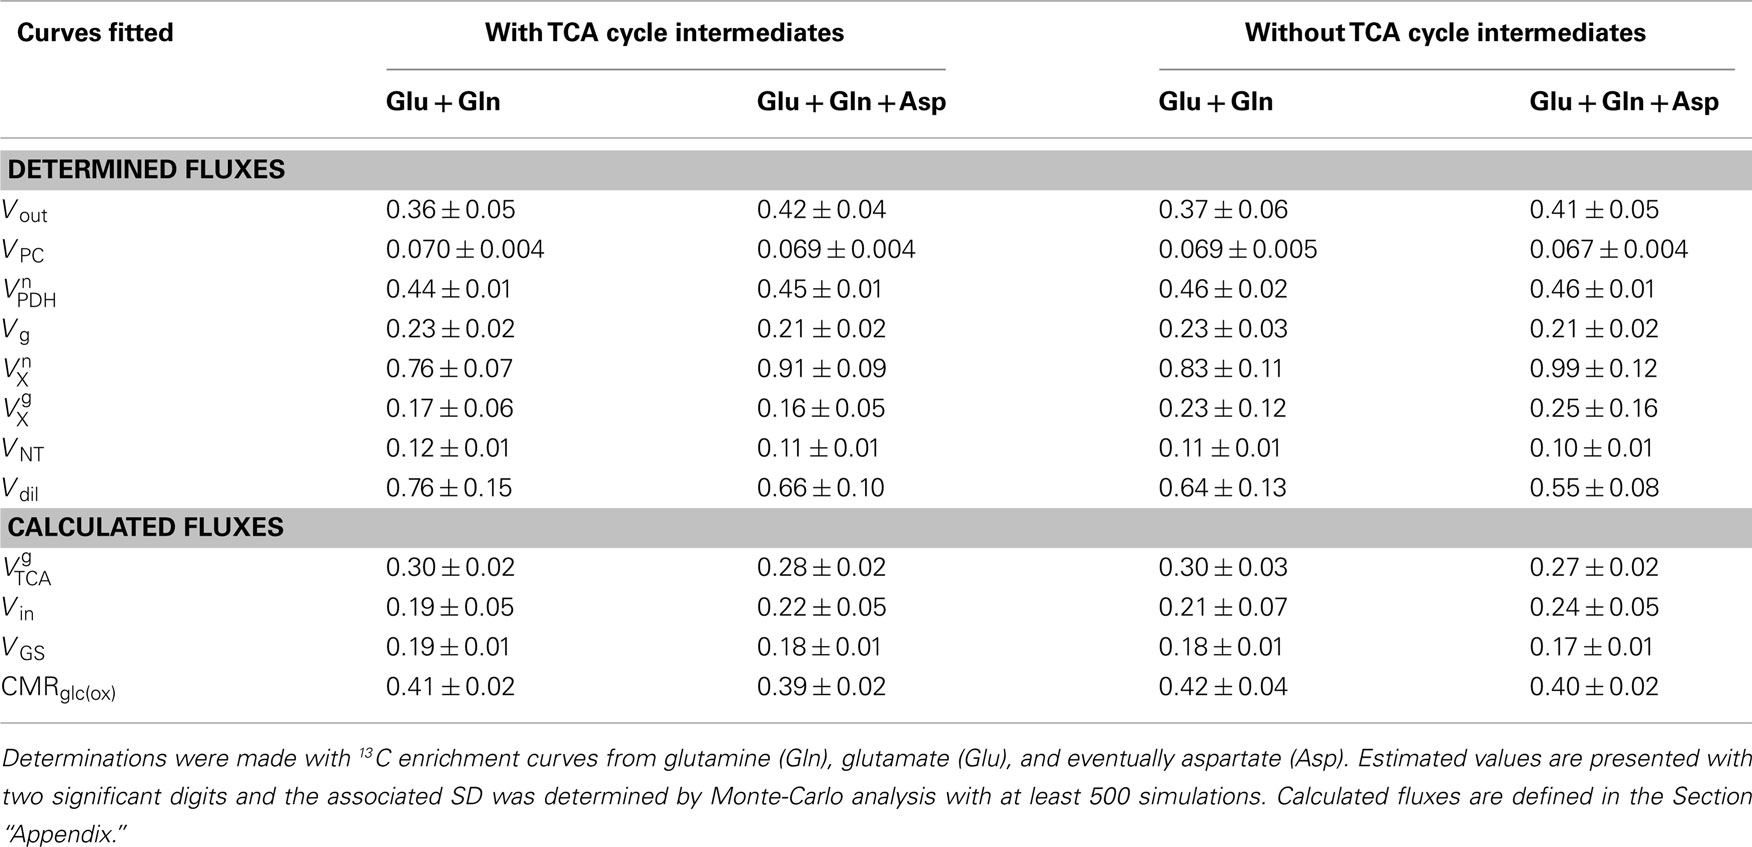
Table 1. Cerebral metabolic fluxes (in μmol/g/min) determined either including or excluding TCA cycle intermediates.
For the most complete model, i.e., including TCA cycle intermediates and fitted to 13C enrichment curves of glutamate, glutamine, and aspartate, the TCA cycle VTCA was 0.45 ± 0.01 μmol/g/min and 0.28 ± 0.02 μmol/g/min the neuronal and glial compartments, respectively. Notably, the flux though the malate–aspartate shuttle Vx was in the same order of VTCA. Pyruvate carboxylation VPC was 0.069 ± 0.004 μmol/g/min, accounting for specific labeling of glutamate and glutamine C2. The neurotransmission flux VNT of 0.11 ± 0.01 μmol/g/min is, in our model, the responsible for labeling exchange between the two compartments. These fluxes were not statistically different between the different analyses (Table 1).
Discussion
Compartmentalized brain energy metabolism was determined following infusion of [1,6-13C]glucose and direct detection of 13C enrichment of brain metabolites by high resolution 13C NMR spectroscopy at 14.1 T. High sensitivity was achieved in this study and permitted to quantify 13C enrichment curves of brain amino acid carbons with high reproducibility and to reliably determine cerebral metabolic fluxes, as indicated by the mean error of 8% associated to the determined fluxes (Table 1). For the first time to our knowledge, we used 13C turnover curves determined in vivo in the rat brain for all aliphatic carbons of glutamate, glutamine, and aspartate for metabolic modeling, similarly to what was performed for the human brain (Gruetter et al., 2001). This, together with the high temporal resolution and long time course of the detected 13C enrichment, increased the level of precision of the measured metabolic fluxes (Shestov et al., 2007). For the determined metabolic fluxes, although similar results were obtained in the absence or inclusion of aspartate 13C enrichment curves in the fitting process, precision generally increased with the number of used turnover curves, especially when TCA cycle intermediates are absent from the model (see Table 1).
Uffmann and Gruetter (2007) previously demonstrated by means of numerical simulations that the unknown in vivo 13C enrichment time courses of TCA cycle intermediates can be neglected using a single compartment model of brain metabolism. We now extended that model to include the two main cerebral metabolic compartments (glial and neuronal compartments) and found similar results in the absence or presence of TCA cycle intermediates in the mathematical model. In fact, similar metabolic fluxes were estimated with the two approaches and identical best fit curves were obtained. However, without the intermediates, increased correlation between the estimated fluxes was observed (Figure 5). This is caused by the fact that metabolic fluxes are directly combined in products and quotients in the derived equations.
Recent publications restricted the analysis of cerebral intermediary metabolism by in vivo 13C NMR spectroscopy to resonances C4 and C3 and disregarded the C2 of glutamate and glutamine, which may be principally due to low resolution of acquired 13C NMR spectra or to the use of indirect detection of 13C enrichment in 1H NMR spectra (de Graaf et al., 2003; Patel et al., 2010; van Eijsden et al., 2010; Xin et al., 2010). Indirect 13C detection has the great advantage of higher sensitivity but the drawback of lower spectral resolution characteristic of 1H NMR spectroscopy even at 14.1 T (Xin et al., 2010). Our results show that, with increased sensitivity at high magnetic field strengths, direct 13C detection may be preferred. We achieved good time resolution for aliphatic carbons of glutamate and glutamine (the most concentrated metabolites appearing in the 13C spectra of the brain) with high reproducibility between all animals studied. The data further suggested that we could reduce the time span of C4 enrichment curves of these amino acids to 3 min without losing the consistency of the 13C time course measurement (data not shown). Conversely, the 13C enrichment curves could be acquired from a volume of interest smaller than 320 μL (used in this study). In our experimental conditions, we determined the turnover curves for all aliphatic carbons of glutamate, glutamine, and aspartate and provided them for the non-linear fit of the mathematical model (Figure 4).
The simultaneous determination of 13C-enriched glucose concentrations in plasma and brain allows measuring glucose transport. Notably, high correlation was found between glucose transport (Tmax), consumption (CMRglc), and label exchange before mitochondrial oxidation (Vout). Therefore, glucose transport was analyzed as described by Duarte et al. (2009b) and the obtained parameters were used to simulate brain glucose enrichment and concentration as input for the metabolic model. However, by simulating Tmax and CMRglc, correlation between Vout and other fluxes increased. Vout, along with Vin, represent metabolic exchange with other metabolites fueling brain metabolism, such as free amino acids (e.g., Bröer et al., 2007; Boumezbeur et al., 2010), and interaction of glycolysis with other brain pathways like the pentose phosphate shunt (e.g., Dusick et al., 2007). In fact, the brain is capable of lactate uptake and metabolism (e.g., Dienel and Cruz, 2009; Gallagher et al., 2009; Boumezbeur et al., 2010). Exchange between extra-cerebral lactate with pyruvate is modeled by Vin and Vout and a net gain or loss of lactate concentration is taken into account by the ratio of Vin to Vout. FE of brain lactate was significantly lower than that of the precursor glucose. Assuming that lactate is in fast exchange with the direct end product of glycolysis, pyruvate, and thus achieves similar FE, there would be a significant diversion of labeling between glucose entry in the brain and oxidation in the mitochondrial TCA cycle. In fact, a significant Vout was determined and, additionally, it was different from Vin that represents lactate utilization from extra-cerebral sources (note that plasma lactate was also enriched). Since Vout > Vin, not all glucose consumption rate (CMRglc) follows complete oxidation, i.e. CMRglc(ox). Our results indicate that only 78 ± 4% of the total glucose phosphorylation is oxidized in the TCA cycle, which is comparable to previous findings (discussed in Siesjo, 1978; Dienel and Hertz, 2001).
Different relative FE was observed in carbons of glutamate relative to glutamine. For example, at the end of the experiment, while glutamate C2 enrichment approaches that of C3 (Figure 4A), glutamine C2 is close to C4 and different from that of C3 (Figure 4B). This would only be possible if, in addition to the glial VPC labeling C2 of glutamate and glutamine, the TCA cycle precursor pools in glial and neuronal compartments display different FE. This is consistent with alternative glial specific substrates fueling brain metabolism, namely acetate (Badar-Goffer et al., 1990; Cerdán et al., 1990), fatty acids (Ebert et al., 2003), and ketone bodies (Künnecke et al., 1993), which are oxidized to glial acetyl-CoA. Therefore, a dilution factor was introduced at the level of glial acetyl-CoA (Vdil). Vdil not only acts as dilution factor for glial acetyl-CoA but can also incorporate 13C label from blood-born acetate (Figure 2C, which was considerable at the end of the experiment (FE = 0.33 ± 0.01). This dilution factor also accounts for eventual glial specific metabolic processes that deviate 13C labeling from oxidation in the TCA cycle, such as glycogen synthesis (Gruetter, 2003). Vdil was thus found to be slightly higher but not substantially different from the acetate consumption rate determined in the rat brain upon with infusions of 13C enriched acetate (Deelchand et al., 2009). This glial labeling dilution of the acetyl-CoA pool through Vdil was positively correlated to the apparent neurotransmission VNT as they are both responsible for the observed difference in C4 labeling between glutamate and glutamine.
One should note that, since glutamine and glutamate are mostly located in glial cells and neurons, respectively, Vdil also accounts for the 13C labeling dilution between the two amino acids. Because part of glutamine may be undetected in in vivo1H NMR spectra (e.g., Hancu and Port, 2011), we determined total glutamine relative to that of glutamate using resonance intensities and FEs from the 13C NMR spectra. Therefore, a total glutamine concentration different from 5.1 ± 0.5 μmol/g (measured in this study), may lead to a modification of Vdil.
The neuronal and glial VTCA were 0.45 ± 0.01 and 0.28 ± 0.02 μmol/g/min, respectively. This means that glial VTCA accounts for 38 ± 3% of total mitochondrial oxidative metabolism, from which 25 ± 1% is VPC. VPC is further increased upon higher cerebral activity in the conscious rat (Oz et al., 2004) and reduced under isoelectricity (Sibson et al., 1998; Choi et al., 2002). This substantial pyruvate carboxylation flux supports the active role of glial cells in their metabolic relationship with neurons, especially during synaptic transmission. In fact, in cultured astrocytes, extracellular potassium was suggested to stimulate bicarbonate influx (Brookes and Turner, 1994), which can induce anaplerosis (Gamberino et al., 1997), and to increase glutamine content (Brookes and Turner, 1993). In our model, VGS results from the addition of VPC to VNT and thus depicts this coupling of anaplerosis to glutamine synthesis, both occurring in the glial compartment. To maintain mass balance in the glutamine–glutamate cycle, exit of labeling from the cycle was modeled as Vefflux, representing other fates of glutamate and glutamine (McKenna, 2007). It is proposed that astrocytic glycolysis sustains glutamatergic neurotransmission and the resulting lactate is shuttled to neurons for oxidative metabolism (Pellerin and Magistretti, 1994; Magistretti et al., 1999). This hypothesis considers that astrocytic metabolism is mainly glycolytic, which would be sufficient to meet the energetic requirements of glutamate uptake and glutamine synthesis in the neurotransmission process (Magistretti et al., 1999). However, clearance of glutamate could be fueled by mitochondrial oxidative phosphorylation in astrocytes (Dienel and Hertz, 2001). In accordance, the present results suggest that a substantial part of mitochondrial oxidation of glycolytic pyruvate takes place in the glial compartment, as observed in the conscious rat (Oz et al., 2004).
The exchange between amino acids in the cytosol and the mitochondrial matrix, where the TCA cycle takes place, is mediated by the malate–aspartate shuttle and responsible for most labeling exchange between glutamate or aspartate and their oxo-acids 2-oxoglutarate and oxaloacetate, represented by Vx (Gruetter et al., 2001). Vx has frequently been assumed to be much larger than VTCA (e.g., Hyder et al., 1996, 1997; Sibson et al., 1998), i.e., VTCA/Vx = 0, which allows simplification of the mathematical models but may lead to underestimation of TCA cycle fluxes (see Uffmann and Gruetter, 2007). This assumption implies that 13C enrichment of glutamate and aspartate resembles that of OG and OAA, respectively, which may not be accurate (Gruetter et al., 2001). Experimental evidence shows that this flux could be either in the range of the TCA cycle flux (e.g., Gruetter et al., 2001; Oz et al., 2004) or effectively larger (e.g., de Graaf et al., 2004; Yang et al., 2009). In the rat brain under α-chloralose, we determined 13C enrichment curves with increased sensitivity and estimated a finite Vx that is on the same order of VTCA in both neurons and glia. Although from all estimated fluxes, glial Vx was the poorest estimated, i.e., with larger relative SD, all numerical simulations resulted in a  on the order of
  . To our knowledge this is the first time that Vx is simultaneously determined in neurons and glia. Half of the total VTCA, that represents oxidative glucose consumption CMRglc(ox), was found to be 0.39 ± 0.02 μmol/g/min (see Table 1), in agreement to other determinations by 13C NMR (Henry et al., 2002), or to measurements of CMRO2 by 17O NMR spectroscopy (Zhu et al., 2002) and CMRglc by autoradiography (Ueki et al., 1992; Nakao et al., 2001) in rats under α-chloralose anesthesia.
The neurotransmission flux VNT represents the flow of 13C labeling in the glutamate–glutamine cycle and was now determined to be 0.11 ± 0.01 μmol/g/min (see Table 1) that is similar to that reported by (Sibson et al., 1998) for the rat brain under α-chloralose anesthesia. It should however be noted that in the present work, VNT was determined with higher precision as suggested by an SD below 10%. The use of the C2 turnover curves of both glutamate and glutamine greatly contributed to the precision in the estimation of VNT by receiving direct 13C labeling input through pyruvate carboxylation that occurs in the glial compartment. A positive correlation was observed between VNT and the dilution of glial acetyl-CoA Vdil (Shen et al., 2009), which resides in the fact that Vdil creates a difference between the FEs of glutamine and glutamate while VNT is responsible for its dissipation.
In vitro studies suggest the existence of high fumarase activity randomizing 13C labeling from oxaloacetate (Sonnewald et al., 1993; Merle et al., 1996). Direct injection of [1-14C]pyruvate in the neocortex of mice labels glutamate and glutamine, which would only occur with pyruvate carboxylation and a notable rate through fumarase (Nguyen et al., 2007). In an alternative model, flux through fumarase (Vfum) allowing labeling exchange between OAA C3 and C2 was included. Vfum was detected but poorly determined, i.e., presented high relative SD, and was not significantly different from zero, as in a previous in vivo study (Oz et al., 2004). This is likely due to the high correlation of Vfum to VPC that alone accounts for the difference in C2 and C3 enrichment of glutamate and glutamine. The fact that aspartate, which is in exchange with OAA, is mostly located in neurons (discussed in Gruetter et al., 2001), makes it insensitive to this flux. In accordance to the primary location of aspartate to neurons, NMR spectroscopy of brain extracts at the end of the experiment revealed similar FE for C3 and C2 of aspartate in our study (0.52 ± 0.02 and 0.52 ± 0.01, respectively). However, the significant difference between 13C enrichment of carbons C2 and C3 of glutamate and glutamine at steady-state is in agreement with low Vfum compared to VPC.
Pyruvate recycling was suggested to occur in the brain (e.g., Cerdán et al., 1990; Sonnewald et al., 1996; Waagepetersen et al., 2002; Serres et al., 2007; Scafidi et al., 2010). This process would lead to enrichment of pyruvate C2 and consequently lactate C2 and, in fact, FE of lactate C2 in brain extracts at the end of the experiment was 0.029 ± 0.001. Although significant compared to the natural abundance of 0.011 (P < 0.01 with one-sample t test), it was much lower than the enrichment of C3 and therefore negligible. This pathway was suggested to be mainly used for complete oxidation of glutamate or glutamine in the TCA cycle and to occur in cultured astrocytes but not in neurons and in co-cultures of both (Sonnewald et al., 1996; Waagepetersen et al., 2002). This is in agreement with the lack of evidence for substantial pyruvate recycling in vivo. In addition, high glucose concentration may lead to reduction of the pyruvate recycling flux (discussed in Waagepetersen et al., 2002) and some C2 enrichment observed in vivo may be of systemic origin due to scrambling of 13C labeling in tissues such as the liver (discussed in Serres et al., 2007).
Conclusion
The present work experimentally demonstrates that reliable determination of 13C enrichment curves with high temporal resolution increases the precision of estimated metabolic fluxes. Additionally, precision increases with the number of experimentally measured turnover curves. Furthermore, we provide experimental evidence that non-measurable 13C enrichment of TCA cycle intermediates is not required for flux estimation, but increased correlation between the resulting fluxes must be expected. We found a substantial glial oxidative metabolism, part being driven through pyruvate carboxylase, which corresponds to more than half of the neuronal TCA cycle rate. This is consistent with the active role of astrocytes in the support of glutamatergic neurotransmission.
Conflict of Interest Statement
The authors declare that the research was conducted in the absence of any commercial or financial relationships that could be construed as a potential conflict of interest.
Acknowledgments
This work was supported by Swiss National Science Foundation (grant 131087) and by Centre d’Imagerie BioMédicale (CIBM) of the UNIL, UNIGE, HUG, CHUV, EPFL, and the Leenaards and Jeantet Foundations.
References
Badar-Goffer, R. S., Bachelard, H. S., and Morris, P. G. (1990). Cerebral metabolism of acetate and glucose studied by 13C-n.m.r. spectroscopy – a technique for investigating metabolic compartmentation in the brain. Biochem. J. 266, 133–139.
Boumezbeur, F., Petersen, K. F., Cline, G. W., Mason, G. F., Behar, K. L., Shulman, G. I., and Rothman, D. L. (2010). The contribution of blood lactate to brain energy metabolism in humans measured by dynamic 13C nuclear magnetic resonance spectroscopy. J. Neurosci. 30, 13983–13991.
Bröer, S., Bröer, A., Hansen, J. T., Bubb, W. A., Balcar, V. J., Nasrallah, F. A., Garner, B., and Rae, C. (2007). Alanine metabolism, transport, and cycling in the brain. J. Neurochem. 102, 1758–1770.
Brookes, N., and Turner, R. J. (1993). Extracellular potassium regulates the glutamine content of astrocytes: mediation by intracellular pH. Neurosci. Lett. 160, 73–76.
Brookes, N., and Turner, R. J. (1994). K(()-induced alkalinization in mouse cerebral astrocytes mediated by reversal of electrogenic Na(()-HCO3- cotransport. Am. J. Physiol. 267, C1633–C1640.
Cerdán, S., Künnecke, B., and Seelig, J. (1990). Cerebral metabolism of [1,2-13C2]acetate as detected by in vivo and in vitro 13C NMR. J. Biol. Chem. 265, 12916–12926.
Choi, I. Y., Lei, H., and Gruetter, R. (2002). Effect of deep pentobarbital anesthesia on neurotransmitter metabolism in vivo: on the correlation of total glucose consumption with glutamatergic action. J. Cereb. Blood Flow Metab. 22, 1343–1351.
de Graaf, R. A., Brown, P. B., Mason, G. F., Rothman, D. L., and Behar, K. L. (2003). Detection of [1,6-13C2]-glucose metabolism in rat brain by in vivo 1H-[13C]-NMR spectroscopy. Magn. Reson. Med. 49, 37–46.
de Graaf, R. A., Mason, G. F., Patel, A. B., Rothman, D. L., and Behar, K. L. (2004). Regional glucose metabolism and glutamatergic neurotransmission in rat brain in vivo. Proc. Natl. Acad. Sci. U.S.A. 101, 12700–12705.
Deelchand, D. K., Shestov, A. A., Koski, D. M., Ugurbil, K., and Henry, P. G. (2009). Acetate transport and utilization in the rat brain. J. Neurochem. 109, 46–54.
Dienel, G. A., and Cruz, N. F. (2009). Exchange-mediated dilution of brain lactate specific activity: implications for the origin of glutamate dilution and the contributions of glutamine dilution and other pathways. J. Neurochem. 109(Suppl. 1), 30–37.
Dienel, G. A., and Hertz, L. (2001). Glucose and lactate metabolism during brain activation. J. Neurosci. Res. 66, 824–838.
Duarte, J. M. N., Carvalho, R. A., Cunha, R. A., and Gruetter, R. (2009a). Caffeine consumption attenuates neurochemical modifications in the hippocampus of streptozotocin-induced diabetic rats. J. Neurochem. 111, 368–379.
Duarte, J. M. N., Morgenthaler, F. D., Lei, H., Poitry-Yamate, C., and Gruetter, R. (2009b). Steady-state brain glucose transport kinetics re-evaluated with a four-state conformational model. Front. Neuroenergetics 1:6. doi:10.3389/neuro.14.006.2009
Duarte, J. M. N., Cunha, R. A., and Carvalho, R. A. (2007). Different metabolism of glutamatergic and GABAergic compartments in superfused hippocampal slices characterized by nuclear magnetic resonance spectroscopy. Neuroscience 144, 1305–1313.
Dusick, J. R., Glenn, T. C., Lee, W. N., Vespa, P. M., Kelly, D. F., Lee, S. M., Hovda, D. A., and Martin, N. A. (2007). Increased pentose phosphate pathway flux after clinical traumatic brain injury: a [1,2-13C2]glucose labeling study in humans. J. Cereb. Blood Flow Metab. 27, 1593–1602.
Ebert, D., Haller, R. G., and Walton, M. E. (2003). Energy contribution of octanoate to intact rat brain metabolism measured by 13C nuclear magnetic resonance spectroscopy. J. Neurosci. 23, 5928–5935.
Gallagher, C. N., Carpenter, K. L., Grice, P., Howe, D. J., Mason, A., Timofeev, I., Menon, D. K., Kirkpatrick, P. J., Pickard, J. D., Sutherland, G. R., and Hutchinson, P. J. (2009). The human brain utilizes lactate via the tricarboxylic acid cycle: a 13C-labelled microdialysis and high-resolution nuclear magnetic resonance study. Brain 132, 2839–2849.
Gamberino, W. C., Berkich, D. A., Lynch, C. J., Xu, B., and LaNoue, K. F. (1997). Role of pyruvate carboxylase in facilitation of synthesis of glutamate and glutamine in cultured astrocytes. J. Neurochem. 69, 2312–2325.
Gjedde, A., and Marrett, S. (2001). Glycolysis in neurons, not astrocytes, delays oxidative metabolism of human visual cortex during sustained checkerboard stimulation in vivo. J. Cereb. Blood Flow Metab. 21, 1384–1392.
Gruetter, R., Seaquist, E. R., and Ugurbil, K. (2001). A mathematical model of compartmentalized neurotransmitter metabolism in the human brain. Am. J. Physiol. Endocrinol. Metab. 281, E100–E112.
Gruetter, R., and Tkác, I. (2000). Field mapping without reference scan using asymmetric echo-planar techniques. Magn. Reson. Med. 43, 319–323.
Hancu, I., and Port, J. (2011). The case of the missing glutamine. NMR. Biomed. doi: 10.1002/nbm.1620. [Epub ahead of print].
Henry, P. G., Lebon, V., Vaufrey, F., Brouillet, E., Hantraye, P., and Bloch, G. (2002). Decreased TCA cycle rate in the rat brain after acute 3-NP treatment measured by in vivo 1H-13C NMR spectroscopy. J. Neurochem. 82, 857–866.
Henry, P. G., Tkác, I., and Gruetter, R. (2003a). 1H-localized broadband 13C NMR spectroscopy of the rat brain in vivo at 9.4 T. Magn. Reson. Med. 50, 684–692.
Henry, P. G., Oz, G., Provencher, S., and Gruetter, R. (2003b). Toward dynamic isotopomer analysis in the rat brain in vivo: automatic quantitation of 13C NMR spectra using LCModel. NMR. Biomed. 16, 400–412.
Hyder, F., Chase, J. R., Behar, K. L., Mason, G. F., Siddeek, M., Rothman, D. L., and Shulman, R. G. (1996). Increased tricarboxylic acid cycle flux in rat brain during forepaw stimulation detected with 1H[13C]NMR. Proc. Natl. Acad. Sci. U.S.A. 93, 7612–7617.
Hyder, F., Rothman, D. L., Mason, G. F., Rangarajan, A., Behar, K. L., and Shulman, R. G. (1997). Oxidative glucose metabolism in rat brain during single forepaw stimulation: a spatially localized 1H[13C] nuclear magnetic resonance study. J. Cereb. Blood Flow Metab. 17, 1040–1047.
Jucker, B. M., Schaeffer, T. R., Haimbach, R. E., McIntosh, T. S., Chun, D., Mayer, M., Ohlstein, D. H., Davis, H. M., Smith, S. A., Cobitz, A. R., and Sarkar, S. K. (2002). Normalization of skeletal muscle glycogen synthesis and glycolysis in rosiglitazone-treated Zucker fatty rats: an in vivo nuclear magnetic resonance study. Diabetes 51, 2066–2073.
Künnecke, B., Cerdán, S., and Seelig, J. (1993). Cerebral metabolism of [1,2-13C2]glucose and [U-13C4]3-hydroxybutyrate in rat brain as detected by 13C NMR spectroscopy. NMR Biomed. 6, 264–277.
Magistretti, P. J., Pellerin, L., Rothman, D. L., and Shulman, R. G. (1999). Energy on demand. Science 283, 496–497.
Mangia, S., Simpson, I. A., Vannucci, S. J., and Carruthers, A. (2009). The in vivo neuron-to-astrocyte lactate shuttle in human brain: evidence from modeling of measured lactate levels during visual stimulation. J. Neurochem. 109, 55–62.
McKenna, M. C. (2007). The glutamate-glutamine cycle is not stoichiometric: fates of glutamate in brain. J. Neurosci. Res. 85, 3347–3358.
Merle, M., Martin, M., Villégier, A., and Canioni, P. (1996). Mathematical modelling of the citric acid cycle for the analysis of glutamine isotopomers from cerebellar astrocytes incubated with [1-13C]glucose. Eur. J. Biochem. 239, 742–751.
Mintun, M. A., Vlassenko, A. G., Rundle, M. M., and Raichle, M. E. (2004). Increased lactate/pyruvate ratio augments blood flow in physiologically activated human brain. Proc. Natl. Acad. Sci. U.S.A. 101, 659–664.
Mlynárik, V., Gambarota, G., Frenkel, H., and Gruetter, R. (2006). Localized short-echo-time proton MR spectroscopy with full signal-intensity acquisition. Magn. Reson. Med. 56, 965–970.
Nakao, Y., Itoh, Y., Kuang, T. Y., Cook, M., Jehle, J., and Sokoloff, L. (2001). Effects of anesthesia on functional activation of cerebral blood flow and metabolism. Proc. Natl. Acad. Sci. U.S.A. 98, 7593–7598.
Nguyen, N. H., Morland, C., Gonzalez, S. V., Rise, F., Storm-Mathisen, J., Gundersen, V., and Hassel, B. (2007). Propionate increases neuronal histone acetylation, but is metabolized oxidatively by glia. Relevance for propionic acidemia. J. Neurochem. 101, 806–814.
Oz, G., Berkich, D. A., Henry, P. G., Xu, Y., LaNoue, K., Hutson, S. M., and Gruetter, R. (2004). Neuroglial metabolism in the awake rat brain: CO2 fixation increases with brain activity. J. Neurosci. 24, 11273–11279.
Patel, A. B., de Graaf, R. A., Mason, G. F., Rothman, D. L., Shulman, R. G., and Behar, K. L. (2005). The contribution of GABA to glutamate/glutamine cycling and energy metabolism in the rat cortex in vivo. Proc. Natl. Acad. Sci. U.S.A. 102, 5588–5593.
Patel, A. B., de Graaf, R. A., Rothman, D. L., Behar, K. L., and Mason, G. F. (2010). Evaluation of cerebral acetate transport and metabolic rates in the rat brain in vivo using 1H-[13C]-NMR. J. Cereb. Blood Flow Metab. 30, 1200–1213.
Pellerin, L., and Magistretti, P. J. (1994). Glutamate uptake into astrocytes stimulates aerobic glycolysis: a mechanism coupling neuronal activity to glucose utilization. Proc. Natl. Acad. Sci. U.S.A. 91, 10625–10629.
Scafidi, S., Fiskum, G., Lindauer, S. L., Bamford, P., Shi, D., Hopkins, I., and McKenna, M. C. (2010). Metabolism of acetyl-L-carnitine for energy and neurotransmitter synthesis in the immature rat brain. J. Neurochem. 114, 820–831.
Serres, S., Bezancon, E., Franconi, J. M., and Merle, M. (2007). Brain pyruvate recycling and peripheral metabolism: an NMR analysis ex vivo of acetate and glucose metabolism in the rat. J. Neurochem. 101, 1428–1440.
Shen, J., Rothman, D. L., Behar, K. L., and Xu, S. (2009). Determination of the glutamate-glutamine cycling flux using two-compartment dynamic metabolic modeling is sensitive to astroglial dilution. J. Cereb. Blood Flow Metab. 29, 108–118.
Shestov, A. A., Valette, J., Ugurbil, K., and Henry, P. G. (2007). On the reliability of 13C metabolic modeling with two-compartment neuronal-glial models. J. Neurosci. Res. 85, 3294–3303.
Shulman, R. G., Hyder, F., and Rothman, D. L. (2003). Cerebral metabolism and consciousness. C. R. Biol. 326, 253–273.
Sibson, N. R., Dhankhar, A., Mason, G. F., Rothman, D. L., Behar, K. L., and Shulman, R. G. (1998). Stoichiometric coupling of brain glucose metabolism and glutamatergic neuronal activity. Proc. Natl. Acad. Sci. U.S.A. 95, 316–321.
Simpson, I. A., Carruthers, A., and Vannucci, S. J. (2007). Supply and demand in cerebral energy metabolism: the role of nutrient transporters. J. Cereb. Blood Flow Metab. 27, 1766–1791.
Sonnewald, U., Westergaard, N., Hassel, B., Müller, T. B., Unsgård, G., Fonnum, F., Hertz, L., Schousboe, A., and Petersen, S. B. (1993). NMR spectroscopic studies of 13C acetate and 13C glucose metabolism in neocortical astrocytes: evidence for mitochondrial heterogeneity. Dev. Neurosci. 15, 351–358.
Sonnewald, U., Westergaard, N., Jones, P., Taylor, A., Bachelard, H. S., and Schousboe, A. (1996). Metabolism of [U-13C5] glutamine in cultured astrocytes studied by NMR spectroscopy: first evidence of astrocytic pyruvate recycling. J. Neurochem. 67, 2566–2572.
Ueki, M., Mies, G., and Hossmann, K. A. (1992). Effect of alpha-chloralose, halothane, pentobarbital and nitrous oxide anesthesia on metabolic coupling in somatosensory cortex of rat. Acta Anaesthesiol. Scand. 36, 318–322.
Uffmann, K., and Gruetter, R. (2007). Mathematical modeling of 13C label incorporation of the TCA cycle: the concept of composite precursor function. J. Neurosci. Res. 85, 3304–3317.
van Eijsden, P., Behar, K. L., Mason, G. F., Braun, K. P., and de Graaf, R. A. (2010). In vivo neurochemical profiling of rat brain by 1H-[13C] NMR spectroscopy: cerebral energetics and glutamatergic/GABAergic neurotransmission. J. Neurochem. 112, 24–33.
Waagepetersen, H. S., Qu, H., Hertz, L., Sonnewald, U., and Schousboe, A. (2002). Demonstration of pyruvate recycling in primary cultures of neocortical astrocytes but not in neurons. Neurochem. Res. 27, 1431–1437.
Xin, L., Mlynárik, V., Lanz, B., Frenkel, H., and Gruetter, R. (2010). 1H-[13C] NMR spectroscopy of the rat brain during infusion of [2-13C] acetate at 14.1 T. Magn. Reson. Med. 64, 334–340.
Yang, J., Xu, S., and Shen, J. (2009). Fast isotopic exchange between mitochondria and cytosol in brain revealed by relayed 13C magnetization transfer spectroscopy. J. Cereb. Blood Flow Metab. 29, 661–669.
Zhu, X. H., Zhang, Y., Tian, R. X., Lei, H., Zhang, N., Zhang, X., Merkle, H., Ugurbil, K., and Chen, W. (2002). Development of 17O NMR approach for fast imaging of cerebral metabolic rate of oxygen in rat brain at high field. Proc. Natl. Acad. Sci. U.S.A. 99, 13194–13199.
Keywords: glucose metabolism, neurotransmission, mathematical modeling, NMR spectroscopy, neurotransmitter metabolism
Citation: Duarte JMN, Lanz B and Gruetter R (2011) Compartmentalized cerebral metabolism of [1,6-13C]glucose determined by in vivo 13C NMR spectroscopy at 14.1 T. Front. Neuroenerg. 3:3. doi: 10.3389/fnene.2011.00003
Received: 01 April 2011; Accepted: 17 May 2011;
Published online: 06 June 2011.
Edited by:
Sebastián Cerdán, Instituto de Investigaciones Biomédicas Alberto Sols, SpainReviewed by:
Sebastián Cerdán, Instituto de Investigaciones Biomédicas Alberto Sols, SpainKevin L. Behar, Yale University, School of Medicine, USA
Tiago B. Rodrigues, Cancer Research UK (Cambridge Research Institute) and University of Cambridge, UK
Copyright: © 2011 Duarte, Lanz and Gruetter. This is an open-access article subject to a non-exclusive license between the authors and Frontiers Media SA, which permits use, distribution and reproduction in other forums, provided the original authors and source are credited and other Frontiers conditions are complied with.
*Correspondence: João M. N. Duarte, Ecole Polytechnique Fédérale de Lausanne, SB IPMC LIFMET (Bâtiment CH), Station 6, CH-1015 Lausanne, Switzerland.