


- 1 Department of Robotics, Brain and Cognitive Sciences, Istituto Italiano di Tecnologia, Genova, Italy
- 2 Dipartimento di Psicologia, Università Degli Studi di Firenze, Florence, Italy
- 3 Istituto di Neuroscienze del Consiglio Nazionale delle Ricerche, Pisa, Italy
- 4 Dipartimento di Scienze Fisiologiche, Facolta’ di Medicina, Universita’di Pisa, Pisa, Italy
- 5 Fondazione Stella Maris, Pisa, Italy
It is known that the perceived duration of visual stimuli is strongly influenced by speed: faster moving stimuli appear to last longer. To test whether this is a general property of sensory systems we asked participants to reproduce the duration of visual and tactile gratings, and visuo-tactile gratings moving at a variable speed (3.5–15 cm/s) for three different durations (400, 600, and 800 ms). For both modalities, the apparent duration of the stimulus increased strongly with stimulus speed, more so for tactile than for visual stimuli. In addition, visual stimuli were perceived to last approximately 200 ms longer than tactile stimuli. The apparent duration of visuo-tactile stimuli lay between the unimodal estimates, as the Bayesian account predicts, but the bimodal precision of the reproduction did not show the theoretical improvement. A cross-modal speed-matching task revealed that visual stimuli were perceived to move faster than tactile stimuli. To test whether the large difference in the perceived duration of visual and tactile stimuli resulted from the difference in their perceived speed, we repeated the time reproduction task with visual and tactile stimuli matched in apparent speed. This reduced, but did not completely eliminate the difference in apparent duration. These results show that for both vision and touch, perceived duration depends on speed, pointing to common strategies of time perception.
Introduction
Any sensory experience, regardless of the modality of the stimulus – visual, auditory, or tactile – is defined within a temporal interval. Stimuli of different sensory modalities are all mapped along the same temporal dimension, allowing us to order events in time as well as to judge their relative duration. The most immediate and intuitive comprehension of time is therefore that of a universal dimension that transcends each specific sensory modality. The idea that our brain is endowed with a unique and centralized clock has dominated the research on time perception for many years (Treisman, 1963; Gibbon et al., 1997). Emerging evidence suggests, however, that the analysis of temporal information may have modality-specific components (e.g., Gamache and Grondin, 2010) and may be intimately embedded within local sensory processing. It has been shown that perceived time can be distorted by means of local sensory adaptation both in the visual (Johnston et al., 2006; Burr et al., 2007) and, most recently, in the tactile domain (Tomassini et al., 2010; Watanabe et al., 2010). Moreover, modality-specific temporal distortions have been documented around the time of saccadic eye movements (Morrone et al., 2005). Multiple and distributed mechanisms, though likely constrained by similar computational principles, may thus underlie timing functions within different sensory modalities.
That no dedicated system exists for perceiving time, at least in the sub-second range, would also explain the ease with which many non-temporal, low-level properties of the stimuli – such as visibility (Terao et al., 2008), size (Xuan et al., 2007), temporal frequency (Kanai et al., 2006; Khoshnoodi et al., 2008), and speed (Kaneko and Murakami, 2009) – can alter perceived time. The strong influence of stimulus motion on apparent duration has long been recognized (Lhamon and Goldstone, 1975; Brown, 1995), although its neural bases and functional significance remain unknown. So far, the relationship between these two perceptual attributes has been uniquely studied within the visual system, showing that faster moving stimuli appear to last longer.
This motion-induced temporal illusion is well suited to investigate the properties of timing mechanisms within and across sensory modalities. Recent evidence suggests that visual and tactile motion processing share much in common (e.g., Pei et al., 2011): for example visual and tactile motion are subject to similar illusions (Harrar and Harris, 2007; Watanabe et al., 2007; Bicchi et al., 2008), show cross-modal interactions (Bensmaia et al., 2006; Craig, 2006; Konkle et al., 2009), multisensory facilitation (Gori et al., 2011), and seem to have partially overlapping neural substrates (Hagen et al., 2002; Ricciardi et al., 2004).
One remarkable feature, that has no counterpart in the spatial domain, is that not only do different sensory modalities show different temporal resolutions (as in space) but they can also provide different estimates for the temporal properties of sensory events (Grondin, 2003; van Erp and Werkhoven, 2004). It is well known, for example, that auditory tones are perceived to last longer than visual flashes of the same physical length (Walker and Scott, 1981; Wearden et al., 1998; Harrington et al., 2011). Given the importance of accurate timing for multiple perceptual, motor, and cognitive functions, a relevant but poorly investigated question is how the brain deals with these inter-sensory discrepancies in temporal estimates and ultimately provides a combined percept of event duration.
The Bayesian Framework for Multisensory Integration
In recent years the Bayesian statistical approach has been successful in providing a quantitative prediction of the effects of inter-sensory signal combination in many perceptual domains (Ernst and Banks, 2002; Ernst and Bülthoff, 2004). Optimal Bayesian integration of multiple sensory signals requires each source of information to be weighted by its relative reliability so that the most probable, though sometimes erroneous, perceptual estimate is obtained with the less uncertainty (see Eqs 1–4 in the Materials and Methods). The so-called “ventriloquist effect” illustrates clearly how the most precise information, in this case that provided by vision, drives the final percept with the sound being attracted toward the location of the visual stimulus (just like the ventriloquist’s voice seems to come from the mouth of the puppet; Alais and Burr, 2004). By virtue of its higher spatial acuity, vision usually dominates audition in the spatial domain; the reverse is however true in the temporal domain. Many cases show that auditory stimuli can strongly influence the perceived timing of visual (Shams et al., 2000; Aschersleben and Bertelson, 2003; Morein-Zamir et al., 2003; Recanzone, 2003) and tactile events (Bresciani et al., 2005). Although this is in line with what optimal ‘’Bayesian” integration would predict on the basis of the greater temporal precision of the auditory system, it is not clear whether this model provides a good quantitative description of the data. While most studies reporting auditory dominance in temporal judgments have not assessed this issue directly, two recent studies, testing audio–visual integration in a temporal bisection task (Burr et al., 2009) and audio–tactile temporal order judgments (Ley et al., 2009), provide conflicting results. Evidence as to whether the Bayesian cue-combination theory is a good explanatory framework in the temporal domain, like it is in the spatial domain, remains thus inconclusive.
In this study we test whether speed-dependency of apparent duration is a general property of sensory systems. That apparent duration depends on speed for both vision and touch would suggest that timing mechanisms share common operating principles across different modalities. Our results show that the duration of tactile events also depends on speed, pointing to a general principle. We also studied bimodal visuo-tactile gratings, to investigate how vision and touch are combined to yield an estimate of duration. The results show that the two modalities do interact with each other, but the advantage gained from the bimodal fusion is quantitatively suboptimal.
Materials and Methods
Visual, tactile, and visuo-tactile motion stimuli were provided by physical wheels (diameter 10.5 cm; width 3 cm) etched with a corrugated grating of alternating ridges and grooves of equal width, of spatial frequency 3 c/cm (Figure 1A). The wheels were spatially aligned to give the appearance of a common object and driven at specific velocities by two independently controlled motors (Figure 1B). The velocity of the wheels was calibrated by means of a visual tracking system (NDI Optotrack Certus system), showing only minor deviations (3%) from the ideal constant velocity stimuli.
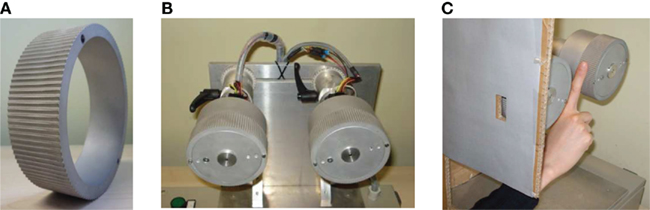
Figure 1. Illustration of the stimuli. (A) Physical wheel etched with a sinewave profile of 3 c/cm. (B) Setup with two arms driven at specific speeds by independent computer-controlled motors. (C) In the visual condition subjects observed the front wheel in motion through a small window; in the tactile condition they touched with their right index finger the second wheel occluded to vision by a shield; in the bimodal condition they observed and touched the two wheels simultaneously.
Subjects, seated at 57 cm from the stimuli, observed the front wheel through a small aperture (visual condition) and touched with their right index finger the second wheel, concealed from view (tactile condition). In the bimodal condition participants observed and touched the two wheels simultaneously (Figure 1C). The gratings were oriented horizontally (perpendicular to the long axis of the finger) and the direction of the motion could be either up-to-down (distal-to-proximal relative to the finger) or down-to-up (proximal-to-distal) depending on the trial (always coherent in the bimodal condition).
Participants were required to reproduce the duration of the moving stimuli by pressing a button on a keyboard with their left index finger after each stimulus presentation. The next stimulus started 1 s after the end of the reproduction phase.
The stimuli were presented for three different durations, 400, 600, and 800 ms, with speed varied between 3.5, 5, 7.5, 10, 12.5, and 15 cm/s. Data were collected in separate sessions of 90 trials, with different durations and speeds intermingled within each session. Although this procedure may result in what is called “regression toward the mean,” reducing the real effect of speed on duration, we chose to randomize both durations and speeds so as to encourage subjects to attend to the stimuli and avoid stereotyped responses. No feedback was provided about the physical duration of the stimuli. Six subjects, one author and five naïve to the goals of the experiment, participated in the experiment; each subject completed a minimum of four sessions per condition (visual, tactile, and visuo-tactile). Participants did not receive any training. The average and variance of the reproduced durations across trials were calculated separately for each subject, stimulus modality, duration, and speed.
The second part of the experiment involved a cross-modal speed-matching task. The experimental apparatus and stimuli were the same as described above. Three subjects (one author and two naïves from the previous group) were asked to judge the relative speed of two moving stimuli, one visual and the other tactile, presented in succession in random order for 600 ms each. The direction of the movement was randomized on a trial-by-trial basis, but was always the same for the two stimuli within each trial.
The speed of one stimulus (the probe) was varied from trial to trial by means of the QUEST algorithm (Watson and Pelli, 1983) to generate a psychometric function; the other stimulus (the standard) had fixed speed. Two different conditions were intermingled within the same experimental session, with the probe being either tactile or visual. Three separate sessions of 40 trials each (half trials with visual probes and half with tactile probes) were run for four different standard speeds, 3.5, 7.5, 10, and 15 cm/s (except for subject MG who did not complete the 10 cm/s condition), chosen among the speed values used in the time reproduction task. Data for each condition were fitted with cumulative Gaussian functions estimated by means of the maximum likelihood method; the point of subjective equality (PSE) and the differential threshold were derived from the median and SD of the psychometric function, respectively. SEs for the PSEs and SDs were estimated by bootstrap.
The PSE indicated the speed of the visual (tactile) probe for which it was perceived as fast as the tactile (visual) standard. We thus repeated the time reproduction task (in the same three subjects) with new speed values, determined for each subject and stimulus modality according to the PSEs found in the cross-modal speed-matching task, so that the stimuli for both modalities were matched in perceived speed to those previously used. In the bimodal condition, the cross-modal speed-matching was obtained by using the standard speeds (3.5, 5, 7.5, 10, 12.5, and 15 cm/s) for the visual stimuli and appropriately changing the speeds of the tactile stimuli so as to match the visual speeds. Since PSEs were known for four of the six standard speeds, the other values were estimated by interpolation with the best-fitting linear function. The experiment required about 9 h testing for the three subjects who completed all the conditions and 4 h for the other subjects.
The results for the bimodal condition were modeled within the Bayesian framework (Ernst and Banks, 2002; Alais and Burr, 2004). According to optimal “Bayesian” integration the perceived duration of the combined visuo-tactile stimuli results from a weighted sum of the estimates of duration provided separately by each modality. Assuming that the visual and tactile estimates are statistically independent, the combined estimate of event duration,  is given by the following equation:

where  is the visual estimate and
  the tactile estimate, calculated as the average reproduced duration across trials, for each stimulus duration and speed. The weights, wV and wT, sum to unity and are inversely related to the variances for vision (
 ) and touch (
 ), respectively:
since the variance of the reproduced duration did not change systematically with stimulus speed,  and
and  were computed averaging variances across speeds, separately for each duration.
The model predicts that the variance for the combined estimate,  is always less than the unimodal variances,
  and
and  with the greatest improvement in precision (
 ) when
Results
Figure 2 reports the individual reproduced durations as a function of speed for the 400, 600, and 800 ms visual (left column) and tactile (right column) stimuli. Duration reproduction is rather biased, so reproduced duration differs from the physical duration of the stimuli, with considerable variation between subjects. Regardless of the individual bias in the reproduction, the visual stimuli are always perceived to last longer (264 ± 40 ms on average) than the tactile stimuli. In most cases, the difference in perceived duration between visual and tactile stimuli grows with stimulus duration (Figure 3).
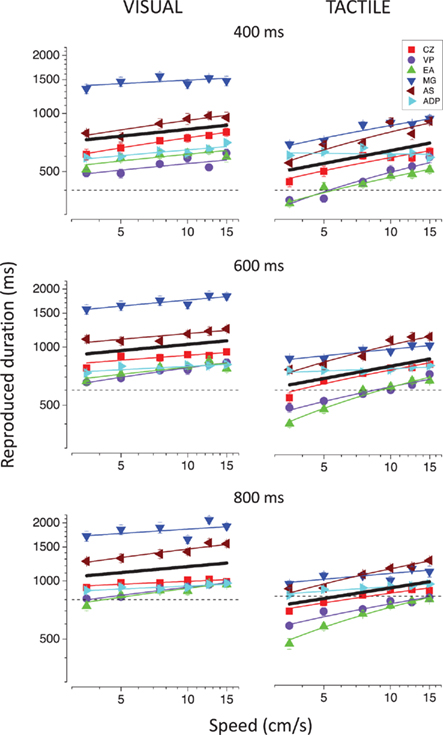
Figure 2. Individual reproduced durations as a function of speed for the visual (left column) and the tactile (right column) stimuli. Different colors represent different subjects. The black solid lines represent the best-fitting linear functions for the average reproduced durations. The results for the 400, 600, and 800 ms durations are reported in the upper, middle, and lower panels, respectively. The dashed lines indicate the actual physical durations of the stimuli.
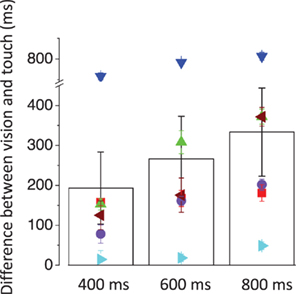
Figure 3. Difference between the reproduced durations for the visual and tactile stimuli as a function of stimulus duration. The symbols represent the individual data and the bars represent the averages across subjects.
For both modalities apparent duration increases linearly with log speed. However, the speed-dependency was stronger for the tactile than for the visual stimuli, as can be observed in Figure 4A. To analyze better the relationship between perceived duration and speed, data were normalized by dividing them by the reproduced duration obtained for the stimuli moving at 7.5 cm/s. In this way we preserved only the information regarding the relative change in apparent duration, unaffected by systematic biases in the reproduction. The slopes of the normalized reproduced duration versus speed functions (calculated by linear regression) for touch are plotted against the slopes for vision. Tactile slopes are much greater than the visual slopes as indicated by the points lying above the equality line. A repeated-measures analysis of variance (ANOVA) with two within-subjects factors (modality and duration) was conducted on the slopes, leading to a significant difference between visual and tactile slopes [main effect of factor modality; F(1,5) = 10.183; p = 0.024], but neither to a significant effect of stimulus duration [F(2,10) = 1.06; p = 0.427], nor to a significant interaction between stimulus modality and duration [F(2,10) = 0.427; p = 0.679].
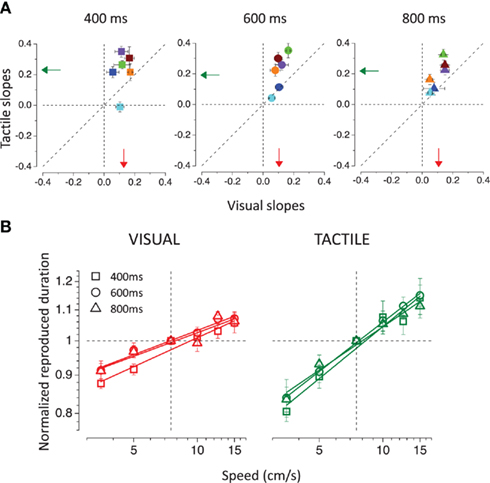
Figure 4. (A) Tactile slopes plotted against visual slopes. The slopes were calculated, separately for each subject and condition, from the linear regression of the normalized reproduced durations (divided by the reproduced duration obtained for the 7.5-cm/s moving stimuli) as a function of speed. Different colors represent different subjects. The vertical and horizontal dashed lines indicate absence of dependence on speed, the diagonal shows equal dependence for vision and touch. The arrows show the averages for the visual (in red) and for the tactile (in green) conditions. (B) Normalized reproduced durations averaged across subjects are plotted as a function of speed for the visual (on the left) and tactile (on the right) stimuli. Different stimulus durations (400, 600, and 800 ms) are represented by different symbols.
Importantly, the slopes for the visual modality correlate positively with the slopes for the tactile modality [r = 0.584(16), p(one-tailed) = 0.005], suggesting that similar mechanisms are driving the time expansion of both visual and tactile stimuli. Figure 4B shows average results for each stimulus duration in the visual and tactile conditions. The increasing linear functions have very similar slopes within each modality, indicating that the same relationship between apparent duration and speed applies to all stimulus durations, but they are always steeper for the tactile than for the visual stimuli.
To evaluate the relative contributions of vision and touch to the final combined percept we took advantage of the large differences in perceived duration between visual and tactile stimuli (in some cases up to 400–800 ms), leading to two clearly distinct unimodal duration estimates. We thus employed bimodal stimuli comprising visual and tactile stimuli moving at the same physical velocity for the same duration. The results for each subject are reported in Figure 5A for the 600 ms stimuli (comparable results were obtained for the other two durations tested; individual data not shown). In all cases except one, the apparent duration of bimodal stimuli lies between the unimodal estimates, as the Bayesian account predicts. Importantly, only one subject (CZ) shows a clear improvement in the precision of the reproduction for the bimodal stimuli as predicted by Eq. 4 (see Materials and Methods). As shown in Figure 5B, the bimodal SDs for all other subjects are never better than the best unimodal case, and worse than what predicted by the model.
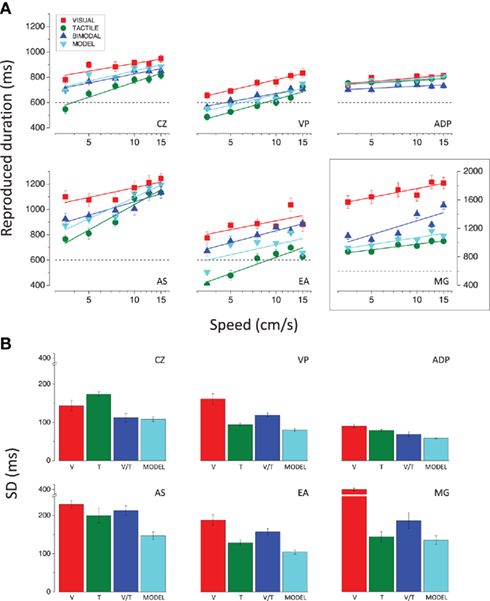
Figure 5. (A) Reproduced durations for the 600 ms stimuli, plotted as a function of speed for all conditions. The results for the subject MG have been plotted on a different scale to encompass her wider range of duration estimates. (B) SDs of the reproduction averaged across speeds relative to the 600 ms visual (red bar), tactile (green bar), and bimodal (blue bar) stimuli and predicted for bimodal stimuli according to the Bayesian model (cyan bar); results for all subjects.
To quantify the goodness of model fit, we performed a linear regression between the bimodal data and the model predictions (see Eq. 1 in the Materials and Methods) for all subjects. We tested whether the best-fitting linear function is significantly different from the ideal fit (equality line with intercept equal to 0 and slope equal to 1) by looking at the 95% confidence intervals for the intercept and slope. The duration estimates for the bimodal stimuli do not deviate significantly from the predicted estimates. However, since the confidence intervals are quite large, the absence of a significant difference between the bimodal and predicted estimates can be affirmed with high uncertainty.
Figure 6 shows results averaged across subjects, separately for the three durations. As was evident in the single-subject results, the bimodal duration reproductions fall between the unimodal reproductions, close to the model predictions. The strong test of optimal integration is an improvement in thresholds (SDs). The lower bar graphs show average normalized thresholds for all conditions: the variances for all speeds and subjects were first divided by the bimodal variance (to eliminate inter-subject variability), then summed and square-rooted to yield the thresholds of Figure 6B. The predicted SDs are significantly lower than the bimodal SDs, indicating suboptimal integration [t(35) = 6.3, p < 0.0001 for 400 ms; t(35) = 5.5, p < 0.0001 for 600 ms; t(35) = 6.5, p < 0.0001 for 800 ms; two tailed paired t-tests].
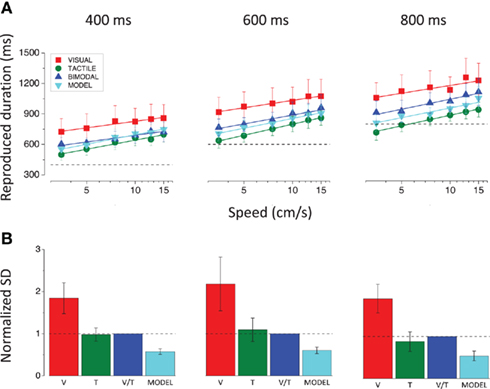
Figure 6. (A) Reproduced durations averaged across subjects, plotted as a function of speed, separately for the three stimulus durations (400, 600, and 800 ms). The dashed lines indicate the actual physical durations of the stimuli. (B) Average normalized SDs for all conditions and stimulus durations. The variances for all speeds and subjects were first divided by the bimodal variance, then summed and square-rooted to yield the SDs. The dashed lines show the normalized bimodal SDs.
Figure 2 shows that not only does the duration of both visual and tactile stimuli depend on speed, but visual stimuli tend to be perceived as lasting longer than tactile stimuli. As perceived duration varies strongly with stimulus speed, the difference in perceived duration of visual and tactile stimuli could arise from differences in their perceived speed. To examine this possibility, we first measured relative speed perception between vision and touch. The cross-modal speed-matching task (see Materials and Methods for details) revealed that visual stimuli appear to move faster than tactile stimuli. Visual (red symbols) and tactile (green symbols) PSEs for the three subjects who completed the task are plotted in Figure 7A as a function of tactile and visual standard speeds, respectively. The dashed line indicates equal perceived speed between vision and touch. Visual PSEs lie below the equality line, and tactile above, indicating overestimation of visual speed relative to tactile speed.
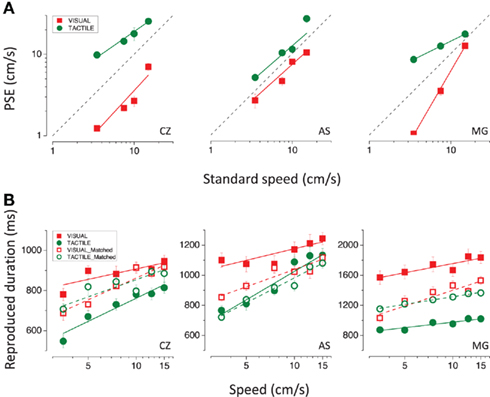
Figure 7. (A) Point of subjective equalities for the visual (in red) and tactile (in green) stimuli as a function of tactile and visual standard speeds (3.5, 5, 7.5, 10, 12.5, 15 cm/s), respectively. The dashed line represents the equality line. (B) Reproduced durations plotted as a function of speed for the 600 ms visual (in red) and tactile (in green) moving stimuli. Filled symbols represent the results for the visual and tactile stimuli moving at the same physical speeds (standard speeds). Red open symbols represent the results for the visual stimuli matched in perceived speed to the tactile stimuli moving at the standard speeds (filled green symbols); green open symbols represent the results for the tactile stimuli matched in perceived speed to the visual stimuli moving at the standard speeds (filled red symbols); results for all subjects.
We then repeated the time reproduction task with higher speeds for touch and lower speeds for vision (specified by the PSEs), so that the new visual and tactile stimuli were matched in perceived speed to those previously used. Figure 7B reports the results for visual and tactile stimuli matched in physical (filled symbols) and perceived speed (red open symbols match with green filled symbols and green open symbols with red filled symbols). After speed-matching, the difference in apparent duration between visual and tactile stimuli is reduced but not completely eliminated. For two subjects out of three (CZ and MG) perceived speed explains exactly half of the difference in perceived duration between vision and touch, as indicated by the open symbols lying halfway between the filled symbols. Subject AS shows an asymmetrical pattern of results: speed-matching did not affect tactile apparent duration (green open symbols overlap with green filled symbols), whereas it produced a remarkable decrease (more than half of the difference between vision and touch) in visual apparent duration. These findings appear quite surprising if one considers the strong speed-dependency of tactile apparent duration shown by the same subject, unless we hypothesize that she changed her response criterion in the second part of the experiment, shortening all reproduction times (this would also be consistent with the greater reduction in perceived duration reported by AS after visual speed-matching compared with what reported by the other two subjects).
The results for the bimodal speed-matched stimuli (Figure 8) do not allow us to draw different conclusions with respect to those already discussed for bimodal stimuli consisting of physically identical visual and tactile stimuli. Both before and after speed-matching the results for the subject CZ indicate that vision and touch are combined in an optimal way to yield an estimate of event duration, as shown by the good fit of the model. Bimodal duration estimates and precision of the reproduction deviate little from what predicted by optimal integration for the subject AS, while they are completely inconsistent with the model for the subject MG.
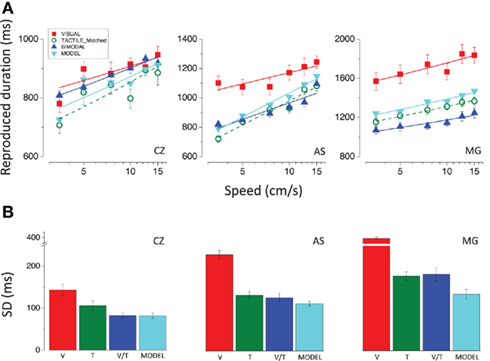
Figure 8. (A) Reproduced durations as a function of speed relative to the 600 ms stimuli. The green open symbols represent the reproduced durations for the tactile stimuli moving at the same perceived speed as the visual stimuli (red filled symbols). Blue symbols represent the results for the bimodal stimuli (visuo-tactile speed-matched stimuli) and the cyan symbols represent the results for the bimodal stimuli predicted according to Bayesian integration. (B) SDs of the reproduction averaged across speeds relative to the 600 ms visual (red bar), tactile (green bar), and bimodal (blue bar) stimuli and predicted for bimodal stimuli according to the Bayesian model (cyan bar); results for all subjects.
Discussion
We used a time reproduction task to measure the apparent duration of visual, tactile, and visuo-tactile stimuli moving at various speeds. The study yielded three main results. Firstly, we show that motion induces temporal dilation in the tactile modality as previously shown in the visual modality: faster stimuli appear to be longer. Secondly, visual stimuli appear to last longer and to move faster than tactile stimuli of the same duration and speed. Thirdly we model the results with the Bayesian theory of optimal integration, and find an adequate fit for the duration estimates but not for their precision.
Unlike prior investigations in vision (Kanai et al., 2006; Kaneko and Murakami, 2009), our experiment was not designed to evaluate the differential role of speed, temporal frequency, and spatial frequency in time dilation; we did not manipulate the spatial frequency of the stimuli (3 c/cm for touch; 3 c/deg for vision) and consequently the temporal frequency and speed always covaried. We found that also for the tactile modality, apparent duration increases with increasing speed (and temporal frequency, in agreement with Khoshnoodi et al., 2008). Speed-dependency for touch is stronger than for vision. This might be explained by the different spatial and temporal tuning properties of the two sensory systems, which determine a different sensitivity to stimulus motion in the range of speeds considered. The maximum speed tested (15 cm/s, 45 Hz) is actually quite low compared with the high temporal resolution (up to 400 Hz) of the tactile system, while it approaches the upper limit of sensitivity for visual motion. This may account for the more rapid saturation of the effect in the visual modality, reflected in the lower slopes of the increasing linear functions describing speed dependence.
The functional architectures of early visual and tactile sensory processing show several important similarities. Although the two systems have different temporal resolutions, both are equipped with low-pass and band-pass temporal channels that yield sustained and transient neural responses. Several lines of evidence indicate that motion processing also shares similar properties and possibly common neural substrates between vision and touch (Konkle et al., 2009; Gori et al., 2011; Pei et al., 2011). Recently, compelling evidence has linked the encoding of duration in the sub-second range to the early sensory machinery for temporal analysis. It has been shown that perceived time can be locally altered by means of visual motion (or flicker) adaptation (Johnston et al., 2006; Burr et al., 2007) and the same result has been also extended to the tactile modality (Watanabe et al., 2010). Here we report that time dilation induced by motion is a common finding across vision and touch. All this fits well with the suggestion that timing functions may be realized by multiple, modality-specific mechanisms, operating according to similar computational principles and rooted in the early sensory function.
Vision and touch yield different duration reproductions for stimuli moving at the same physical speed, with tactile reproductions being in general slightly more accurate (closer to the actual physical duration) and precise (showing less inter-trial variability) than visual reproductions. As visual stimuli appear to last longer than tactile stimuli (∼200 ms), we tested whether this inter-sensory difference in perceived duration could result from differences in perceived speed. The cross-modal speed-matching task revealed that visual stimuli are perceived to move faster than the tactile stimuli, but this does not explain entirely the difference in perceived duration, which persists, although to a lesser extent, after the stimuli are matched in perceived speed. That the apparent duration may change depending on stimulus modality is not a new finding in the timing literature (Goldstone and Lhamon, 1974; Walker and Scott, 1981). Differences in apparent duration have been previously reported for auditory and visual stimuli and generally interpreted within the “internal clock theory” as modality-specific differences in the pulse rate of the pacemaker (e.g., Wearden et al., 2006). The difference that we observe between vision and touch increases proportionally with stimulus duration, ruling out explanations based on effects at onset and offset (Penney et al., 2000; Burle and Casini, 2001).
The reasons for these modality effects in the perception of duration are not clear at present, but certainly pose the problem of how the brain handles inter-sensory conflicts when multimodal events have to be timed. We tried to tackle this issue examining duration reproduction for bimodal visuo-tactile stimuli. The results show that both vision and touch contribute to the final duration percept, as indicated by the bimodal estimates lying between the unimodal estimates. The bimodal durations were statistically indistinguishable from the quantitative predictions of optimal fusion (weighted average of the unimodal estimates). However, the bimodal precision was far from being “optimal,” not showing the theoretical improvement. One reason for the lack of improvement in thresholds may be that our experimental design involved temporal reproduction, and a full model would have to consider that the reproduction task might have introduced its own noise, and this would affect the predictions. In effect, as this noise occurs after the fusion of visual and tactile signals, it would add to all threshold estimates, and dilute any advantage that may have been gained from the bimodal fusion.
The encoding of duration cannot rely on specific sense organs, nor seems to be subserved by a specifically dedicated pathway. Our sense of time is continuously subject to numerous distortions (for a review see Eagleman, 2008), probably reflecting the fact that time analysis is interconnected with the processing of other contents of the external world, suggesting that this inherent plasticity of the system is functionally more relevant than having a stable and exact metric of time.
Conflict of Interest Statement
The authors declare that the research was conducted in the absence of any commercial or financial relationships that could be construed as a potential conflict of interest.
Acknowledgments
This work was partially supported by the IDEA-ERC project STANIB, ASI Italian Space Agency and the PRIN2009 grant from the Italian Ministry for Universities and Research.
References
Alais, D., and Burr, D. (2004). The ventriloquist effect results from near-optimal bimodal integration. Curr. Biol. 14, 257–262.
Aschersleben, G., and Bertelson, P. (2003). Temporal ventriloquism: crossmodal interaction on the time dimension 2. Evidence from sensorimotor synchronization. Int. J. Psychophysiol. 50, 157–163.
Bensmaia, S. J., Killebrew, J. H., and Craig, J. C. (2006). Influence of visual motion on tactile motion perception. J. Neurophysiol. 96, 1625–1637.
Bicchi, A., Scilingo, E. P., Ricciardi, E., and Pietrini, P. (2008). Tactile flow explains haptic counterparts of common visual illusions. Brain Res. Bull. 75, 737–741.
Bresciani, J. P., Ernst, M. O., Drewing, K., Bouyer, G., Maury, V., and Kheddar, A. (2005). Feeling what you hear: auditory signals can modulate tactile tap perception. Exp. Brain Res. 162, 172–180.
Brown, S. W. (1995). Time, change, and motion: the effects of stimulus movement on temporal perception. Percept. Psychophys. 57, 105–116.
Burle, B., and Casini, L. (2001). Dissociation between activation and attention effects in time estimation: implications for internal clock models. J. Exp. Psychol. Human Percept. Perform. 27, 195–205.
Burr, D., Banks, M. S., and Morrone, M. C. (2009). Auditory dominance over vision in the perception of interval duration. Exp. Brain Res. 198, 49–57.
Burr, D., Tozzi, A., and Morrone, M. C. (2007). Neural mechanisms for timing visual events are spatially selective in real-world coordinates. Nat. Neurosci. 10, 423–425.
Craig, J. C. (2006). Visual motion interferes with tactile motion perception. Perception 35, 351–367.
Eagleman, D. M. (2008). Human time perception and its illusions. Curr. Opin. Neurobiol. 18, 131–136.
Ernst, M. O., and Banks, M. S. (2002). Humans integrate visual and haptic information in a statistically optimal fashion. Nature 415, 429–433.
Ernst, M. O., and Bülthoff, H. H. (2004). Merging the senses into a robust percept. Trends Cogn. Sci. (Regul. Ed.) 8, 162–169.
Gamache, P., and Grondin, S. (2010). Sensory-specific clock components and memory mechanisms: investigation with parallel timing. Eur. J. Neurosci. 31, 1908–1914.
Gibbon, J., Malapani, C., Dale, C. L., and Gallistel, C. R. (1997). Toward a neurobiology of temporal cognition: advances and challenges. Curr. Opin. Neurobiol. 7, 170–184.
Goldstone, S., and Lhamon, W. T. (1974). Studies of auditory-visual differences in human time judgment: 1. Sounds are judged longer than lights. Percept. Mot. Skills 39, 63–82.
Gori, M., Mazzilli, G., Sandini, G., and Burr, D. (2011). Cross-sensory facilitation reveals neural interactions between visual and tactile motion in humans. Front. Psychol. 2:55.
Grondin, S. (2003). “Sensory modalities and temporal processing,” in Time and Mind II, ed. H. Helfrich (Göttingen: Hogrefe & Huber), 61–77.
Hagen, M. C., Franzen, O., McGlone, F., Essick, G., Dancer, C., and Pardo, J. V. (2002). Tactile motion activates the human middle temporal/V5 (MT/V5) complex. Eur. J. Neurosci. 16, 957–964.
Harrar, V., and Harris, L. R. (2007). Multimodal ternus: visual, tactile and visuo-tactile grouping in apparent motion. Perception 36, 1455–1464.
Harrington, D. L., Castillo, G. N., Fong, C. H., and Reed, J. D. (2011). Neural underpinnings of distortions in the experience of time across senses. Front. Integr. Neurosci. 5:32.
Johnston, A., Arnold, D. H., and Nishida, S. (2006). Spatially localized distortions of event time. Curr. Biol. 16, 472–479.
Kanai, R., Paffen, C. L. E., Hogendoorn, H., and Verstraten, F. A. J. (2006). Time dilation in dynamic visual display. J. Vis. 6, 1421–1430.
Kaneko, S., and Murakami, I. (2009). Perceived duration of visual motion increases with speed. J. Vis. 9, 1–12.
Khoshnoodi, M. A., Motiei-Langroudi, R., Omrani, M., Diamond, M. E., and Abbassian, A. H. (2008). Effect of tactile stimulus frequency on time perception: the role of working memory. Exp. Brain Res. 185, 623–633.
Konkle, T., Wang, Q. I., Hayward, V., and Moore, C. I. (2009). Motion aftereffects transfer between touch and vision. Curr. Biol. 19, 745–750.
Ley, I., Haggard, P., and Yarrow, K. (2009). Optimal integration of auditory and vibrotactile information for judgments of temporal order. J. Exp. Psychol. Human Percept. Perform. 35, 1005–1019.
Lhamon, W. T., and Goldstone, S. (1975). Movement and the judged duration of visual targets. Bull. Psychon. Soc. 5, 53–54.
Morein-Zamir, S., Soto-Faraco, S., and Kingstone, A. (2003). Auditory capture of vision: examining temporal ventriloquism. Cogn. Brain Res. 17, 154–163.
Morrone, M. C., Ross, J., and Burr, D. (2005). Saccadic eye movements cause compression of time as well as space. Nat. Neurosci. 8, 950–954.
Pei, Y. C., Hsiao, S. S., Craig, J. C., and Bensmaia, S. J. (2011). Neural mechanisms of tactile motion integration in somatosensory cortex. Neuron 69, 536–547.
Penney, T. B., Gibbon, J., and Meck, W. H. (2000). Differential effects of auditory and visual signals on clock speed and temporal memory. J. Exp. Psychol. Human Percept. Perform. 26, 1770–1787.
Recanzone, G. H. (2003). Auditory influences on visual temporal rate perception. J. Neurophysiol. 89, 1078–1093.
Ricciardi, E., Vanello, N., Dente, D., Sgambelluri, N., Scilingo, E. P., Gentili, C., Sani, L., Positano, V., Santarelli, F. M., Guazzelli, M., Haxby, J. V., Landini, L., Bicchi, A., and Pietrini, P. (2004). “Perception of visual and tactile flow activates common cortical areas in the human brain,” in Proceedings of the EuroHaptics 2004 (Germany: Technische Universitat Munchen), 290–292.
Terao, M., Watanabe, J., Yagi, A., and Nishida, S. (2008). Reduction of stimulus visibility compresses apparent time intervals. Nat. Neurosci. 11, 541–542.
Tomassini, A., Gori, M., Burr, D., Sandini, G., and Morrone, C. (2010). The spatial selectivity of neural timing mechanisms for tactile events. J. Vis. 10, 1410.
Treisman, M. (1963). Temporal discrimination and the indifference interval. Implications for a model of the ‘internal clock’. Psychol. Monogr. 77, 1–31.
van Erp, J. B. F., and Werkhoven, P. J. (2004). Vibro-tactile and visual asynchronies: sensitivity and consistency. Perception 33, 103–111.
Walker, J. T., and Scott, K. J. (1981). Auditory-visual conflicts in the perceived duration of lights, tones and gaps. J. Exp. Psychol. Human Percept. Perform. 7, 1327–1339.
Watanabe, J., Amemiya, T., Nishida, S., and Johnston, A. (2010). Tactile duration compression by vibrotactile adaptation. Neuroreport 21, 856–860.
Watanabe, J., Hayashi, S., Kajimoto, H., Tachi, S., and Nishida, S. (2007). Tactile motion aftereffects produced by appropriate presentation for mechanoreceptors. Exp. Brain Res. 180, 577–582.
Watson, A. B., and Pelli, D. G. (1983). QUEST: a Bayesian adaptive psychometric method. Percept. Psychophys. 33, 113–120.
Wearden, J. H., Edwards, H., Fakhri, M., and Percival, A. (1998). “Why sounds are judged longer than lights”: application of a model of the internal clock in humans. Q. J. Exp. Psychol. B 51, 97–120.
Wearden, J. H., Todd, N. P., and Jones, L. A. (2006). When do auditory/visual differences in duration judgments occur? Q. J. Exp. Psychol. 59, 1709–1724.
Keywords: time perception, multisensory integration, vision, touch, motion
Citation: Tomassini A, Gori M, Burr D, Sandini G and Morrone MC (2011) Perceived duration of visual and tactile stimuli depends on perceived speed. Front. Integr. Neurosci. 5:51. doi: 10.3389/fnint.2011.00051
Received: 09 June 2011; Paper pending published: 26 June 2011;
Accepted: 23 August 2011; Published online: 12 September 2011.
Edited by:
Warren H. Meck, Duke University, USACopyright: © 2011 Tomassini, Gori, Burr, Sandini and Morrone. This is an open-access article subject to a non-exclusive license between the authors and Frontiers Media SA, which permits use, distribution and reproduction in other forums, provided the original authors and source are credited and other Frontiers conditions are complied with.
*Correspondence: Alice Tomassini, Department of Robotics, Brain and Cognitive Sciences, Istituto Italiano di Tecnologia, Via Morego, 30, Genova, 16163, Italy. e-mail:YWxpY2UudG9tYXNzaW5pQGlpdC5pdA==