

- 1 Perceptual-Motor Dynamics Laboratory, Department of Psychology, CAP Center for Cognition, Action and Perception, University of Cincinnati, Cincinnati, OH, USA
- 2 Department of Psychology, CAP Center for Cognition, Action and Perception, University of Cincinnati, Cincinnati, OH, USA
The current experiment investigated the effect of visual accuracy feedback on the structure of variability of time interval estimates in the continuation tapping paradigm. Participants were asked to repeatedly estimate a 1-s interval for a prolonged period of time by tapping their index finger. In some conditions, participants received accuracy feedback after every estimate, whereas in other conditions, no feedback was given. Also, the likelihood of receiving visual feedback was manipulated by adjusting the tolerance band around the 1-s target interval so that feedback was displayed only if the temporal estimate deviated from the target interval by more than 50, 100, or 200 ms respectively. We analyzed the structure of variability of the inter-tap intervals with fractal and multifractal methods that allow for a quantification of complex long-range correlation patterns in the timing performance. Our results indicate that feedback changes the long-range correlation structure of time estimates: Increased amounts of feedback lead to a decrease in fractal long-range correlations, as well to a decrease in the magnitude of local fluctuations in the performance. The multifractal characteristics of the time estimates were not impacted by the presence of accuracy feedback. Nevertheless, most of the data sets show significant multifractal signatures. We interpret these findings as showing that feedback acts to constrain and possibly reorganize timing performance. Implications for mechanistic and complex systems-based theories of timing behavior are discussed.
Introduction
Human performance on virtually all tasks exhibits variability from trial to trial (Bernstein, 1967). Studying the variability of human performance provides a window into the organization of perceptual-motor (Riley and Turvey, 2002), motor (Slifkin and Newell, 1998), and cognitive systems (Van Orden et al., 2011). One of the first attempts to understand the nature of variability of discrete human movements was made by Wing and Kristofferson (1973) using tasks that required continuous estimation of a constant time interval by tapping the index finger. They hypothesized that two independent processes determine the inter-tap interval (ITI) at tap j (ITIj) by the following relation:

where Cj is a timing motor command from a central cognitive timer to the motor periphery that executes it with a neuro-muscular delay (Di) compounded with the delay on the previous tap. Both C and D were assumed to be independent, uncorrelated white noise processes. Because of the subtraction of the two motor delays from consecutive trials, their model predicted that a continuous sequence of temporal interval estimates should yield a negative lag-1 autocorrelation. This prediction was verified in studies of Vorberg and Wing (1996), as well as Wing (1980) for series of about 100 estimates (cf. Delignières and Torre, 2011).
However, Gilden et al. (1995) presented results that failed to corroborate this prediction in long-term continuous temporal estimation. In their study, participants first heard several examples of a temporal interval (ranging from 0.3 to 10 s) and then continued tapping at the presented pace until they had tapped 1000 times. Power spectral analysis of time series of ITIs revealed a pattern of long-range correlated variation called 1/f noise which possesses positive autocorrelation structure, not the negative lag-1 autocorrelation predicted by the Wing and Kristofferson (1973) model. They extended the two-component model of Wing and Kristofferson by treating the cognitive timer (C) as a source of 1/f noise. Further studies confirmed the presence of positive long-range correlations in the ITIs through the use of autoregressive fractionally integrated moving average (ARFIMA) modeling (Lemoine et al., 2006). The finding was also replicated by Holden et al. (2011) and Kiefer et al. (2009). Processes with long-range correlations that conform to 1/f noise are statistical fractals because the larger patterns of variability repeat themselves on smaller scales (Brown and Liebovitch, 2010).
Most recently, Ihlen and Vereijken (2010) reported results that suggested that ITIs in continuous time estimation exhibit intermittent fluctuations – an even more intricate pattern of variability than what is expected from a fractal signal. Intermittency is a special kind of inhomogeneity of variance in time that manifests itself in periods of relatively low variability interspersed with periods of relatively high variability. Presence of intermittency implies that different moments of the observed time series of ITIs require different fractal exponents – they are multifractal (Mandelbrot, 1997; Ihlen and Vereijken, 2010).
The current paper extends this line of work by studying the effects of different task constraints aimed at manipulating the strength of 1/fα noise in the ITI variability as well as examining related changes in multifractality of these response series. The strength of 1/f noise in cognitive measures is typically defined by the distance of the α exponent from the ideal pink noise (α = 1). In the sections below, we first describe 1/f noise and multifractality in greater detail and then present our logic for the experimental hypotheses.
Fractal Variability in Cognitive and Timing Performance
1/f noise is a specific kind of variability different in quality from random (white) noise – it is an example of a fractal structure because fluctuations of the measured quantity on large time scales are effectively repeated on smaller time scales (Holden, 2005; Brown and Liebovitch, 2010). This type of variability is frequently expressed in terms of Fourier decomposition: 1/f noise is characterized by a power–law relationship between the power (P) and frequency (f ) content of the time series of the type P = 1/f α on a log–log plot (Eke et al., 2000, 2002; Holden, 2005). The scaling exponent α identified in a variety of tasks of cognitive psychology lies typically between 0 and 1 – the range of fractional Gaussian noise. However, α is usually close to 1. 1/fα noise processes with α = 1 are termed pink noise. Pink noise has been found in numerous measurements of human performance (Gilden, 2001) as well as in many other biological signals (Werner, 2010).
The observation of 1/f noise in cognitive performance spurred a debate about its significance not only for timing, but also for cognition and psychological measurement in general (Van Orden et al., 2003, 2005, 2010; cf. Wagenmakers et al., 2004, 2005; Torre and Wagenmakers, 2009). Currently, there are two major perspectives on the occurrence of 1/f noise in cognitive measurements (Diniz et al., 2010). From the mechanistic perspective, this kind of noise is simply a statistical characteristic of the observed data that should be incorporated into already existing models of interval timing by assigning it to one of the components in these models (e.g., Delignières et al., 2008; Torre and Delignières, 2008), effectively expanding the models’ error terms. From the complexity perspective, the appearance of 1/f noise suggests that the cognitive system maintains itself in a state of criticality similarly to other physical systems (Bak, 1996; Jensen, 1998). From this perspective, there is no particular cognitive component that causes 1/f noise to occur – instead it is an emergent property that stems from the interactions across the many spatio-temporal scales of organization of an organism – it is a signature of interaction-dominant dynamics (Van Orden et al., 2003, 2005). The defining characteristic of this view is that the interactions among the components play a greater role in explaining the behavior than the dynamics of individual components themselves (Turvey, 2007, p. 690). From the perspective of interaction–dominance the idea of an independent central timer would be an oversimplification, since timing behavior is the result of the inextricable interaction between the participant and the environmental regularities. This debate about the organization of cognition as component- or interaction-dominant mirrors the debate about the organization of timing as being either event-based or continuous (see Schöner, 2002) – and the interpretation of the role of 1/f noise lies at its center.
Initially, many measured signals such as heart rate (Ivanov et al., 1999), human gait (West and Scafetta, 2003), and simple response tasks (Ihlen and Vereijken, 2010) were thought to be a monofractal 1/f noise but have recently been reclassified as multifractal – the variability in these signals cannot be fully accounted for by a single scaling exponent α. Multifractality in a time series can either due to due to very heavy tail of the distribution of responses, generating many instances of high magnitude values, due to the temporal sequences in which periods of low variability are irregularly interspersed with periods of relatively high variability, or due to a combination of the two (Kantelhardt et al., 2002). Mandelbrot (1997) pointed out that monofractal analysis based on Fourier power spectrum decomposition is “blind” to such dynamics because it assumes a single stable scaling relation between the frequency and magnitude of fluctuations. Continuation tapping seems to exhibit a moderate degree of multifractality that is more pronounced in some participants than others (Ihlen and Vereijken, 2010).
We consider that proper experimental control over the α exponent in 1/f-type fluctuations and of the magnitude of multifractality is the next challenge in understanding the long-term organization of timing behavior. We propose that thinking about different kinds of constraints imposed on the actor during temporal estimation tasks may provide a heuristic framework for the understanding of changes in the scaling exponents and potentially multifractal characteristics as well. Newell (1986) suggested that any behavioral performance results from the coordination between the degrees of freedom of the organism, constrained by the intrinsic characteristics of the actor (e.g., properties of the neuro-muscular apparatus), constraints of the task at hand, and the environment (Newell, 1986). Within the continuous time estimation paradigm, we reasoned that accuracy feedback about every produced time estimate is a kind of task constraint that limits the possible coordination patterns of the actor during behavioral performance. In the case of continuous time interval estimation, accuracy feedback constrains the participant’s timing responses so that they remain closer to the level of the target interval required by the task instructions. Certain responses that would result in a greater deviation from the target interval become less likely – the range of possible behaviors is narrowed through feedback. Thus, the observed final behavior is a result of the coordination of the degrees of freedom available to the participant under the given constraints from the neuro-muscular system, task, and the environment.
Experiment and Hypotheses
The specific aim of this experiment was to test the effects of increasing external constraints on the long-term structure of responses in continuous time interval estimation. We manipulated external task constraints by changing the likelihood of receiving accuracy feedback about the produced temporal estimates. This manipulation has been used in previous studies of classical scalar timing models (Wearden and McShane, 1988) and seems to affect the magnitude of response variability. This suggests that participants may employ different strategies for interval estimation depending on such external constraints. However the effects of this feedback manipulation on the long-range correlation or multifractal structure of the temporal estimates have not been investigated.
Continuous time estimation without feedback produces the clearest and strongest signatures of 1/fα noise as compared to a variety of other cognitive tasks (Kello and Van Orden, 2009; Holden et al., 2011). Perhaps this is so because the time estimation task typically places only minimal constraints on the actor (Gilden, 2001). Since unperturbed temporal estimation has been found to yield 1/f noise, we expected that the no-feedback condition in our experiment would similarly reveal a clear signature of 1/f noise. Accuracy feedback constitutes a source of constraint and perturbation to the performance dynamics of time estimation and more frequent feedback should result in increasingly perturbed dynamics quantified by α (Kloos and Van Orden, 2010; Holden et al., 2011; Van Orden et al., 2011). Thus, we expected that the time series of ITIs with full accuracy feedback delivered on every trial would be closer to white noise (α = 0) as compared to the estimates produced without feedback. In addition, we manipulated the likelihood of receiving feedback by changing the tolerance thresholds for feedback delivery centered on the 1-s target interval. In different conditions, accuracy feedback was provided if participants over- or under-estimated the 1-s interval by either 50, 100, or 200 ms. Trial-by-trial feedback of this kind will be unsystematic as it is contingent on the irregular trial performance itself. A higher tolerance for deviation (e.g., ±200 ms) leads to fewer occurrences of feedback and therefore constitutes a less frequent source of perturbation. Lower tolerance (e.g., ±50 ms) should lead to more frequent trial perturbations and progressively whiter, more uncorrelated performance (α closer to 0).
Our secondary goal was to provide preliminary evidence for the effects of external task constrains on the multifractal characteristics of long-term behavioral responses using the methodological framework for multifractal analysis of cognitive measurements proposed by Ihlen and Vereijken (2010). First, we quantified the effects of task constraints on the local α exponent of the ITI time series, α(t), that was calculated from wavelet variance. If feedback acts as a constraint on the changing scaling properties of the time estimates, then it could be expected that α(t) would fluctuate less with frequent accuracy feedback deliveries because this constraint favors a stable organization of behavior with respect to the task and could be accomplished by simple error correction. Second, we estimated the multifractal spectrum of scaling exponents – a generalization of 1/f α power–law to higher moments of variability of response series (Ihlen and Vereijken, 2010). The prediction that more frequent feedback perturbations will yield whiter 1/f signals has not been extrapolated to multifractal analysis – it is hard to visualize how higher moments of the variability might behave under such circumstances. Typically multifractals show intermittency where the magnitude of the variability of the dependent variable changes over time (Ihlen and Vereijken, 2010). Larger width of the multifractal spectrum suggests presence of stronger intermittency – greater differences between the relatively quiescent and variable periods of the performance. We did not have specific expectations about changes in the multifractal spectrum width with respect to the task constraints. On the one hand, multifractality may decrease with more frequent feedback because participants will be able to make more precise and systematic corrections, effectively eliminating inhomogeneities in the variability of timing. On the other hand, even with frequent feedback, participants may show local periods where they are producing more variable temporal estimates at some times during task performance. Accordingly, our goal was to provide an initial insight into the relationship between accuracy feedback and multifractality during time estimation.
Materials and Methods
Participants
Six undergraduate students (two male, four female) participated in the experiment and were compensated with $5 per session. Five were students of the University of Cincinnati and one was an acquaintance of the authors. The mean age was 21.2 years, ranging from 19 to 27 years. The IRB of the University of Cincinnati approved the study.
Procedure
Participants listened to 20 metronome beats of the 1-s interval to be estimated and then immediately began performing the time estimation task. Participants were asked to press the keyboard space bar each time they thought a 1-s interval had passed for a total of 1050 interval estimates. The task was performed without breaks and took approximately 20 min. There were five conditions that every participant completed on five separate days: Time estimation without any accuracy feedback, with feedback only if the response exceeded either the 200, 100, or 50-ms band around the 1-s target interval, and with feedback after every trial. The order of the conditions was counterbalanced as a Latin square between participants. The condition without the accuracy feedback was similar to continuation tapping experiments conducted before (Gilden et al., 1995; Chen et al., 2002; Wagenmakers et al., 2004; Torre and Delignières, 2008). In the accuracy feedback condition, participants saw visual feedback specifying the error of their current time estimate in milliseconds. For example, if a participant hit the space bar 250 ms after 1 s had passed since the previous press, feedback on the screen would read “250 ms late.” Participants wore noise-reducing headphones to minimize distractions. However, they were able to hear the sound of their own button presses.
Materials and Equipment
We used the Psychophysics Toolbox for Matlab (Brainard, 1997) to collect the time of each key press during the experiment. Time estimates were recorded from the presses of the spacebar of a millisecond-accurate keyboard (Apple A1048, Empirisoft). We defined one time interval estimate (ITI) as the time from the beginning of one space bar press to the next one.
Data Analysis
Monofractal analysis
We conducted power spectral density (PSD) analysis using Welch’s windowed method (Matlab’s “pwelch” function) to examine changes in the monofractal structure of variability of ITIs. We first removed any time interval estimates lower than 200 ms and greater than 2000 ms because these are likely to be spurious presses not related to 1-s interval estimation1. We also removed linear and quadratic trends from the data to avoid classifying a given time series that merely exhibited a simple trend as fractal. The number of removed data points across all participants and conditions ranged from 2 to 8 with a median of 3.5 per trial. Participant 4 had more trials removed compared to other participants (range 15–52; median 16) because he frequently pressed the response key faster than 200 ms.
Power spectral density was applied to the time series of ITIs using a 128-point Hamming window with 50% overlap and 128-point NFFT Fourier transform length. We calculated the slope of the linear relationship between the log-transformed frequency and log-transformed power of the signal for up to 1/4 of the total number of estimated frequencies as a measure of the spectral scaling exponent α (the absolute value of the slope was computed). Only the lowest 25% of the frequencies were used because the scaling relation typically breaks down at frequencies higher than that in continuation timing data (Lemoine et al., 2006). Slopes (α) close to 1 suggest the presence of long-range correlated 1/fα noise. Slopes close to 0 indicate uncorrelated (white) noise.
Wavelet variance PSD estimate: α(t)
We calculated the trial-dependent changes in the scaling exponent a(t) using the methodology proposed by Ihlen and Vereijken (2010). The time series of the ITIs were first decomposed into a set of wavelet coefficients defined for a set of discrete dyadic scales ranging from 2 to 64 trials using the maximal overlap discrete wavelet transform (MODWT) with the eighth order least-asymmetric waveform (for a description of MODWT see Ihlen and Vereijken, 2010 or Percival and Walden, 2000). Then the variance of the wavelet coefficients at each scale was calculated in 100 trial windows over the length of the whole time series. Because wavelet scales are closely related to signal frequencies, the estimate of wavelet variance over the defined scales is frequently used as an alternative method to define the PSD function of the response series. Using this relation, a linear fit between log10(scale) and log10(wavelet variance) gave an estimate of the α(t) for a particular window. We used mGn_modwt_estim function from the toolbox developed by E. Ihlen to conduct this analysis2.
Multifractal Spectrum
Multifractal spectrum provides an additional insight into the nature of changes in the scaling exponent. The MODWT-based method to estimate α(t) described above assumes that α(t) changes smoothly over the trials, whereas the analysis of multifractality in terms of the multifractal spectrum assumes that α(t) is a random variable defined by its distribution. Both analyses are therefore complimentary because they give some idea about the variability in the fractal properties. We followed the methodological framework for multifractal analysis described in Ihlen and Vereijken (2010) to estimate the multifractal spectrum of the ITIs. We used the continuous wavelet transform (CWT) to analyze ITI variability (for a description of CWT see Percival and Walden, 2000). A Morlet wavelet (wavenumber 6) at scales corresponding to a range of 2 to 64 trials was chosen for the mother wavelet. The spacing between the resolved scales was set to 1/16 of a trial. Figure 1B provides an example of the CWT of one of the time series recorded in the experiment in the no-feedback condition (Figure 1A). We then calculated the log-transformed average of the absolute wavelet coefficients for each wavelet scale Δt across the duration of all trials to estimate the linear scaling relation (ζ) between log2(average wavelet coefficient at scale Δt) and log2(Δt). Using an additional parameter q, one can emphasize smaller or larger wavelet coefficients by raising each one of them present at a Δt scale to the q-th power to obtain a general function ζ(q) specifying the range of scaling exponents between log2(average wavelet coefficient at scale Δt) raised to the power of q and log2(Δt). We used q-values in the range 0.1–3. The results of these calculations are plotted in Figure 1C.
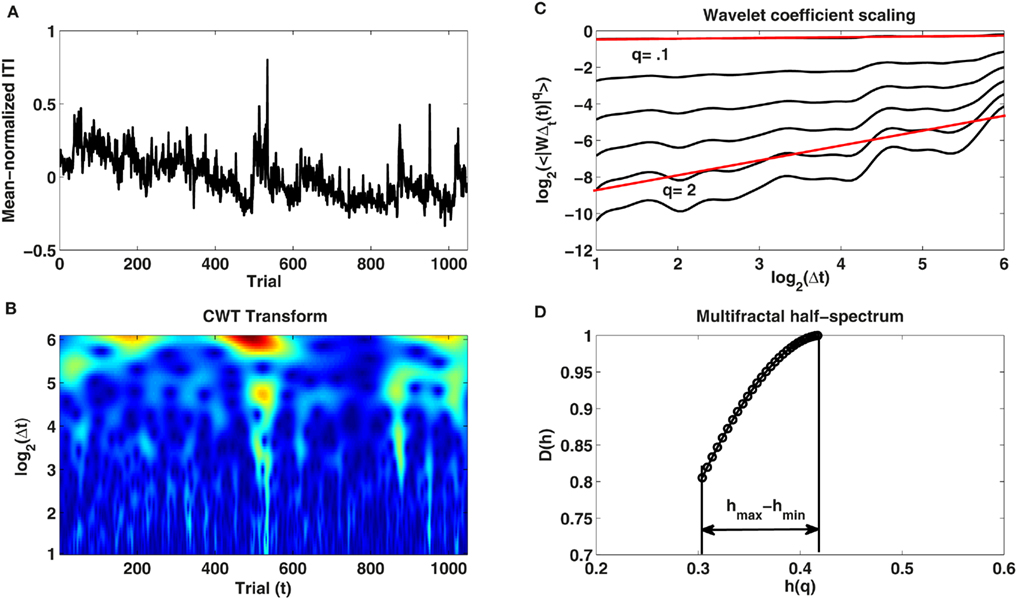
Figure 1. (A) Shows the time series of mean-normalized inter-tap intervals produced by participant 3 in the no-feedback condition over the 1048 trials. (B) Illustrates the continuous wavelet transform (CWT) of this ITI time series for scales Δt ranging from 2 to 64 trials. (C) Depicts the linear relationship between the averaged absolute wavelet coefficients <|WΔt(t)|q> calculated across trials (t) at each scale (Δt) and different wavelet scales (Δt) on log–log plot for different q-values (see text). (D) Shows the multifractal spectrum D(h) and its width (hmax − hmin) estimated with the CWT.
As a last step, we calculated the multifractal spectrum using the ζ(q) results. The Hölder exponent h and the multifractal spectrum D(h) were obtained through the Legendre transformation of:
The width hmax − hmin of the multifractal spectrum D(h) defines the amplitude difference between the variability in the intermittent and in the laminar periods of the observed time series (see Figure 1D; Ihlen and Vereijken, 2010). If hmax − hmin is close to zero, then the time series can be assumed to be monofractal (intermittent periods are absent). On the other hand, if hmax − hmin is greater than zero, then the time series may be multifractal. Larger hmax − hmin are associated with a greater degree of multifractality.
Two types of comparisons are of interest when the multifractal spectrum of time estimation data is computed. The first type of comparison is whether the width of the multifractal spectrum (hmax − hmin) changes with the application of accuracy feedback. The second type of comparison is the surrogate analysis, where the multifractal spectrum of the time series of ITIs with the original ordering is compared to the same time series with randomized ordering of the data points. Ihlen and Vereijken (2010) proposed to conduct surrogate tests to distinguish between multifractality due to multiplicative interactions between temporal scales and multifractality due to 1/fα power–law and a non-Gaussian probability density function. To test whether observed multifractal structure is not just a function of the power spectrum and the probability density, we shuffled the phases of the time series of temporal estimates while their probability density function and scaling relation (α) were kept constant using the inverse amplitude-adjusted Fourier transform (IAAFT; Ihlen and Vereijken, 2010). We generated 30 such surrogate data series for each response time series of the experiment. Multifractality due to multiplicative interactions between the time scales of time estimates (phase couplings between the scales) is present when the observed multifractal spectrum (hmax − hmin) is greater than the 95% confidence interval calculated from the hmax − hmin of the surrogates. If the observed spectrum is within or below the 95% confidence interval then the observed time series is either monofractal or multifractal due to a broad non-Gaussian distribution of response times. Such broad distribution is indicative of singular outlying events that introduce inhomogeneity of variance as opposed to intermittent periods of lower and higher variability. Monofractality is only present if the 95% confidence interval and the observed hmax − hmin are close to zero. This analysis was conducted using the functions from the multifractal analysis toolbox developed by E. Ihlen3.
Results
Frequency of Accuracy Feedback
The frequency of received accuracy feedback changed reliably between the five conditions, F(4, 20) = 184.75, p < 0.001. In the full-feedback condition, participants received feedback on every trial (100.0%), and in the no-feedback condition, participants received feedback on none of the trials (0.0%). In the three conditions between full-feedback and no-feedback, participants received feedback on 50.3% (SD = 15.6%) of the trials with a 50-ms window around the target interval, 24.3% (SD = 8.0%) of the trials with a 100-ms window around the target interval, and 4.5% (SD = 4.2%) of the trials with a 200-ms window around the target interval.
Average Interval Length and SD of Time Estimation
Table 1 shows the average time intervals estimated, as well as the average SD of interval estimates, for each condition. A repeated-measures ANOVA revealed differences in the average time interval estimation due to differences in the feedback condition, F(4, 20) = 3.69, p < 0.05. Planned contrasts revealed that the no-feedback condition led to relatively faster estimates than all other conditions. There was no difference in the average SD of time interval estimation due to differences in the frequency of feedback received, F(4, 20) = 0.76, p = 0.56.
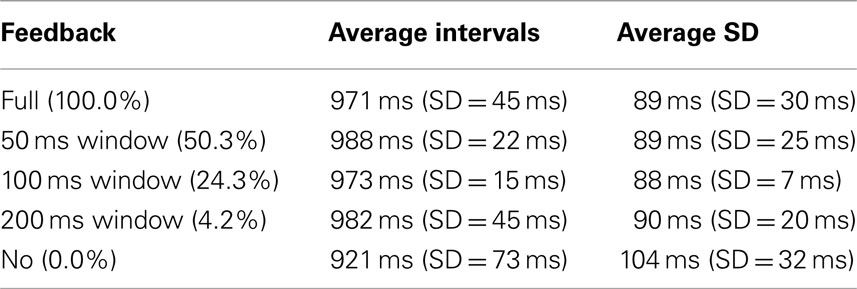
Table 1. Averages and average SD of time interval estimates.
Monofractal Characteristics of Time Estimation
The overall time estimate data are presented in Figure 2 and the results of power spectral analysis of these data are given in Figure 3. A repeated-measures ANOVA revealed that scaling exponents changed from values close to idealized pink noise to values closer to idealized white noise the more often participants received feedback, F(4, 20) = 5.07, p < 0.01. Within-participant contrasts revealed a roughly linear increase in α exponents with as the amount of feedback received decreased, F(1, 5) = 18.18, p < 0.01.
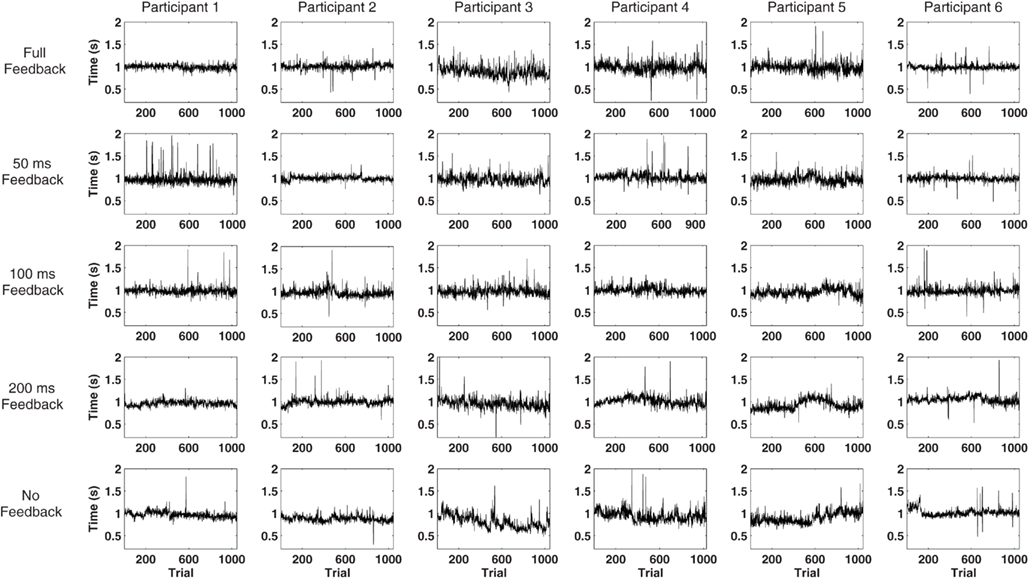
Figure 2. Illustration of the individual response series in each one of the experimental conditions.
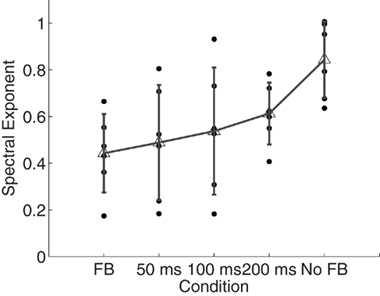
Figure 3. Spectral exponents of the time estimates. Spectral exponents α closer to 0 imply presence of white noise whereas values closer to 1 suggest pink noise. Individual points represent observations from individual participants. Error bars plot within-condition SD.
Changes in α(t)
A repeated-measures ANOVA showed that the range of the scaling exponents α(t) differed across the feedback conditions, F(4, 20) = 5.87, p < 0.01 (see Figure 4). Post hoc corrected t-tests showed that the range of variability of α(t) during time estimation without feedback was greater than in all feedback conditions which were similar to one another (p > 0.05).
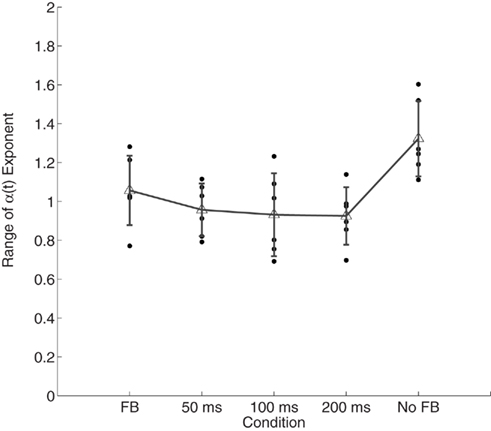
Figure 4. Range of variability in α(t)as function of accuracy feedback. Individual points represent observations from individual participants. Error bars plot within-condition SD.
Multifractal Spectrum
We were interested in whether the width of the multifractal spectrum differed between the different feedback conditions and whether there were differences in the width of the multifractal spectrum between the original time series and their phase-shuffled surrogates. A repeated-measures ANOVA revealed no differences in the width of the multifractal spectrum among feedback conditions, F(4, 20) = 0.66, p = 0.62. To investigate differences between the original time series data and their surrogates, we counted the number of observed multifractal widths that were larger than the 95% confidence interval of the phase-shuffled surrogates as an indication of multifractality due to interaction of processes across the different time scales examined in the wavelet analysis. There were 22 such response series. We also counted the number of cases falling within the 95% confidence interval, as well as the number of cases that lay outside of the 95% confidence interval but close to zero multifractal width (hmax − hmin). There were six series in the former group and only two in the latter (participant 4 full-feedback; participant 2 50 ms feedback). These individual results are illustrated in Figure 5. Overall group results averaged over all feedback conditions are presented in Figure 6 together with the multifractal spectra for the simulated ideal white and pink noises.
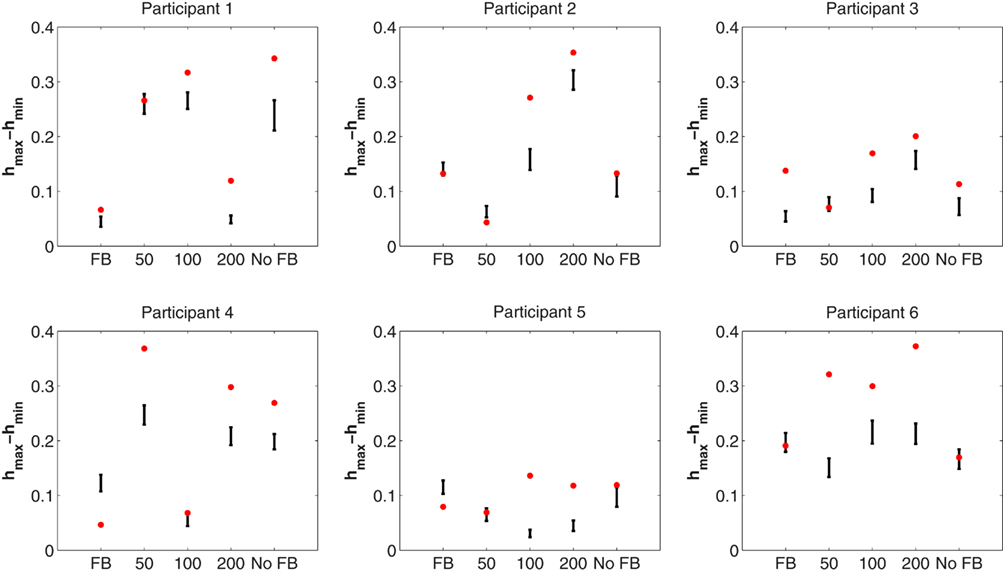
Figure 5. Results from the multifractal analysis of ITI response series for each participant and each condition. The width of the multifractal spectrum width (hmax − hmin) is shown by a red dot. Ninety-five percentage confidence interval for the 30 surrogate time series from each response series is illustrated. Multifractal spectrum width for a pure simulated 1/f noise without phase couplings is close to zero.
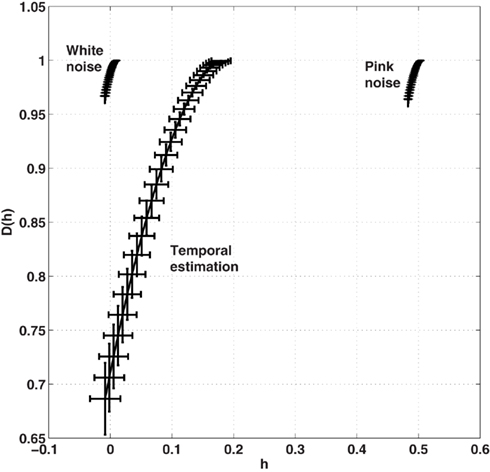
Figure 6. Average multifractal width of the ITIs averaged across all participants and all conditions is presented in Figure 5. Results of the multifractal analysis of the simulated 1/f noises (α = 0; white noise and α = 1; pink noise) are provided for a comparison with the multifractal width of the observed time series of ITIs. Horizontal and vertical error bars indicate SE across 30 experimental response series and 30 simulations of each noise process, respectively.
There was no significant Pearson correlation between the hmax − hmin and the scaling exponents α (r = 0.12, p = 0.50). We also examined correlation with the high frequency slope (highest 75% of the frequencies) and found no correlation as well (r = −0.11, p = 0.53).
Discussion
The presented experiment examined the role of environmental task constraints in the form of accuracy feedback on the organization of long-term the pattern of ITI in repetitive timing behavior. We manipulated the likelihood of receiving accuracy feedback for participants and interpreted this as a measure of the strength of the external constraints on their performance. More frequent instances of accuracy feedback were hypothesized to result in a greater constraint on the task performance and to decrease the strength of the long-range correlations in the series of estimated time intervals. Results of the PSD analysis showed that spectral exponents α in all conditions were in the range of fractional Gaussian noises (0 < α < 1), but were closest to 1 when no feedback was provided (in line with Gilden et al., 1995; Delignières et al., 2004; Lemoine et al., 2006). However, when participants were given accuracy feedback on each trial, the structure of variability of the time estimates moved closer to uncorrelated white noise. In general, spectral exponents progressively decreased with more stringent accuracy feedback. These findings corroborate the hypothesis that increased constraints on the performance may lead to a different organization of the control systems that underlie long-term timing behavior (Newell, 1986; Van Orden et al., 2011).
Furthermore, the variability of ITI was more complex than expected from a pure monofractal model in most of our participants. We considered two aspects of this complexity in relation to the feedback manipulation: slow changes in the local α exponent, α(t), and the different scaling regimes in the wavelet variance using the methodology of Ihlen and Vereijken (2010). We expected that more frequent accuracy feedback would decrease the shifts between different serial dependency regimes and but did not make any explicit predictions for the changes in the multifractal structure.
Local α Exponent α(t)
We observed that the range of the α(t) exponent fluctuations was the greatest in the unconstrained temporal estimation, but sharply decreased as soon as any feedback was introduced. This finding suggests that a single scaling exponent may not be appropriate to characterize the variability of unconstrained time estimation – instead α appears to slowly fluctuate throughout the trial. Since changes in scaling properties are indicative of changes in the organization of behavior, participants in the no-feedback condition might have tapped into many more different modes of behavioral organization during the performance on a particular trial. Frequent feedback appears to have kept the participants’ performance much more stable in that regard. Perhaps a less constrained task allowed participants to explore more modes of organization in the no-feedback condition during the time course of the task. Different modes of behavioral organization could lead to different locally constraining patterns on the performance, while transitions from one mode to another are effectively unstable periods. Feedback effectively delimits the number of modes that are explored, thereby delimiting the changes of the local α(t).
The concept of “behavioral organization” can also be interpreted in much broader terms than a change in the cognitive strategy. Maybe behavioral organization as indexed by changes of the α(t) exponent captures more subtle properties of changes in the activity of the neuro-muscular system of our participants. For example, Mikkelsen (unpublished dissertation) found that the resting state fMRI was not well characterized by a single Hurst exponent, but rather by an unstable, changing set of Hurst exponents. One interpretation of this finding could be that the resting state is not so much a single state in the sense of the word, but rather a constant drifting between multitudes of states as a by-product of the coordination patterns within the neural networks in the absence of strong environmental constraints. Likewise, in the relatively unconstrained no-feedback time estimation task, α(t) might similarly capture the constant need of coordinating the upkeep of performance with a simultaneous drift between states of neuronal activation, indexing a form of metastability (Kelso, 1995; Kello et al., 2010).
Since we did not observe a linear decrease in the range of fluctuations of the local Hurst exponent, but rather an abrupt drop in the range of variability in α(t) from the no-feedback condition to the conditions that contained feedback (see Figure 4), the slightest bit of information from the environment might have sufficed to tip this balance and qualitatively reorganize timing behavior and stabilize the range of available behavioral organizations. Nevertheless, it has to be noted that changes in persistent and anti-persistent fluctuations are more pronounced in almost all of the data sets – also those produced under feedback conditions – compared to what would be expected from a clear monofractal signal alone. However, whether this is a distinct property of the performance or simply a result of their multifractality cannot be conclusively answered.
Multifractal Spectrum
In terms of the multifractal spectrum analysis, our results show that time estimation performance is more multifractal than suggested by Ihlen and Vereijken (2010) when they reanalyzed the data from the Wagenmakers et al. (2004) time estimation study. This could be due to the different outlier treatment procedures – their data did not have observations beyond 3 SD from the mean whereas we only eliminated very fast (<200 ms) and very slow (>2000 ms) responses. We also conducted the analysis with the removal of the outliers. In this case, the strength of multifractality was much weaker. However, we decided to keep the “outlying” trials because these would be legitimately expected if time estimation is an intermittent process.
There was no correlation between the scaling exponents α and the multifractal width suggesting that these indices are sensitive to different aspects of the timing performance. Intermittent dynamics were present in most of the time series recorded in this experiment. One interpretation is that the intermittency is an intrinsic property of repetitive human performance that is not specifically affected by the local constraints of the task. There was no clear effect of accuracy feedback on the multifractal structure. The width of the multifractal spectrum was greater than what would be expected from a pure 1/f noise in 28 series out of 30 (the 95% confidence interval of hmax − hmin of pure monofractals is in the range 0.032–0.036), but there was no change in the multifractal width (hmax − hmin) as a function of accuracy feedback. Surrogate analysis with phase-shuffled time series showed that 22 out of 30 response series revealed multifractal structure due to multiplicative interaction across scales (their obtained hmax − hmin were greater than the IAAFT surrogates; see Figure 5). Six response series showed multifractality due to a broad probability density distribution (their obtained hmax − hmin were within the 95% confidence interval of the IAAFT surrogates). Only two were monofractal (participant 4 full-feedback; participant 2 50 ms feedback).
What does the evidence of multiplicative interactions in more than half of the response series suggest? One tentative conjecture is that timing performance relies on a set of interdependent processes that concurrently operate across multiple time scales and mutually influence each other. This conjecture is based on the intuitions provided by the model of multiplicative cascades introduced into the cognitive literature by Ihlen and Vereijken (2010). We elaborate on this in the section on the possible organization of the timing system, but before that we would like to describe the mechanistic and complex systems account of cognitive function to discuss how our results fit into these two accounts, and where they seem to be problematic.
Mechanistic Account
Mechanistic accounts of human timing behavior take a variety of forms: Shifting strategy models (Wagenmakers et al., 2004), error correction models (Pressing, 1998), or autoregressive models (Ward, 2002). What unites these different models is the aim to localize component effects that cause the observed timing behavior. In the case of timing behavior, mechanistic accounts have to plausibly localize the source of 1/f fluctuations in one or several encapsulated independent components within the nervous system (Diniz et al., 2010). A classic example of a mechanistic account is the model of discrete event timing by Wing and Kristofferson (1973) that we described in the introduction. The model postulates that there are two independent component processes in discrete event timing: Cognitive central timer and motor error. Gilden et al. (1995) extended this model by endowing the cognitive timer with the 1/f structure while keeping the source of motor error as differenced white noise. They argued that the spontaneous emergence of 1/f noise in the cognitive timer was due to complex non-linear interactions within the cognitive system. However, it is not immediately apparent why the principles of complex non-linear interaction do not similarly lead to the spontaneous emergence of 1/f in the motor system. This is especially puzzling because the movement system itself has been conceptualized as a complex interactive system (Kelso, 1995; Turvey, 2007) and also given that many motor tasks such as precision pointing (Wijnants et al., 2009) or walking on a treadmill (Hausdorff et al., 1996; cf. Delignières and Torre, 2009) show 1/f scaling as well. In our opinion, if one wants to make a strong case for localized mechanistic models of 1/f noise in human performance, there needs to be a reasonable set of principles for breaking the system into truly independent components and an additional set of principles to define why one independent part of the system would operate in a fractal or a non-fractal regime.
This criticism would apply to other mechanistic models as well. For example, another mechanistic modeling strategy is to capture the structure of temporal estimates by positing several ad hoc negative feedback processes with short term-correlations operating on different time scales (Madison and Delignières, 2009) – this model could probably mimic our monofractal results, but it would have to be post hoc parameterized anew, every time changes of the monofractal exponent occur (Van Orden et al., 2005; Kello et al., 2008). Thus, an additional theory about the parameterization of the model would be necessary as well. A third mechanistic model that could potentially apply is the model based on switching between time estimation strategies (Wagenmakers et al., 2004). The gist of the model is that participants use different time estimation strategies (counting silently, tapping foot, etc.) during the task; each employed strategy leads to a bout of short-range correlated measurements and strategies follow one another serially. Fewer strategy shifts could have occurred with more frequent feedback in our task. As the number of strategies decreases, the long-range correlations in the time series decrease. It is possible that the cognitive timer uses fewer time estimation strategies. However, as with the model of Madison and Delignières (2009), the re-parameterization problem would have to be solved first.
Mechanistic models seem to be paralleled by the hypothesis of fixed localization of function in the nervous system (Anderson, 2010, but see Diniz et al., 2010), where a single region in the brain encapsulates a specific function. For example, timing is typically said to result from the activity of distributed neuronal networks that act as a causal controller of the observed timing behavior. As new aspects of timing behavior are uncovered, the neural timer has to be enhanced with additional capabilities so as to explain the full complexity of timing behavior (Schöner, 2002). This also leads to additional mechanisms (added network members) that have to be considered in order to explain timing behavior more properly (Buhusi and Meck, 2009). This is why mechanistically oriented models of the nervous system functioning develop theoretically in the same way as the mechanistic psychological models we discussed. Their theoretical basis in the explanation of behavior by using a set of isolable, independent functions implemented in independent neuronal networks makes them natural travel companions.
Lastly, none of the listed mechanistic models in their current form can capture the observed multifractal structure (inhomogeneity of variance) of the time estimates because these models are based on independently contributing stationary processes (Ihlen and Vereijken, 2010). The complexity explanation (Van Orden et al., 2003, 2005) offers a different explanation of 1/f noise and multifractality in the time estimates.
Complex Systems Account
What separates the complex systems account from the mechanistic account is the reluctance to separate the system into independent components. As we stated above, one needs to have a principled rule for the dissection of components – this is a formidable task in a functionally and anatomically integrated biological system. This problem disappears in the complex systems account because the components are not thought to be causal to behavior. Instead, the whole system can be treated as single entity that is organized and defined by complex non-linear interactions between the components. Presence of long-range correlations and multifractality are statistical features that might reflect coordination and metastability – two characteristic processes suggested as universally present in complex systems (Van Orden et al., 2003, 2005; Kello et al., 2007; Kello and Van Orden 2009). From the complexity perspective, it is not possible to identify single components that propagate their influence via concatenated, additive, linear causal effects and suggests a different kind of thinking from the component-dominant dynamics in dealing with the cognitive system.
The complexity account would suggest that cognitive activity implicated in the timing behavior tends to spontaneously self-organize toward a state of criticality (Van Orden et al., 2003, 2005). Systems maintaining themselves in this state emit 1/f signals (Bak, 1996). Within this account the clearest 1/f noise signals are expected to appear when the behavioral measurement least interferes with the measured performance in experiments, because the system is allowed to reveal its own intrinsic dynamics. From the complexity perspective, weakening of the fractal pattern (lower α) with more extensive accuracy feedback most likely occurred due to the perturbation of the coupling between the intrinsic actor characteristics and the task demands. Natural behavioral tendencies of the neuro-muscular system can either be promoted or inhibited by the behavioral contingencies. In either case, the overall organization of the observed behavior that results from this interaction is likely to show different long-term fractal properties. Also, this coupling might be viewed as change in the state of response preparedness of the neuro-muscular system due to the change in neuronal activity via perception of feedback (Järvilehto, 1998).
One advantage of the explanation at this level is that similar general principles apply to a range of different phenomena in seemingly unrelated complex systems (West and Deering, 1995). For example, long-term measurements of stride lengths show 1/f patterns in normal walking, but become more uncorrelated with metronome pacing (Hausdorff et al., 1996). The same phenomenon appears in rhythmic movements while synchronizing with a metronome (Chen et al., 1997).
However, observation of 1/f noise is not strong enough evidence that the cognitive system works on the principles of self-organized criticality (SOC) because multiple processes not based on the SOC principle can mimic the presence of 1/f fluctuations (Wagenmakers et al., 2005; Torre and Wagenmakers, 2009; Ihlen and Vereijken, 2010). As such, our monofractal results do not speak to the idea that the timing system organized on the principles of SOC directly. However, we consider that SOC is a valuable heuristic framework of thinking about the overall organization of human behavior because it allows seeing commonalities between the dynamics of performance across many perceptual-motor and cognitive tasks (Kello et al., 2010). One additional positive feature of criticality at the neural level would be that it allows for a rapid propagation of signals in the nervous system (Linkenkaer-Hansen et al., 2001; Ihlen and Vereijken, 2010; Wallot and Van Orden, under review).
At the same time, there are some assumptions of the typical physical sand pile SOC models that do not fit the characteristic of biological systems. First, it is required that the events produced by the SOC systems are independent from one another in time (Aschwanden, 2011). If we consider events to be the observed behavioral outcomes (e.g., finger taps in our case), then clearly, all human behavior exhibits interdependencies between the produced events and therefore does not fit that assumption. Second, the power–law behavior emitted by the physical SOC systems is typically stationary in time, whereas the power–laws produced by living complex systems fluctuate. Even in our data we have observed the alpha exponent, α(t), to fluctuate in time for every participant; furthermore, the average α changed with the introduction of feedback. All these considerations suggest that biological systems show a higher level of complexity than one would expect from the simpler sand pile-type SOC systems. One possible reason is that the inputs to these physical SOC are typically assumed to be random, whereas biological systems usually do not receive randomly structured stimulation – they actively orient their perceptual systems to the behaviorally relevant aspects of the environment (Gibson, 1966; Järvilehto, 1998). There is computational evidence to suggest that changes in the input regime lead to different dynamics of the critical states of the sand pile surface (Zhang, 2000).
Additionally, what really seems to distinguish the biological SOC systems from their physical counterparts, such as piles of sand and rice, is their ability to change the relevant parameters of the interaction between the elements constituting the system (Kloos and Van Orden, 2010; Van Orden et al., 2011). Some of the early empirical studies examining the presence of the SOC behavior were conducted using grains of sand. The observed distribution of avalanches was only scale-invariant for small piles (80 grains and less) and lost its scale-invariant behavior due to the inertia of the sand, which favored large periodic avalanches – a behavior clearly different from the power–laws. However, later research using a different element – rice – found consistent evidence for the assembly of critical states and the consequent power–law behavior of the avalanches (Frette et al., 1996; summarized in Jensen, 1998). It may be that the inertia and the shape of the physical elements play a role of a control parameter in tuning an SOC system such that criticality becomes possible after some value of inertia, size, or their ratio, but that remains to be tested.
Possible Organization of the Timing System
We observed a wide multifractal spectrum due to multiplicative interactions in 22 out of 30 response series of interval production by our participants. The multiplicative cascading model introduced by Ihlen and Vereijken (2010) can account for such empirical observations: Within the model, each individual measurement is a result of a multiplicative interaction between the processes operating at many time scales of the measured behavior. Based on the framework of thinking provided by this model, we conjecture that the timing system spans the boundary of the brain and body and non-trivially includes the environment – timing performance is embodied and situated (Järvilehto, 1998; Haselager et al., 2008) contra to the view that the timing system operates only at the neural level. A non-trivial interaction between the nervous system, the body and the environment entails that the neural activity only partially feeds into the structure of the variability of temporal estimates and is not its sole determinant. The evidence for interaction-dominant multifractality suggests that the regularities found in the slower time scales of the task and environment matter essentially and that the structure of variability of the observed timing behavior most likely emerges as a property of the coordination among all these levels. At the neural level, there is coordination across multiple time scales of the neural firing patterns ranging from relatively slow alpha rhythms to very high frequency theta oscillations (Linkenkaer-Hansen et al., 2001; cf. Buzsaki, 2006). At the same time, there are oscillations occurring at the behavioral scales (such as heart beats and breathing) that are much slower than the neural fluctuations and also feed in to the subjective perception of time (Münsterberg, 1866; Stetson et al., 1992). The task regularities provide another constraint on the timing system (Jazaheri and Shadlen, 2010) and, of course, the environmental fluctuations on the order of day–night cycles also contribute (Block, 1990). Multifractality in the observed timing behavior therefore may be an expression of the coupling between these all these oscillations. As Castillo et al. (2011) put it: “The observed timing of physiology and behavior is an outcome of the coordination of the body, not the other way around.”
Conclusion
This experiment examined the effect of accuracy feedback on the long-term correlation structure of the time interval estimates in the continuation time estimation task. We found that the degree of 1/f noise scaling decreased with accuracy feedback in a manner consistent with the complexity explanation of long-range correlations in cognitive measurements (Kloos and Van Orden, 2010). We also found that continuous time estimation with or without accuracy feedback contained multifractal structure that was in some response series due to the interaction across scales of the cognitive system and in other series due to the non-Gaussian distribution of the response times. The identification of multifractality shows that repeated time estimates possess a level of complexity that is not expected from previous componential models of timing that posit a single or a few fixed timing structures. Furthermore, our results show evidence that changes in feedback qualitatively alter timing performance suggesting that the overall organization of the timing behavior depends on the intrinsic dynamics of the body, task, and the environment.
Conflict of Interest Statement
The authors declare that the research was conducted in the absence of any commercial or financial relationships that could be construed as a potential conflict of interest.
Acknowledgments
We thank Guy Van Orden and Michael Riley for helpful discussions of the manuscript. We would like to thank Espen Ihlen for the guidance on the multifractal analyses. We also would like to thank Anna Haussmann for proofreading the manuscript. Preparation of this article was supported by NSF grants to Guy Van Orden (BCS #0642716; BCS #0843133; DHB #0728743).
Footnotes
- ^There are guidelines for outlier removal when using monofractal analyses (Holden, 2005). Removal of outliers according these criteria obscures the degree of intermittent structure in the performance leading to a sharp decrease in the range of multifractality (i.e., markedly less pronounced intermittency). Therefore, we attempted to minimize the number of removed observations.
- ^www.ntnu.edu/inm/geri/software
- ^www.ntnu.edu/inm/geri/software
References
Anderson, M. L. (2010). Neural reuse: a fundamental organizational principle of the brain. Behav. Brain Sci. 33, 245–313.
Aschwanden, M. (2011). Self-Organized Criticality in Astrophysics: The Statistics of Nonlinear Processes in the Universe. Berlin: Springer-Verlag.
Bak, P. (1996). How Nature Works. The Since of Self-Organized Criticality. New York, NY: Copernicus.
Block, R. A. (1990). “Models of psychological time,” in Cognitive Models of Psychological Time, ed. R. A. Block (Hillsdale, NJ: Erlbaum), 1–35.
Buhusi, C. V., and Meck, W. H. (2009). Relativity theory and time perception: single or multiple clocks? PLoS ONE 4, e6268. doi: 10.1371/journal.pone.0006268
Castillo, R. D., Van Orden, G. C., and Kloos, H. (2011). “The embodiment of time estimation,” in Time and Time Perception 2010, eds A. Vatakis, A. Esposito, M. Giagkou, F. Cummins, and G. Papadelis (Heidelberg: Springer-Verlag), 196–206.
Chen, Y., Ding, M., and Kelso, J. A. S. (1997). Long memory processes (1/fα type) in human coordination. Phys. Rev. Lett. 79, 4502–4504.
Chen, Y., Repp, B., and Patel, A. (2002). Spectral decomposition of variability in synchronization and continuation tapping: comparisons between auditory and visual pacing and feedback conditions. Hum. Mov. Sci. 21, 515–532.
Delignières, D., Lemoine, L., and Torre, K. (2004). Time intervals production in tapping and oscillatory motion. Hum. Mov. Sci. 23, 87–103.
Delignières, D., and Torre, K. (2009). Fractal dynamics of human gait: a reassessment of the 1996 data of Hausdorff et al. J. Appl. Physiol. 106, 1272–1279.
Delignières, D., and Torre, K. (2011). Event-based and emergent timing: dichotomy or continuum? A reply to Repp and Steinman (2010). J. Mot. Behav. 43, 311–318.
Delignières, D., Torre, K., and Lemoine, L. (2008). Fractal models for event-based and dynamical timers. Acta Psychol. (Amst.) 127, 382–397.
Diniz, A., Wijnants, M. L., Torre, K., Barreiros, J., Crato, N., Bosman, A. M. T., Hasselman, F., Cox, R. F. A., Van Orden, G. C., and Delignières, D. (2010). Contemporary theories of 1/f noise in motor control. Hum. Mov. Sci. 30, 889–905.
Eke, A., Herman, P., Bassingthwaighte, J. B., Raymound, G. M., Percival, D. B., Cannon, M., Balla, I., and Ikrenyi, C. (2000). Physiological time series: distinguishing fractal noises from motions. Eur. J. Physiol. 439, 403–415.
Eke, A., Herman, P., and Kozak, L. R. (2002). Fractal characterization of complexity in temporal physiological signals. Physiol. Meas. 23, R1–R38.
Frette, V., Christensen, Malthe-Sørenssen, A., Feder, J., Jøssang, T., and Meakin, P. (1996). Avalanche dynamics in a pile of sand. Nature 379, 49–52.
Gilden, D. L., Thornton, T., and Mallon, M. (1995). 1/f noise in human cognition. Science 267, 1837–1839.
Haselager, P., van Dijk, J., and van Rooj, I. (2008). “A lazy brain? Embodied embedded cognition and cognitive neuroscience,” in Handbook of Cognitive Science: An Embodied Approach, eds P. Calvo, and T. Gomila (Oxford: Elsevier), 273–287.
Hausdorff, J. M., Purdon, P. L., Peng, C.-K., Ladin, Z., Wei, J. Y., and Goldberger, A. L. (1996). Fractal dynamics of human gait: stability of long-range correlations in stride interval fluctuations. J. Appl. Physiol. 80, 1448–1457.
Holden, J. G. (2005). “Gauging the fractal dimension of response times from cognitive tasks,” in Contemporary Nonlinear Methods for Behavioral Scientists, eds M. A. Riley, and G. C. Van Orden 267–318. Available at: http://www.nsf.gov/sbe/bcs/pac/nmbs/nmbs.jsp [Retrieved April 8, 2011].
Holden, J. G., Choi, I., Amazeen, P. G., and Van Orden, G. C. (2011). Fractal 1/f dynamics suggest entanglement of measurement and human performance. J. Exp. Psychol. Hum. Percept. Perform. 37, 935–948.
Ihlen, E. A. F., and Vereijken, B. (2010). Interaction-dominant dynamics in human cognition: beyond 1/fα fluctuation. J. Exp. Psychol. Gen. 139, 426–463.
Ivanov, P. C., Amaral, L. A. N., Goldberger, A. L., Havlin, S., Rosenblum, M. G., Struzik, Z. R., and Stanley, H. E. (1999). Multifractality in human heartbeat dynamics. Nature 399, 461–465.
Järvilehto, T. (1998). The theory of the organism-environment system: I. Description of the theory. Integr. Physiol. Behav. Sci. 33, 321–334.
Jazaheri, M., and Shadlen, M. N. (2010). Temporal context calibrates interval timing. Nat. Neurosci. 13, 1020–1026.
Kantelhardt, J. W., Zschiegner, S. A., Koscielny-Bunde, E., Havlin, S., Bunde, A., and Stanley, H. E. (2002). Multifractal detrended fluctuation analysis of nonstationary time series. Physica A 316, 87–114.
Kello, C. T., Anderson, G. G., Holden, J. G., and Van Orden, G. C. (2008). The pervasiveness of 1/f scaling in speech reflects the metastable basis of cognition. Cogn. Sci. 32, 1217–1231.
Kello, C. T., Beltz, B., Holden, J. G., and Van Orden, G. C. (2007). The emergent coordination of cognitive function. J. Exp. Psychol. Gen. 136, 551–568.
Kello, C. T., Brown, G. D. A., Ferrer-i-Cancho, R., Holden, J. G., Linkenkaer-Hansen, K., Rhodes, T., and Van Orden, G. C. (2010). Scaling laws in cognitive sciences. Trends Cogn. Sci. (Regul. Ed.) 14, 223–232.
Kello, C. T., and Van Orden, G. C. (2009). Soft-assembly of sensorimotor function. Nonlinear Dynamics Psychol. Life Sci. 13, 57–78.
Kelso, J. A. S. (1995). Dynamic Patterns: The Self-Organization of Brain and Behavior. Cambridge, MA: MIT Press.
Kiefer, A., Riley, M. A., Shockley, K., Villard, S., and Van Orden, G. C. (2009). Walking changes the dynamics of cognitive estimates of time intervals. J. Exp. Psychol. Hum. Percept. Perform. 35, 1532–1541.
Kloos, H., and Van Orden, G. C. (2010). Voluntary behavior in cognitive and motor tasks. Mind Matter 8, 19–43.
Lemoine, L., Torre, K., and Delignières, D. (2006). Testing for the presence of 1/f noise in continuation tapping data. Can. J. Exp. Psychol. 60, 247–257.
Linkenkaer-Hansen, K., Nikouline, V. V., Palva, M. J., and Ilmoniemi, R. J. (2001). Long-range temporal correlations and scaling behavior in human brain oscillations. J. Neurosci. 21, 1370–1377.
Madison, G., and Delignières, D. (2009). Auditory feedback affects the long-range correlation of isochronous serial production: support for a closed-loop or memory model of timing. Exp. Brain Res. 193, 519–527.
Münsterberg, H. (1866). “Beiträge zur experimentellen Psychologie,” in The Principles of Psychology, Vol. 1, ed. W. James (New York: Henry Holt and Co), 620–627.
Newell, K. M. (1986). “Constraints on the development of coordination,” in Motor Development in Children: Aspects of Coordination and Control, eds M. Wade, and H. Whiting (Dordrecht: Martinus Nijhoff), 341–360.
Percival, D. B., and Walden, A. T. (2000). Wavelet Methods for Time Series Analysis. New York, NY: Cambridge University Press.
Pressing, J. (1998). Error correction processes in temporal pattern production. J. Math. Psychol. 42, 63–101.
Riley, M. A., and Turvey, M. T. (2002). Variability and determinism in motor behavior. J. Mot. Behav. 34, 99–125.
Slifkin, A. B., and Newell, K. M. (1998). Is variability in human performance a reflection of system noise? Curr. Dir. Psychol. Sci. 7, 170–177.
Stetson, D. A., Albers, J. W., Silverstein, B. A., and Wolfe, R. A. (1992). Effects of age, sex, and anthropometric factors on nerve conduction measures. Muscle Nerve 15, 1095–1104.
Torre, K., and Delignières, D. (2008). Unraveling the finding of 1/f noise in self-paced and synchronized tapping: a unifying mechanistic model. Biol. Cybern. 99, 159–170.
Torre, K., and Wagenmakers, E. J. (2009). Theories and models of 1/fβ noise in human movement science. Hum. Mov. Sci. 28, 297–318.
Van Orden, G. C., Holden, J. G., and Turvey, M. T. (2003). Self-organization of cognitive performance. J. Exp. Psychol. Gen. 132, 331–350.
Van Orden, G. C., Holden, J. G., and Turvey, M. T. (2005). Human cognition and 1/f scaling. J. Exp. Psychol. Gen. 134, 117–123.
Van Orden, G. C., Kello, C. T., and Holden, J. G. (2010). Situated behavior and the place of measurement in psychological theory. Ecol. Psychol. 22, 24–43.
Van Orden, G. C., Kloos, H., and Wallot, S. (2011). “Living in the pink: intentionality, wellbeing, and complexity,” in Philosophy of Complex Systems. Handbook of the Philosophy of Science, ed. C. A. Hooker (Amsterdam: Elsevier), 639–684.
Vorberg, D., and Wing, A. (1996). “Modeling variability and dependence in timing,” in Handbook of Perception and Action, Vol. 2, eds H. Heuer, and S. W. Keele (London: Academic Press), 181–262.
Wagenmakers, E. J., Farrel, S., and Ratcliff, R. (2004). Estimation and interpretation of 1/f-noise in human cognition. Psychon. Bull. Rev. 11, 579–615.
Wagenmakers, E. J., Farrell, S., and Ratcliff, R. (2005). Human cognition and a pile of sand: a discussion on serial correlations and self-organized criticality. J. Exp. Psychol. Gen. 135, 108–116.
Wearden, J. H., and McShane, B. (1988). Interval production as an analogue of the peak procedure: evidence for similarity of human and animal timing processes. Q. J. Exp. Psychol. B 40, 363–375.
Werner, G. (2010). Fractals in the nervous system: conceptual implications for theoretical neuroscience. Front. Physiol. 1:15. doi: 10.3389/fphys.2010.00015
West, B. J., and Deering, B. (1995). The Lure of Modern Science: Fractal Thinking. Singapore: World Scientific.
West, B. J., and Scafetta, N. (2003). A nonlinear dynamical model of human gait. Phys. Rev. E 67, 051917.
Wijnants, M. L., Bosman, A. M. T., Hasselman, F., Cox, R. F. A., and Van Orden, G. C. (2009). 1/f scaling in movement time changes with practice in precision aiming. Nonlinear Dynamics Psychol. Life Sci. 13, 79–98.
Wing, A. M. (1980). “The long and short of timing in response sequences,” in Tutorials in Motor Behavior, eds G. E. Stelmach, and J. Requin (Amsterdam: North Holland), 469–486.
Wing, A. M., and Kristofferson, A. B. (1973). Response delays and the timing of discrete motor responses. Percept. Psychophys. 14, 5–12.
Keywords: time estimation, 1/f noise, multifractal, accuracy feedback, embodied cognition
Citation: Kuznetsov NA and Wallot S (2011) Effects of accuracy feedback on fractal characteristics of time estimation. Front. Integr. Neurosci. 5:62. doi: 10.3389/fnint.2011.00062
Received: 01 June 2011; Paper pending published: 27 June 2011;
Accepted: 27 September 2011; Published online: 17 October 2011.
Edited by:
Warren H. Meck, Duke University, USAReviewed by:
Warren H. Meck, Duke University, USAEspen Alexander Fürst Ihlen, Norwegian University of Science and Technology, Norway
Copyright: © 2011 Kuznetsov and Wallot. This is an open-access article subject to a non-exclusive license between the authors and Frontiers Media SA, which permits use, distribution and reproduction in other forums, provided the original authors and source are credited and other Frontiers conditions are complied with.
*Correspondence: Nikita A. Kuznetsov, Perceptual-Motor Dynamics Laboratory, Department of Psychology, CAP Center for Cognition, Action and Perception, University of Cincinnati, Cincinnati, OH, USA. e-mail:a3V6bmV0bmFAbWFpbC51Yy5lZHU=