


- 1 Department of Psychology, National University of Singapore, Singapore
- 2 École de Psychologie, Université Laval, Québec, QC, Canada
The duration bisection paradigm is a classic task used to examine how humans and other animals perceive time. Typically, participants first learn short and long anchor durations and are subsequently asked to classify probe durations as closer to the short or long anchor duration. However, the specific representations of time and the decision rules applied in this task remain the subject of debate. For example, researchers have questioned whether participants actually use representations of the short and long anchor durations in the decision process rather than merely a response threshold that is derived from those anchor durations. Electroencephalographic (EEG) measures, like the contingent negative variation (CNV), can provide information about the perceptual and cognitive processes that occur between the onset of the timing stimulus and the motor response. The CNV has been implicated as an electrophysiological marker of interval timing processes such as temporal accumulation, representation of the target duration, and the decision that the target duration has been attained. We used the CNV to investigate which durations are involved in the bisection categorization decision. The CNV increased in amplitude up to the value of the short anchor, remained at a constant level until about the geometric mean (GM) of the short and long anchors, and then began to resolve. These results suggest that the short anchor and the GM of the short and long anchors are critical target durations used in the bisection categorization decision process. In addition, larger mean N1P2 amplitude differences were associated with larger amplitude CNVs, which may reflect the participant’s precision in initiating timing on each trial across a test session. Overall, the results demonstrate the value of using scalp-recorded EEG to address basic questions about interval timing.
Introduction
Duration Bisection
The duration bisection paradigm is a classic task used to examine how humans and other animals perceive time (e.g., Penney et al., 2008). In a typical duration bisection experiment with humans, participants are asked to classify probe durations as closer to either the short or the long anchor duration (e.g., 2 vs. 8 s) learned in training. The probe durations usually comprise either a geometric or an arithmetic series that includes the short and long anchors as well as intermediate durations. The point of subjective equality (PSE), the difference limen (DL), and the Weber fraction (WF) can be obtained from the participant’s response function. The PSE is an index of perceived duration, while the DL and WF index temporal sensitivity (Grondin, 2010). These measures have been useful for the study of the perceptual and cognitive factors that can influence subjective perception of time (e.g., Penney et al., 2000; Vicario, 2011).
Although most information processing models of interval timing posit that timing decisions rely on comparisons of currently elapsing time with memory representations of previously experienced durations, the specific information that contributes to those representations and the decision rules applied remain the subject of debate (e.g., Allan, 2002; Wearden, 2004; Penney et al., 2008). For example, whether the short and long anchors are used during duration classification has been challenged by procedures in which the participant is not explicitly taught the anchor durations (Wearden and Ferrara, 1995) and by evidence that participants rely on a bisection criterion derived from the anchor durations rather than using the anchor durations themselves (Allan and Gerhardt, 2001). Similarly, whether the decision process relies on comparison of two time traces until a response threshold is reached (Wearden, 2004), a sequential application of decision rules (Penney et al., 2008), or some other mechanism is unclear. Our understanding of the memory representations and decision rules suffers from the fact that they are latent processes not easily determined by behavioral measures in a typical duration bisection task (e.g., the assumed relationship between the PSE and actual transition from a “short” to “long” decision, Balci et al., 2009).
Consequently, methods that provide information about the perceptual and cognitive processes that occur between the onset of the timing stimulus and the motor response are desirable. Non-invasive electrophysiological measures such as electroencephalography (EEG) and event related potentials (ERPs) are complementary to behavioral measures because they can be used to reveal how distinct cognitive processes unfold at a higher temporal resolution than behavioral measures alone (Luck, 2005). One candidate EEG/ERP event that appears to be sensitive to sub and supra-second temporal information is the contingent negative variation (CNV).
The Contingent Negative Variation and Interval Timing
Electroencephalography and ERP measures have been used extensively to reveal the brain’s motor preparation processes (e.g., Brunia, 2004; van Boxtel and Böcker, 2004). One such measure is the CNV, which was termed the “expectancy wave” when first reported by Walter et al. (1964). Time is an essential dimension of preparation and anticipation (Buhusi and Meck, 2005; Coull and Nobre, 2008), so it is unsurprising that its role in CNV generation has also been examined (e.g., Birbaumer et al., 1990; Correa et al., 2006). Indeed, several research groups (Macar et al., 1999; Macar and Vidal, 2003, 2009; Pfeuty et al., 2003a,b, 2005, 2008; Praamstra et al., 2006) have reported relationships between CNV parameters (e.g., amplitude, peak latency, slope) and aspects of explicit and implicit interval timing (e.g., encoding, storage, and retrieval). The ramping negative potential of the CNV has been claimed to reflect an accumulation process resulting from spreading activation or signal integration of neurons in the medial frontal brain areas (König et al., 1996; Macar et al., 1999, 2006; Macar and Vidal, 2004; Pouthas et al., 2005; Meck et al., 2008; Simen et al., 2011).
For example, early work by Macar et al. (1999) showed a relationship between the amplitude of the CNV and the subjective duration of the interval in temporal reproduction. The authors categorized participant’s responses into three groups according to accuracy, which indicated that the CNV amplitude decreased (i.e., became less negative) as the produced intervals decreased (2600 ∼ 2800; 2400 ∼ 2600; and 2200 ∼ 2400 ms) even though the participants were attempting to reproduce the same 2500 ms target duration in all cases.
Resolution of the CNV appears to bear a relationship to the memory representation of the target duration. Macar and Vidal (2003) used both visual and tactile temporal generalization tasks to show that the CNV peaked at the memorized target duration (2000 ms) rather than at the end of the probe duration (2500 or 3100 ms). Pfeuty et al. (2003b) obtained similar results with a S1–S2 duration comparison task. During S2, the CNV reached its negative peak at the S1 target duration (700 ms) at left hemisphere and medial frontal electrode locations, while at right hemisphere frontal electrode sites the CNV peaked at the end of S2. The authors suggested that the distinct CNV profiles at the right and left hemisphere electrodes reflected distinct memory representations for the S1 target duration and the elapsing S2 duration. In a subsequent S1–S2 experiment (Pfeuty et al., 2005), the authors showed that given the same S2 probe duration (794 ms), the peak latency of the CNV corresponded to the S1 target duration (600 vs. 794 ms), although they failed to obtain an effect of target duration on CNV amplitude. They, and others (Durstewitz, 2004), have suggested that the slope of the CNV reflects the rate of temporal accumulation within the information processing framework of the scalar expectancy theory (SET) of timing (Gibbon et al., 1984).
Finally, the relationship between the CNV and timing is not limited to explicit interval timing tasks. Praamstra et al. (2006) replicated the peak latency and slope effects (Macar and Vidal, 2003; Pfeuty et al., 2005) in an implicit motor timing task. In this task, participants pressed one of two keys depending on whether an arrow pointed to the left or the right. Each trial comprised a short sequence of cues, each presented isochronously (2000 ms) with the exception of the final cue. A CNV occurred between successive cues, but when the final cue was presented late (2500 ms), the CNV peaked at the expected inter-stimulus interval (2000 ms) and then began to resolve. In sum, the available evidence suggests a relatively robust relationship between interval timing and CNV peak latency and slope (e.g., Tarantino et al., 2010), while the relationship between CNV amplitude and timing stimulus duration is equivocal (e.g., Kononowicz and van Rijn, 2011).
Given the putative role of the CNV as a marker of interval timing, it should be possible to use it as a tool to examine information processing in the duration bisection task. Specifically, the research reviewed above suggests that the CNV at medial frontal electrode sites should reach its negative peak when elapsed time matches a remembered target duration, and begin to resolve (i.e., return to baseline) when the categorization decision is made, which in turn implies that the duration of the target criterion used for the decision has been reached. In the case of duration bisection, this means that if the critical information is whether the currently elapsing duration has exceeded the memory representation of the comparison memory duration, then the CNV should peak and resolve when the current duration exceeds the comparison duration. Therefore, if a bisection criterion (Allan and Gerhardt, 2001) is the target criterion, the CNV should peak and resolve before the end of probe durations that are longer than that criterion. If, however, the value of the entire probe duration is used in the decision process, then one might expect the CNV to peak and resolve at stimulus offset for the long duration probe trials. In other words, the electrophysiological response should identify the temporal information used during a bisection trial.
Materials and Methods
Participants
Seventeen undergraduate students (nine female) at the National University of Singapore participated in return for payment ($9/h). All had normal or corrected to normal vision and 16 were right-handed. Data from five participants were omitted from the data analysis because of excessive eye or body movement artifact (see below).
Stimuli
Stimuli comprised seven 440 Hz tones, with 10 ms rise and fall times, played over stereo headphones at a comfortable level. The stimulus durations were geometrically spaced from 800 to 3200 ms (i.e., 800, 1008, 1270, 1600, 2016, 2540, and 3200 ms).
Procedure
The duration bisection paradigm (Gibbon, 1981) was implemented in E-Prime (Psychology Software Tools, USA). At the beginning of each block, the two anchor durations (800 and 3200 ms) were presented to the participants five times each. The presentation sequence of the 10 durations was randomized for each participant and feedback was provided on the computer screen after each presentation (“That was the Short/Long duration”). The subsequent test block comprised 196 trials with 28 trials at each of the 7 probe durations. The inter-trial interval (ITI) was a combination of participant’s response time (RT) and a random duration between 1000 and 2000 ms. Trial order within a block was pseudo-randomized so that no consecutive probe trials were of the same duration. Each participant completed two test blocks.
Participants were seated in a dim, sound-attenuated room with their fingers resting on a computer keyboard. Participants were told that a series of tones would be presented and that they should press one of the two response keys (G or K) to indicate whether the tone duration was more similar to the “short” or “long” anchor when the tone terminated. Key to response assignment was counterbalanced across participants. The maximum RT allowed was 2000 ms following tone offset. Response (“short” or “long”) and RT relative to signal offset were recorded.
EEG Recording
Electroencephalographic activity was recorded using a 64-channel Biosemi Active-Two system with sintered Ag/AgCl electrodes mounted in an elastic cap according to the extended 10–20 system. The electrooculogram (EOG) was recorded from electrodes positioned at the outer canthus of each eye and just above and below the left eye. The reference electrode was placed on the nose and the ground electrodes (CMS/DRL) were placed behind the vertex in the vincinity of POz. The EEG and EOG were recorded continuously from DC to 400 Hz at a sampling rate of 2048 Hz and subsequently downsampled offline to 256 Hz.
Data Analysis
Behavioral data
A behavioral response function was generated for each participant by determining the proportion of trials classified as “more similar to the long anchor” for each probe duration (i.e., n responses out of 56 for each of the 7 probe durations). The pseudologistic function from the Pseudo Logistic Model of Killeen et al. (1997) was fit to the classification data of each participant (Allan, 2002). The fitted function was used to obtain estimates of the PSE and the DL. The DL was calculated by subtracting the duration, derived from the fitted pseudologistic function at which the proportion of “long” responses equaled 0.25, from the duration, also derived from the fitted pseudologistic function, at which the proportion of “long” responses equaled 0.75, and dividing by 2.
EEG data
Electroencephalography data were processed using EEGLAB (Delorme and Makeig, 2004). The data were digitally filtered offline with a band-pass from 0.1 to 32 Hz. EEG epochs time-locked to the onset of the probe tone were computed at all recording sites for a time window from 200 ms before tone onset to 3500 ms thereafter for all probe durations. Independent component analysis (ICA; Stone, 2002) was used to isolate and remove eye blink, eye movement, and motor artifacts from the epoched data. The 200-ms immediately prior to the onset of the stimulus served as the baseline and was subtracted from each epoch after ICA. Data from five participants were excluded from further analyses because these artifacts could not be isolated. While data from FCz has typically been the focus of CNV analyses (e.g., Macar et al., 1999; Pfeuty et al., 2003a,b; Praamstra et al., 2006), here data from FCz and five adjacent electrodes (FC1, FC2, C1, C2, and Cz) were averaged to provide a better signal to noise ratio.
To further confirm the presence of the CNV component, current source density (CSD), was computed using the CSD toolbox (Kayser and Tenke, 2006; Kayser, 2009), based on the spherical spline algorithm derived by Perrin et al. (1989, 1990). CSD estimates the second spatial derivative of the scalp potentials, similar to what is done with the Surface Laplacian (Kayser and Tenke, 2006; Pizzagalli, 2007). For the CSD computed here, previously validated default values were used, i.e., the order of the Legendre polynomial (n) was 50, the flexibility of the spline (m) was set to 4, and the smoothing parameter (lambda) for the spline interpolation was 10−5 (Tenke et al., 1998). Each EEG epoch was first CSD transformed, baseline corrected, and then averaged.
To maximize the signal to noise ratio for examination of the ERP components up to the duration of the short anchor (i.e., 800 ms), the trials for the seven probe durations were averaged together to generate a single ERP waveform for each participant. We assumed that the EEG would be comparable for the first 800 ms of all probe duration presentations because 800 ms is the earliest time point at which a participant can learn the identity of the probe duration (i.e., at offset of the 800-ms probe). To determine whether the CNV peaked and began to resolve prior to the end of timing signal, however, the trials for the two longest probe durations (i.e., 2540 and 3200 ms) were averaged together to generate an ERP waveform for each participant.
Contingent negative variation slopes were obtained for several time windows to quantify (1) the ramping of the CNV (from the end of N1P2 to the end of the short anchor duration), (2) the development of the CNV between the “short” anchor duration (800 ms) and the geometric mean (GM; 1600 ms), (3) the development of the CNV between the GM and arithmetic mean (AM; 2000 ms), and (4) the development of the CNV between the AM and the duration of the second longest probe (2500 ms). For each participant, the average potential obtained by collapsing across the six frontal and central electrodes of interest (i.e., FCz, FC1, FC2, C1, C2, and Cz) in each of these four time windows was regressed against sample time (ordinary least squares) to obtain a linear slope of the change of potential amplitude across time (μV/ms). This procedure resulted in 12 slopes for each time window of interest, which were then statistically analyzed.
To identify the beginning of CNV ramping, global field power (GFP; Lehmann and Skrandies, 1980, 1984) was calculated at each time point as the SD of the electrical potential of the 64 scalp electrodes, resulting in a single value at each time sample. High GFP indicates stable scalp potential distribution and optimal signal to noise ratio, while low GFP indicates a change in distribution (Michel et al., 2009). As early ERP components are often associated with narrow time windows of high GFP and sharp transitions between components (Murray et al., 2008), using the distinct transition of GFP from the transient P2 to the more diffuse CNV to define the slope onset should be better than an arbitrary zero-crossing point. The GFP indicated that a transition in the grand average of the data occurred at 246 ms, similar to that obtained in a previous study (240 ms, Pfeuty et al., 2005).
We also examined the relationship between the CNV and duration bisection performance. Epochs from a subset of the intermediate probe duration trials (1270, 1600, and 2016 ms) were allocated to either the “short” or “long” category based on the participant’s response. This set of epochs allowed us to examine possible CNV differences between short and long judgments up to 1200 ms with better signal to noise ratio. The partial least squares (PLS) method (McIntosh and Lobaugh, 2004) was used (cf. Tarantino et al., 2010). PLS fits neuroimaging data using least squares and the solutions are “constrained to the part of the covariance structure that is attributable to experimental manipulations or that relates to behavior” (McIntosh and Lobaugh, 2004, S251). The salience and reliability of the ERP differences between conditions are verified using both bootstrapping and randomization tests, with statistical significance set at alpha = 0.05. For probe durations longer than 1200 ms, CNV resolution would be confounded by the different offset times of the three intermediate probes. Instead, we analyzed measures of event related synchronization and desynchronization (ERS/ERD, Pfurtscheller and Lopes da Silva, 1999), which preserve potentials not time-locked to the stimulus onset, and allow frequency-specific analysis of the EEG. We converted the “short” and “long” classification epochs into ERD/ERS time series (see Pfurtscheller and Lopes da Silva, 1999) using the 200-ms baseline as the reference power. We focused on the alpha band (∼7–13 Hz) because a previous report implicated this band in temporal anticipation (Babiloni et al., 2004). ERS is indicated by a negative percentage, whereas ERD is indicated by a positive value.
Finally, we were also interested in the relationship between timing and early ERP components such as the N1P2 complex due to its reported association with subjective time perception (e.g., Bendixen et al., 2005; Xuan et al., 2009). The sensitivity of the N1P2 to attention and perceptual features of the probe onset marker (Näätänen and Picton, 1987) and its latency fit well with a role as a possible biomarker of timing initiation on each trial. To this end, the correlation between the magnitude of the N1P2 complex and the CNV amplitude was examined. The peak-to-peak amplitude of the N1P2 of each participant was taken as the difference between the maximum and minimum peak of the ERP of all seven probe durations in the time window from 50 to 280 ms following tone onset at the nine fronto-central electrodes (FC1, FC2, FCz, C1, C2, Cz, CP1, CP2, CPz) where the scalp projection of the N1P2 complex is the largest (Crowley and Colrain, 2004).
Results
The bisection response function averaged across the 12 participants has the classic form of a smoothly increasing ogive (Figure 1). The group mean PSE was 1690 ms (SD = 280 ms), and the group mean DL was 260 ms (SD = 149 ms). Figure 2 shows the grand average ERPs separately for each probe duration.
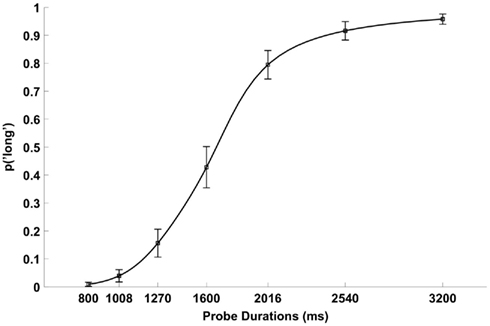
Figure 1. Mean proportion of “long” responses as a function of probe duration averaged across the 12 participants. The error bars indicate 1 SEM. The smooth line illustrates the pseudologistic function (Killeen et al., 1997) fitted to these mean proportions.
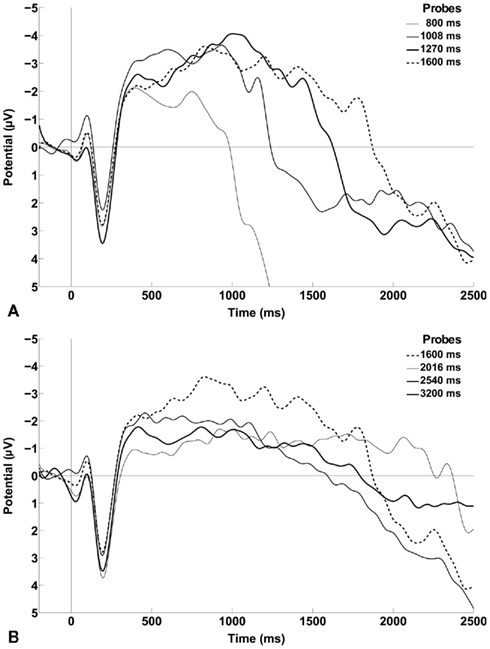
Figure 2. Grand average of the ERP waveforms obtained by collapsing across the six frontal and central electrodes of interest (i.e., FCz, FC1, FC2, C1, C2, and Cz) time-locked to stimulus onset. (A) ERPs of the first four probe durations in the series: 800, 1008, 1270, and 1600 ms. (B) ERPs of the last four probe durations in the series: 1600, 2016, 2540, and 3200 ms. The ERP of 1600 ms is plotted in both panels for comparison. The data were smoothed with an eight-point Gaussian window for presentation only.
For each participant, the ERP elicited by the timing stimulus, independent of probe duration, was computed by averaging the trials from all the probe durations. The across participant grand average over the six frontal and central electrodes of interest is shown in Figure 3. Distinct N1 and P2 components are present, as is a steady increase in negative potential from about 250 ms to shortly before 1000 ms, after which the potential becomes less negative (i.e., CNV resolution). The CNV amplitude between 246 and 800 ms was examined by averaging the potential across the time window for each participant. The mean amplitude was −2.75 μV and a parametric, two-tailed, one-sample t-test against zero potential indicated the negativity was significantly greater than zero, 95% CI = [−4.04 to −1.46] μV, t(11) = −4.70, p = 0.0006, confirming the presence of a negative ERP component in the sample. The spatial topographic map of the CSD in the time window from 246 to 800 ms shows a bilateral distribution with a focus over frontal – central electrode sites (Figure 4).
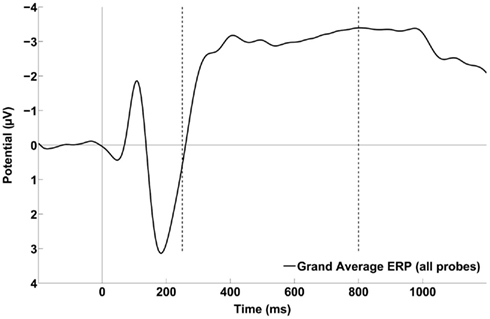
Figure 3. Grand average of the ERP waveforms obtained by collapsing across the six frontal and central electrodes of interest (i.e., FCz, FC1, FC2, C1, C2, and Cz) time-locked to stimulus onset and including trials from all probe durations. Vertical dotted lines indicate the time window boundaries used to define the CNV slope. The data were smoothed with an eight-point Gaussian window for presentation only.
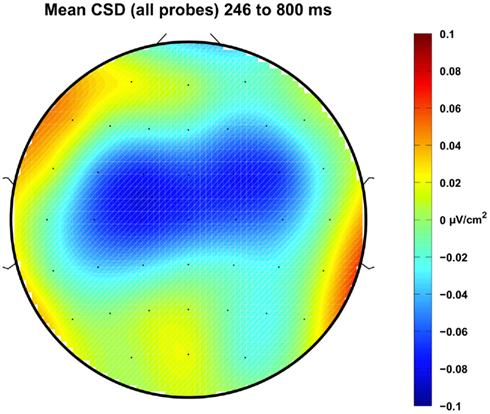
Figure 4. The topographical distribution, viewed from above the head, of the mean current source density (CSD) between 246 and 800 ms computed using trials from all probe durations. Prominent bilateral negative sources can be seen in the fronto-central region, consistent with the polarity and topography of the CNV.
As described in the Methods, examination of the GFP revealed that the transition from P2 to CNV occurred at approximately 246 ms, so a CNV slope was obtained for each participant in the time window from 246 to 800 ms. These 12 CNV slopes were tested against zero slope using a parametric, two-tailed, one-sample t-test. The mean slope was −0.0042 μV/ms, the 95% CI was [−0.0057 to −0.0014] μV/ms, t(11) = −3.59, p = 0.0042, indicating the negative slope was significantly different from zero over that time period. Furthermore, correlation analysis revealed that shallower CNV slopes were associated with longer PSEs, Pearson’s r = 0.67, p = 0.02. However, mean CNV amplitude between 246 and 800 ms was not correlated with mean PSE, Pearson’s r = 0.42, p = 0.19.
Note, however, that analysis of ERPs derived from all probe durations does not permit conclusions about when CNV resolution begins because stimulus offsets occur throughout the time period of interest. To determine when/whether CNV resolution began relative to the short anchor, as well as the GM and AM of the anchor durations, the ERP elicited by the timing stimulus was computed for each participant using trials at the two longest probe durations only (i.e., 2540 and 3200 ms). Slopes were obtained as described in Methods using time windows that framed the short anchor to GM (800–1600 ms), the GM to the AM (1600–2000 ms), and the AM to shortly before offset of the second longest probe duration (2000–2500 ms).
The mean slope was 0.0007 μV/ms in the 800- to 1600-ms time window and −0.0009 μV/ms in the 2000- to 2500-ms time window, neither of which was significantly different from zero [t(11) = 0.95, p = 0.36 and t(11) = −0.83, p = 0.42, respectively]. However, the mean slope of 0.0030 μV/ms in the 1600- to 2000-ms was significantly different from zero, 95% CI = [0.0001 to 0.0059] μV/ms, [t(11) = 2.27, p = 0.0045], indicating a decline in negative potential (Figure 5).
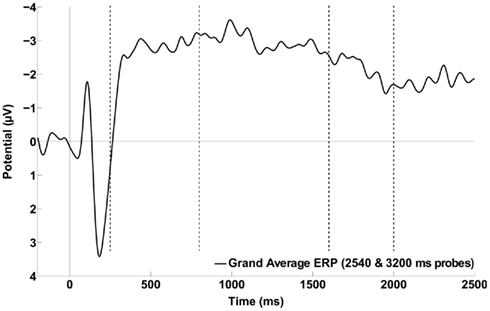
Figure 5. Grand average of the ERP waveforms obtained by collapsing across the six frontal and central electrodes of interest (i.e., FCz, FC1, FC2, C1, C2, and Cz) time-locked to stimulus onset and including only the two longest probe durations. Time window boundaries used to define the various CNV slopes are indicated with vertical dotted lines. The data were smoothed with an eight-point Gaussian window for presentation only.
The salience (i.e., the contrast between task conditions; McIntosh and Lobaugh, 2004) of the ERP differences between “long” and “short” response categories is shown in Figure 6. At the centro-frontal and centro-parietal sites, where the CNV was the most prominent, the salience of the difference was not statistically significant (PLS analyses) for most of the analysis time window, the only exception being the time window between 850 and 1100 ms. Moreover, the amplitude of the ERP corresponding to “long” responses was in fact less negative (indicated by positive salience in the plot) than that corresponding to “short” responses in this time window. Thus, we did not replicate the finding that larger CNV amplitude corresponds to larger perceived duration. Rather, when there was a difference, the effect was in the opposite direction.
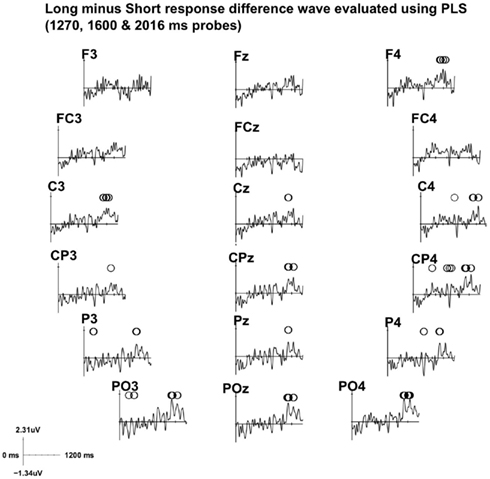
Figure 6. Electrode salience of the ERP difference between “long” and “short” responses from a subset of data (intermediate probes 1270, 1600, and 2016 ms) is illustrated for the fronto-central and parieto-central electrodes. Statistical significance and stability of the differences between the two conditions at each time point was obtained by partial least square (PLS) analyses. Circles indicate statistical significance (p < 0.05). A positive salience difference indicates less negative amplitude in the ERP of the “long” responses. The time axis is segmented by 200 ms tick marks, and positive amplitude is plotted upward.
Figure 7 shows the “short” and “long” response ERS time series averaged across the six frontal and central electrodes selected for the CNV ERP analyses. The ERS of the “long” responses between 246 and 800 ms in this fronto-central region was significantly stronger than that of the “short” responses (−16.9%) as confirmed by a parametric, two-tailed, paired sample t-test, t(11) = 2.25, p = 0.046, 95% CI = [−0.34 to −33.5%].
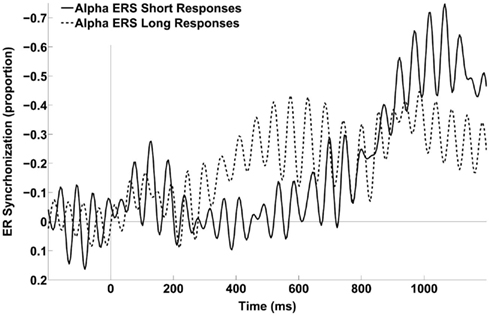
Figure 7. Alpha (∼7–13 Hz) ERS time series averaged across the six frontal and central electrodes of interest (i.e., FCz, FC1, FC2, C1, C2, and Cz) for the two response categories, computed using epochs from the three intermediate probe durations. There was no statistically significant power difference in the baseline (−200 to 0 ms) or late (800–1200 ms) time windows, t(11) = 0.1 and −1.24 respectively.
The mean CNV amplitude averaged across the six selected electrodes and the mean N1P2 peak-to-peak amplitude difference averaged across the nine selected electrodes were computed for the 246- to 800-ms time window for each participant by averaging trials across all probe durations. A Pearson’s correlation revealed that the larger the mean N1P2 peak-to-peak amplitude difference of a participant, the larger the mean CNV amplitude of that participant, r = −0.77, p = 0.003 (Figure 8).
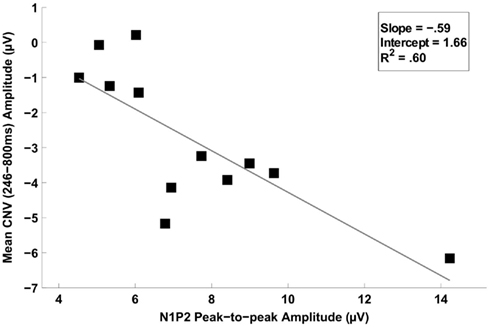
Figure 8. Scatter plot depicting the linear relationship between the mean CNV potential (246–800 ms) and the N1P2 amplitude difference (peak-to-peak). Simple regression indicated that larger N1P2 amplitude differences were associated with larger amplitude CNVs. The Pearson correlation coefficient (r) was 0.77, and the percentage of variance explained by the regression (R2) was 60%.
Discussion
The group mean PSE was close to the GM of the long and short anchor durations, a result that is often obtained with the duration bisection procedure, particularly when the probe durations are spaced logarithmically (e.g., Penney et al., 2000). The mean DL was also comparable to those obtained in earlier studies using similar anchor durations and indicates that the participants performed the task with an acceptable level of temporal precision.
The critical question here, however, is whether or not scalp-recorded electrophysiological measures reveal information about the nature of the time keeping and decision processes in the duration bisection task. The timing stimuli used in the task elicited clear ERP components in the form of the N1, P2, and a sustained negativity. The slow negative ERP component, which had a diffuse central scalp distribution, dominated the time window between approximately 250 and 800 ms after tone onset. We interpret this component as a CNV due to the consistency of its topography with the CNV reported in previous studies. Specifically, the statistical analyses using six fronto-central electrodes as well as the topographical distribution of the CSD transformed EEG data showed that it was maximal at fronto-central electrode sites, which is the distribution reported in ERP (e.g., Pfeuty et al., 2003a,b), CSD (e.g., Gibbons and Rammsayer, 2004), and EEG/MEG source localization (N’Diaye et al., 2004) studies investigating temporal estimation. Moreover, although the increase in the CNV to its peak value was relatively rapid compared to studies that used longer target durations and response locked ERP derivations (e.g., 2500 ms; Macar et al., 1999), the waveform was similar to that obtained in studies that used stimulus locked ERP derivations and target durations comparable to the short anchor duration used here (e.g., 794 ms; Pfeuty et al., 2005).
As described in the “Introduction,” the amplitude and the slope of the CNV have been interpreted as markers of temporal accumulation with longer subjective durations accompanied by larger amplitude CNVs (Macar et al., 1999; Macar and Vidal, 2004) and steep CNV slopes indicating faster temporal integration (Pfeuty et al., 2005). Moreover, the peak latency and resolution of the CNV have been interpreted as indicators of the memorized target duration (Macar and Vidal, 2003; Pfeuty et al., 2003b). We used these features of the CNV to examine the duration information participants use to solve the duration bisection task, and whether, on longer duration trials, participants categorize the timing stimulus before it offsets.
The data suggest that the short anchor duration is an important criterion that is used on a trial-to-trial basis in the standard duration bisection task. Specifically, the CNV slope was statistically different from zero between 246 and 800 ms (i.e., the short anchor duration). However, the CNV amplitude did not continue to increase even though the timing signal continued until either 2540 or 3200 ms in the trials that contributed to this analysis. Rather, the slope analysis indicated that approximately the same potential was maintained until about 1600 ms, at which point the potential declined until about 2000 ms. Pfeuty et al. (2003b, 2005) reported that the CNV peak occurred at the time of the target duration even when the timing signal was longer than the target duration. Therefore, we interpret the finding that CNV amplitude increased to a plateau at about 800 ms as indicating that the participants treated the short anchor duration as a target duration. In fact, up to this point in a duration bisection trial, stimulus presentation is quite similar to the S2 presentation in a typical S1–S2 trial: one pays attention from S2 onset, until either S2 is terminated or the remembered S1 duration has been reached, whichever is shorter.
Given Macar et al. (1999) have shown that the longer the timed signal the larger the accompanying CNV amplitude, it is curious that the CNV did not continue to increase beyond about 800 ms even though the timing stimulus remained on until either 2540 or 3200 ms for the trials that entered this analysis. Moreover, unlike the experiments of Pfeuty et al. (2003b, 2005) in which a decision about the probe duration could be made when the single target duration had been reached, in the duration bisection task used here the participant did not have enough information to make a long or short decision about a continuing stimulus based only on the knowledge that the short anchor target duration had elapsed.
However, there are other studies in which the CNV amplitude was not modulated by the duration being timed (Elbert et al., 1991; Gibbons and Rammsayer, 2004). Hence, it is possible that the CNV amplitude does not reflect accumulated duration in a linear fashion or that, if it does, the effect is detectable using scalp-recorded ERPs only for certain types of interval timing task. The putative presence of multiple target durations in the duration bisection task, such as the short and long anchors and/or a measure of central tendency, may make it difficult to detect robust EEG biomarkers for each of those critical durations. Nevertheless, the rise and fall of the CNV reported here is consistent with a time window during which participants have to sustain their attention in order to make a decision about the probe durations, as compared to some non-specific tonic attentional processes. Moreover, timing and non-timing decision making experiments have demonstrated plausible dissociations of memory and decision processes. For instance, using a psychological refractory period (PRP) paradigm, Rattat and Fortin (2011) found that a secondary digit recognition task interfered with interval timing only when the stimulus onset asynchrony (SOA) was reasonably long and led to an overlap of decision making and response selection. In a visual perceptual discrimination task, Ratcliff et al. (2009) found that a perceptual categorization (“face/car”) decision could be separated into an evidence gathering phase and a decision making phase, each characterized by a unique single-trial EEG component. The implication is that gathering information about the short anchor as one of the target durations (CNV rise) is necessary, but not sufficient for a bisection decision. This dissociation between encoding and decision is not easily made in the S1–S2 paradigm, because there is presumably only one criterion that is critical for making a choice; decision follows upon expiration of the remembered S1 duration. From this perspective, the bisection paradigm may allow a more detailed examination of the CNV in time perception.
That the CNV began to resolve at approximately 1600 ms for the two longest probe durations, as indicated by the positive slope between 1600 and 2000 ms, implies that the GM of the long and short anchor durations (i.e., 1600 ms) served as a target duration or temporal criterion with the classification decision occurring at about the GM rather than at the time of stimulus offset (2540 or 3200 ms). Interestingly, the CNV amplitude was sustained from about the AM of the anchor durations (2000 ms) to 2500 ms, which suggests that the AM did not serve as a target duration or criterion. We did not analyze the change in potential at and immediately following the offset of the long anchor duration (i.e., 3200 ms) because the EEG signal in that time range was contaminated by stimulus offset potentials and motor response related potentials (cf. Tarantino et al., 2010). Therefore, we do not have EEG data that addresses whether the long anchor was also treated as a target duration. Logically, however, if the GM of the short and long anchor durations is indeed used as a temporal criterion in the duration bisection decision process, then one might expect the brain to monitor the value of the longest probe duration so that adjustments to that criterion can be made if needed. This is in line with research suggesting that participants track temporal information on every trial in the duration bisection task (e.g., Brown et al., 2005; Penney et al., 2008).
Whereas the relationship between the CNV amplitude and the subjective perceived time was not as prominent as reported in previous experiments, a correlation analysis revealed that shallower CNV slopes were associated with longer PSEs. As noted in the “Introduction,” several authors (Pfeuty et al., 2003b, 2005; Durstewitz, 2004) have suggested that the slope of the CNV reflects the rate of temporal accumulation. Hence, a shallower CNV slope means slower temporal accumulation, which results in a smaller perceived (i.e., subjective) duration for a given objective duration. An apparent difficulty with applying this interpretation to the duration bisection task, however, is that the slower accumulation would likely occur during both “short” and “long” anchor duration presentations also. If the probe duration, as well as the durations that are used, either directly or indirectly, in the “short”/“long” decision are all measured using the same accumulation rate by a given participant, it is not clear how a slow temporal accumulation would result in a longer PSE than a relatively faster PSE (although the response function may be sharper for the faster accumulation case). A 10 pulse probe accumulation holds the same relative position with respect to 5 and 15 pulse anchors as would be the case if the accumulation process were five times faster (i.e., 50 pulse probe, 25 and 75 pulse anchors). A possible solution to this explanatory difficulty is that the slow accumulation occurs on some trials only. Assuming the critical short and long anchor trials are not overrepresented among these trials, then the PSE could be longer due to the slower temporal accumulation because slow clock trials will be compared to anchor durations used in the decision process that were laid down with relatively faster temporal accumulation.
We also found an ERS difference between intermediate probe durations classified as short and long. Specifically, in the alpha band the ERS was stronger for “long” responses. In a foreperiod study, Babiloni et al. (2004) found that trials cued with a short foreperiod (600 ms) were associated with stronger alpha ERS (∼6–10 Hz) than were long foreperiod (1400 ms) trials. The authors postulated that stronger alpha ERS reflected stronger temporal expectation. Assuming stronger temporal expectation is a consequence of optimal allocation of temporal attention (e.g., Coull and Nobre, 2008), then the stronger ERS obtained here in “long” response trials may reflect “stronger and quicker” (Babiloni et al., 2004) initial allocation of attention. Within the SET framework, more efficient allocation of attention on a trial would mean loss of fewer pacemaker pulses as compared to a less attentive trial (Lejeune, 1998), and therefore a higher probability of a duration being classified as “long.”
Finally, the finding that the larger the mean peak-to-peak amplitude of the N1P2 complex the more negative the subsequent mean CNV may be a consequence of the precision with which a participant is able to initiate timing on each trial across a test session. ERP components such as N1 and P2 are sensitive to physical features of the stimuli, and general state and attention of the individuals (e.g., Näätänen and Picton, 1987; Herrmann and Knight, 2001; Picton et al., 2002; Crowley and Colrain, 2004; Nagai et al., 2004). Hence, the N1P2 component may be a marker for the precision of the signal or “start-gun” that initiates timing when the bisection stimulus is presented. If timing is indeed achieved by groups of ramping neurons through spreading activation or signal integration (König et al., 1996; Simen et al., 2011), with the change in CNV amplitude reflecting that ramping process (Macar et al., 1999; Macar and Vidal, 2004), then a reduction in latency jitter of the component across trials would result in a larger average ERP component. For example, Trillenberg et al. (2000) found that the CNV amplitude was more negative when the SOA was the most probable one in the trial block in a Go/No-go task with variable SOAs. The RT was also fastest for the most probable SOA trials as compared to the other SOA trials. The authors argued that this was the moment when participants could most reliably orient attention. Co-variations in the N1P2 component and subjective perception of time have also been reported in a replication of Macar et al. (1999) that used sub-second auditory intervals (Bendixen et al., 2005) and in a number–time interaction study (Xuan et al., 2009). In both studies, larger N1P2 components were associated with longer perceived time, and accompanied by a more negative CNV component. We explored the possibility that the jittering in the N1P2 component may affect the CNV amplitude by calculating the inter-trial phase coherence (ITPC) at the time window of N1P2 (80–250 ms; Mørup et al., 2007). ITPC measures the synchronization between the time-locked event and the EEG across trials (Delorme and Makeig, 2004). It varies from 0 (no consistent synchronization) to 1 (perfect synchronization). Participants who initiate timing consistently (i.e., less jitter across trials) should show stronger synchronization between the time-locked event and the EEG signal. In our sample, ITPC in the theta range (∼4–7 Hz), whose event related power is dominant in this early time window (e.g., Yordanova et al., 2002), was significantly correlated with the N1P2 amplitude (r = 0.64, p < 0.05) and the CNV amplitude (r = −0.63, p < 0.05).
Conclusion
The relationship between temporal memory and the CNV has been based mainly on paradigms like temporal discrimination (e.g., Pfeuty et al., 2005), temporal generalization (e.g., Macar and Vidal, 2003), and reproduction (e.g., Elbert et al., 1991; Macar et al., 1999), in which the target or criterion duration is unambiguous. Here, we used the CNV as a tool in order to understand how the representations of the anchor durations in the bisection task are used to make categorical decisions. The ERP and CSD topographies of the negative slow potential (i.e., CNV) were consistent with those obtained in other timing tasks. It peaked at the time close to the short anchor duration (800 ms) and remained stable until the GM (1600 ms) of the probe series, when it started to resolve. This pattern suggests that participants monitored the anchor durations and used the GM of the anchor durations as a bisection criterion (Kopec and Brody, 2010; cf. Wearden and Bray, 2001; Allan, 2002). In addition, while the association of the N1P2 component with interval timing has been relatively unexplored to date, we suggest that this component’s relationship to CNV amplitude may indicate it is a marker of the initiation of timing. Indeed, the latency jitter of the timing “start-gun” may prove vital to understanding variability in timing performance and the manifestation of electrophysiological events during interval timing.
Conflict of Interest Statement
The authors declare that the research was conducted in the absence of any commercial or financial relationships that could be construed as a potential conflict of interest.
Acknowledgments
Publication of this work has been partially supported by the European project COST ISCH Action TD0904 “Time In Mental activity: Theoretical, behavioral, bioimaging, and clinical perspectives” (TIMELY: www.timely-cost.eu). Simon Tobin was supported by the Natural Sciences and Engineering Research Council of Canada.
References
Allan, L. G. (2002). The location and interpretation of the bisection point. Q. J. Exp. Psychol. B 55, 43–60.
Allan, L. G., and Gerhardt, K. (2001). Temporal bisection with trial referents. Percept. Psychophys. 63, 524–540.
Babiloni, C., Miniussi, C., Babiloni, F., Carducci, F., Cincotti, F., Del Percio, C., Sirello, G., Fracassi, C., Nobre, A. C., and Rossini, P. M. (2004). Sub-second “temporal attention” modulates alpha rhythms. A high-resolution EEG study. Brain Res. Cogn. Brain Res. 19, 259–268.
Balci, F., Freestone, D., and Gallistel, C. R. (2009). Risk assessment in man and mouse. Proc. Natl. Acad. Sci. U.S.A. 106, 2459–2463.
Bendixen, A., Grimm, S., and Schröger, E. (2005). Human auditory event-related potentials predict duration judgments. Neurosci. Lett. 383, 284–288.
Birbaumer, N., Elbert, T., Canavan, A. G., and Rockstroh, B. (1990). Slow potentials of the cerebral cortex and behavior. Physiol. Rev. 70, 1–41.
Brown, G. D. A., McCormack, T., Smith, M., and Stewart, N. (2005). Identification and bisection of temporal durations and tone frequencies: common models for temporal and nontemporal stimuli. J. Exp. Psychol. Hum. Percept. Perform. 31, 919–938.
Buhusi, C. V., and Meck, W. H. (2005). What makes us tick? Functional and neural mechanisms of interval timing. Nat. Rev. Neurosci. 6, 755–765.
Correa, A., Lupiáñez, J., Madrid, E., and Tudela, P. (2006). Temporal attention enhances early visual processing: a review and new evidence from event-related potentials. Brain Res. 1076, 116–128.
Coull, J., and Nobre, A. (2008). Dissociating explicit timing from temporal expectation with fMRI. Curr. Opin. Neurobiol. 18, 137–144.
Crowley, K. E., and Colrain, I. M. (2004). A review of the evidence for P2 being an independent component process: age, sleep and modality. Clin. Neurophysiol. 115, 732–744.
Delorme, A., and Makeig, S. (2004). EEGLAB: an open source toolbox for analysis of single-trial EEG dynamics including independent component analysis. J. Neurosci. Methods 134, 9–21.
Elbert, T., Ulrich, R., Rockstroh, B., and Lutzenberger, W. (1991). The processing of temporal intervals reflected by CNV-like brain potentials. Psychophysiology 28, 648–655.
Gibbon, J. (1981). On the form and location of the psychometric bisection function for time. J. Math. Psychol. 24, 58–87.
Gibbon, J., Church, R. M., and Meck, W. H. (1984). Scalar timing in temporal memory. Ann. N. Y. Acad. Sci. 423, 52–77.
Gibbons, H., and Rammsayer, T. H. (2004). Current-source density analysis of slow brain potentials during time estimation. Psychophysiology 41, 861–874.
Grondin, S. (2010). Timing and time perception: a review of recent behavioral and neuroscience findings and theoretical directions. Atten. Percept. Psychophys. 72, 561–582.
Herrmann, C. S., and Knight, R. T. (2001). Mechanisms of human attention: event-related potentials and oscillations. Neurosci. Biobehav. Rev. 25, 465–476.
Kayser, J. (2009). Current Source Density (CSD) Interpolation Using Spherical Splines – CSD Toolbox (Version 1.1). New York: Division of Cognitive Neuroscience, New York State Psychiatric Institute.
Kayser, J., and Tenke, C. E. (2006). Principal components analysis of Laplacian waveforms as a generic method for identifying ERP generator patterns: I. Evaluation with auditory oddball tasks. Clin. Neurophysiol. 117, 348–368.
Killeen, P. R., Fetterman, J. G., and Bizo, L. A. (1997). “Time’s causes,” in Time and Behaviour: Psychological and Neurological Analyses, eds C. M. Bradshaw and E. Szabadi (Amsterdam: Elsevier Science), 79–131.
König, P., Engel, A. K., and Singer, W. (1996). Integrator or coincidence detector? The role of the cortical neuron revisited. Trends Neurosci. 19, 130–137.
Kononowicz, T. W., and van Rijn, H. (2011). Slow potentials in time estimation: the role of temporal accumulation and habituation. Front. Integr. Neurosci. 5:48. doi:10.3389/fnint.2011.00048
Kopec, C. D., and Brody, C. D. (2010). Human performance on the temporal bisection task. Brain Cogn. 74, 262–272.
Lehmann, D., and Skrandies, W. (1980). Reference-free identification of components of checkerboard-evoked multichannel potential fields. Electroencephalogr. Clin. Neurophysiol. 48, 609–621.
Lehmann, D., and Skrandies, W. (1984). Spatial analysis of evoked potentials in man – a review. Prog. Neurobiol. 23, 227–250.
Lejeune, H. (1998). Switching or gating? The attentional challenge in cognitive models of psychological time. Behav. Process. 44, 127–145.
Luck, S. J. (2005). An Introduction to the Event-Related Potential Technique. Cambridge, MA: MIT Press.
Macar, F., Coull, J., and Vidal, F. (2006). The supplementary motor area in motor and perceptual time processing: fMRI studies. Cogn. Process. 7, 89–94.
Macar, F., and Vidal, F. (2003). The CNV peak: an index of decision making and temporal memory. Psychophysiology 40, 950–954.
Macar, F., and Vidal, F. (2004). Event-related potentials as indices of time processing: a review. J. Psychophysiol. 18, 89–104.
Macar, F., and Vidal, F. (2009). Timing processes: an outline of behavioural and neural indices not systematically considered in timing models. Can. J. Exp. Psychol. 63, 227–239.
Macar, F., Vidal, F., and Casini, L. (1999). The supplementary motor area in motor and sensory timing: evidence from slow brain potential changes. Exp. Brain Res. 125, 271–280.
McIntosh, A. R., and Lobaugh, N. J. (2004). Partial least squares analysis of neuroimaging data: applications and advances. Neuroimage 23(Suppl. 1), S250–S263.
Meck, W. H., Penney, T. B., and Pouthas, V. (2008). Cortico-striatal representation of time in animals and humans. Curr. Opin. Neurobiol. 18, 145–152.
Michel, C. M., Koenig, T., Brandeis, D., Gianotti, L. R. R., and Wackermann, J. (eds). (2009). Electrical Neuroimaging. New York: Cambridge University Press.
Mørup, M., Hansen, L. K., and Arnfred, S. M. (2007). ERPWAVELAB a toolbox for multi-channel analysis of time-frequency transformed event related potentials. J. Neurosci. Methods 161, 361–368.
Murray, M. M., Brunet, D., and Michel, C. M. (2008). Topographic ERP analyses: a step-by-step tutorial review. Brain Topogr. 20, 249–264.
Näätänen, R., and Picton, T. (1987). The N1 wave of the human electric and magnetic response to sound: a review and an analysis of the component structure. Psychophysiology 24, 375–425.
Nagai, Y., Critchley, H. D., Featherstone, E., Fenwick, P. B. C., Trimble, M. R., and Dolan, R. J. (2004). Brain activity relating to the contingent negative variation: an fMRI investigation. Neuroimage 21, 1232–1241.
N’Diaye, K., Ragot, R., Garnero, L., and Pouthas, V. (2004). What is common to brain activity evoked by the perception of visual and auditory filled durations? A study with MEG and EEG co-recordings. Brain Res. Cogn. Brain Res. 21, 250–268.
Penney, T. B., Gibbon, J., and Meck, W. H. (2000). Differential effects of auditory and visual signals on clock speed and temporal memory. J. Exp. Psychol. Hum. Percept. Perform. 26, 1770–1787.
Penney, T. B., Gibbon, J., and Meck, W. H. (2008). Categorical scaling of duration bisection in pigeons (Columba livia), mice (Mus musculus), and humans (Homo sapiens). Psychol. Sci. 19, 1103–1109.
Perrin, F., Pernier, J., Bertrand, O., and Echallier, J. F. (1989). Spherical splines for scalp potential and current density mapping. Electroencephalogr. Clin. Neurophysiol. 72, 184–187.
Perrin, F., Pernier, J., Bertrand, O., and Echallier, J. F. (1990). Corrigenda EEG 02274. Electroencephalogr. Clin. Neurophysiol. 76, 565.
Pfeuty, M., Ragot, R., and Pouthas, V. (2003a). Processes involved in tempo perception: a CNV analysis. Psychophysiology 40, 69–76.
Pfeuty, M., Ragot, R., and Pouthas, V. (2003b). When time is up: CNV time course differentiates the roles of the hemispheres in the discrimination of short tone durations. Exp. Brain Res. 151, 372–379.
Pfeuty, M., Ragot, R., and Pouthas, V. (2005). Relationship between CNV and timing of an upcoming event. Neurosci. Lett. 382, 106–111.
Pfeuty, M., Ragot, R., and Pouthas, V. (2008). Brain activity during interval timing depends on sensory structure. Brain Res. 1204, 112–117.
Pfurtscheller, G., and Lopes da Silva, F. H. (1999). Event-related EEG/MEG synchronization and desynchronization: basic principles. Clin. Neurophysiol. 110, 1842–1857.
Picton, T. W., Alain, C., and McIntosh, A. R. (2002). “The theatre of the mind: physiological studies of the human frontal lobes,” in Principles of Frontal Lobe Function, eds D. T. Stuss and R. T. Knight (New York: Oxford University Press), 109–127.
Pizzagalli, D. A. (2007). “Electroencephalography and high-density electrophysiological source localization,” in Handbook of Psychophysiology, eds J. T. Cacioppo, L. G. Tassinaru, and G. G. Berntson (Cambridge: Cambridge University Press), 56–84.
Pouthas, V., George, N., Poline, J.-B., Pfeuty, M., Vandemoorteele, P.-F., Hugueville, L., Ferrandez, A.-M., Lehéricy, S., Lebihan, D., and Renault, B. (2005). Neural network involved in time perception: an fMRI study comparing long and short interval estimation. Hum. Brain Mapp. 25, 433–441.
Praamstra, P., Kourtis, D., Kwok, H. F., and Oostenveld, R. (2006). Neurophysiology of implicit timing in serial choice reaction-time performance. J. Neurosci. 26, 5448–5455.
Ratcliff, R., Philiastides, M. G., and Sajda, P. (2009). Quality of evidence for perceptual decision making is indexed by trial-to-trial variability of the EEG. Proc. Natl. Acad. Sci. U.S.A. 106, 6539–6544.
Rattat, A.-C., and Fortin, C. (2011). Modulating the interference effect in timing with varying stimulus onset asynchrony. Can. J. Exp. Psychol. 65, 151–162.
Simen, P., Balci, F., deSouza, L., Cohen, J. D., and Holmes, P. (2011). A model of interval timing by neural integration. J. Neurosci. 31, 9238–9253.
Stone, J. V. (2002). Independent component analysis: an introduction. Trends Cogn. Sci. (Regul. Ed.) 6, 59–64.
Tarantino, V., Ehlis, A.-C., Baehne, C., Boreatti-Huemmer, A., Jacob, C., Bisiacchi, P., and Fallgatter, A. J. (2010). The time course of temporal discrimination: an ERP study. Clin. Neurophysiol. 121, 43–52.
Tenke, C. E., Kayser, J., Fong, R., Leite, P., Towey, J. P., and Bruder, G. E. (1998). Response- and stimulus-related ERP asymmetries in a tonal oddball task: a Laplacian analysis. Brain Topogr. 10, 201–210.
Trillenberg, P., Verleger, R., Wascher, E., Wauschkuhn, B., and Wessel, K. (2000). CNV and temporal uncertainty with “ageing” and “non-ageing” S1-S2 intervals. Clin. Neurophysiol. 111, 1216–1226.
van Boxtel, G. J. M., and Böcker, K. B. E. (2004). Cortical measures of anticipation. J. Psychophysiol. 18, 61–76.
Vicario, C. M. (2011). Perceiving numbers affects the subjective temporal midpoint. Perception 40, 23–29.
Walter, W. G., Cooper, R., Aldridge, V. J., McCallum, W. C., and Winter, A. L. (1964). Contingent negative variation: an electric sign of sensorimotor association and expectancy in the human brain. Nature 203, 380–384.
Wearden, J. H. (2004). Decision processes in models of timing. Acta Neurobiol. Exp. (Wars.) 64, 303–317.
Wearden, J. H., and Bray, S. (2001). Scalar timing without reference memory? Episodic temporal generalization and bisection in humans. Q. J. Exp. Psychol. B 54, 289–309.
Wearden, J. H., and Ferrara, A. (1995). Stimulus spacing effects in temporal bisection by humans. Q. J. Exp. Psychol. B 48, 289–310.
Xuan, B., Chen, X. C., He, S., and Zhang, D.-R. (2009). Numerical magnitude modulates temporal comparison: an ERP study. Brain Res. 1269, 135–142.
Keywords: time perception, interval timing, duration bisection, EEG, slow potential, contingent negative variation, N1P2, temporal memory
Citation: Ng KK, Tobin S and Penney TB (2011) Temporal accumulation and decision processes in the duration bisection task revealed by contingent negative variation. Front. Integr. Neurosci. 5:77. doi: 10.3389/fnint.2011.00077
Received: 25 July 2011;
Paper pending published: 17 August 2011;
Accepted: 12 November 2011;
Published online: 29 November 2011.
Edited by:
Warren H. Meck, Duke University, USAReviewed by:
Niko Busch, Charité – Universitätsmedizin Berlin, GermanyLaurence Casini, Université de Provence, France
Copyright: © 2011 Ng, Tobin and Penney. This is an open-access article distributed under the terms of the Creative Commons Attribution Non Commercial License, which permits use, distribution, and reproduction in other forums, provided the original authors and source are credited.
*Correspondence: Trevor B. Penney, Department of Psychology, National University of Singapore, 9 Arts Link, Singapore 117570. e-mail:cGVubmV5QG51cy5lZHUuc2c=