


- 1 École de Psychologie, Université Laval, Québec, QC, Canada
- 2 Laboratory for Mathematical Neuroscience, Brain Science Institute, RIKEN, Wako, Japan
The study investigated how the brain activity changed when participants were engaged in a temporal production task known as the “filled-duration illusion.” Twelve right-handed participants were asked to memorize and reproduce the duration of time intervals (600 or 800 ms) bounded by two flashes. Random trials contained auditory stimuli in the form of three 20 ms sounds between the flashes. In one session, the participants were asked to ignore the presence of the sounds, and in the other, they were instructed to pay attention to sounds. The behavioral results showed that duration reproduction was clearly affected by the presence of the sounds and the duration of time intervals. The filled-duration illusion occurred when there were sounds; the participants overestimated the interval in the 600-ms interval condition with sounds. On the other hand, the participants underestimated the 800-ms interval condition without sounds. During the presentation of the interval to be encoded, the contingent negative variation (CNV) appeared around the prefrontal scalp site, and P300 appeared around the parieto-central scalp site. The CNV grew larger when the intervals contained the sounds, whereas the P300 grew larger when the intervals were 800 ms and did not contain the sounds. During the reproduction of the interval to be presented, the Bereitschaftspotential (BP) appeared over the fronto-central scalp site from 1000 ms before the participants’ response. The BP could refer to the decision making process associated with the duration reproduction. The occurrence of three event-related potentials (ERPs), the P300, CNV, and BP, suggests that the fronto-parietal area, together with supplementary motor area (SMA), is associated with timing and time perception, and magnitude of these potentials is modulted by the “filled-duration illusion”.
Introduction
How does timing occur during an interval? How does the presence of additional sensory signals, during the process to be timed, interfere with this timing period? We use electroencephalographic (EEG) measures to determine how timing occurs in the context where additional signals are delivered.
The timing and time perception literature reveals that the occurrence of additional sensory information during an interval increases the perceived duration of this interval. This effect refers to the “filled-duration illusion.” Technically, one may distinguish two branches of knowledge related to this effect. On the one hand, the effect may refer to the structure of a time interval, i.e., whether it is marked by two brief and distinct sensory signals (empty intervals) or by a continuous signal marking the onset and offset of the period to be timed (filled intervals; see Grondin, 1993; Grondin et al., 1998b). In this context, a relatively consistent finding is that filled intervals are perceived as being longer than empty ones (Wearden et al., 2007; ten Hoopen et al., 2008). This version of the filled-duration effect is not the one emphasized in the present article.
On the other hand, the “filled-duration illusion” (or the “filled-time illusion”) refers to the fact that intervals marked by two brief signals, but filled with intermittent stimuli, are perceived as longer than empty intervals of equal physical duration (Hall and Jastrow, 1886; Thomas and Brown, 1974; Adams, 1977); this effect reminds one of the Oppel-Kundt illusion for space. Indeed, perceived duration increases when more sensory signals are presented during the interval (Grondin, 1992; Grondin et al., 1998a; Gamache et al., 2008).
Buffardi (1971) reported that the overestimation depends on the number of dividing sounds occurring during an interval. Filling an interval with additional signals provides an opportunity to segment the entire interval into a series of sub-intervals. One may capitalize on this opportunity for keeping track of time; these signals could be used to set some pace or can be substituted by numbers for inducing an implicit count of numbers (Grondin et al., 1999, 2004; Grondin, 2003). In addition to investigating the effects of sounds which subdivide the intervals, we tested the influence of orienting attention on the sounds marking sub-intervals. Previous studies which dealt with the relationship between attention and time perception revealed that perceived intervals were longer when observers paid attention to the intervals (Brown, 2008). The magnitude of the illusion should be larger when the participants were required to orient their attention to the stimuli to keep track of time. In the present study, there were conditions where additional sensory signals for filling an interval either had to be ignored, or had to be used for counting numbers in the time estimation process.
Moreover, testing the relative effect on the “filled-duration illusion” of a passive attitude (ignore additional signals if they occur) vs. of an active use of the additional signals for explicit counting, the study aimed to provide an opportunity to search for cerebral indices related to the potential effect. Different cerebral imaging techniques contributed to develop hypotheses regarding the cerebral bases for processing temporal information (Grondin, 2010). The frontal cortex is most often reported as a key component involved in temporal tasks, with the role of accumulator being attributed to the supplementary motor area (SMA) and the storing and maintaining of temporal information being associated with the premotor cortex (Rubia and Smith, 2004). The parietal cortex, in particular the right inferior portion, would act as the moderator for directing attention to the stimulus marking time during the encoding of time intervals. The start and stop signals marking the period of accumulation of temporal information would be under the responsibility of the parietal cortex (Alexander et al., 2005; Bueti et al., 2008).
EEG has high temporal resolution, and is suitable to extract brain responses relevant to the perception from milliseconds to seconds intervals, from different brain areas at the same time. Previous studies with event-related potentials (ERPs) suggested that several ERP components corresponded to cognitive functions that are required to the perception of temporal intervals, such as working memory, attention, and decision making (Gibbon et al., 1997; Macar and Vidal, 2003, 2004). An ERP component often related to these functions is the contingent negative variation (CNV; Walter et al., 1964). The CNV has been observed in temporal perception and estimation tasks. It is related to the memorization of time intervals (Pouthas et al., 2000; Pfeuty et al., 2003a,b), duration reproduction (Macar et al., 1999), and accumulation processes (Pouthas et al., 2000; Montfort and Pouthas, 2003; Pfeuty et al., 2003b). The generator of the CNV in the task of duration discrimination is mostly considered to be the prefrontal cortex (Pouthas, 2003; Macar and Vidal, 2004). Another ERP component, the P300 (Picton, 1992), is also related to selective attention in temporal tasks (Macar and Vidal, 2003; Gontier et al., 2007, 2008, 2009; Le Dantec et al., 2007; Mitsudo et al., 2009). The parietal cortex is one of the critical sources of the P300 in the context of attention and working memory (Picton, 1992; Horn et al., 2003; Linden, 2005), and the relationships between the P300 and the parietal cortex were also discussed in the timing literature (Gontier et al., 2007, 2009; Mitsudo et al., 2009). Moreover, the slowly increasing negativity called the Bereitschaftspotential (BP), or the readiness potential (RP), is another measure of activity in the motor cortex of the brain caused by voluntary muscle movement; the SMA is argued to be the generator of this activity (Deecke and Kornhuber, 1978). Indeed, BP was reported as a signature for time reproduction (e.g., Macar et al., 1999).
There was one previous ERP study that examined the neural correlates of the “filled-duration illusion” (Pfeuty et al., 2008). The study adopted the filled (continuous tones) or empty (silent periods bounded by two brief tones) intervals and revealed that the CNV was closely related to the occurrence of the illusion. The CNV amplitude was larger for the filled than for the empty intervals, with a better discrimination performance with the empty than with the filled intervals during the recording. In contrast, the empty intervals in our study were segmented in four sub-intervals by additional auditory signals. Since each signal was expected to require orienting attention to keep track of time, our study was able to clarify the time course of the attention mechanisms relevant to temporal processing. Moreover, we intended to explore the EEG activity in the reproduction period, which enabled us to investigate the whole process required in time perception.
The goal of the present study is to investigate how the brain activity, as revealed by the EEG activity, changes when participants are engaged in a temporal reproduction task associated with the “filled-duration illusion.” Participants were asked to memorize and reproduce the duration of a temporal interval (600 or 800 ms) bounded by two flashes. During this interval, three additional brief sounds were, or were not, presented, in a random order. In one session, participants were asked to ignore the presence of the sounds, and in the other one, they were instructed to use it for keeping track of time. We focused on two processes, encoding and reproduction. The brain signals of interest were related to attention and memory processes in the encoding period, and decision making processes in the reproduction period. Finally, as previous studies consistently reported the dominance of the right hemisphere when participants are engaged in memorizing or reproducing time intervals (Pouthas et al., 2000; Pfeuty et al., 2003b), it was planned to verify whether any hemispheric difference appeared during the task.
Materials and Methods
Participants
Twelve volunteer right-handed participants aged 20–39 (five men, seven women) took part in this experiment. They received $24 CAN for their participation. All had normal or corrected-to-normal vision, and had no reported hearing deficits. The experimental procedures were approved by the Ethics Committee of Université Laval.
Stimuli
Each participant was seated in a dimly lit room in front of an LCD monitor connected to a computer at a viewing distance of approximately 60 cm. Two 20 ms flashes (red circles), which subtended a visual angle of 0.95° horizontally and 0.95° vertically, were used for marking the 600- or 800-ms temporal intervals by their onsets. Three additional brief sounds were 1 kHz sine waves presented binaurally at 77 dB (SPL) for a 20-ms duration via speakers placed on each side of the computer screen. Two-thousand milliseconds before the flashes, a white circle (visual angle of 0.95° horizontally and 0.95°vertically) was presented where the flashes would appear. After the second flash, the white circle remained presented for 950 ms until a visual instruction appeared.
Procedure
Each trial consisted of two phases: encoding and reproduction. Participants were asked to memorize and reproduce the duration of one time interval (600 or 800 ms) bounded by two flashes (see Figure 1). In half of the trials in a random order, series of three auditory stimuli were presented during the interval. The sounds segmented the interval in four equal sub-intervals of 150 or 200 ms. Nine hundred fifty milliseconds after the interval presentation, a visual instruction was presented to let the participants reproduce the duration between the two flashes. The participants reproduced the duration by pressing a button on a keypad with their right index finger. The duration between the first tap and the second tap – the reproduced interval – was used for behavioral analyses. The delay between the second flash and the first tap was determined by the timing when the participants decided to initiate the reproduction.
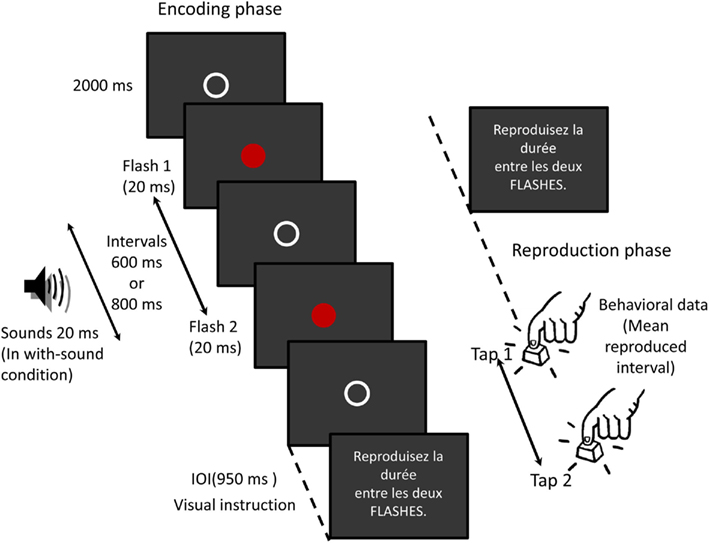
Figure 1. Procedure of the experiment. In the encoding phase, the stimulus epoch begins 100 ms prior to the onset of the first flash and continues for 1200 ms. During half of the trials within a block, in a random order, series of three auditory stimuli (20 ms, 1 kHz) were presented. Before and after the flashes, a white circle was presented where the flash would appear. The sounds segmented the interval in four equal sub-intervals of 150 or 200 ms. The delay between the second flash and the first tap was determined by the timing when the participants decided to initiate the reproduction.
There were two sessions. In one session, the participants had to pay attention to the sounds during their estimations and to use the sounds for segmenting the interval to be memorized into small sub-intervals (Pay attention). In the other session, they were asked to ignore the presence of any sound occurring during the interval to be memorized (Ignore). The order of the sessions was counterbalanced across participants. The participants performed the two sessions on different days. One session consisted of one practice block and five experimental blocks. The practice stimuli were presented 20 times before the beginning of the experimental blocks. Then each stimulus (600 ms without-sounds, 800 ms without-sounds, 600 ms with-sounds, or 800 ms with-sounds) was presented 25 times in a random order in each block, making a total of 100 trials per block. EEG activity was recorded from 32 scalp electrodes during the whole task (encoding and presentation + temporal reproduction phases).
EEG Recording
EEG was recorded continuously with a 32-channel Geodesic Sensor Net [Fp1, Fp2, Fpz, FT9, FT10, F7, F8, F3, F4, Fz, FCz, C5, C6, C3, C4, Cz, T3(T7), T4(T8), T5(P7), T6(P8), TP9, TP10, P3, P4, Pz, O1, O2, Oz, and four electrodes below each eye] using a NetAmps 300 (Electrical Geodesics Inc., Eugene, OR, USA). Cz was used as the reference. Electrooculogram (EOG) was monitored using electrodes placed below each eye. The electrode impedance was kept below 50 kΩ. This range was acceptable given the high input impedance of the amplifiers of this system. Off-line analyses of the data were performed using Net Station software (Electrical Geodesics, Inc., Eugene, OR, USA). The ERP and EOG data were sampled at a rate of 250 Hz. Trials were marked “bad” if the average amplitude exceeded 100 μV, if they contained more than 10 bad channels, or contained eye movement in excess of 55 μV. These automated criteria were supplemented by visual inspection. In the remaining trials, data for bad channels were replaced by interpolations from the remaining channels using Net Station software. A total of 54–87 responses were averaged, re-referenced at the mastoid, and baseline-corrected for each stimulus for each participant.
For the ERP analysis, each stimulus epoch began 100 ms prior to, and continued 1200 ms after the onset of the first flash in the encoding phase. In the temporal reproduction phase, for the Tap1 analysis, the stimulus epoch began 800 ms prior to this first tap with a baseline measured 100 ms before the first flash (backward analysis time-locked to Tap1). The baseline, which was 100 ms before the first flash (at the beginning of each trial) was used because the period did not contain any artifact related to the task. For the Tap2 analysis, the stimulus epoch began 1500 ms prior to this tap, and continued 300 ms after, with a 100-ms baseline measured at the first flash (backward analysis time-locked to Tap2). Note that the EEG before tapping contained activities related to the encoding (see Figure 1). Each participant was instructed to keep their eyes open during stimulus presentation.
Data Analyses
The effects of stimulus and attention
The dependent variable of interest was the mean reproduced interval. More specifically, in order to directly compare the 600 and the 800-ms intervals, we calculated the deviation from the standard interval – the constant error (CE) – as a variable of interest (CE = mean production – standard). A 2 (Sounds: with vs. without) × 2 (Attention: pay attention or ignore) × 2 (Duration: 600 vs. 800 ms) ANOVA with repeated measures was used to analyze the behavioral data.
The effect of session order
To explore whether there was an effect of order, e.g., participants really ignored the sounds in the second Ignore session when they used them in the first Pay attention session, we additionally checked the effect of session order. An ANOVA was used with Session order (first or second) as a between subject variable, and Attention (pay attention or ignore), Stimulus types (four levels: 600 ms with-sounds, 600 ms without-sounds, 800 ms with-sounds, and 800 ms without-sounds) as within-subject variables.
Event-related potentials
Encoding phase. We first checked whether CNV differed among conditions by analyzing a time course of the CNV in order to investigate the temporal development of the CNV during the encoding phase. Because of the difference of the stimulus duration, we analyzed the time course of 600 and 800 ms condition separately. For both 600 and 800 ms conditions, 100 ms temporal windows were applied. For 600 ms condition, each temporal window was set between 1 and 800 ms: tw1 = (1–100 ms), tw2 = (101–200 ms), tw3 = (201–300 ms), tw4 = (301–400 ms), tw5 = (401–500 ms), tw6 = (501–600 ms), tw7 = (601–700 ms), and tw8 = (701–800 ms). For 800 ms condition, each temporal window was set between 1 and 1000 ms: tw1 = (1–100 ms), tw2 = (101–200 ms), tw3 = (201–300 ms), tw4 = (301–400 ms), tw5 = (401–500 ms), tw6 = (501–600 ms), tw7 = (601–700 ms), tw8 = (701–800 ms), tw9 = (801–900 ms), and tw10 = (901–1000 ms). For each duration condition, a 2 (Sounds: with vs. without) × 2 (Attention: pay attention or ignore) × 8 or 10 (Temporal Window: tw1 to tw 8 for 600 ms, tw1 to tw10 for 800 ms) ANOVA was carried out on the mean CNV amplitude calculated over successive temporal windows on the averaged EEG activity of the six prefrontal electrodes (FP1, FP2, F3, F4, Fpz, and Fz). Subsequently, for P300, we measured maximal amplitude and the latency on the averaged EEG activity of the three parieto-central electrodes (Pz, Cz, and FCz). We measured first maximal positive peak between 150 and 350 ms after the offset of the second flash. In order to examine the characteristics of the P300, two 2 (Sounds: with vs. without) × 2 (Attention: pay attention or ignore) × 2 (Duration: 600 vs. 800 ms) ANOVAs with repeated measures were conducted on the amplitude and the latency of P300. Finally, a 2 (Sounds: with vs. without) × 2 (Attention: pay attention or ignore) × 2 (Duration: 600 vs. 800 ms) × 2 (Laterality: right or left) × 5 (Electrode sites: anterior to posterior) ANOVA was performed on the mean CNV amplitude calculated between 1 and 1000 ms over lateral electrodes (Fp1, F3, C3, P3, and O1 for the left hemisphere, Fp2, F4, C4, P4, and O2 for the right hemisphere) in order to test if there was any laterality effect.
Reproduction phase. EEG waveforms time-locked to Tap1 were averaged 500 ms preceding the first tap. Integrated amplitudes were then calculated with respect to a −500- to 0-ms temporal windows, respectively. Electrodes F3, Fz, F4, C3, Cz, C4, P3, Pz, and P4 were assigned to assess the differences in scalp distribution for each ERP component during the reproduction, according to the previous ERP studies where the CNV and the BP were used (e.g., Scheibe et al., 2009). A 2 (Sounds: with vs. without) × 2 (Attention: pay attention or ignore) × 2 (Duration: 600 vs. 800 ms) × 3 (Anterior to posterior distinctions: frontal, central, and parietal) × 3 (Laterality: medium-left, mid-sagittal, and medium-right) ANOVA was carried out for each temporal window. EEG waveforms time-locked to Tap2 were averaged in a temporal window extending from −360 to 0 ms for 600 ms, from −480 to 0 ms for 800 ms before the second tap. A 2 (Sounds: with vs. without) × 2 (Attention: pay attention or ignore) × 3 (Anterior to posterior distinctions: frontal, central, and parietal) × 3 (Laterality: medium-left, mid-sagittal, and medium-right) ANOVA was again carried out to confirm the location of the activation for each stimulus duration. These temporal windows were defined as the three-fifths of the total stimulus duration (see Macar et al., 1999).
In order to check the neural correlates of the illusion, it is important that the participants’ behavior and EEG signal corresponded accurately. For the analysis reported for both encoding and reproduction phases, only trials corresponding to the artifact-free behavioral responses were included. We removed the five longest and five shortest reproduced intervals in each block in the behavioral data, and excluded the EEG data corresponding to these trials. Trial extraction corresponding to the behavioral data was processed using MATLAB R2007a (The MathWorks, Inc., Natick, MA, USA). Mean amplitude for each temporal window was calculated with R version 2.5.0. All statistical analyses were performed using SPSS 11.5J. Greenhouse-Geisser correction was included for >1 degrees of freedom. Bonferroni correction for multiple post-hoc comparisons were applied when required. For ANOVA, the  were provided for the quantitative comparison of effect sizes. In multiple comparisons, the Cohen’s d was provided for the effect sizes (the values were calculated by subtracting one mean from the other and dividing it by the pooled SD).
Results
Behavioral Data
The effects of stimulus and attention
Figure 2 shows the mean CE for each experimental condition. There was a significant main effect of Duration, F (1, 11) = 46.67, p < 0.01,  and a marginally significant main effect of Sounds, F (1, 11) = 4.57, p = 0.06,
  CE was more positive in the 600-ms than in the 800-ms condition, and tended to be more positive in the with-sounds than without-sounds condition. There was no main effect of Attention (p < 0.50). The Duration × Sounds interaction effect was significant, F (1, 11) = 16.00, p < 0.01,
  but the Attention × Sounds (p = 0.21) and Attention × Duration (p = 0.55) interaction effects were not. The CE difference between with- and without-sounds conditions was greater in the 800-ms condition (p < 0.001, d = −0.62) than in the 600-ms condition (p = 0.20, d = −0.35). The Duration × Sounds × Attention interaction was significant, F (1, 11) = 6.39, p < 0.03,
  For the 800-ms condition, the CE difference between with- and without-sounds conditions was greater in the Pay attention (p < 0.02, d = −0.70) than in the Ignore (p < 0.01, d = −0.51) condition.
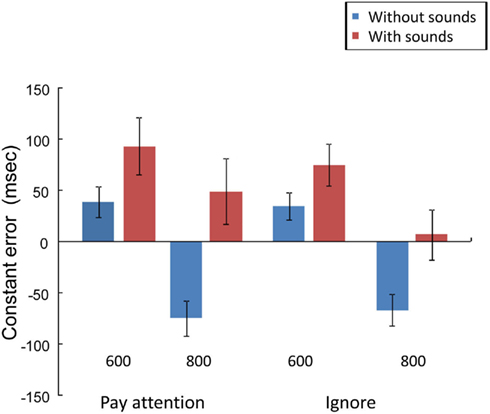
Figure 2. Mean constant error (in ms) in the experimental conditions. Bars are SEs.
The effect of session order
Table 1 shows the mean CE for each stimulus type and each session order and attention conditions. There was a significant main effect for Stimulus type, F (3, 60) = 14.80, p < 0.001,  but there was no effect of Order (p = 0.76) or of Attention (p = 0.73). No significant interaction was found among stimulus type, attention or session order. The session order did not appear to have affected the behavioral results in the experiment.
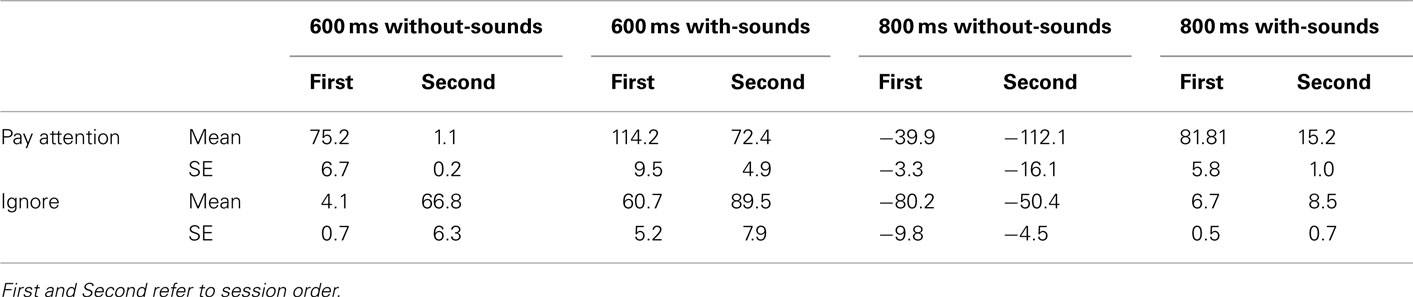
Table 1. Mean CE (in ms with SE) in each experimental condition.
ERP Data
Encoding phase
Time course analyses of CNV. As shown in Figure 3, CNV appeared at Fp1, Fp2, F3, F4, Fpz, and Fz electrodes in both the with- and without-sounds conditions. For both the 600- and 800-ms stimuli, the CNV resolved approximately 200 ms after the second flash, then a P300-like positive deflection followed around 200 ms after the second flash.
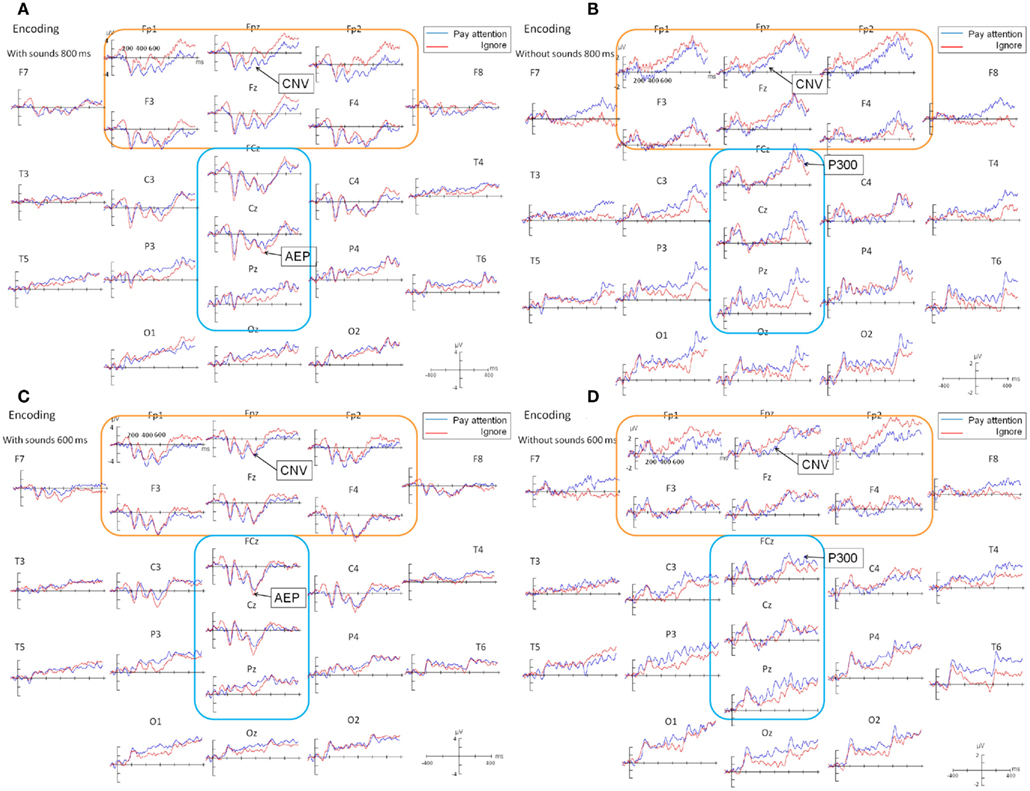
Figure 3. Grand averaged ERP waveforms during the encoding phase of (A) 800 ms condition, with-sounds, (B) 800 ms condition, without-sounds, (C) 600 ms condition, with-sounds, and (D) 600 ms condition, without-sounds. There could be overlap of a few ERP components generated by the events that occurred at closer timing to the P300. For example, the visual P1 component may have appeared 100 ms after the second visual flash in the occipital site, while the CNV have resolved within 200 ms after the second flash around the prefrontal site. Because of these co-occurred components, the P300 may seem to develop on many electrodes.
Figure 4 shows the mean CNV waveforms which were averaged over the six prefrontal electrodes. In the 600-ms condition, there were significant main effects of Sounds, F (1, 11) = 37.13, p < 0.001,  and Temporal Window, F (2.96, 32.5) = 7.74,p < 0.001,
  The effect of Attention was not significant, F (1, 11) = 2.20, p = 0.16,
  The CNV was larger with- than without- sounds (p < 0.001, d = 1.13). Figure 5A shows the result of the multiple comparisons in the 600-ms condition among eight Temporal Windows on the mean CNV amplitude averaged between Pay attention and Ignore conditions. In the 600-ms duration condition, the CNV started to appear at tw3, became maximal at tw5, and resolved quickly after tw7. The Sounds × Temporal Window interaction was significant, F (3.68, 40.45) = 22.6, p < 0.001,
  The mean amplitude differences between with- and without-sounds significantly differed in tw3 (p < 0.002, d = 1.31), tw4 (p < 0.004, d = 0.99), tw5 (p < 0.001, d = 1.34), tw6 (p < 0.001, d = 1.96), tw7 (p < 0.001, d = 1.49), and tw8 (p < 0.001, d = 1.15).
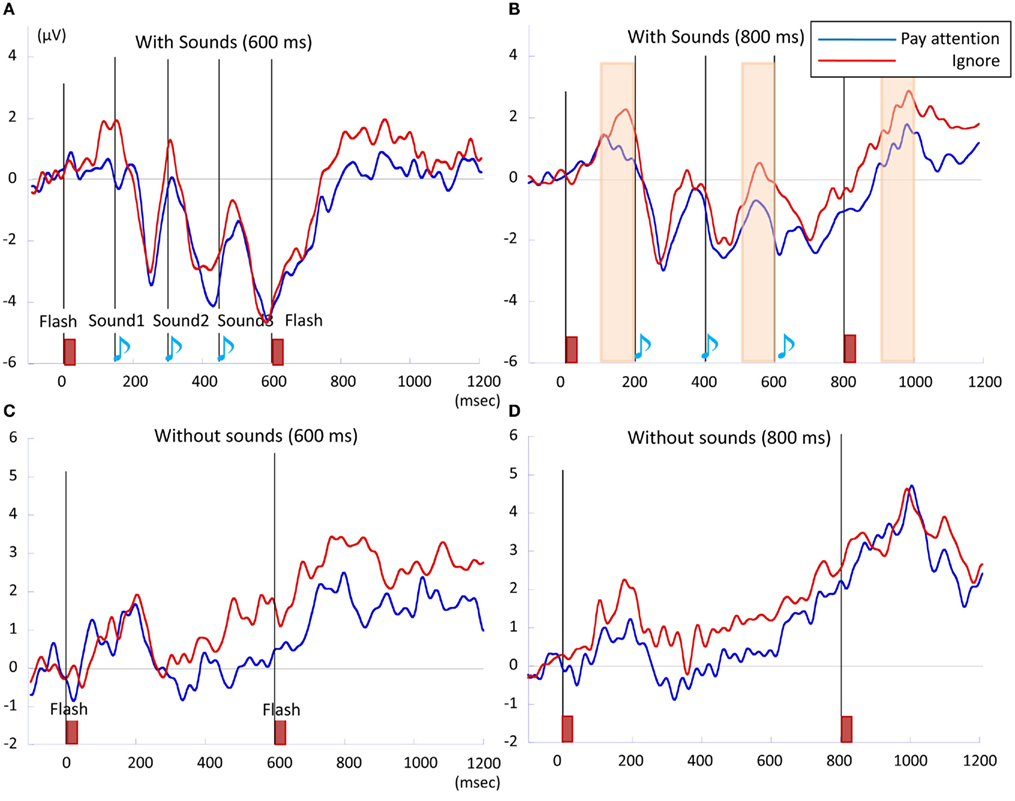
Figure 4. The CNV waveforms of (A) 600 ms with-sounds, (B) 800 ms with-sounds, (C) 600 ms without-sounds, and (D) 800 ms without-sounds condition. The integrated CNV amplitude was calculated over successive temporal windows on the averaged activity of the six prefrontal electrodes (FP1, FP2, F3, F4, Fpz, and Fz). Pay attention condition is in blue, while Ignore condition is in red. Pale orange bars represent the temporal windows where the integrated amplitude in Pay attention condition is larger than in Ignore condition. Each is corresponding to the tw2, tw6, and tw10, respectively.
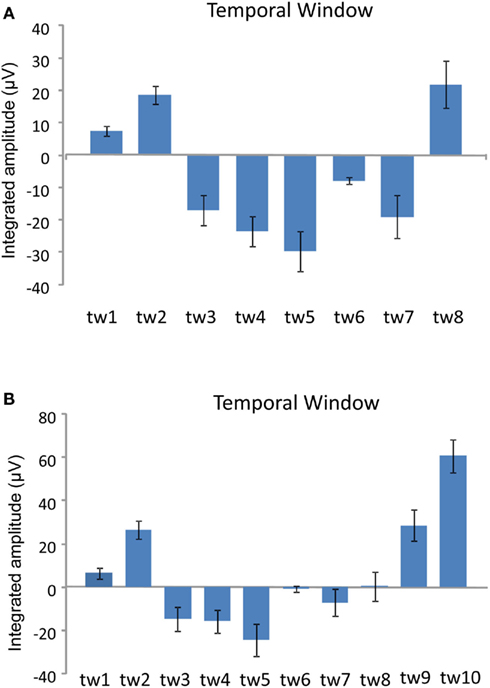
Figure 5. The multiple comparisons among temporal windows on the mean CNV amplitude averaged between Pay attention and Ignore conditions calculated over successive temporal windows (tw) on the averaged activity of the six prefrontal electrodes (FP1, FP2, F3, F4, Fpz, and Fz). (A) 600 ms condition, and (B) 800 ms condition, respectively. The CNV appeared between tw3 and tw7, in the 600-ms condition, tw3 and tw8 in the 800-ms condition, which approximately corresponded to the interval between the first sound and the second flash.
In the 800-ms condition, there were significant main effects of Sounds, F (1, 11) = 25.61 p < 0.001,  and Temporal Window, F (3.02, 33.2) = 12.95,p < 0.001,
  note the marginally significant effect of Attention F (1, 11) = 3.21, p = 0.10,
  The CNV was larger with-than without-sounds (p < 0.001, d = 0.94), and tended to be larger in the Pay attention than in the Ignore condition (p = 0.10, d = −0.38). Figure 5B shows the result of the multiple comparisons in the 800-ms condition among 10 Temporal Windows on the mean CNV amplitude averaged between Pay attention and Ignore conditions. In the 800-ms duration condition, the CNV started to appear at tw3 and continued until tw8. The Sounds × Temporal Window interaction was significant, F (3.11, 34.21) = 15.30, p < 0.001,
  and the Attention × Sounds × Temporal Window interaction was marginally significant, F (2.77, 30.48) = 2.34, p < 0.09,
  The Sounds × Temporal Window interaction indicated that in the tw3 (p < 0.002, d = 1.12), tw4 (p < 0.003, d = 0.69), tw5 (p < 0.001, d = 1.15), tw6 (p < 0.001, d = 0.72), tw7 (p < 0.001, d = 1.24), tw8 (p < 0.001, d = 1.48), tw9 (p < 0.001, d = 1.14), and the tw10 (p < 0.001, d = 0.68), the CNV was larger with-than without-sounds. The marginally significant effect of the Attention × Sounds × Temporal Window interaction revealed that when there were sounds, the amplitude differences between Pay attention condition and Ignore condition tended to be large at tw2 (p < 0.01, d = −0.77), tw6 (p = 0.07, d = −0.70), and tw10 (p = 0.05, d = −0.65).
P300 component. As for P300, activity was mainly observed at Pz, Cz, and FCz electrodes in the without-sounds condition (Figures 3 and 6). Table 2 shows the mean P300 amplitudes and latencies which were averaged over the three parieto-central electrodes. For the P300 amplitude, there were significant main effects of Duration, F (1, 11) = 9.3, p < 0.01,  and Sounds, F (1, 11) = 8.91, p < 0.01,
  but no effect of Attention (p = 0.41). The P300 was larger in the 800-ms than in the 600-ms condition (p < 0.01, d = −0.53), and larger without-than with-sounds condition (p < 0.01, d = −0.40). For the P300 latency, there was a significant main effect of Duration, F (1, 11) = 7.85, p < 0.01,
  The P300 latency was short in the 800-ms (maximally at 184 ms from the offset of the second flash) compared to the 600-ms (maximally at 214 ms from the offset of the second flash) condition (p < 0.01, d = 0.46). The effect of Attention was marginally significant, F (1, 11) = 4.31, p < 0.06,
  The P300 latency tended to be shorter in the Pay attention (186 ms) than in the Ignore (211 ms) condition (p < 0.06, d = −0.37). There was no main effect of Sounds (p = 0.77). No interaction effects were significant for either amplitude or latency.
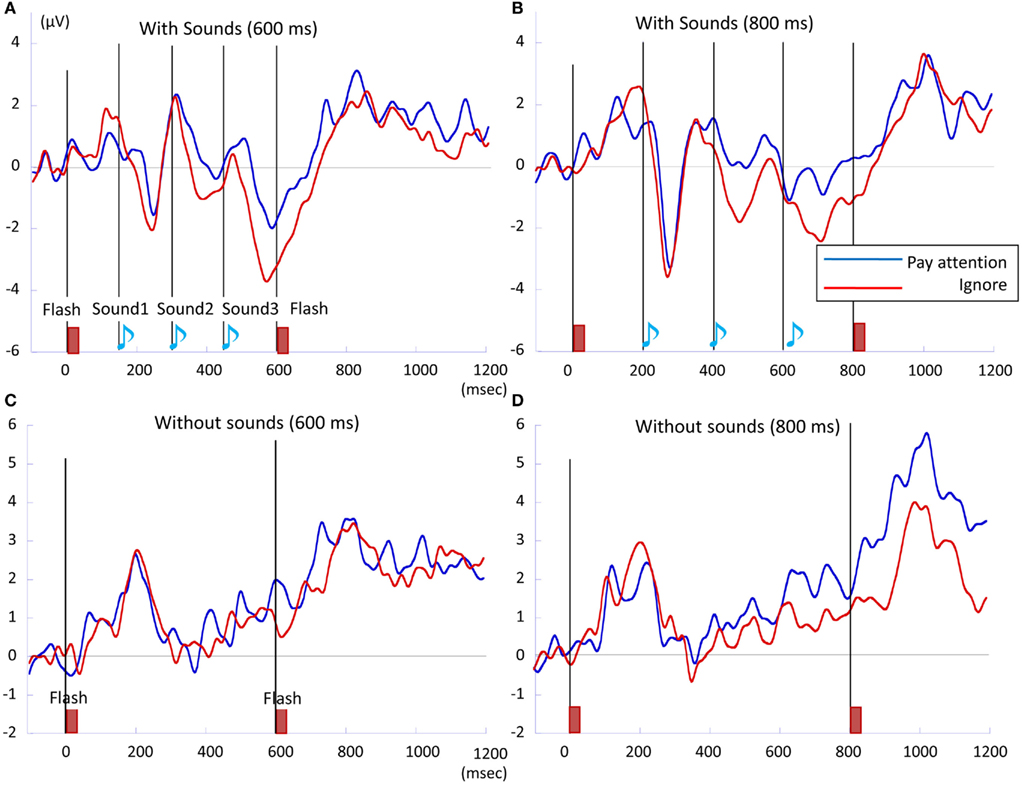
Figure 6. The P300 waveforms of (A) 600 ms with-sounds, (B) 800 ms with-sounds, (C) 600 ms without-sounds, and (D) 800 ms without-sounds condition. The integrated P300 amplitude was calculated over successive temporal windows on the averaged activity of the three parieto-central electrodes (Fz, Cz, and Pz). Pay attention condition is in blue, while Ignore condition is in red. P300 was the largest in 800 ms Without-sounds condition.
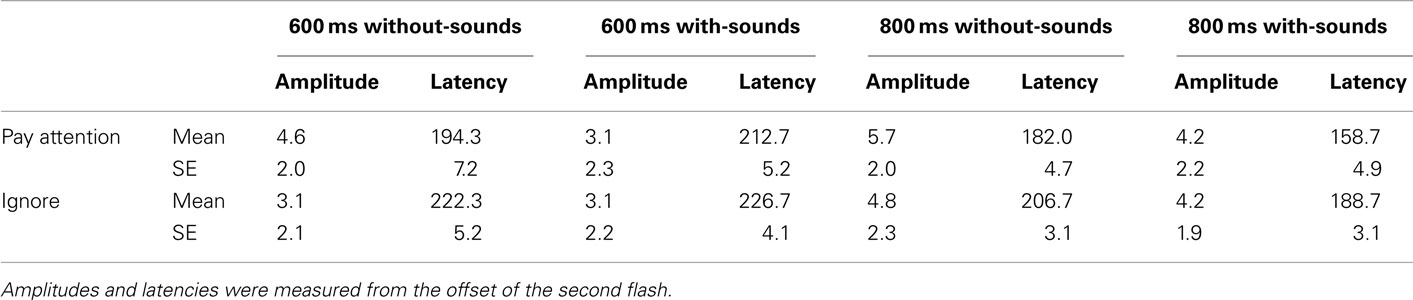
Table 2. Mean amplitudes (μv) and latencies (ms) of P300 in each condition (N = 12).
Laterality effect with the CNV. The ANOVA (2 Duration × 2 Sounds × 2 Attention × 2 Laterality × 5 Electrode) performed on the mean CNV amplitude calculated between 1 and 1000 ms over lateral electrodes revealed a significant effect of Sounds, F (1,11) = 21.03, p < 0.01,  of Electrode, F (2.36, 25.92) = 13.73, p < 0.01,
  and an interaction between these factors, F (2.0, 22.32) = 22.89, p < 0.01,
  The CNV amplitude was larger with-sounds than without-sounds over centro-frontal electrodes. There was no sign of a laterality effect, F (1, 11) < 0.001,p = 0.98,
  and this factor was not involved in any interaction.
Reproduction phase
Tap 1. Figure 7A shows the grand averaged ERP waveforms time-locked to Tap1 in 800 ms condition with-sounds. As shown in the figure, transient positive potential (movement-related cortical potential, MRCP) triggered by the first tap appeared immediately after the button pressing in both Pay attention and Ignore conditions, and Bereitschaftspotential (BP), which was defined by the slow negative shift leading up to voluntary muscle movement, was observed at Cz and C3. A similar tendency was observed in the 800-ms without-sounds condition and in the 600-ms with- and without-sounds conditions. An ANOVA (2 Duration × 2 Sounds × 2 Attention × 3 Anterior to posterior × 3 Laterality) was carried out for −500 to 0 ms temporal windows. The result showed that the Anterior to posterior effect, F (2, 22) = 8.85, p < 0.01,  was only significant (all others, p > 0.30). The central (p < 0.001, d = 0.53) was more negative, and the frontal (p = 0.10, d = 0.40) tended to be more negative than the parietal site.
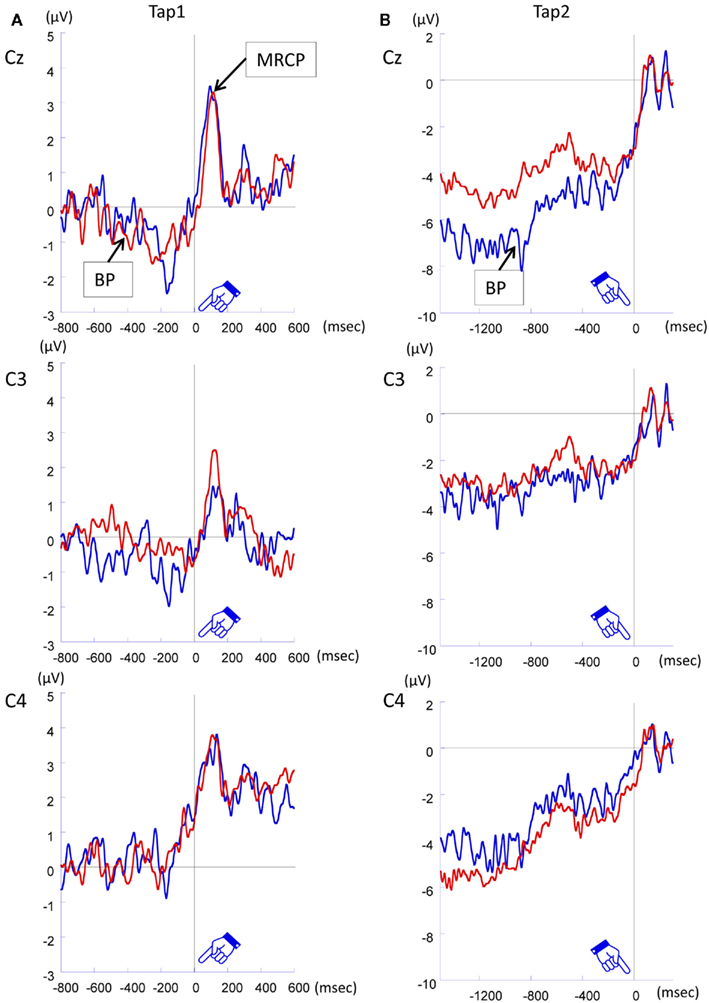
Figure 7. Grand averaged ERP waveforms time-locked to Tap1 (800 ms condition with-sounds) (A), and (B) time-locked to Tap2 (800 ms condition with-sounds).
Tap 2. Figure 7B shows the grand averaged ERP waveforms time-locked to Tap2 in 800 ms condition with-sounds. As shown in the figure, large BP was observed before Tap2 at Cz. The similar tendency was observed in the 800-ms without-sounds condition and in the 600-ms with- and without-sounds conditions. An ANOVA (2 Sounds × 2 Attention × 3 Anterior to posterior × 3 Laterality) was carried out in a temporal window of −360 to 0 ms and −480 to 0 ms in each of 600 and 800 ms stimulus duration, respectively. For the 600-ms condition, the effects of Anterior to posterior, F (1.59, 17.44) = 7.622, p < 0.006,  and Laterality, F (1.32, 14.49) = 7.32, p < 0.01,
  were significant (all the others, p > 0.10). The central was more negative than the frontal site (p < 0.01, d = −0.44). The activity at the mid-sagittal site was more positive than the one at medium-left (p < 0.01, d = 0.38). The Anterior to posterior × Laterality interactions were significant, F (4, 44) = 5.42, p < 0.01,
  At frontal site, the averaged amplitude was larger at mid-sagittal than at medium-right (p < 0.01, d = −0.76). Moreover, in the 600-ms condition at central site, the averaged amplitude at the mid-sagittal site was larger than the one at medium-left (p < 0.003, d = 0.62) and medium-right (p < 0.001, d = 0.70). For 800 ms condition, the effects of Anterior to posterior, F (1.98, 21.74) = 7.72, p < 0.003,
  and Laterality, F (1.49, 16.37) = 3.30, p < 0.05,
  were significant (all the others, p > 0.10). The central was more negative than the frontal site (p < 0.005, d = 0.53). The activity at the mid-sagittal site was more positive than the one at medium-left (p < 0.008, d = 0.33).
Discussion
The present study investigated how the EEG activity changed when the participants were engaged in a temporal reproduction task associated with the “filled-duration illusion”. As indicated by the behavioral data, the “filled-duration illusion” occurred in our study: Filled (with-sounds) intervals were perceived as longer than empty (without-sounds) intervals of equal physical duration (Grondin et al., 1998b). The illusion was affected by attention: The magnitude of the illusion was greater in the Pay attention condition of the 800-ms duration. In the encoding phase, the prefrontal CNV augmented during the stimulus presentation, corresponding to the perceived duration of the stimuli. The parietal P300 was maximal and its latency was shortened in the without-sounds condition especially in the 800-ms condition. Both the CNV and the P300 were modulated by attention, i.e., whether the participant ignored the sounds or used them for keeping track of time. The results suggested that the CNV is related to the perceived duration, while the P300 is related to orienting attention to the stimuli. Analyses of the reproduction phase revealed that the BPs were observed maximally at the central site when participants reproduced the memorized intervals by finger tapping. The BPs were associated with the voluntary movement and motor preparation.
Timing Performance with vs. without Additional Sounds
The presence of the sounds affected the reproduced intervals, which were longer with the sounds. The occurrence of additional sounds during an interval increased the perceived duration of that interval. Stimulus duration also affected the illusion. The magnitude of the “filled-duration illusion” was larger in the 800-ms condition. Finally, the effect of attention appeared in the 800-ms condition. The magnitude of the illusion was larger in the 800-ms Pay attention condition than in the 800-ms Ignore condition. The filled-duration effect was modulated by an active use of the additional auditory signals. In our experiment, at 600 ms in the with-sound conditions, the participants overestimated the interval between the two flashes, whereas at 800 ms without-sounds condition, participants underestimated the interval. This finding is consistent with the Vierordt’s law which states that “short” time intervals tend to be overestimated, and “long” time intervals tend to be underestimated (Lejeune and Wearden, 2009).
ERPs during the Encoding Phase
Contingent negative variation
The CNV, which was obtained from the prefrontal electrodes, became larger during stimulus presentation (Figures 3 and 4). The averaged CNV amplitude was larger in the with-sounds condition than in the without-sounds condition. The CNV time course suggested that the participants utilized the sound information to keep track of time. The effects of temporal window showed that in the 600-ms condition, the CNV appeared between tw3 and tw7, while in the 800-ms condition, the CNV appeared between tw3 and tw8. These temporal windows corresponded to the interval between the first sound and 200 ms after the second flash (Figure 5). This result is consistent with previous studies where the CNV amplitude changed accordingly with the length of the memorized intervals (Macar et al., 1999; Pfeuty et al., 2003a,b). The Attention × Sounds × Temporal Window interaction in the 800-ms condition showed that the attention enhanced the CNV amplitude within temporal windows preceding the sounds by 100 ms. When participants were instructed to attend to the sounds, they actively expected the timing of the occurrence of the sounds, which increased the CNV amplitude toward the first and the third sounds (in tw2 and tw6).
There was no effect of laterality on the CNV. The same tendency was observed in previous studies (Ruchkin et al., 1997; Pfeuty et al., 2003b, 2008). These studies showed that when participants had to retain a series of auditory stimuli in working memory, a bilateral frontal slow negativity developed during the task. They proposed that this bilateral frontal slow negativity reflects the automatic storage of the auditory information. In line with their proposal, the increase in the CNV amplitude may reflect the automatic storage of the successive sounds in working memory, which might be one possibility for the lack of laterality effect in the current study.
One may argue that there was a possible influence of auditory-evoked potentials (AEP) on the frontal CNV activity. Because AEP is a Cz-maximum response, it is natural that the activity was spread to the frontal site. The auditory signal might simply make the CNV apparently larger in the with-sounds condition than in the without-sounds condition. As Pfeuty et al. (2008) discussed, the EEG activity observed in the filled (with-sounds) condition corresponds to the superimposition of timing-dependent activity and the sensory activity. Therefore, the auditory signal itself could contribute to the augmentation of the CNV. However, the CNV activity was also observed obviously in the empty (without-sounds) condition (see Figures 3 and 4). Even though there was an influence of the sounds on the development of the CNV, it is evident that the CNV develops depending on the memorization of the intervals. With regard to the mechanism of the occurrence of the filled-duration illusion, it is hypothesized that continuous or intermittent auditory input during an interval accelerates an internal pacemaker that emits pulses that are transmitted to an accumulator that measures interval duration in terms of pulse counts (Gibbon et al., 1984; Penney et al., 2000). We speculate that in the with-sounds condition, the brain processed the intermittent sound information in addition to the flash information, which resulted in the development of the greater CNV and in the longer reproduced intervals with-sounds than without-sounds.
P300 component
In the current study, we observed a slow positivity over parieto-central scalp sites that reached its maximum amplitude at approximately between 160 and 220 ms after the second flash (Figure 6; Table 2). We called this positivity P300. The maximum amplitude of the P300 was larger in the 800-ms condition than in the 600-ms condition. The P300 latency was shorter in the 800-ms than in the 600-ms condition. The sounds also affected the P300. The P300 was larger in the without-sounds condition than in the with-sounds condition. There was a marginal effect of attention. The P300 latency tended to be shorter in the attended than in the ignore condition. Overall, it was shown that the P300 was more prominent under the conditions in which the CE was more negative; the CE was more negative in the 800-ms than in the 600-ms condition, and tended to be more negative in the without-sounds than in the with-sounds condition. According to the literature, the P300 is evoked by infrequent, unpredictable stimulus shifts, regardless of whether the participants focused on the stimulus itself (Squires et al., 1975). Perhaps in those conditions, the participants anticipated durations longer than the physical durations, which caused the perception of the occurrence of the second flash at unexpectedly shorter timing, and resulted in prominent P300. It would be associated with the monitoring and accumulation of the temporal information, because during the encoding phase, the participants had to monitor the presentation of the second flash in order to memorize and reproduce the stimulus duration.
Since there were only two stimulus durations, the participants could recognize whether the stimulus duration was the longer or the shorter at the time point where the second flash would appear in the 600-ms condition. If the second flash appeared at 600 ms, the participants could notice that the stimulus was the shorter. If the second flash did not appear at that time point, they could notice that the stimulus presented in that trial would be the longer duration. In other words, the participants had to monitor the passage of time with full attention under uncertainty up to 600 ms after the first flash, while they could monitor the passage of time with less attention beyond 600 ms after the first flash. The accumulation beyond 600 ms after the first flash might have become careless and less accurate. Then, the encoded (memorized) time intervals might have been shortened, which may have caused the underestimation of the interval in the 800-ms condition.
ERP during the reproduction phase
When ERP was time-locked to Tap1, the BP was observed approximately 500 ms before the Tap1 in the central site. A previous report showed prominent BP activation in the central site when the ERP amplitudes were analyzed time-locked to the first trigger press (Macar et al., 1999). The similar tendency was observed in the current study. The BP before Tap1 appeared maximally at Cz electrodes. The location of its activation was in accord with the previous study reporting that the BP was often found maximal at the central, and also over the parietal areas (Deecke and Kornhuber, 1978). The left-dominant BPs suggest that the BPs triggered by Tap1 were related to motor preparation. The BP preceding the key pressing before Tap2 was also sensitive to the voluntary movement. In both 600 and 800 ms conditions, the BP was maximal at the mid-central site. Overall, the BP before Tap1 and Tap 2 did not have clear relationship with the memorized intervals; it is safe to conclude that the BPs in our study reflect motor preparation, rather than temporal processing in the SMA at present.
Neural Correlates for the Filled-Duration Illusion
The present study revealed that several brain regions are conjointly associated with the occurrence of the “filled-duration illusion”. We showed the EEG activity both in the encoding and in the reproduction period, which enabled us to investigate the whole process required in temporal processing. The P300 and the CNV appeared during the encoding period, while the BP appeared during the reproduction period. During the encoding phase, the CNV developed depending on the perceived duration. This is in accordance with previous ERP studies adopting temporal judgment tasks, where the CNV amplitudes were larger when time was subjectively estimated as longer (Pfeuty et al., 2003b; Gontier et al., 2007, 2009; Le Dantec et al., 2007). In addition, the CNV was modulated by attention. The effect of attention appeared especially when the participants expected the upcoming sounds. These results corresponded to the behavioral performance. The CNV may reflect the accumulation of the perceived duration. The frontal cortex, especially the dorsolateral prefrontal cortex, is considered to be a probable generator of the CNV (Rao et al., 2001; Pouthas, 2003; Macar and Vidal, 2004). The P300, a neural signature of directing attention, appeared at the parieto-central site. The amplitude of the P300 was enhanced and its latency was shortened depending on the occurrence of the second flash at an unexpected timing in the 800-ms condition. These results might be associated with the underestimation of the reproduced intervals. The source of the P300 is assumed to be the parietal cortex (Friedman et al., 2001; Horn et al., 2003). The occurrence and modulation of the P300 is in accord with the evidence that the parietal cortex was related to directing attention and accumulation of temporal information (Alexander et al., 2005; Bueti et al., 2008). In addition, the BP, which is reported to be derived from the SMA, was observed in relation to the participants’ finger tapping. The location of the BP activation suggested that the SMA activates in accord with the voluntary movement associated with experimental task.
We assumed that the CNV and the P300, together with BP, could be functionally connected with each other to process temporal information. However, it is also possible that there is an aspect of topographical overlap of the two components: the more negative the CNV, the further away the ERP is from zero, thus the less positive the P300. Both components have strong projections to the centro-parietal scalp, which may make the superficial covariation between the P300 and the CNV. We should take these facts into account for the interpretation of our results of these ERP components.
According to the information-processing version of the scalar expectancy theory of time perception, temporal judgments are based on the contribution of three distinct psychological processes: an internal clock accumulating units of time, a memory process, and a decision comparator (Gibbon et al., 1997, see Grondin, 2001, 2005). Our results could be explained in line with this theory. The encoding period contained attention and memory processes. The current results formed a simple representation of the “filled-duration illusion” in terms of these processing stages of time perception, as reflected in the reported EEG signatures.
Conclusion
We used EEG measures to determine how timing occurs in the context where additional signals are delivered. The CNV, which appeared as a signature of perceiving time, occurred during the encoding phase. The CNV is suggested to be generated from the prefrontal brain site. The presence of additional sensory signals interfered with the timing period. It corresponds to the superimposition of the timing-dependent activity (CNV) and the sensory activity (AEP). The P300, which was obtained from the parieto-central electrodes, correlated with the orienting of attention to the stimuli. Moreover, we observed the BP during the reproduction phase, the BP being actually related to the voluntary movement and motor preparation. The CNV and P300 reflect the cerebral bases for the filled-duration illusion electrophysiologically, which would represent the role of the accumulation and memory on temporal processing of sub-second intervals.
Conflict of Interest Statement
The authors declare that the research was conducted in the absence of any commercial or financial relationships that could be construed as a potential conflict of interest.
Author Note
This research was made possible by a research grant awarded to Simon Grondin by the Natural Sciences and Engineering Council of Canada (NSERC), and a Summer Scholarship from NSERC to Caroline Gagnon. The publication of this article also received support from Time In MEntaL activitY (TIMELY). We would like to express our gratitude to Nicolas Bisson, Félix Desautels, Mylène Ross-Plourde, Flore Morneau-Sévigny, Larissa Roy, Emi Hasuo, and to Pierre-Emmanuel Michon from the Consortium d’imagerie en neurosciences et santé mentale de Québec (CINQ), who provided precious help at various stages of the project. This study was presented at the 17th Annual Meeting of the Organization for Human Brain Mapping held in June in Québec City. Correspondence should be addressed to Simon Grondin, École de psychologie, 2325 rue des Bibliothèques, Université Laval, Québec, QC, Canada G1V 0A6. E-mail:c2ltb24uZ3JvbmRpbkBwc3kudWxhdmFsLmNh
References
Adams, R. D. (1977). Intervening stimulus effects on category judgments of duration. Percept. Psychophys. 21, 527–534.
Alexander, I., Cowey, A., and Walsh, V. (2005). The right parietal cortex and time perception: back to Critchley and the Zeitraffer phenomenon. Cogn. Neuropsychol. 22, 306–315.
Brown, S. W. (2008). “Time and attention: review of the literature,” in Psychology of Time, ed. S. Grondin (Bingley: Emerald Publisher), 111–138.
Bueti, D., Bahrami, B., and Walsh, V. (2008). Sensory and associative cortex in time perception. J. Cogn. Neurosci. 20, 1054–1062.
Buffardi, L. (1971). Factors affecting the filled-duration illusion in the auditory, tactual, and visual modalities. Percept. Psychophys. 10, 292–294.
Deecke, L., and Kornhuber, H. H. (1978). An electrical sign of participation of the mesial ‘supplementary’ motor cortex in human voluntary finger movement. Brain Res. 159, 473–476.
Friedman, D., Cycowicz, Y. M., and Gaeta, H. (2001). The novelty P3: an event-related brain potential (ERP) sign of the brain’s evaluation of novelty. Neurosci. Biobehav. Rev. 25, 355–373.
Gamache, P.-L., Bisson, N., Hawke, L., Roussel, M.-È., and Grondin, S. (2008). “Exploration of the filled-time illusion with an interval production task,” in Fechner Day 2008: Proceedings of the 24th Annual Meeting of the International Society for Psychophysics, eds B. Schneider, B. M. Ben-David, S. Parker, and W. Wong (Toronto: The ISP), 77–82.
Gibbon, J., Church, R. M., and Meck, W. (1984). Scalar timing in memory. Ann. N. Y. Acad. Sci. 423, 52–77.
Gibbon, J., Malapani, C., Dale, C. L., and Gallistel, C. (1997). Toward a neurobiology of temporal cognition: advances and challenges. Curr. Opin. Neurobiol. 7, 170–184.
Gontier, E., Le Dantec, C., Leleu, A., Paul, I., Charvin, H., Bernard, C., Lalonde, R., and Rebaï, M. (2007). Frontal and parietal ERPs associated with duration discriminations with or without task interference. Brain Res. 1170, 79–89.
Gontier, E., Le Dantec, C., Paul, I., Bernard, C., Lalonde, R., and Rebaï, M. (2008). A prefrontal ERP involved in decision making during visual duration and size discrimination tasks. Int. J. Neurosci. 118, 149–162.
Gontier, E., Paul, I., Le Dantec, C., Pouthas, V., Jean-Marie, G., Bernard, C., Lalonde, R., and Rebaï, M. (2009). ERPs in anterior and posterior regions associated with duration and size discriminations. Neuropsychology 23, 668–678.
Grondin, S. (1992). Production of time intervals from segmented and nonsegmented inputs. Percept. Psychophys. 52, 345–350.
Grondin, S. (1993). Duration discrimination of empty and filled intervals marked by auditory and visual signals. Percept. Psychophys. 54, 383–394.
Grondin, S. (2001). From physical time to the first and second moments of psychological time. Psychol. Bull. 127, 22–44.
Grondin, S. (2003). “Sensory modalities and temporal processing,” in Time and Mind II, ed. H. Helfrich (Gottingen: Hogrefe and Huber), 75–92.
Grondin, S. (2005). Overloading temporal memory. J. Exp. Psychol. Hum. Percept. Perform. 31, 869–879.
Grondin, S. (2010). Unequal Weber fractions for the categorization of brief temporal intervals. Atten. Percept. Psychophys. 72, 1422–1430.
Grondin, S., Guay, I., Lapointe, M., and Poulin, J. (1998a). “The effect of segmented inputs on the production of short-time intervals,” in Fechner Day 98: Proceedings of the 14th Annual Meeting of the International Society for Psychophysics, eds S. Grondin and Y. Lacouture (Québec: The ISP), 231–236.
Grondin, S., Meilleur-Wells, G., Ouellette, C., and Macar, F. (1998b). Sensory effects on judgments of short-time intervals. Psychol. Res. 61, 261–268.
Grondin, S., Meilleur-Wells, G., and Lachance, R. (1999). When to start explicit counting in a time-intervals discrimination task: a critical point in the timing process of humans. J. Exp. Psychol. Hum. Percept. Perform. 25, 993–1004.
Grondin, S., Ouellet, B., and Roussel, M.-E. (2004). Benefits and limits of explicit counting for discriminating temporal intervals. Can. J. Exp. Psychol. 58, 1–12.
Horn, H., Syed, N., Lanfermann, H., Maurer, K., and Dierks, T. (2003). Cerebral networks linked to the event-related potential P300. Eur. Arch. Psychiatry Clin. Neurosci. 253, 154–159.
Le Dantec, C., Gontier, E., Paul, I., Charvin, H., Bernard, C., Lalonde, R., and Rebaï, M. (2007). ERPs associated with visual duration discriminations in prefrontal and parietal cortex. Acta Psychol. (Amst.) 125, 85–98.
Lejeune, H., and Wearden, J. H. (2009). Vierordt’s the experimental study of the time sense (1868) and its legacy. Eur. J. Cogn. Psychol. 21, 941–960.
Linden, D. E. (2005). The p300: where in the brain is it produced and what does it tell us? Neuroscientist 11, 563–576.
Macar, F., and Vidal, F. (2003). The CNV peak: an index of decision making and temporal memory. Psychophysiology 40, 950–954.
Macar, F., and Vidal, F. (2004). Event-related potentials as indices of time processing: a review. J. Psychophysiol. 18, 89–104.
Macar, F., Vidal, F., and Casini, L. (1999). The supplementary motor area in motor and sensory timing: evidence from slow brain potential changes. Exp. Brain Res. 125, 271–280.
Mitsudo, T., Nakajima, Y., Remijn, G. B., Takeichi, H., Goto, Y., and Tobimatsu, S. (2009). Electrophysiological evidence of auditory temporal perception related to the assimilation between neighboring two time intervals. NeuroQuantology 7, 114–127.
Montfort, V., and Pouthas, V. (2003). Effects of working memory demands on frontal slow waves in time-interval reproduction tasks in humans. Neurosci. Lett. 343, 195–199.
Penney, T. B., Gibbon, J., and Meck, W. H. (2000). Differential effects of auditory and visual signals on clock speed and temporal memory. J. Exp. Psychol. Hum. Percept. Perform. 26, 1770–1787.
Pfeuty, M., Ragot, R., and Pouthas, V. (2003a). Processes involved in tempo perception: a CNV analysis. Psychophysiology 40, 69–76.
Pfeuty, M., Ragot, R., and Pouthas, V. (2003b). When time is up: CNV time course differentiates the roles of the hemispheres in the discrimination of short tone durations. Exp. Brain Res. 151, 372–379.
Pfeuty, M., Ragot, R., and Pouthas, V. (2008). Brain activity during interval timing depends on sensory structure. Brain Res. 1024, 112–117.
Picton, T. W. (1992). The P300 wave of the human event-related potential. J. Clin. Neurophysiol. 9, 456–479.
Pouthas, V. (2003). “Electrophysiological evidence for specific processing of temporal information in humans,” in Functional and Neural Mechanisms of Interval Timing, ed. W.H. Meck (Boca Raton, FL: CRC Press), 439–456.
Pouthas, V., Garnero, L., Ferrandez, A. M., and Renault, B. (2000). ERPs and PET analysis of time perception: spatial and temporal brain mapping during visual discrimination tasks. Hum. Brain Mapp. 10, 49–60.
Rao, S. M., Mayer, A. R., and Harrington, D. L. (2001). The evolution of brain activation during temporal processing. Nat. Neurosci. 4, 317–323.
Rubia, K., and Smith, A. (2004). The neural correlates of cognitive time management: a review. Acta Neurobiol. Exp. (Wars) 64, 329–340.
Ruchkin, D. S., Berndt, R. S., Johnson, R. Jr., Ritter, W., Grafman, J., and Canoune, H. L. (1997). Modality-specific processing streams in verbal working memory: evidence from spatio-temporal patterns of brain activity. Brain Res. Cogn. Brain Res. 6, 95–113.
Scheibe, C., Schubert, R., Sommer, W., and Heekeren, H. R. (2009). Electrophysiological evidence for the effect of prior probability on response preparation. Psychophysiology 46, 758–770.
Squires, N. K., Squires, C. S., and Hillyard, S. A. (1975). Two varieties of long-latency positive waves evoked by unpredictable auditory stimuli in man. Electroencephalogr. Clin. Neurophysiol. 38, 387–401.
ten Hoopen, G., Miyauchi, R., and Nakajima, Y. (2008). “Time-based illusions in the auditory mode,” in Psychology of Time, ed. S. Grondin (Bingley: Emerald Publisher), 139–187.
Thomas, E. A. C., and Brown, I. (1974). Time perception and the filled duration illusion. Percept. Psychophys. 16, 449–458.
Walter, W. G., Cooper, R., Aldridge, V. J., McCallum, W. C., and Winter, A. L. (1964). Contingent negative variation: an electric sign of sensori-motor association and expectancy in the human brain. Nature 203, 380–384.
Keywords: EEG, filled-duration illusion, CNV, P300, BP, encoding, reproduction
Citation: Mitsudo T, Gagnon C, Takeichi H and Grondin S (2012) An electroencephalographic investigation of the filled-duration illusion. Front. Integr. Neurosci. 5:84. doi: 10.3389/fnint.2011.00084
Received: 27 May 2011;
Paper pending published: 26 June 2011;
Accepted: 30 November 2011;
Published online: 02 January 2012.
Edited by:
Warren H. Meck, Duke University, USAReviewed by:
Matthew S. Matell, Villanova University, USATrevor B. Penney, National University of Singapore, Singapore
Copyright: © 2012 Mitsudo, Gagnon, Takeichi and Grondin. This is an open-access article distributed under the terms of the Creative Commons Attribution Non Commercial License, which permits non-commercial use, distribution, and reproduction in other forums, provided the original authors and source are credited.
*Correspondence: Simon Grondin, École de psychologie, Université Laval, 2325 rue des Bibliothèques, Québec, QC, Canada G1V 0A6. e-mail:c2ltb24uZ3JvbmRpbkBwc3kudWxhdmFsLmNh