


- 1 Department of Neurobiology, Bielefeld University, Bielefeld, North Rhine-Westphalia, Germany
- 2 Centre of Excellence ‘Cognitive Interaction Technology’, Bielefeld, North Rhine-Westphalia, Germany
- 3 Department of Cellular Neurobiology, Johann-Friedrich-Blumenbach Institute for Zoology and Anthropology, Georg-August-University Göttingen, Göttingen, Lower Saxony, Germany
Hoverflies and blowflies have distinctly different flight styles. Yet, both species have been shown to structure their flight behavior in a way that facilitates extraction of 3D information from the image flow on the retina (optic flow). Neuronal candidates to analyze the optic flow are the tangential cells in the third optical ganglion – the lobula complex. These neurons are directionally selective and integrate the optic flow over large parts of the visual field. Homolog tangential cells in hoverflies and blowflies have a similar morphology. Because blowflies and hoverflies have similar neuronal layout but distinctly different flight behaviors, they are an ideal substrate to pinpoint potential neuronal adaptations to the different flight styles. In this article we describe the relationship between locomotion behavior and motion vision on three different levels: (1) We compare the different flight styles based on the categorization of flight behavior into prototypical movements. (2) We measure the species-specific dynamics of the optic flow under naturalistic flight conditions. We found the translational optic flow of both species to be very different. (3) We describe possible adaptations of a homolog motion-sensitive neuron. We stimulate this cell in blowflies (Calliphora) and hoverflies (Eristalis) with naturalistic optic flow generated by both species during free flight. The characterized hoverfly tangential cell responds faster to transient changes in the optic flow than its blowfly homolog. It is discussed whether and how the different dynamical response properties aid optic flow analysis.
Introduction
Flies perform complex aerobatic maneuvers with a brain composed of less than a million neurons. These maneuvers are thought to be under visual control. Given the extreme speed of many flight maneuvers, the neural processing of the retinal image shifts (optic flow) has to be performed at a timescale of a few milliseconds. Not only does the nervous system seem to be adapted to the specific demands of fly locomotion, but also their manner of flying seems to be tailored to facilitate motion information processing (Egelhaaf et al., 2009).
Two of the most basic tasks during flight are flight stabilization and collision avoidance. Flight stabilization might be under multimodal control, employing information from the visual sensory systems (Stange, 1981) as well as mechanosensory input, for instance from the antennae (Mamiya et al., 2011) and the halteres (Nalbach, 1993; Dickinson, 1999). In contrast, collision avoidance is mostly discussed in the context of vision (Tammero and Dickinson, 2002a). Our study concentrates on the latter and compares the very different flight styles of two fly species, Calliphora vicina (blowfly) and Eristalis tenax (hoverfly). Furthermore we analyze the consequences of these differences for the neural representation of optic flow in the visual system. Although both animals segregate their flight trajectories into short fast rotations, called saccades, they differ much with respect to translational motion between these saccades (Schilstra and van Hateren, 1999; van Hateren and Schilstra, 1999; Braun et al., 2010; Geurten et al., 2010). This flight style has been interpreted, despite the differences in the translational sections, to facilitate the acquisition of spatial information (Land, 1999; Schilstra and van Hateren, 1999; Boeddeker et al., 2005; Kern et al., 2006; Braun et al., 2010; Geurten et al., 2010).
To be able to analyze the differences in flight style of the two species, we reduced the complexity of flight trajectories by categorizing the behavior into prototypical movements (PMs; Egelhaaf et al., 2009; Braun et al., 2010; Geurten et al., 2010). The trajectory can then be conceived as a series of PMs, instead of a continuous sequence of positions, orientations, and velocities of the fly. This kind of description is especially useful if the responses of a neuron to optic flow evoked by particular PMs are to be investigated.
The set of nine Eristalis PMs can be divided into three subgroups (Figure 1A; Geurten et al., 2010). The first subgroup contains saccadic PMs, covering fast yaw rotations (PMs 1 and 2, see numbers in Figure 1A). The second subgroup consists of forward–sideways movements (PMs 3 and 4). The third subgroup contains all other movements, for example upward movements (PM 5), backward movement (PM 6), or hovering (PM 9). The set of Calliphora’s PMs (see Figure 1B) differs from that of Eristalis in many respects, but contains nine PMs as well (Braun et al., 2010). Four rotational PMs (PMs 1–4) correspond to saccades. Four forward–sideways movements (PMs 5–8) form the second subgroup. The last PM is directed purely forward (PM 9). All Calliphora PMs contain a strong translational forward component, which is absent in several Eristalis PMs (PMs 2, 5, and 9). Backward PMs occur only in Eristalis (PM 6). In any case, although both flies have in common that their PMs can be segregated into rotational and translational ones, their translational PMs differ much.
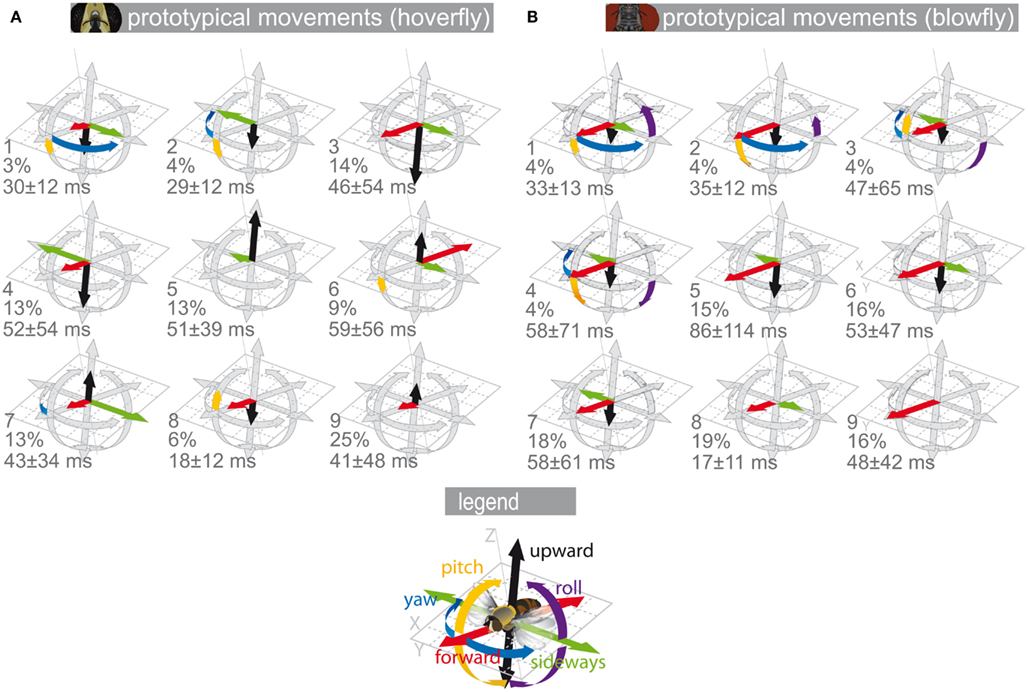
Figure 1. Prototypical movements. Prototypical movements (PMs) of blowflies and hoverflies in confined arenas. Each translational velocity (forward, upward, sideways) is normalized to the absolute maximum of all translational velocities. The rotational velocities (yaw, pitch, roll) were normalized accordingly. The velocities are plotted as length of the arrows around a position. The gray arrows show the normalized maximum velocity. The colored arrows show the velocity combination for that PM (for color code see inset). The PMs are numbered. Below the PM number are its percentage in the data and its mean duration ± SD. (A) Eristalis PMs derived from body trajectories omitting roll velocities, which we could not track for a larger dataset (see Materials and Methods). (B) Calliphora PMs derived from head trajectories (Braun et al., 2010).
Eristalis and Calliphora are believed to have homolog visual systems, which include a number of similar cell types and only few differences (Buschbeck and Strausfeld, 1996, 1997; O’Carroll et al., 1997; Harris et al., 1999; Strausfeld, 2009). Approximately 50 tangential cells reside in their third optic ganglion called the lobula complex. These cells react to movement in large parts of the visual field (Nordström et al., 2008; Egelhaaf et al., 2009; Borst et al., 2011). In this study we concentrate on the ventral centrifugal horizontal (vCH) cell (Hausen, 1976; Eckert and Dvorak, 1983). It integrates the signals of several identified motion-sensitive neurons. Thereby it reflects the properties of many tangential cells, of both brain hemispheres. Thus the vCH cell might be particularly useful to assess potential species-specific differences in motion vision.
In Calliphora the vCH cell has already been analyzed in particular detail (Hausen, 1976; Eckert and Dvorak, 1983; Egelhaaf et al., 1993; Warzecha et al., 1993). Its preferred motion direction is back-to-front in the contralateral hemisphere and front-to-back in the hemisphere of the visual field ipsilateral to its main arborization (Krapp et al., 2001). The vCH cell gets its ipsilateral input from two members of the horizontal system (HS), HSE and HSS (Farrow et al., 2003, 2006). The contralateral input is provided by the H1, H2, V1-neuron, and the element U (Haag and Borst, 2001, 2003; Spalthoff et al., 2010). The vCH cell has been shown to provide inhibitory input to the figure detection cell 1 (FD1) and is responsible for its sensitivity to object motion (Egelhaaf et al., 1993; Warzecha et al., 1993). The vCH neuron is thought to suppress activation of the FD1-cell during preferred direction saccades (van Hateren et al., 2005; Hennig et al., 2011).
In this study we address the following two questions: (1) In which way are the differences in the flight styles of Eristalis and Calliphora reflected in their optic flow? (2) Are there any characteristic differences between the responses of vCH cells in both species that indicate adaptations in the motion vision pathway to process species-specific optic flow?
Materials and Methods
All calculations presented in this article were done with MATLAB R2008b (The MathWorks Inc., Natick, MA, USA).
Animals and Trajectory Data
The behavioral data on Eristalis tenax were collected in a previous study (Geurten et al., 2010). The trajectory data were obtained with a pair of high-speed cameras running at 500 fps with a resolution of 1024 × 1024 pixels and analyzed as described in detail in Geurten et al. (2010). For electrophysiological experiments, we collected Eristalis pupae from cow dung. This method was developed by Prof. Dr. K. Lunau (University of Düsseldorf). Calliphora vicina and Eristalis tenax were bread 25°C in 12:12 light–dark cycle in the lab stock.
The trajectory data of Calliphora were obtained from C. Schilstra and J. H. van Hateren (Schilstra and van Hateren, 1999; van Hateren and Schilstra, 1999). Calliphora semi-free flight behavior was recorded in a 40 cm × 40 cm × 40 cm arena surrounded by a Helmholtz coil. Head orientation was recorded via small magnetic coils positioned on the fly’s head (for details see Schilstra and van Hateren, 1998).
Clustering Analysis
Clustering algorithms find density clouds in high dimensional data spaces. We used the translational and rotational velocities corresponding to subsequent recorded video frames (Eristalis) or trajectory positions (Calliphora) as the data on which our algorithms operated. In our case this was a 5D data space for Eristalis with the following velocities: forward, sideways, upward, yaw, and pitch. In the case of Calliphora it was a 6D data space including roll-velocity as well. The k-means algorithm (MacQueen, 1967), which was employed for the final segregation of the data, searches for accumulations of data points that lie closely together (“group”). When all groups were found by clustering we derived the center of each group, which we called the PM (for more detail see Braun et al., 2010; Geurten et al., 2010). Finally, every frame of a given trajectory was assigned to one of the PMs.
Please note that the PMs shown in Figure 1 are from two different data sources. The Calliphora PMs are based on head trajectories, while the Eristalis PMs are based on body trajectories. We were not able to obtain a large enough data-base to cluster Eristalis head trajectories, because these trajectories had to be acquired manually from the video data (see Geurten et al., 2010 for more details). We tested thoroughly, if the important but subtle differences between head and body trajectories have an influence on the resulting PMs of the clustering (data not shown). Because clustering is a rather coarse classification and thus cannot pick up the subtle differences between head and body movements, the resulting PMs are very similar.
Optic Flow Analysis
For the optic flow analysis we used head trajectories for Calliphora and Eristalis. Eristalis head trajectories were calculated from position and orientation data obtained by manual video analysis. The video material was a subset of the footage used during clustering analysis (see Geurten et al., 2010). The optic flow analysis is based on the calculation of the distances between fly and flight arena for every viewing direction (“sampling points”) and the corresponding change in the position of the fly along the trajectory (Koenderink and Doorn, 1987). For this, we used custom software written at our department. We rebuilt the flight arenas’ walls in virtual reality and set a sample point matrix at the position and in the orientation of the fly’s head. The sample point matrix consists of 36 sample point positions in azimuth times the 12 sample point positions in elevation, covering a field of view from −60° to 60° in elevation and the complete azimuth. The sample points were evenly spaced. For all sample points, we calculated the intersection between a line drawn from the fly’s head through the respective sample point and a wall of the flight arena. The calculations were done for all entries of a given trajectory. By comparing the intersection positions of each sample point through time we calculated the time course of image shifts on the retina. This calculation is independent of contrast, illumination and texture of the walls. An optic flow field was calculated for every single location along a given trajectory. This was done for all trajectories. Since every trajectory entry had been assigned to a given PM (see above), the prototype-specific optic flow was calculated as the mean of all optic flow fields corresponding to the respective PM. Note that in case of Eristalis PM assignment, in contrast to prototype-specific optic flow calculation, was based on body data.
Electrophysiology/morphology
We used two different preparations for the two species.
Eristalis was dissected according to Nordström et al. (2008). The head was opened above the lobula plate and tracheal tissue was removed. In contrast to Nordström et al. (2008) the head orientation was aligned with the stimulus setup using the deep pseudopupil. Without any Ringer solution or removal of the neuronal sheath, the target tissue was approached with aluminum silicate (AlSi) electrodes. The electrodes were pulled in a two-step heating program on a P-97 Sutter Instruments Puller. When filled with 1 M KCl recording electrodes had a typical tip resistance of 85 MΩ. The reference electrode was placed in the contralateral head hemisphere. For morphological identification we filled the electrode tips with 15 mM Oregon Green 4888 (BAPTA)-1 hexapotassium salt (Molecular Probes, OR, USA) in 1.7 mM KOH/33 mM (4-(2-hydroxyethyl)-1-piperazineethanesulfonic) acid/3.3 mM KCL. The dye was iontophoretically injected (0.5–1 nA) for 5–30 min. During dye injection no electrophysiological experiments were done. Dye-filled neurons were visualized with a fluorescence microscope in the living animal without further histological processing. We assembled a depth projection which was then copied by hand into a vector graphic.
Calliphora was dissected differently. The animal was fixed with wax ventral side up to a glass holder and its head tilted forward in order to give access to the head capsule’s back plate. The legs and antennae were removed and the amputation holes closed with beeswax. The proboscis was immobilized with wax. In this case we used a Ringer solution, as described in Kurtz et al. (2006). We used borosilicate electrodes, pulled on a P1000 Sutter Instruments puller. These electrodes had a typical tip resistance of 35 MΩ when filled 1 M KCl.
For both species the pre-amplified signal was fed into a custom-designed amplifier (TK 88, Max-Planck-Institute for Biological Cybernetics, Tübingen, Germany). The signal was low pass filtered with a cut-off frequency of 2.4 kHz and then sampled at 8.192 kHz by a DT3001 I/O-card (Data Translation, Marlboro, MA, USA). A thermometer recorded the temperature next to the animal for each single trial. The data was stored via the MATLAB data acquisition toolbox (The MathWorks Inc., Natick, MA, USA) for offline data analysis.
Stimulation
As stimulus device we used an updated version of the high-speed panoramic LED stimulus device FliMax described in Lindemann et al. (2003). The FliMax2 has the same icosahedric shape as its precursor model, covering more than 200° in azimuth and more than 150° in elevation. It’s 7168 ultra bright LEDs (WU-14-752GC, 525 nm, 5 mm diameter, Vossloh-Wustlich Opto, Kamp-Lintfort, Germany; ∼12,000 cd·m−2 maximum brightness) are arranged in rhomboids containing 32 × 32 LEDs each. All LEDs are bent to the center of the icosahedron, which results in a spatial resolution of 2.3°. The number of brightness steps was increased in comparison to the FliMax1 (eight steps) to 256. Presentation rate of FliMax2 is 354 fps, i.e., sufficiently high to account for the temporal resolution of the fly’s visual system.
The data presented in this article was recorded with four different stimuli. Each stimulus trial starts with a contrast ramp bringing each LED from 50% intensity to the first pixel value of the first stimulus image. After the stimulus trial again a contrast ramp fades the pixels from the last stimuli image to 50% intensity (500 ms duration). This is done to avoid transient on- and offset response. Between stimuli trials the LEDs were left at 50% intensity for at least 7 s.
Spinning drum
We used a spinning drum stimulus that showed a vertical sinusoidal stripe pattern (wavelength 20°) moving horizontally at 2 Hz temporal frequency. Movement direction switched from clockwise to counter clockwise and back again every 1080 ms. In azimuth, the spinning drum extended from −120° to 120°. In the vertical, the pattern ranged from −74° to 70°.
Naturalistic stimuli based on blowfly and hoverfly trajectories
To generate motion stimuli as encountered during flight we reconstructed the view of the fly cruising through its arena. For Calliphora and Eristalis we used head trajectories. We took three sample trajectories flown by three different flies of each species. From these samples, we reconstructed the view during each trajectory position. These movies were then played back repeatedly to the experimental animals. Note that the Eristalis movies could not be reconstructed with all walls intact, because in the experimental setup we had to use an acrylic glass wall and ceiling to look into the arena (Geurten et al., 2010). These walls are white in the reconstruction. The vCH cell, analyzed in the present study, has a receptive field mostly in the ventral half of the visual hemisphere and, therefore, is stimulated by these “undefined” dorsal walls only marginally. Furthermore, we chose trajectories in which the animal infrequently looked at the transparent walls.
Analysis of Electrophysiological Data
The vCH neuron responds with a change in its graded membrane potential to stimuli. In all cases we subtracted the resting potential from the vCH response. The responses of each cell were averaged over repetitive presentations of the same stimulus. Then the mean and standard deviation (SD) of the responses across cells were calculated.
For calculation of PM-triggered response averages we used the change of PMs or the occurrence of a PM as a trigger for the analysis. First, every data point in the trajectories was assigned to a PM. Next, we defined a time window of 50 ms symmetrically around transitions between certain PMs. Finally, we calculated the triggered response averages within the time window. In a similar way, we calculated the saccade-triggered averages in a time window of 200 ms located symmetrically around the peak velocity of each saccade.
Results
Flight Styles and Their Impact on Optic Flow
In Figure 2 we describe how we collected data and categorized the resulting measurements. We used the PMs to reduce the complexity of naturalistic time-dependent flight patterns. In this way, we reduced the trajectories’ complexity originally given by their time-dependent rotational and translational velocity values to a series of just nine states, i.e., the PMs. The PMs are plotted in Figure 1 to allow for easy comparison and are discussed in detail in Braun et al. (2010) and Geurten et al. (2010).
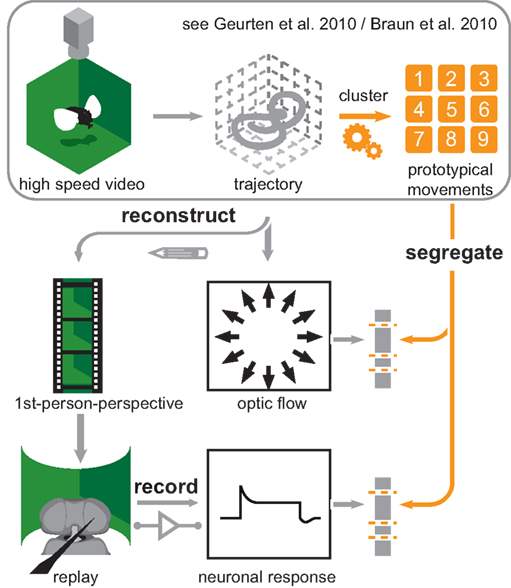
Figure 2. Experimental overview. Overview of the experimental procedures used to obtain the data presented in this article. We recorded Eristalis tenax with a set of high-speed cameras (upper left corner) to obtain 3D trajectories of their flights (first row, middle). In case of Calliphora vicina Dr. van Hateren (University of Groningen, Netherlands) provided us with 3D head trajectories. We used these trajectories as data for clustering analysis that rendered nine prototypical movements (PMs; upper right corner). The first row is enclosed by a frame, which indicates that these results were already published. We used these PMs as categories and each position in the trajectories is assigned to a PM. Bearing this in mind, we reconstructed the optic flow seen while moving on a given trajectory (central picture). Now we could use the nine PMs to segregate the optic flow we calculated directly from head trajectories (second row, right). Hence we were able to calculate the optic flow from all the positions that were assigned to the same PM. Furthermore we reconstructed first person perspective movies (second row, left) from the same trajectories. We used these movies as stimuli for electrophysiological experiments (third row left). The neuronal responses from these experiments (third row, middle) could be again segregated with the PMs (third row, right).
The different flight styles of hoverflies and blowflies manifest themselves in partly large differences of the optic flow evoked by the different PMs (Figure 3). These PM-triggered flow fields were obtained by the following procedure: The optic flow for all positions and trajectories was acquired by using the Koenderink algorithm (Koenderink, 1986). The Koenderink algorithm uses the 3D structure of the world and calculates geometrically the optic flow vectors. We projected these vectors onto a cylindrical coordinate system, as can be seen in Figure 3. We then used the PM assignment for each trajectory position to calculate the mean optic flow over all flow fields elicited by one PM (see Figure 3).
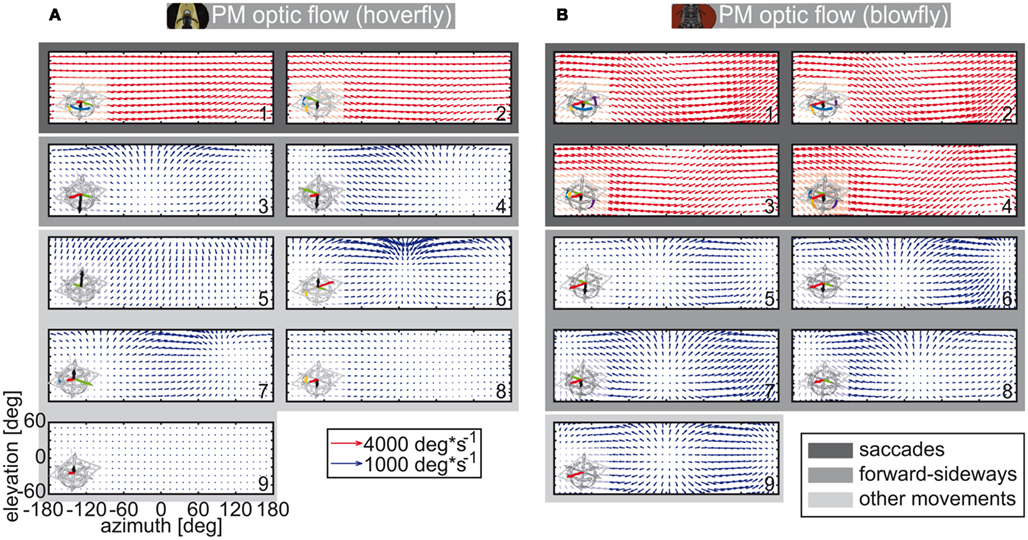
Figure 3. Mean optic flow induced by prototypical movements. Optic flow calculated geometrical from head trajectories of both species. The red arrows are scaled differently than the blue ones (they code for four times the velocity of the blue arrows). A field of view of 120° elevation is depicted. The mean optic flow for each prototypical movement was calculated (numeration as in Figure 1). In the lower left corner of each flow field the corresponding PM is shown. (A) Eristalis optic flow calculated with head trajectories and segregated after body PMs. (B) Calliphora optic flow calculated from head trajectories and segregated after head PMs.
The saccadic PMs lead to the strongest optic flow (see Figure 3, dark shading). Optic flow vectors evoked by the saccadic PMs are pointing uniformly against the direction of rotation. The saccadic optic flow is quite similar for both species, which is due to the fact that both animals show similar fast rotations of short duration. Likewise, there is also translational optic flow which is similar for Eristalis and Calliphora. These similar flow fields (Figure 3, intermediate shading) belong to combined forward and sideways movements (Eristalis PMs 3 and 4 | Calliphora PMs 5–8). Not all flow fields attributed to translational PMs of Eristalis and Calliphora are similar though (Figure 3, light shading). Rather, they may differ strongly from each other. For further information, e.g., the focus of expansion, see Appendix.
Characterization of a Homologous Visual Interneuron – vCH
To assess whether these different PM-driven inputs are reflected by the properties of neurons that are sensitive to optic flow, we focused on the vCH neuron from which we recorded repeatedly in both animals (Calliphora N = 8; Eristalis N = 8). Evidence that the presumed vCH cell of Eristalis is homolog to its Calliphora counterpart is based on the cell’s receptive field properties and preferred direction of motion (see Figure A2 in Appendix) as well as its anatomy. Since the anatomy of vCH of Eristalis was not known before, we dye-injected it as well as other tangential cells with Oregon green (see Materials and Methods for details). We used a dorso-ventral projection of the fill to draw a reconstruction of the cell’s main arborizations (see Figure 4). The main arborization of the Eristalis vCH does branch in a similar fashion to that of Calliphora (Hausen, 1993), and its position relative to the HS-cells, another type of identified tangential cells (Hausen, 1982a,b), is similar.
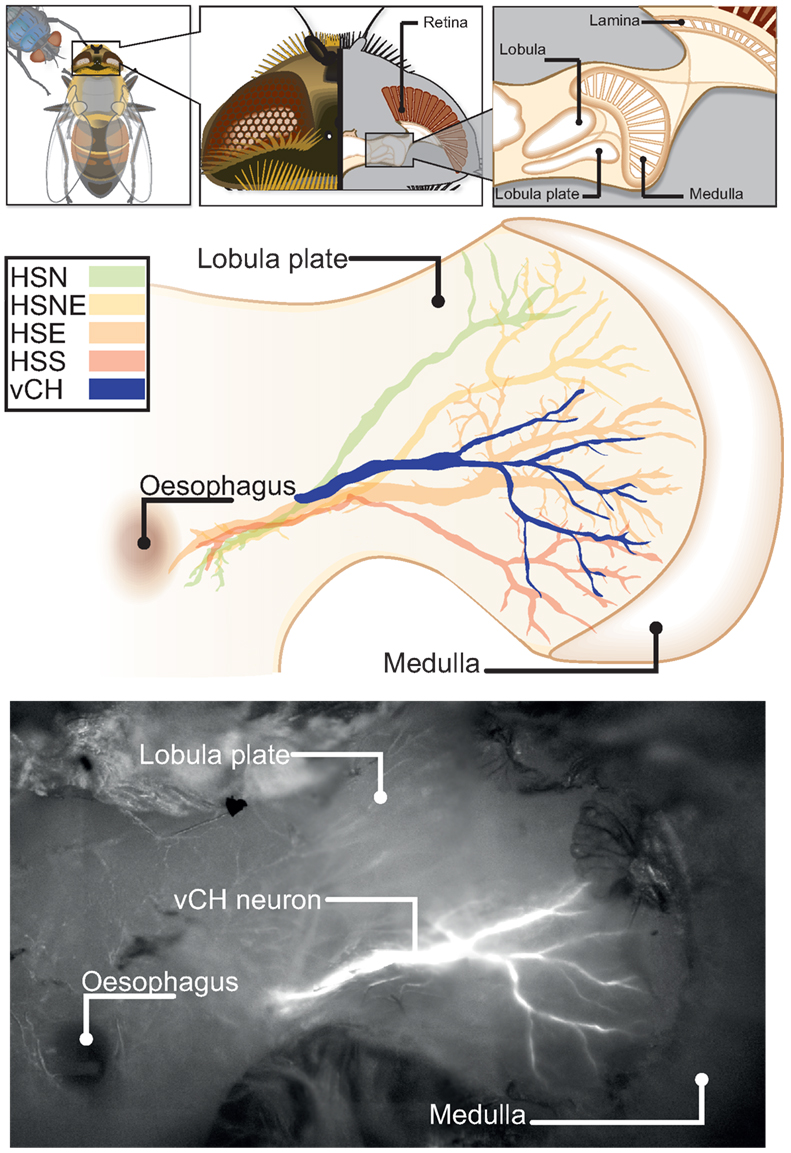
Figure 4. Morphology of the Eristalis ventral centrifugal horizontal (vCH) neuron in relation to the four HS-cells. The top row insets show the location of the lobula plate inside the hoverfly’s head. The ventral–dorsal projection of the lobula plate with superimposed tangential cells is drawn below. The reconstructions of depth projections (z-projections) of the cells’ main arborizations were copied by hand into vector graphics. The horizontal system (green, yellow, orange, red) was plotted to give relative position of the vCH (blue). In the bottom row a z-projection of the vCH cell is superimposed on a wide-field image of the fly’s brain.
In a preceding study Eristalis tangential cells were shown to be more sensitive to slower temporal frequencies under steady-state conditions than blowfly tangential cells (O’Carroll et al., 1996). Therefore and because of the differences in flight dynamics between blowflies and hoverflies we asked whether vCH cells in both species are differently tuned to motion transients. To assess the cells’ dynamical response properties, they were exposed to instantaneous velocity changes. We presented a spinning drum covered with a stripe-pattern, which drives the cell to very large graded membrane potential changes. The pattern moved horizontally at a temporal frequency of 2 Hz, instantaneously switching direction after 1080 ms. Although both species’ vCH cells (Calliphora N = 5, n = 3–7 | Eristalis N = 8, n = 2–10) signals are similar with respect to amplitude and shape (see Figure 5), they differ in the timing. The Eristalis vCH responds faster to the direction change than does the Calliphora vCH. For a change from preferred to anti-preferred direction, the time shift between the responses of the two species – determined at half-maximal response – is 6.8 ms, and for the opposite directional change the time shift is 4.3 ms. Our further analysis concentrates on the properties of this difference.
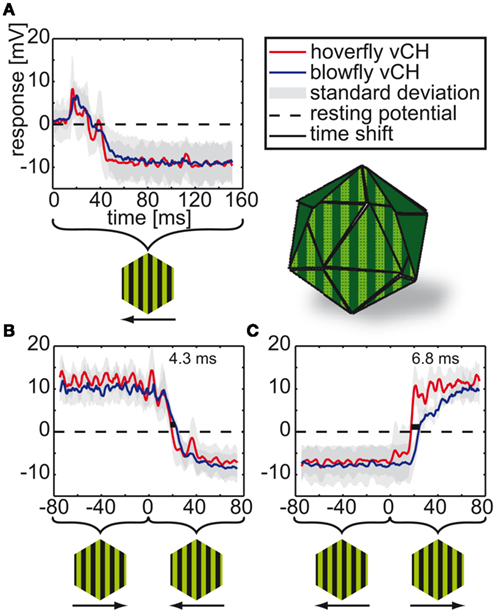
Figure 5. vCH responses to instantaneous velocity changes during spinning drum stimulation. The vCH cells of blowflies and hoverflies were stimulated with a sinusoidal vertical stripe pattern moving in horizontal direction at 2 Hz temporal frequency for 1080 ms in each direction. Onset to null-direction motion (A) and to direction changes of either polarity (B,C). Resting potential is marked by the dashed black line. The blue line denotes the Calliphora responses (N = 5, n = 3–7) and the red line the Eristalis responses (N = 8, n = 2–10). The gray areas around the lines mark the standard deviations. Light green horizontal lines correspond to time shifts (green numbers) between responses at half-maximal response. The stimulus apparatus is depicted next to the figure legend. Below the time axis the movement direction of the stripe pattern is given.
To ensure that these large time shifts are not artifacts of the data analysis, we conducted several controls. Since response latencies have been found to be temperature sensitive (Tatler et al., 2000; Warzecha and Egelhaaf, 2000; Egelhaaf et al., 2001), we controlled the temperature in all experiments. The mean temperature during the Eristalis experiments was 29.7 ± 1.8°C, the mean temperature during all Calliphora experiments was 28.9 ± 1.8°C. In all tests, only one Calliphora vCH was faster than the three slowest Eristalis vCH cells. All other Calliphora vCH were slower than any of the eight Eristalis cells. We only used female freshly emerged flies (1–3 days old) to ensure that the time shift was not biased by gender or age differences.
Comparison of Responses Elicited by Naturalistic Stimulation
We reconstructed the image sequences seen by both fly species during real flight trajectories and analyzed the responses of each vCH (see Figure 6) cell to the image sequences induced by the flight of its own and the other species (Calliphora N = 5, n = 3–23 | Eristalis N = 8, n = 3–11). The complete response to a 3.5-s flight sequence (see Figure 6) is extremely complex because of the many factors that influence the visual input perceived by the animal. The responses of vCH cells are influenced by the motion of the fly, the distance to the walls and the apparent texture of the walls, as well as the history of stimulation. This makes deciphering which of the parameters elicited which component of the cellular response a very complex task. The PMs aid our analysis by reducing this complexity, as they did when we analyzed differences in the overall optic flow experienced by the two species as a consequence of their different flight styles.
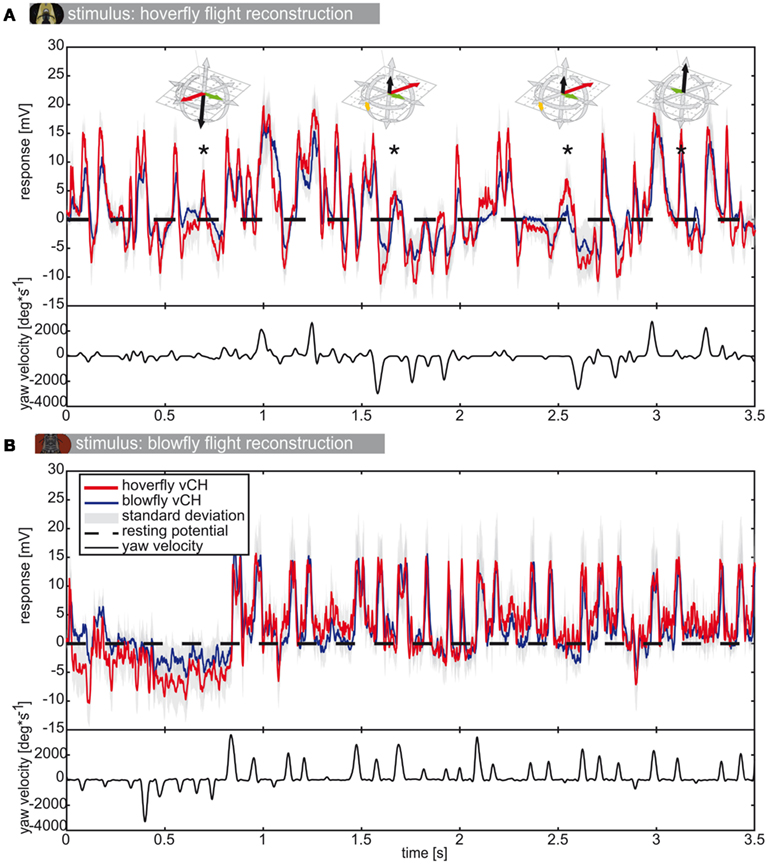
Figure 6. vCH responses to flight reconstructions. (A) Mean response (±SD) of Eristalis (red) and Calliphora (blue) vCH cells, respectively, to the reconstruction of the optic flow experienced during an Eristalis flight. Dashed black line marks the resting potential. vCH responds best to horizontal motion. Therefore, the corresponding yaw velocity trace is plotted below the responses in black. In A strong depolarizations not accompanying fast yaw velocities were marked with an asterisk. The prototype assigned to the trajectory at each such instance is plotted above. (B) The responses of the same neurons to a Calliphora flight. Eristalis vCH N = 8, n = 3–11 | Calliphora vCH N = 5, n = 3–23.
As is known from previous studies, the vCH cell of blowflies reacts to yaw saccades with strong depolarizations and hyperpolarizations, depending on the turning direction (van Hateren et al., 2005). When stimulated with the optic flow generated by Calliphora flights (Figure 6B) the saccadic turns and the peak depolarizations of the membrane potential are strongly correlated with the vCH cell responses of both species. Note that response amplitude is not linearly related to saccade peak velocity. This can be observed in Figure 8B for the saccades between 1.75 and 2.5 s. Saccades in this part of the stimulus have very different peak velocities, but the vCH cells respond with similar depolarization levels. In intersaccadic intervals that are dominated by translations, the vCH cells are much less activated. The cells from both fly species respond differently to the optic flow generated during Eristalis flights (Figure 6A). Here, not all depolarizing response peaks correlate with yaw saccades but instead correlate with translational PMs, for example the depolarizations marked with an asterisk in Figure 6A. Hence, the response profiles of vCH cells in Calliphora and Eristalis seem to mainly depend on the characteristics of the flight used for stimulus reconstruction. The translational movements of Eristalis (in our arena) are slower than those of Calliphora, which leads to a different stimulation history.
The average responses of Calliphora and Eristalis vCH cells (Calliphora N = 5, n = 3–23 | Eristalis N = 8, n = 3–11) triggered by yaw saccades are shifted in time with respect to each other (Figure 7). Again, we calculated the time shift at half-maximal response. The Eristalis vCH is always faster than its blowfly counterpart. The time shift between responses of both species’ vCH amounts to 12 ms for blowfly preferred-direction saccades (Calliphora; Figure 7B) and to ∼10 ms for hoverfly preferred-direction saccades (Eristalis, Figure 7A). For the anti-preferred direction, the values seem to differ considerably but cannot be quantified, because the responses have no distinct peaks, which are necessary to accurately assess time-shifts.
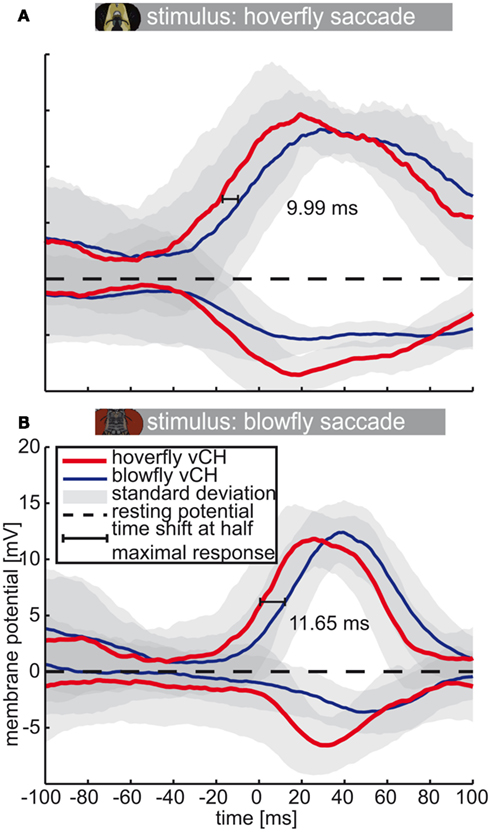
Figure 7. Saccade-triggered vCH response. Mean response (±SD) of Eristalis and Calliphora vCH cells, respectively, in a 200-ms time window centered about the peak velocity of yaw saccades (0 ms). Eristalis response (N = 8, n = 3–11) is plotted in red and the Calliphora response (N = 5, n = 3–23) is plotted in blue. Light green numbers and line denote the time shift between mean responses at half-maximal response. Resting potential is marked by the dashed black line. (A) Eristalis, (B) Calliphora saccades.
Hoverflies and blowflies do not only change rotational velocities rather abruptly, but also translational ones, for example during zig-zagging. In this case forward flight is superimposed by alternating sideways components (Schilstra and van Hateren, 1999; van Hateren and Schilstra, 1999; Geurten et al., 2010). Components of the zig-zagging can also be found in the PMs of both species (see Figure 1, blowfly: PMs 5–8, hoverfly: PMs 3 and 4). Therefore we analyzed the responses of blowfly and hoverfly vCH cells (Calliphora N = 5, n = 3–23 | Eristalis N = 8, n = 3–11) to transitions from forward-left PMs to forward-right PMs and vice versa (Figure 8). The translational direction changes lead to smaller changes in optic flow than do saccades. The corresponding time shifts in the neural responses (Figure 8) are also smaller than those corresponding to saccades (Figure 7).
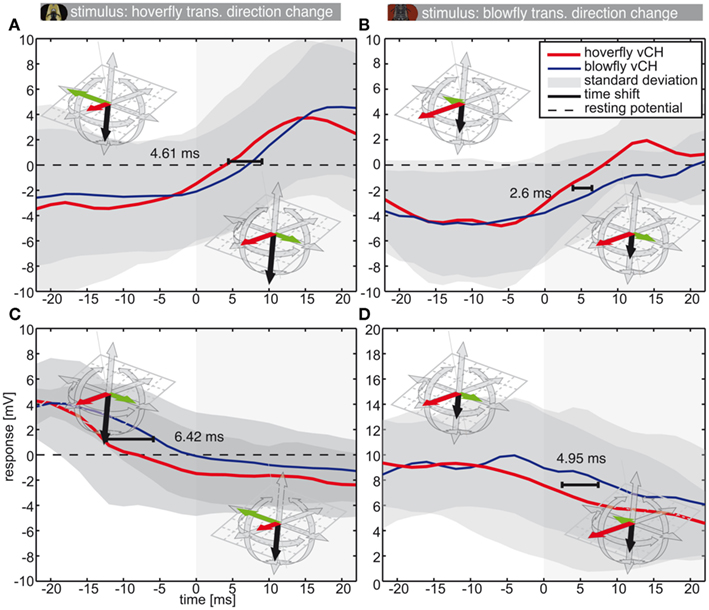
Figure 8. Responses to sideways direction inversion during forward flight. This figure shows the vCH responses to translational direction changes. The color code is as in Figure 5 (Eristalis vCH n = 8 | Calliphora vCH n = 5). Plots show mean responses (±SD) of Eristalis and Calliphora vCH cells, respectively, in a 44-ms time window centered about the movement direction switch from forward-right to forward-left (A,B) or vice versa(C,D) (see insets). At 0 ms the direction switches. Responses in (A,C) were elicited by Eristalis flights. The stimuli in (B,D) were from Calliphora. The time shift denotes the time difference between reaching the half-maximal response in Eristalis and Calliphora vCH, respectively. Resting potential is marked by the dashed black line. Note the differently scaled y-axis in (D).
We hypothesized that the values of time shift depend on the transience of change in the optic flow. Although the fastest change in optic flow is elicited by the instantaneous direction reversal in the spinning drum experiment (Figure 9, left column, and Figure 5), it does not produce the largest time shift. The second fastest change as evoked by saccades led to the largest time shifts (Figures 7 and 9). Eristalis yaw saccades in our setup have a mean peak at ∼1000°·s−1 and have a slightly broader shape than their Calliphora counterparts (∼2000°·s−1; Schilstra and van Hateren, 1999; van Hateren and Schilstra, 1999; Geurten et al., 2010). Hence, the change in the corresponding optic flow is less transient in Eristalis than in Calliphora. This difference in optic flow dynamics might be reflected in the somewhat larger response time shift duration for blowfly than hoverfly saccades. We stress here that the gradual change in the magnitude of the time shift duration is not merely due to the amplitude of the cell’s membrane potential change. In all three situations (spinning drum, Calliphora saccade, Eristalis saccade) the cell membrane potentials peak in the saturation region of the cells’ response range. The smallest time shifts were observed for the side-to-side PM combinations (Figure 8). Again, within this subgroup of stimuli, the stimulus corresponding to the largest sideways component (the largest change in optic flow) elicits the largest time shift.
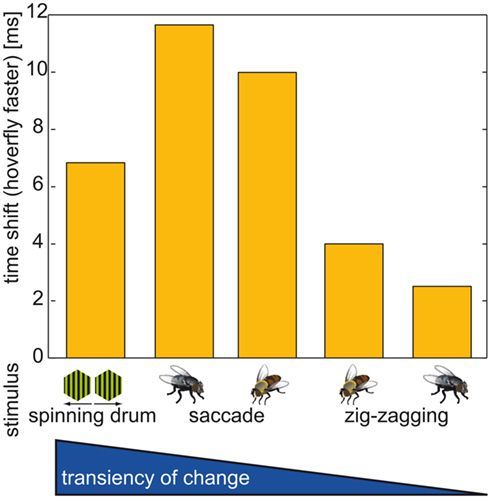
Figure 9. Time shift overview. Time shift between the responses of Calliphora and Eristalis. In all cases Eristalis vCH reacted faster to the change in optic flow as determined by the time difference between reaching the half-maximal response. Below each bar the stimulus is depicted that corresponds to the time shift. Stimuli always built from changes to preferred direction motion. Time shifts corresponding to the following stimuli (from left to right): (1) Instantaneous direction inversion in a spinning drum experiment; (2) Calliphora saccade; (3) Eristalis saccade; (4) Switch from a forward-right to a forward-left movement in Eristalis; (5) Switch from a forward-right to a forward-left movement in Calliphora; Note that the sideways component preceding the switch is much smaller in Calliphora than in Eristalis, therefore the change in optic flow is larger in (4) than in (5).
In summary, Eristalis vCH cells respond the faster to optic flow, the more transient the change in optic flow is. This holds true for naturalistic situations, but not for the instantaneous direction reversal.
Discussion
In this study we analyzed how the different flight styles of two fly species, Eristalis tenax (hoverflies) and Calliphora vicina (blowflies) affect the optic flow the animals perceive during flight. Furthermore we analyzed the dynamics of the corresponding neural responses of an identified motion-sensitive neuron, the vCH cell. This cell integrates complex binocular optic flow information. The optic flow perceived by Eristalis varies more than the flow perceived by the blowfly. We recorded and compared the responses of a visual interneuron to image sequences experienced by both fly species during free flight to assess potential adaptations to each specific flight style. We found the neural responses to temporal changes in optic flow to be faster in hoverflies than in blowflies, with the time shift between the responses of both fly species depending on the transience of changes in the optic flow pattern.
For our analysis we used reconstructions of what flies saw during free flights in confined arenas. The hoverfly flight arena has obvious limitations. On the one hand, the size of the arena does not allow for high velocity flights and thereby only allows us to observe a part of the animals’ flight repertoires. On the other hand, in many circumstances the flies also fly in confined areas in nature. The relatively small size of the flight arena used in our Eristalis experiments is due to the necessity to resolve the fly’s head with camera lenses (for a discussion of the blowfly setup limitations, see Schilstra and van Hateren, 1999, p. 1488). The differently sized arenas used in the Calliphora and Eristalis experiments probably had minimal impact on flight behavior. Previously (Geurten et al., 2010) we showed that even a large change in arena size did not much affect the flight behavior of Eristalis.
One should not mix up the limited depth structure in the used flight arenas with the lack of a physical 3D environment. Even though the distance distribution might be more complex in most free-flight situations, both species were cruising successfully – i.e., without wall collisions – in the confined flight arenas. Thus both fly species had access to information about the three-dimensionality of their actual environment.
Various fly species (Collett and Land, 1975a; Wagner, 1986; Schilstra and van Hateren, 1999; van Hateren and Schilstra, 1999; Tammero and Dickinson, 2002b; Braun et al., 2010; Geurten et al., 2010) as well as honeybees (Boeddeker et al., 2010), and finches (Eckmeier et al., 2008) divide their flight trajectories into rotational and translational segments (Figure 1). We used clustering algorithms to reduce the complexity of the behavior and to categorize trajectories of both species into PMs. The rotational PMs are of shorter and less variable duration than the translational PMs, which have a more flexible duration (Figure 1). The separation between rotational and translational movements is believed to aid the perception of the 3D structure of the flies’ surroundings (Land, 1999). Only translational optic flow contains 3D information, so reducing the rotation duration reduces the animals’ 3D blindness. It was shown for Calliphora that membrane potential changes of tangential cells contain 3D information during the intersaccadic interval (Kern et al., 2005; Liang et al., 2008).
As a first approach to quantify the impact of the two species’ different flight styles on their visual input, we determined the optic flow geometrically. For both species, the yaw saccades led to the strongest optic flow. At least under our experimental conditions, Calliphora’s translational movements create stronger optic flow than those of Eristalis (see Figure 3). However, the patterns of the image shift are vastly different between species. These differences manifest themselves in the distributions of the focus of expansion (FOE) across the visual field for both species. The blowfly always keeps the FOE between −30° and 30° in azimuth (see Figure 3 and Figure A1 in Appendix). Eristalis’ FOEs are distributed much more homogeneously across the visual field. We are not aware of any study where the distribution of the FOE across the visual field during naturalistic flight has been determined. By definition, the FOE centers an expansion flow field. Tammero and Dickinson (2002b) suggested that the difference in image expansion about two hypothetical FOEs, located at 45° in the left and right frontal visual field, respectively, in the intersaccadic interval can be used as a trigger for subsequent saccades in Drosophila. Since in contrast to Calliphora and Drosophila regions with image expansion are distributed across almost the entire visual field in Eristalis, a saccade triggering mechanism based on image expansion would have to exist in parallel at many locations across the entire visual field.
Originally we hypothesized that Eristalis tangential cells might be adapted to slower optic flow velocities than those of Calliphora, because in a previous study (O’Carroll et al., 1996) blowfly tangential cells were found to be most sensitive to velocities around 100°·s−1 (10 Hz temporal frequency), whereas Eristalis was shown to prefer somewhat lower velocities around 70°·s−1. Furthermore, Eristalis responds much stronger at lower temporal frequencies than Calliphora (0–1°·s−1), whereas Calliphora responds stronger at high temporal frequencies (more than 10°·s−1). Nonetheless, we did not find a clear difference in the responses to naturalistic flight stimuli. One reason for this apparent discrepancy might be that the velocity tuning curves were measured under steady-state conditions (O’Carroll et al., 1996), whereas in our experiments we stimulated the cells with highly transient naturalistic optic flow. It is well known that steady-state and transient velocity optima may differ tremendously (Warzecha and Egelhaaf, 1999). Moreover, Eristalis is able to fly as fast as Calliphora (Collett and Land, 1975b; Schilstra and van Hateren, 1999). We found similar response amplitudes of Eristalis and Calliphora vCH cells to Eristalis-specific optic flow. This might be due to adaptive properties of the motion perception of both animals (Harris et al., 1999, 2000; Warzecha and Egelhaaf, 2000; Egelhaaf et al., 2001; Kurtz, 2007; Liang et al., 2008; Barnett et al., 2010). Other lobula plate tangential cells being homologs between both species might behave differently. Nonetheless, single experiments done on HS cells (Hausen, 1982a,b) that are output neurons of the visual system, did not hint in that direction (data not shown).
We found a consistent trend of differences in the timing of both species’ response changes. The fastest acceleration we tested is the instantaneous direction inversion of the spinning drum, which results in a ∼7 ms earlier response peak in Eristalis vCH than in Calliphora vCH for a change from anti-preferred to preferred direction motion (∼4 ms for a change of opposite polarity). Interestingly, preferred direction saccades, on average, elicit a larger mean time shift of ∼12 ms, although the change in optic flow is less steep. Side-to-side movement switches (Figure 8) create a mean time shift of ∼6 ms. These side-to-side movement switches are characteristic of the so-called zig-zagging (Schilstra and van Hateren, 1999; Geurten et al., 2010), which could aid gathering of 3D information in a similar fashion as peering behavior in locusts and mantids (Wallace, 1959; Sobel, 1990; Kral and Poteser, 1997; Land, 1999). During PM changes from hovering to forward–sideward movement we did not find a clear time shift (data not shown). It is likely that the time shift depends on the transience of the change in the optic flow.
One might think of the time shift as an immediate consequence of the change in membrane potential evoked in the vCH cell. A strong stimulus would elicit a large membrane potential change and therefore a large time shift. A weak stimulus would only elicit a small change in membrane potential and render a small time shift. This is not true, because both saccades and the spinning drum experiment drive the vCH cell into the saturation response region and still the responses show different time shifts (Figure 9). The time shift is less dependent on the actual membrane potential, but rather on the transience of the stimulus.
The visual stimuli employed in most of our experiments were aimed at approximating natural stimulation during free flight. However, due to methodological limitations the animal had to be tethered during the intracellular recording experiments and, therefore, was not in a closed loop situation. As a consequence, sensory input from mechanosensory systems as halteres and antennae were missing, as well as a possible efference copy from the motor system. Recent studies have shown that if the fly is in an active locomotion state (Rosner et al., 2009, 2010; Maimon et al., 2010) tangential cells respond with larger amplitudes than without motor activity and that the velocity tuning is shifted to slightly higher values (blowfly: Jung et al., 2011; fruit fly: Chiappe et al., 2010). Pharmacological studies rendered octopamine as a candidate for this modulation of neuronal activity (Longden and Krapp, 2010; Jung et al., 2011). Since in our electrophysiological experiments both Eristalis and Calliphora were tethered and not in a behaviorally active state the responses evoked by the same stimuli can be compared across these experiments, even though they may slightly change during motor activity.
The functional significance of the faster Eristalis responses, compared to Calliphora, to behavioral relevant changes in optic flow will be the subject of further studies. For now we can only speculate. Eristalis may fly in close proximity to flowers within cluttered surroundings. The vCH cell is a wide-field interneuron that, based on its preferred direction and receptive field characteristics, might reduce the response of FD cells during saccades (Egelhaaf, 1985a,b,c; Egelhaaf et al., 1993; Warzecha et al., 1993; Hennig et al., 2011). FD cells might be of use in collision avoidance tasks, for example while approaching or hovering within flower butts. Being able to suppress and reactivate the collision avoidance system very fast might be of great importance when navigating in very cluttered and close proximities. It has to be subject to further studies whether the specific tuning of Eristalis’ vCH cells facilitates its flight in close proximities to flowers.
Conclusions
During cruising flight hoverflies and blowflies compress rotational movements into fast and short saccades. Consequently, translational phases in-between saccades virtually lack any rotation. The optic flow induced by the idiosyncratic flight behavior of the two fly species is rather similar during saccades but very different during translatory phases. Nonetheless, a binocular neuron that could be identified as homologous in both species and extracts optic flow information is not attuned to these species-specific differences. Still, there is one major species-specific difference: The neuron responds much faster to transient optic flow changes in the hoverfly than in the blowfly, with the time shift depending on the transience of the optic flow change.
Author Contributions
Bart R. H. Geurten performed the experiments (physiological and behavioral), analyzed the data, and wrote the first draft of the manuscript. Bart R. H. Geurten, Roland Kern, and Martin Egelhaaf conceived the concept of the study. Roland Kern and Martin Egelhaaf contributed to the interpretation of the data and the writing of the manuscript. All authors have approved the final version of the manuscript.
Conflict of Interest Statement
The authors declare that the research was conducted in the absence of any commercial or financial relationships that could be construed as a potential conflict of interest.
Acknowledgments
We thank J. H. van Hateren (University of Groningen, Netherlands) for providing us the head trajectory data of Calliphora vicina. Many thanks to J. P. Lindemann for his help with the FliMax stimulus device, C. Spalthoff for advice on figure preparation, and N. Carey for improving the language of the manuscript. We also thank K. Lunau for showing Bart R. H. Geurten how to collect Eristalis in the most efficient way and D. O’Carroll for his advice on AlSi-electrodes.
References
Barnett, P. D., Nordström, K., and O’Carroll, D. C. (2010). Motion adaptation and the velocity coding of natural scenes. Curr. Biol. 20, 994–999.
Boeddeker, N., Dittmar, L., Stürzl, W., and Egelhaaf, M. (2010). The fine structure of honeybee head and body yaw movements in a homing task. Proc. Biol. Sci. 277, 1899–1906.
Boeddeker, N., Lindemann, J. P., Egelhaaf, M., and Zeil, J. (2005). Responses of blowfly motion-sensitive neurons to reconstructed optic flow along outdoor flight paths. J. Comp. Physiol. A 191, 1143–1155.
Braun, E., Geurten, B., and Egelhaaf, M. (2010). Identifying prototypical components in behaviour using clustering algorithms. PLoS ONE 5, e9361. doi:10.1371/journal.pone.0009361
Buschbeck, E. K., and Strausfeld, N. J. (1996). Visual motion-detection circuits in flies: small-field retinotopic elements responding to motion are evolutionarily conserved across taxa. J. Neurosci. 16, 4563–4578.
Buschbeck, E. K., and Strausfeld, N. J. (1997). The relevance of neural architecture to visual performance: phylogenetic conservation and variation in dipteran visual systems. J. Comp. Neurol. 383, 282–304.
Chiappe, M. E., Seelig, J. D., Reiser, M. B., and Jayaraman V. (2010). Walking modulates speed sensitivity in Drosophila motion vision. Curr. Biol. 20, 1–6.
Collett, T. S., and Land, M. F. (1975a). Visual control of flight behaviour in the hoverfly Syritta pipiens L. J. Comp. Physiol. A 99, 1–66.
Collett, T. S., and Land, M. F. (1975b). Visual spatial memory in a hoverfly. J. Comp. Physiol. A 100, 59–84.
Collett, T. S., and Land, M. F. (1978). How hoverflies compute interception courses. J. Comp. Physiol. A 125, 191–204.
Dickinson, M. H. (1999). Haltere-mediated equilibrium reflexes of the fruit fly, Drosophila melanogaster. Philos. Trans. R. Soc. Lond. B Biol. Sci. 354, 903–916.
Eckert, H., and Dvorak, D. R. (1983). The centrifugal horizontal cells in the lobula plate of the blowfly, Phaenicia sericata. J. Insect Physiol. 29, 547–553, 555–560.
Eckmeier, D., Geurten, B. R. H., Kress, D., Mertes, M., Kern, R., Egelhaaf, M., and Bischof, H. J. (2008). Gaze strategy in the free flying zebra finch (Taeniopygia guttata). PLoS ONE 3, e3956. doi:10.1371/journal.pone.0003956
Egelhaaf, M. (1985a). On the neuronal basis of figure-ground discrimination by relative motion in the visual-system of the fly. 1. Behavioral constraints imposed on the neuronal network and the role of the optomotor system. Biol. Cybern. 52, 123–140.
Egelhaaf, M. (1985b). On the neuronal basis of figure-ground discrimination by relative motion in the visual-system of the Fly. 2. Figure-detection cells, A new class of visual interneurones. Biol. Cybern. 52, 195–209.
Egelhaaf, M. (1985c). On the neuronal basis of figure-ground discrimination by relative motion in the visual-system of the fly. 3. Possible input circuitries and behavioral significance of the Fd-cells. Biol. Cybern. 52, 267–280.
Egelhaaf, M., Borst, A., Warzecha, A. K., Flecks, S., and Wildemann, A. (1993). Neural circuit tuning fly visual neurons to motion of small objects. 2. Input organization of inhibitory circuit elements revealed by electrophysiological and optical-recording techniques. J. Neurophysiol. 69, 340–351.
Egelhaaf, M., Grewe, J., Kern, R., and Warzecha, A. K. (2001). Outdoor performance of a motion-sensitive neuron in the blowfly. Vision Res. 41, 3627–3637.
Egelhaaf, M., Kern, R., Lindeman, J. P., Braun, E., and Geurten, B. R. H. (2009). “Active vision in blowflies: strategies and mechanisms of spatial orientation,” in Flying Insects and Robots, eds. D. Floreano, J.-C. Zufferey, M. V. Srinivasan, and C. Ellington (Hamburg: Springer), 316.
Farrow, K., Haag, J., and Borst, A. (2003). Input organization of multifunctional motion-sensitive neurons in the blowfly. J. Neurosci. 23, 9805–9811.
Farrow, K., Haag, J., and Borst, A. (2006). Nonlinear, binocular interactions underlying flow field selectivity of a motion-sensitive neuron. Nat. Neurosci. 9, 1312–1320.
Geurten, B. R. H., Kern, R., Braun, E., and Egelhaaf, M. (2010). A syntax of hoverfly flight prototypes. J. Exp. Biol. 213, 2461–2475.
Haag, J., and Borst, A. (2001). Recurrent network interactions underlying flow-field selectivity of visual interneurons. J. Neurosci. 21, 5685–5692.
Haag, J., and Borst, A. (2003). Orientation tuning of motion-sensitive neurons shaped by vertical–horizontal network interactions. J. Comp. Physiol. A 189, 363–370.
Harris, R. A., O’Carroll, D. C., and Laughlin, S. B. (1999). Adaptation and the temporal delay filter of fly motion detectors. Vision Res. 39, 2603–2613.
Harris, R. A., O’Carroll, D. C., and Laughlin, S. B. (2000). Contrast gain reduction in fly motion adaptation. Neuron 28, 595–606.
Hausen, K. (1976). Functional characterization and anatomical identification of motion sensitive neurons in the lobula plate of the blowfly, Calliphora erythrocephala. Z. Naturforsch. C 31, 629–633.
Hausen, K. (1982a). Motion sensitive interneurons in the optomotor system of the fly. 1. The horizontal cells – structure and signals. Biol. Cybern. 45, 143–156.
Hausen, K. (1982b). Motion sensitive interneurons in the optomotor system of the fly. 2. The horizontal cells – receptive-field organization and response characteristics. Biol. Cybern. 46, 67–79.
Hausen, K. (1993). “Decoding of retinal image flow in insects,” in Visual Motion and its Role in the Stabilization of Gaze, eds. F. A. Miles and J. Wallman (Amsterdam: Elsevier), 203–235.
Hennig, P., Kern, R., and Egelhaaf, M. (2011). Binocular integration of visual information: a model study on naturalistic optic flow processing. Front. Neural Circuits 5:4. doi:10.3389/fncir.2011.00004
Jung, S. N., Borst, A., and Haag, J. (2011). Flight activity alters velocity tuning of fly motion-sensitive neurons. J. Neurosci. 31, 9231–9237.
Kern, R., van Hateren, J. H., and Egelhaaf, M. (2006). Representation of behaviourally relevant information by blowfly motion-sensitive visual interneurons requires precise compensatory head movements. J. Exp. Biol. 209, 1251–1260.
Kern, R., van Hateren, J. H., Michaelis, C., Lindemann, J. P., and Egelhaaf, M. (2005). Function of a fly motion-sensitive neuron matches eye movements during free flight. PLoS Biol. 3, 1130–1138. doi:10.1371/journal.pbio.0030171
Korn, T., and Korn, G. (2000). Mathematical Handbook for Scientists and Engineers?: Definitions, Theorems, and Formulas for Reference and Review. Mineola, NY: Dover Publications.
Kral, K., and Poteser, M. (1997). Motion parallax as a source of distance information in locusts and mantids. J. Insect Behav. 10, 145–163.
Krapp, H. G., Hengstenberg, R., and Egelhaaf, M. (2001). Binocular contributions to optic flow processing in the fly visual system. J. Neurophysiol. 85, 724–734.
Kurtz, R. (2007). Direction-selective adaptation in fly visual motion-sensitive neurons is generated by an intrinsic conductance-based mechanism. Neuroscience 146, 573–583.
Kurtz, R., Fricke, M., Kalb, J., Tinnefeld, P., and Sauer, M. (2006). Application of multiline two-photon microscopy to functional in vivo imaging. J. Neurosci. Methods 151, 276–286.
Land, M. F. (1999). Motion and vision: why animals move their eyes. J. Comp. Physiol. A 185, 341–352.
Liang, P., Kern, R., and Egelhaaf, M. (2008). Motion adaptation enhances object-induced neural activity in three-dimensional virtual environment. J. Neurosci. 28, 11328–11332.
Lindemann, J. P., Kern, R., Michaelis, C., Meyer, P., van Hateren, J. H., and Egelhaaf, M. (2003). FliMax, a novel stimulus device for panoramic and highspeed presentation of behaviourally generated optic flow. Vision Res. 43, 779–791.
Longden, K. D., and Krapp, H. G. (2010). Octopaminergic modulation of temporal frequency coding in an identified optic flow-processing interneuron. Front. Syst. Neurosci. 4:153. doi:10.3389/fnsys.2010.00153
MacQueen, J. B. (1967). “Some methods for classification and analysis of multivariate observations,” Proceedings of 5th Berkeley Symposium on Mathematical Statistics and Probability, Vol. 1, 281–297.
Maimon, G., Straw, A. D., and Dickinson, M. H. (2010). Active flight increases the gain of visual motion processing in Drosophila. Nat. Neurosci. 13, 393–399.
Mamiya, A., Straw, A. D., Tómasson, E., and Dickinson, M. H. (2011). Active and passive antennal movements during visually guided steering in flying Drosophila. J. Neurosci. 31, 6900–6914.
Nordström, K., Barnett, P. D., de Miguel, I. M. M., Brinkworth, R. S. A., and O’Carroll, D. C. (2008). Sexual dimorphism in the hoverfly motion vision pathway. Curr. Biol. 18, 661–667.
O’Carroll, D. C., Bidwell, N. J., Laughlin, S. B., and Warrant, E. J. (1996). Insect motion detectors matched to visual ecology. Nature 382, 63–66.
O’Carroll, D. C., Laughlin, S. B., Bidwell, N. J., and Harris, R. A. (1997). Spatio-temporal properties of motion detectors matched to low image velocities in hovering insects. Vision Res. 37, 3427–3439.
Rosner, R., Egelhaaf, M., Grewe, J., and Warzecha, A. K. (2009). Variability of blowfly head optomotor responses. J. Exp. Biol. 212, 1170–1184.
Rosner, R., Egelhaaf, M., and Warzecha, A.-K. (2010). Behavioural state affects motion-sensitive neurones in the fly visual system. J. Exp. Biol. 213, 331–338.
Schilstra, C., and van Hateren, J. H. (1998). Using miniature sensor coils for simultaneous measurement of orientation and position of small, fast-moving animals. J. Neurosci. Methods 83, 125–131.
Schilstra, C., and van Hateren, J. H. (1999). Blowfly flight and optic flow I. Thorax kinematics and flight dynamics. J. Exp. Biol. 202, 1481–1490.
Sobel, E. C. (1990). The locust’s use of motion parallax to measure distance. J. Comp. Physiol. A 167, 579–588.
Spalthoff, C., Egelhaaf, M., Tinnefeld, P., and Kurtz, R. (2010). Localized direction selective responses in the dendrites of visual interneurons of the fly. BMC Biol. 8, 36. doi:10.1186/1741-7007-8-36
Stange, G. (1981). The ocellar component of flight equilibrium control in dragonflies. J. Comp. Physiol. A 141, 335–347.
Strausfeld, N. J. (2009). Brain organization and the origin of insects: an assessment. Proc. R. Soc. Lond. B Biol. Sci. 276, 1929–1937.
Tammero, L. F., and Dickinson, M. H. (2002a). Collision-avoidance and landing responses are mediated by separate pathways in the fruit fly, Drosophila melanogaster. J. Exp. Biol. 205, 2785–2798.
Tammero, L. F., and Dickinson, M. H. (2002b). The influence of visual landscape on the free flight behavior of the fruit fly Drosophila melanogaster. J. Exp. Biol. 205, 327–343.
Tatler, B., O’Carroll, D. C., and Laughlin, S. B. (2000). Temperature and the temporal resolving power of fly photoreceptors. J. Comp. Physiol. A 186, 399–407.
van Hateren, J. H., Kern, R., Schwerdtfeger, G., and Egelhaaf, M. (2005). Function and coding in the blowfly H1 neuron during naturalistic optic flow. J. Neurosci. 25, 4343–4352.
van Hateren, J. H., and Schilstra, C. (1999). Blowfly flight and optic flow. II. Head movements during flight. J. Exp. Biol. 202, 1491–1500.
Wagner, H. (1986). Flight performance and visual control of flight of the free-flying housefly (Musca domestica L.) I. Organization of the flight motor. Philos. Trans. R. Soc. Lond. B Biol. Sci. 312, 527–551.
Wallace, G. K. (1959). Visual scanning in the desert locust Schistocerca gregaria Forskal. J. Exp. Biol. 36, 512–525.
Warzecha, A., and Egelhaaf, M. (1999). Variability in spike trains during constant and dynamic stimulation. Science 283, 1927–1930.
Warzecha, A. K., Egelhaaf, M., and Borst, A. (1993). Neural circuit tuning fly visual interneurons to motion of small objects. 1. Dissection of the circuit by pharmacological and photoinactivation techniques. J. Neurophysiol. 69, 329–339.
Warzecha, A.-K., and Egelhaaf, M. (2000). Response latency of a motion-sensitive neuron in the fly visual system: dependence on stimulus parameters and physiological conditions. Vision Res. 40, 2973–2983.
Appendix
Distribution of the Focus of Expansion of Eristalis and Calliphora vCH Cells
We quantified the differences in the optic flow of the two fly species. Therefore we characterized the optic flow with respect to the position of the focus of expansion (FOE). The spatial distribution of the FOE positions is plotted in Figure A1. Blowflies fly for most of the time nearly straight forward and make only small sideways movements. Consequently most of the blowfly FOEs are centered in front of them (azimuth). This finding reflects the similarity of the flow fields evoked by translational PMs in Calliphora. Vertically, the loci are shifted downward by about 10°, on average. In contrast, the foci of expansion are distributed more evenly across the visual field for Eristalis. This reflects Eristalis ability to fly in virtually any direction relative to its body long axis orientation (Collett and Land, 1975a, 1978; Geurten et al., 2010). Thus, the data illustrated in Figure A1 mirror the differing flight styles of the two animals and highlight the preponderance of largely different inputs into their visual systems.
The FOE was determined from the flow fields, characterized as an area where all flow arrows point away from (e.g., Figure 3B, bottom left, 0° azimuth, 0° elevation). To find these foci we calculated the divergence of the optic flow vectors (Korn and Korn, 2000). The divergence sources (FOE) and sinks (foci of contraction) in an ideal continuous vector field are either positive (source) or negative (sink) infinite. In our case we have a discrete sample point pattern. Hence, the foci are often between sample points resulting in smaller divergences. Therefore we have to use a threshold, which was set to 10% of the number of the vector field’s sample points. For instance, in case of expansional optic flow 10% of the vectors have to point away from the FOE. We used this rather high threshold, because we presumed Eristalis to have more variable FOE positions than Calliphora. Also a high threshold ensured that the positions of the detected FOEs reflect real FOEs and not noise from the digitization or the discrete sampling grid. Optic flow fields corresponding to pure rotations do not contain a FOE (e.g., Figure 3B, PMs 1–4). Note that the FOE can only be calculated inside the field of view, i.e., the sampling grid. Hence, FOEs above and below −60° to 60° in elevation were missed. The MATLAB toolbox to do these calculations was programed by C. Strub, Dr. J. Lindemann, Dr. W. Stürzl, and Dr. B. Geurten.
Receptive Field of vCH in Eristalis and Calliphora
For a subpopulation of the recorded vCH cells, we compared the local preferred directions of motion between Calliphora (N = 4) and Eristalis vCH (N = 3). We used a stimulus similar to Nordström et al. (2008) to characterize the receptive field properties of the cells. A vertical bar of 2° × 10° (width × height), centered about seven different elevations (−85°, −57°, −28°, 0°, 26°, 47°, 68°), scanned the receptive field horizontally in both directions. A horizontal bar of 10° × 2° (width × height), centered about seven different azimuths (−90°, −60°, −30°, 0°, 30°, 60°, 90°), traversed the field of view vertically.
We plotted the mean local preferred directions, i.e., the receptive field of the vCH cell of both species in Figure A2. The response vectors are underlayed with the color coded mean response of vCH to preferred direction motion in front of either eye. In both cases the most sensitive part of the receptive field is located frontally. The overall direction preference is similar in both species. However, there are also differences: The hoverfly’s vCH cell (N = 3) has a larger receptive field with different vertical components than its Calliphora (N = 4) counterpart. The characteristics of the response field of the Calliphora vCH differ slightly to the vCH response field published by Krapp et al. (2001) which might be due to different stimulation and analysis methods. For example, we used a small target crossing the field of view rather than a mechanical disk spinning at different locations of the receptive field as in Krapp et al. (2001). Moreover, we applied a vector method rather than a sinusoidal fit to approximate a neuron’s preferred direction. Nonetheless, the most sensitive region of the receptive field and the preferred direction within this region are similar. Most importantly, the extended responsiveness with respect to elevation of the Eristalis vCH as compared to its Calliphora counterpart is obvious from our data and the data of Krapp et al. (2001).
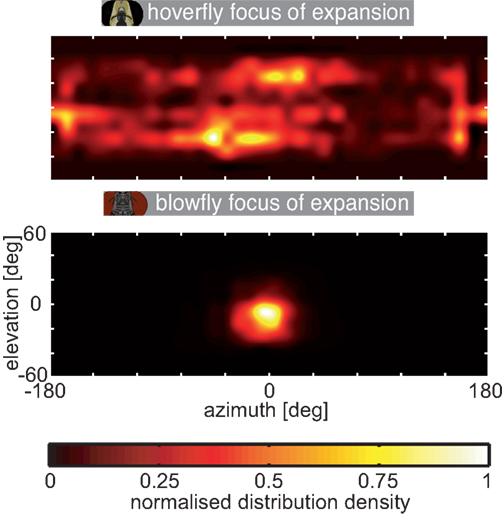
Figure A1. Distribution of the focus of expansion. The location of the focus of expansion within the visual field was calculated from the optic flow corresponding to the head trajectories and plotted as color coded density distribution; top: hoverfly, bottom: blowfly. The data were interpolated to avoid hard edges of the sample point grid (grid as in Figure 3). The density was normalized to the highest count inside the sample point grid separately for each plot.
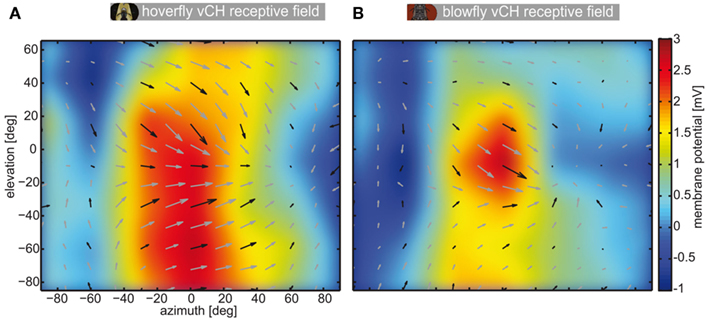
Figure A2. Receptive field of vCH in Eristalis and Calliphora. Each plot shows the receptive field of vCH in a window of >140° elevation and >160° azimuth. The false color map behind the local preferred directions codes for the mean response amplitude of the cells to movement from the left to the right at seven different elevations. The false color map was interpolated to avoid hard edges of binning the data. The superimposed arrows show the local preferred directions (length codes for local sensitivity). Black arrows are samples. Gray arrows are linearly interpolated. To determine the receptive fields a narrow but high (2° × 10°) target was presented to vCH neurons which traversed the complete field of view horizontally at seven different elevations in both directions. In addition, the same target, rotated by 90°, was presented on a vertical trajectory at seven different azimuths. The local direction preference of the vCH cell (Figure A2) was calculated as follows: At first we corrected for the latencies of the cells. We calculated the latency from the replay experiments (see Materials and Methods), by calculating the mean time difference between the saccade velocity peak and the response amplitude peak. For each movement direction adopted by our bar stimulus (left to right, right to left, top to bottom, bottom to top) we calculated the mean response across cells. We treated the membrane potential change as the length of a vector pointing in the direction of target motion. Summation of all four vectors yielded the preferred direction vector. The length of this vector was set to represent the local direction sensitivity. This was done at all locations within the sampling grid. The color map behind the local preferences shows the mean interpolated reaction of the cells to left-to-right motion. (A) Receptive field of Eristalis vCH (n = 3), (B) receptive field of Calliphora vCH (n = 4).
Keywords: motion vision, lobula tangential cells, prototypical movements, optic flow, ventral centrifugal horizontal cell, eristalis tenax, calliphora vicina
Citation: Geurten BRH, Kern R and Egelhaaf M (2012) Species-specific flight styles of flies are reflected in the response dynamics of a homolog motion-sensitive neuron. Front. Integr. Neurosci. 6:11. doi: 10.3389/fnint.2012.00011
Received: 17 May 2011; Accepted: 28 February 2012;
Published online: 19 March 2012.
Edited by:
John J. Foxe, Albert Einstein College of Medicine, USAReviewed by:
Jamie C. Theobald, Florida International University, USAKarin Nordstrom, Uppsala University, Sweden
Copyright: © 2012 Geurten, Kern and Egelhaaf. This is an open-access article distributed under the terms of the Creative Commons Attribution Non Commercial License, which permits non-commercial use, distribution, and reproduction in other forums, provided the original authors and source are credited.
*Correspondence: Bart R. H. Geurten, Department of Neurobiology, Bielefeld University, Postbox 100131, 33501 Bielefeld, North Rhine-Westphalia, Germany. e-mail:YmFydC5nZXVydGVuQGJpb2xvZ2llLnVuaS1nb2V0dGluZ2VuLmRl