


- 1Department of Biomedical Engineering, Johns Hopkins University, Baltimore, MD, USA
- 2Department of Neurology, University of Alabama at Birmingham, Birmingham, AL, USA
- 3Department of Neurosciences, Cleveland Clinic, Cleveland, OH, USA
- 4Department of Biological Sciences, Kent State University, Kent, OH, USA
Deep brain stimulation (DBS) of the subthalamic nucleus (STN) directly modulates the basal ganglia (BG), but how such stimulation impacts the cortex upstream is largely unknown. There is evidence of cortical activation in 6-hydroxydopamine (OHDA)-lesioned rodents and facilitation of motor evoked potentials in Parkinson's disease (PD) patients, but the impact of the DBS settings on the cortical activity in normal vs. Parkinsonian conditions is still debated. We use point process models to analyze non-stationary activation patterns and inter-neuronal dependencies in the motor and sensory cortices of two non-human primates during STN DBS. These features are enhanced after treatment with 1-methyl-4-phenyl-1,2,3,6-tetrahydropyridine (MPTP), which causes a consistent PD-like motor impairment, while high-frequency (HF) DBS (i.e., ≥100 Hz) strongly reduces the short-term patterns (period: 3–7 ms) both before and after MPTP treatment, and elicits a short-latency post-stimulus activation. Low-frequency DBS (i.e., ≤50 Hz), instead, has negligible effects on the non-stationary features. Finally, by using tools from the information theory [i.e., receiver operating characteristic (ROC) curve and information rate (IR)], we show that the predictive power of these models is dependent on the DBS settings, i.e., the probability of spiking of the cortical neurons (which is captured by the point process models) is significantly conditioned on the timely delivery of the DBS input. This dependency increases with the DBS frequency and is significantly larger for high- vs. low-frequency DBS. Overall, the selective suppression of non-stationary features and the increased modulation of the spike probability suggest that HF STN DBS enhances the neuronal activation in motor and sensory cortices, presumably because of reinforcement mechanisms, which perhaps involve the overlap between feedback antidromic and feed-forward orthodromic responses along the BG-thalamo-cortical loop.
Introduction
High-frequency (HF) Deep Brain Stimulation (DBS) of the basal ganglia (BG) is a clinically recognized treatment for movement disorders in Parkinson's disease (PD), but its therapeutic mechanisms are still not fully understood (DeLong and Wichmann, 2007; Montgomery and Gale, 2008). It is widely recognized that both PD-related deficits of the nigrostriatal dopaminergic system and BG DBS ultimately affect the motor cortex (Watts and Mandir, 1992; Baker et al., 2002; Cunic et al., 2002; DeLong and Wichmann, 2007; Gale et al., 2008; Montgomery and Gale, 2008), but how the neuronal activity in cortex changes in normal vs. PD conditions, with and without DBS, still requires further investigation.
Studies in 1-methyl-4-phenyl-1,2,3,6-tetrahydropyridine (MPTP)-treated non-human primates showed that, in primary motor cortex (M1), Parkinsonism evokes bursting, synchronous oscillations and decreased specificity to movements, and may cause excessive synchronization between the BG and the cortex (Doudet et al., 1990; Watts and Mandir, 1992; Goldberg et al., 2002, 2004; Rivlin-Etzion et al., 2008, 2010). Excessive BG-cortex synchronization was also confirmed in PD patients (Marsden et al., 2001; Fogelson et al., 2006; Lalo et al., 2008).
Studies in both normal and 6-hydroxydopamine (OHDA)-lesioned rodents (Li et al., 2007; Dejean et al., 2009; Gradinaru et al., 2009) reported that subthalamic nucleus (STN) DBS induces antidromic phase-locked cortical activation. DBS of the internal globus pallidus (GPi), instead, elicited phase-locked inhibition and decreased the discharge rate in the primary M1 cortex of a single MPTP non-human primate (Johnson et al., 2009).
Studies on PD patients showed that a single STN DBS pulse produces cortical-evoked potentials (Baker et al., 2002) and facilitates the response of the M1 cortex to transcranial magnetic stimuli at short latencies (Hanajima et al., 2004), while therapeutic HF STN DBS restores the short-interval intra-cortical inhibition to normal levels during transcranial magnetic cortical stimulation (Cunic et al., 2002).
This study aims to (i) test the hypothesis in the non-human primate that the effects of STN DBS on cortex vary with the stimulation frequency and involve reinforcement phenomena (i.e., a combination of antidromic and orthodromic effects) above 100 Hz; (ii) to determine whether the cortical response to DBS varies in normal vs. MPTP conditions; and (iii) to determine whether DBS affects the non-stationary dependencies between spike trains of neurons in small cortical ensembles (i.e., recorded from one microelectrode).
We used single unit recordings collected in the primary motor (M1) and sensory (S1) cortex of two non-human primates during STN DBS at 50, 100, and 130 Hz. In one animal, recordings were collected both before and after treatment with MPTP. We developed point process models (Snyder and Miller, 1991) to capture recurrent dynamical patterns in the neuronal activity and characterize the non-stationary dependencies among neurons both at rest and during DBS.
We also investigate the prediction power of the proposed point process models by using tools from the information theory. In particular, the receiver operating characteristic (ROC) curve, the area under the ROC curve (AUC value), and the information rate (IR) are used to measure the impact of the spiking histories on the prediction of the cortical discharge patterns (Bamber, 1975; Cover and Thomas, 1991; Fawcett, 2006; Truccolo et al., 2010).
Point process models have been recently applied to a wide range of neural systems (Frank et al., 2002; Brown et al., 2003; Paninski, 2004; Truccolo et al., 2005, 2010; Czanner et al., 2008; Pillow et al., 2008) and describe the spiking propensity of a neuron as a function of multiple factors (e.g., DBS, ensemble neurons' spiking history, disease conditions, etc.). These models were recently used to capture several features of STN neuronal spike trains (e.g., oscillations, refractoriness, synchronization, etc.) in PD patients (Sarma et al., 2010). Preliminary results of our study were presented in (Santaniello et al., 2010a,b) and in (Saxena et al., 2010a,b).
Materials and Methods
Two non-human primates (macaca mulatta, animal A and B in the following) were trained with positive reinforcement to sit quietly in a loosely restraining chair designed to allow passive movements of the upper and lower limbs while preventing the animals from disturbing the recording instruments. The research protocol was in compliance with “The National Institutes of Health Guide for Care and Use of Laboratory Animals” and approved by the Institutional Animal Care and Use Committee.
Experimental Setup
The experiment is described in (Gale, 2004; Montgomery et al., 2005). Briefly, after training, both animals were surgically implanted with a recording chamber over a craniotomy site such that the microelectrodes could be passed into the cortex through the intact dura and reach the STN (Buchholz and Montgomery, 1988; Montgomery and Buchholz, 1991). Surgeries were conducted aseptically with isoflurane inhalation general anesthesia. Post-operative discomfort was treated with buprenorphine (0.025 mg/kg administered intramuscularly) every 12 h for 3 days. Veterinarians not involved in this research closely observed the animals for any change in behavior indicating pain or distress.
Once the recording chamber was in place, daily microelectrode recordings were made to identify the sensorimotor region of the STN. Position of the microelectrode was referenced to the stereotactically placed recording chamber and the microdrive coordinates were transferred to the stereotatic atlas of the macaca mulatta (Paxinos et al., 2000). In each animal, the STN was identified as in (Baker et al., 2004) and changes in neuronal activity with passive movements of the animal's arm identified the sensorimotor region of the STN. The ventral border was identified by a transition to sites with high frequency regular activity and low neuronal densities, which are characteristic of the substantia nigra pars reticulata. More lateral passes of the microelectrode did not encounter neuronal extracellular action potentials (spikes), which is consistent with the axons of the internal capsule adjacent to the STN.
Once the STN was identified, a reduced scale model of the human DBS lead was placed with the deepest contact at the bottom of the STN (NuMed Inc., Hopkinton, NY). Anatomical placement of the lead was later confirmed by histological examination (Figure 1). The chronic stimulation leads used in this study have four contacts, each 0.525 mm in diameter, 0.5 mm long, and 0.5 mm between contacts (total surface area: 0.82 mm2 per contact).
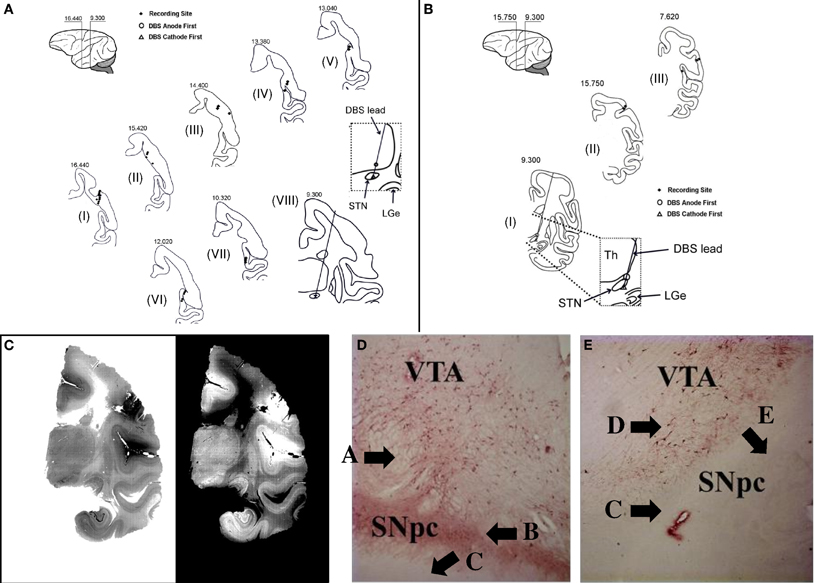
Figure 1. Histology. (A,B) Reconstruction of the location of the DBS lead and microelectrode recording sites for animal A (A) and B (B). Sections are labeled from I to VIII (A) and from I to III (B), respectively. The number on top of each section is the distance anterior to intra-aural line. (C) Example of histological section from which the lead location is determined (animal A, section VIII). (D,E) Example of section through the ipsilateral (D) and contralateral (E) substantia nigra pars compacta (SNpc) and ventral anterior thalamus (VTA) stained with TH antibodies after unilateral intracarotid injection of MPTP (animal A). See Results for explanation of labels A–E.
The electrical stimulation consisted of constant-current symmetric biphasic square-wave pulses, which were delivered between the most distal and the most proximal contact (C0 and C3, respectively). For each pulse, the cathodic phase preceded the anodic phase at C0 (reverse for C3). Pulse width was 90 μs/phase and amplitude was 80% of the current producing tonic contraction (animal A: 0.55 mA; animal B: 0.33 mA), presumably from current spread to the internal capsule. The current amplitude producing tonic contraction was determined during 130 Hz stimulation. We considered three stimulation frequencies: 50, 100, and 130 Hz.
Microelectrode recordings were collected from separate sites of M1 and S1 cortex (pre- and post-central gyrus, respectively) on a semi-daily basis. Somatosensory testing was conducted to delineate motor from sensory cortex for each recording and included (i) passive movement of the animals' limbs, (ii) stimulation of the skin, and/or (iii) palpation of the muscle of the arm and leg. For each recording site, multiple sessions of STN stimulation were made at the frequencies described above and, for each session, continuous recordings were collected 30 s before and 8 to 30 s during DBS. Extracellular action potentials were acquired through platinum-iridium microelectrodes (tip exposure: 10–20 μm; impedance: 0.4–0.6 MΩ; FHC, Inc., Bowdoinham, ME). Electrophysiological signals were bandpass-filtered (0.5–50 kHz) and digitally converted to 25 samples/s for offline analysis. Validated offline software was used to isolate and remove the stimulus artifacts and to discriminate the action potentials from the background noise (Montgomery et al., 2005; Montgomery, 2006, 2008).
Animal A received initial infusions of MPTP via the right intracarotid artery (0.04 mg/kg) followed by three systemic doses of 0.2 mg/kg, administered intravenously over the course of several weeks, until the animal demonstrated a consistent motor impairment. Effects of the treatment were assessed by observing the animal's spontaneous cage behavior. Because stimulation was applied only while the animal was restrained in the chair, no formal clinical assessment of the effects of DBS was conducted.
At the completion of the study, both animals were anesthetized with ketamine (15 mg/Kg, administered intramuscularly) and monitored until unresponsive to sensory stimulation. After that, animals were administered heparin (10,000 units, administered intravenously), which was allowed to circulate for one minute, and, subsequently, were administered a lethal dose of buthanasia-B. Animals were then transcardially perfused with saline followed by 4% phosphate-buffered paraformaldehyde. Brains were removed and immersion perfused for a minimum of two weeks. Brains were blocked and sectioned in the coronal plane using a cryostat (50 μm thickness). Recording sites in cortex were reconstructed by identification of gliosis along the microelectrode and electrophysiological landmarks (Gale, 2004). In addition, sections through the midbrain of the MPTP-treated animal were stained with tyrosine hydroxylase (TH) antibodies to identify TH positive neurons. See Figure 1.
Neuronal Data Analysis and Point Process Models
Table 1 reports the neurons used in our study. Criteria for including these neurons were (i) stable signal-to-noise ratio both before and during stimulation (Gale et al., 2009), (ii) existence of a refractory period in the autocorrelogram of individual neurons and absence of refractory periods in the cross-correlogram between pairs of simultaneously recorded neurons (Montgomery, 2006), and (iii) satisfaction of a goodness-of-fit test for the correspondent point process model (Brown et al., 2003).
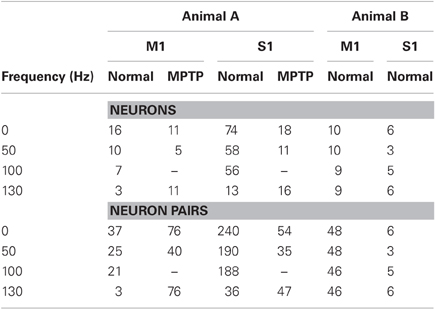
Table 1. Experimental Data Set.
The point process models used for our analyzes are described in (Santaniello et al., 2010a,b). Briefly, we recall that the spike train of a neuron over a generic time interval (0,T] can be treated as a series of random binary events occurring continuously in time (point process) (Snyder and Miller, 1991). The process is completely characterized by the generalized history-dependent conditional intensity function (CIF)
where N(t) is the number of spikes in (0,t] for t in (0,T], Ht is the history of all covariates up to t (e.g., the spiking history of the neuron can be a covariate), and Pr(·) is the probability. Note that λ(t|Ht)Δ is approximately the probability that a spike occurs at time t provided that Δ is small (Snyder and Miller, 1991; Brown et al., 2002; Truccolo et al., 2005).
For each neuron, we defined a model for the CIF conditioned on the neuron's own spiking history, the spiking history of any other neuron simultaneously recorded (same ensemble), and the DBS input. The model has the structure (Kass and Ventura, 2001; Sarma et al., 2010):
where eσ (in spikes/s) accounts for the average history-independent (i.e., Poisson-like) activity, and λO, λE, and λS are dimensionless functions of the neuron's own spiking activity HOt, the activity HEt of any other neuron in the same ensemble, and the DBS stimulus sequence HSt (if applied), respectively. Θ is a parameter vector to be estimated from data. We set Δ = 1 ms and assumed λO, λE, and λS belong to the class of generalized linear models (McCullagh and Nelder, 1990)
where dN(a,b) and dNq(a,b) are the number of spikes fired by the modeled neuron and the q-th neuron in the ensemble (whose size is Q) in [a,b) (ms), respectively, dNS(a,b) is the number of DBS pulses delivered in the same interval, and Θ = [σ, β1, …, β18, γ1, …, γ8, {δ1,q, …, δ18,q}Qq = 1].
For each neuron and stimulation frequency, an estimate of Θ along with 95% confidence bounds were provided separately before and during stimulation by maximizing the likelihood of observing the recorded spike trains (Brown et al., 2003; Truccolo et al., 2005, 2010; Sarma et al., 2010). For each neuron, 80% of the spike trains were used for parameter estimation and 20% for validation. The set of history bins [i.e., values a, b in dN(a,b), dNq(a,b), dNS(a,b)] in (3–5) determines the number of parameters in Θ and was chosen by minimizing the Akaike's Information Criterion (Akaike, 1974) over a set of candidate models.
The goodness-of-fit of each point process model (2–5) was assessed on the validation data by testing the Kolmogorov-Smirnov plot after time rescaling of the spike trains (Barbieri et al., 2001; Brown et al., 2002, 2003; Frank et al., 2002; Truccolo et al., 2005; Czanner et al., 2008; Sarma et al., 2010). Only neurons whose point process model passed this test were included in this study (Table 1). Because we recorded from only one microelectrode at a time, inter-neuronal correlations would not be properly captured by correlograms because of shading artifacts (Bar-Gad et al., 2001). The model (2–5), however, is not sensitive to these artifacts since it estimates the concurrent impact of multiple neurons on the same target neuron without using correlograms.
Statistical inferences from point process models
Since the spiking propensity λ in (2) is given by a Poisson factor (eσ) modulated by history-dependent factors (i.e., λO, λE, and λS), the neuron's own spiking patterns, the dependencies from other neurons, and the responses to DBS stimuli depend on the dynamics of λO, λE, and λS, respectively. Such dynamics were captured by the parameters Θ in (3–5), as Θ was estimated from the neuron's own spike trains (Truccolo et al., 2005; Sarma et al., 2010). Therefore, we inferred recurrent patterns and ensemble dependencies by looking at the 95% confidence bounds of Θ.
In particular, we say that a generic neuron n has a “recurrent activation pattern” with period Δp if, at any time t, the probability that n spikes increased by more than 5% over the baseline Poisson factor eσ, provided that n spiked Δp ms earlier. We inferred an activation pattern with period in [a,b) if the lower 95% confidence bound of eβr was >1.05, where βr multiplies the number of spikes dN(a,b) in (3).
Similarly, given a pair of neurons (n1,n2), we say that n1 had an “ensemble activation dependency” with lag Lp on n2 if, at any time t, the probability that n1 spikes increased by more than 5% over the baseline Poisson factor eσ, provided that n2 spiked Lp ms earlier. We inferred an activation dependency between the modeled neuron and any other neuron q in the ensemble with lag in [a,b) if the lower 95% confidence bound of eδh,q was >1.05, where δh,q multiplies the number of spikes dNq(a,b) in (4).
Prediction Performance and Information Rate of the Point Process Models
We evaluated the prediction performance of each model (i.e., how well that model predicts the spike trains of the correspondent neuron) by using the ROC curve (Fawcett, 2006). The probability of a spike at any given 1 ms bin, conditioned on the covariates in (3–5), was computed on the validation data as λ (t|Ht)Δ where λ(t|Ht) was given by (2–5) and Δ = 1 ms. From this probability, true- and false-positive rates were computed for different thresholds, resulting in the ROC curve. The area under the ROC curve (AUC) was used as a measure of predictive power (Bamber, 1975; Truccolo et al., 2010).
For each neuron, we also estimated the impact of the spiking histories on the prediction of the spiking activity by computing the information rate (Cover and Thomas, 1991; Truccolo et al., 2010):
where is the log-likelihood function for the point process model of the neuron with parameter on the time interval (0,T], is the likelihood function [i.e., the probability of observing the spike train N in (0,T] given the maximum likelihood estimation of Θ (Brown et al., 2003)], is the log-likelihood function for a homogeneous Poisson process whose rate is the average spiking rate of the neuron, and 〈·〉 denotes the mean value over (0,T]. IR estimates how much the knowledge of the spiking histories in the point process model reduces the uncertainty about whether or not the neuron will spike in any given time bin, compared with a history-independent Poisson model (Truccolo et al., 2010). Computed to base 2 and normalized by the bin size, IR corresponds to an information rate in bits/s.
Results
The testing conditions are denoted below with “###-DBS-normal” or “###-DBS-MPTP,” depending on whether normal or MPTP-treated animals are considered, with ### being the DBS frequency (50, 100, or 130 Hz). “0-DBS-normal” and “0-DBS-MPTP” denotes the no-DBS condition in normal and MPTP-treated state, respectively. Although no formal clinical assessment of the DBS effects was conducted, we refer to 130 Hz DBS and 50–100 Hz DBS as “therapeutic” and “non-therapeutic,” respectively, based on the evidence reported in (Hashimoto et al., 2003; Hahn et al., 2008) for the MPTP-treated macaca mulatta.
Electrode Recording, DBS Sites, and Histological Assessment of MPTP Administration
A total of 135 neurons were recorded in the motor and sensory cortices of two non-human primates (119 in animal A and 16 in animal B). The anatomical sites of the microelectrode recordings containing these neurons and the location of the stimulation leads are shown in Figures 1A–C. Table 1 reports the number of neurons recorded under the various conditions.
In both animals, the most ventral of the four electrical contacts of the DBS lead was at the ventral boarder of the STN. The most dorsal contact was either in the zona incerta or the ventral thalamus just dorsal to the STN. Thus, bipolar stimulation across the most ventral to the most dorsal contacts spanned the whole STN, with possible additional stimulation of the pallidofugal fibers in the zona incerta. However, this is not inconsistent with the clinical use of STN DBS. Indeed, it is argued that stimulation of the pallidofugal fibers may account for much of the clinical efficacy of STN DBS (Wichmann and DeLong, 2006; Herzog et al., 2007; Hahn et al., 2008).
Figures 1D,E report two sections stained with TH antibodies after unilateral MPTP injection in animal A. TH containing (TH+) neurons are thought to reflect dopaminergic neurons. Much higher density of TH+ neurons is noted in the substantial nigra pars compacta (SNpc) ipsilateral to the MPTP injection side (Figure 1D, label “A”) than the contralateral SNpc (Figure 1E, label “D”). Furthermore, there is a dense plexus of TH+ fibers coalescing in the nigrostriatal bundle (Figure 1D, label “B”) just dorsal to the crus cerebria (Figure 1D, label “C”) on the ipsilateral SNpc, which is not seen on the contralateral SNpc (Figure 1E, label “C”) just dorsal to the crus cerebria (Figure 1E, label “E”). This is a strong confirmation of the reduction in dopaminergic neurons in the contralateral SNpc secondary to MPTP-administration.
Predictive Power of the Point Process Models
In order to assess the prediction power of the different terms in model (2–5) for each neuron in the dataset, we first computed the probability of spiking of the neuron at every time t conditioned on the histories HOt, HEt, and HSt. Then, we used these probabilities to evaluate the ROC curve and the correspondent AUC and IR values (Truccolo et al., 2010).
Figure 2 shows the prediction performance of the model (2–5) for a target neuron in M1 cortex (animal A) during 130 Hz DBS. The spike probability (≅ λ (t|Ht)Δ) was dynamically modulated up or down as a consequence of the spiking history (Figures 2A,B) and the model accurately captured the structure of the validation data after time rescaling (Figure 2C). The ROC curve (black line, Figure 2D) indicates that the dependency on history covariates (i.e., neuron's own history, ensemble's activity, and past DBS input sequence) in the point process model was substantial for spike prediction. Compared to an asymptotic chance level predictor (dotted line, Figure 2D) the model (2–5) increased the true-positive rate from 20% to almost 90% while keeping the false-positive rate less than 20%. A further comparison evaluated the relative contribution of the spiking history factors (3–4), and the DBS history (5). The model (2) with fixed λS = 1 (i.e., no DBS history added) resulted in lower true-positive rate and poor prediction performances (grey line, Figure 2D).
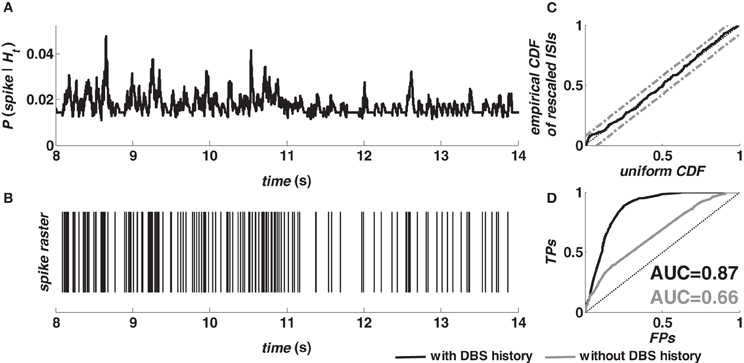
Figure 2. Evaluation of the fitting procedure for a target neuron in M1 cortex (animal A, normal) during 130 Hz DBS. (A) The predicted spiking probability was computed from the estimated model parameters, the spike train of the target neuron and the spike train of another neuron in the same ensemble. (B) Spike train of the target neuron in the same period. (C) Kolmogorov-Smirnov (KS) plot after time rescaling of the estimated model on the validation data. Grey lines are 95% confidence bounds. (D) ROC curve for the target neuron (TP = true-positive; FP = false-positive) on validation data. The color code in the legend also applies to the AUC values.
The AUC value provides a further assessment of the prediction power. The AUC depends on both true- and false-positive rates computed for all the possible thresholds on the spiking probability, and ranges from 0.5 (chance level predictor) to 1 (perfect predictor) (Bamber, 1975; Truccolo et al., 2010). The point process model with DBS history (Figure 2D) resulted in an AUC value »0.5, while the AUC decreased to 0.45 for the model estimated on the data recorded at rest from the same neuron. This difference between models estimated during vs. before stimulation extended to almost all the cortical neurons (Table 2). For example, in M1 cortex (animal A, normal), 100% of the point process models including the DBS input (20 out of 20) resulted in AUC > 0.6 and 65% of them (13 out of 20) in AUC > 0.7. Models estimated on the same neurons at rest, instead, had AUC > 0.5 in 82% of the cases (27 out of 33 models) but AUC > 0.6 only in 12% of cases (4 out of 33 models), and never AUC > 0.7. Similar results were obtained in both cortices and animals, and consistently occurred also under MPTP conditions.
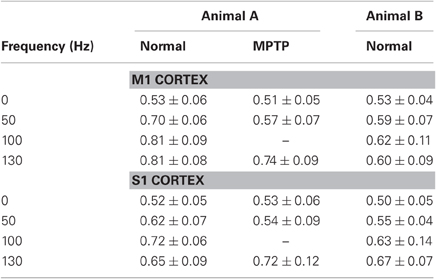
Table 2. AUC values (mean ± std.dev.).
A further assessment of the prediction power of the spiking and DBS histories vs. a history-independent Poisson process was provided by the IR (Table 3). In both cortices and disease conditions, the information rate was positive at rest (i.e., with no stimulation) and increased monotonically with the stimulation frequency. These facts suggest that (i) the point process models captured the neuronal dynamics better than a Poisson process both at rest and during DBS, and that (ii) the predictive power of the DBS history increased with the stimulation frequency.
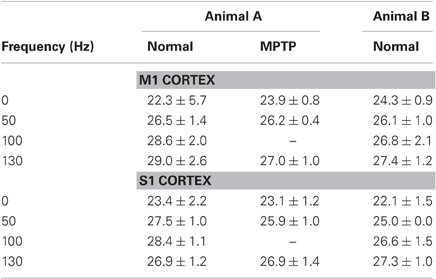
Table 3. Information Rate (IR, in bits/s) (mean ± std.dev.).
Effects of DBS on Post-Stimulus Discharge Probability
We used normalized post-stimulus time histograms (PSTH, Montgomery, 2006) to determine how the probability of spiking of the cortical neurons modulates between consecutive STN DBS pulses. Briefly, the PSTH consists of counts of neuronal discharges in 0.08 ms time bins in the inter-stimulus interval following each DBS pulse, and was normalized to the pre-stimulation baseline activity (z-score). A significant (p < 0.05) post-stimulus increase (decrease) in neuronal activity was indicated at any lag from the DBS pulse when the correspondent value of the z-score in the PSTH was >1.96 (<−1.96)
Examples of PSTH are in Figure 3 (second row) for 100-DBS-normal in both animals. The probability of a spike increased 2–4 ms after the DBS pulse, when compared with the pre-stimulation activity, was modulated downward in the following 2–3 ms, and finally increased again 7–8 ms after the pulse, while the artifact lasts ~1 ms in both cortices (Figures 3C,D top row).
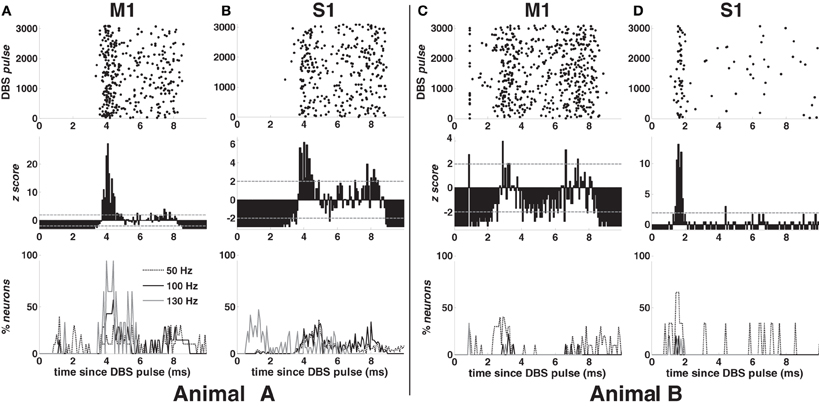
Figure 3. Response to the DBS pulse in animal A (A,B) and B (C,D) in normal condition. First row (top): post-stimulus time raster of a neuron in M1 (A,C) and S1 (B,D) cortex during 100 Hz STN DBS. Second row: post-stimulus time histogram (PSTH) normalized to the pre-DBS neuronal activity for the neurons whose raster is depicted in the top row. Grey dashed lines indicate significance levels (±1.96). Third row (bottom): percentage of neurons with z-score >1.96 during the inter-stimulus time interval in M1 (A,C) and S1 (B,D) cortex for various DBS frequencies. Legend in (A) also applies to (B–D).
In both cortices, the post-stimulus response was highly temporally consistent (small jitter, Figures 3A,B,D top row), which suggests that the increased activity at 2–4 ms may reflect the activation of the neuron. This activation was presumably due to the orthodromic response of monosynaptic connections, which perhaps involve antidromically activated collaterals of cortical neurons projecting to the vicinity of the STN. On the other hand, in approximately 40% of the neurons in M1 cortex (both animals), the activity increased about 1.2 ms after the DBS pulse (Figure 3C), which could be due to direct antidromic activation.
Figure 3 (bottom row) shows the incidence of the post-stimulus activation over the cortices for each DBS frequency in both animals. In M1 cortex (Figures 3A,C), early (~1.2 ms after the DBS pulse) and highly consistent response occurred in 40% of neurons with 50- and 130-DBS-normal but was negligible during 100-DBS-normal (animal A: 1 out of 7 neurons; animal B: 0 out of 9 neurons). A delayed response 2–4 ms after the pulse, instead, occurred in ~60% of neurons with 100-DBS-normal (animal A: 4 out of 7 neurons; animal B: 5 out of 9 neurons) and 100% of neurons with 130-DBS-normal (animal A only), but only in 30–40% of the cells under 50-DBS-normal. In S1 cortex (animal A), the first response occurred approximately 4 ms after the DBS pulse for non-therapeutic DBS frequencies, while with 130-DBS-normal 40–50% of neurons had a spike between 0.8 and 1.28 ms after the pulse (Figure 3B).
Interestingly, despite the shape of the PSTH was consistent across the neuronal populations and the animals (e.g., see Figures 3A–D, second row), the percentage of neurons with significant post-stimulus activation had a different trend across the two animals (e.g., compare Figures 3A,C, bottom row). This can be explained by noting that the average value of the z-score in animal B was generally lower than in animal A, which resulted in a smaller percentage of bins with a significant modulation of the post-stimulus activation (i.e., either z-score >1.96 or <−1.96).
The post-stimulus spiking propensity is further characterized by the model parameters {γν}8ν = 1 in (5) (Figures 5I–K), which capture the impact of the DBS sequence. Compared with parameters in (3) and (4), {γν}8ν = 1 show the relative incidence of the DBS input. Therefore, Figures 5I–K indicate that (i) the incidence of DBS increases with the stimulation frequency over the contributions in (3) and (4) and that (ii), under HF DBS, the probability of spiking largely depends on when the DBS pulse is delivered.
Effects of DBS on Recurrent Activation Patterns in Normal Conditions
The recurrent activation patterns were classified as short-term (i.e., period of the pattern between 3 and 7 ms) or long-term (i.e., period between 30 and 50 ms) in order to capture different simultaneous dynamics and compare their relative impact on the neuronal population. These time periods correspond to the parameters {βr}18r = 1 and capture both recurrent non-periodic activations in the beta frequency band (the long-term patterns) and fast phenomena (short-term patterns).
With 0-DBS-normal, recurrent short-term patterns [“recurrent fast patterns” (RFPs)] occurred in approximately 30% of the M1 neurons in both animals (Figure 4B). Similarly, long-term patterns were detected in both animals, but the percentage of M1 neurons was different (animal A: 60%; animal B: 20%, Figure 4C). Only ~20% of S1 neurons showed recurrent activation patterns with 0-DBS-normal in both animals (Figures 4E,F).
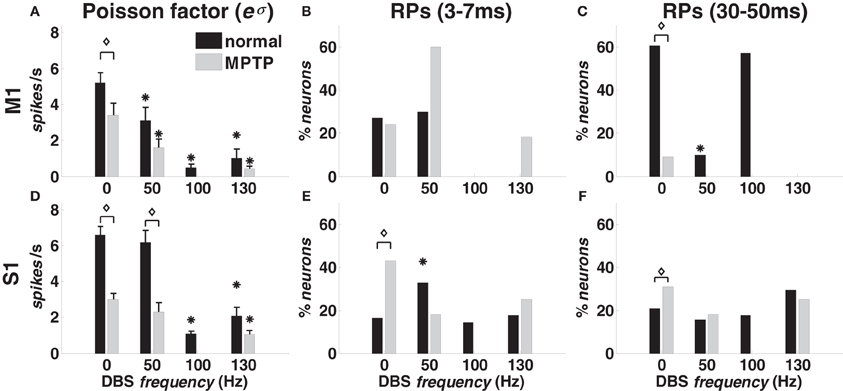
Figure 4. Poisson factor and recurrent activation patterns (RPs) in M1 (A–C) and S1 (D–F) cortex in normal (black bars) and MPTP (grey bars) conditions (animal A), both at rest (0 Hz) and under DBS (50, 100, 130 Hz). (A,D) Population-mean value of the Poisson factor eσ (mean ± S.E.M.). (B,E) Percentage of neurons with RFPs (3–7 ms period). (C,F) Percentage of neurons with long-term patterns (30–50 ms period). Asterisks indicate significant differences under DBS vs. no DBS (in A,D: t-test, p < 0.05; in B,C,E,F: χ2-test, p < 0.05). Diamonds indicate significant difference in MPTP vs. normal conditions (in A,D: t-test, p < 0.05: in B,C,E,F: χ2-test, p < 0.05).
DBS impacted both the activation patterns and the Poisson factor eσ. In both cortices and animals, DBS decreased the average value of eσ (Figures 4A,D), which accounts for the incidence of the history covariates and the variability of the spiking patterns across the population, i.e., high values of eσ are associated with high variability and low impact of the spiking histories. Also, for any neuron n*, if eσ is close to the correspondent average discharge rate, then the spiking activity of n* can be approximated on average with a Poisson process with (constant) mean = eσ, i.e., eσ measures the similarity between the neuron's own discharge pattern and a Poisson process.
We found that the value of eσ was lower than the average discharge rate for all the cortical neurons, thus confirming that the history dependency was substantial to characterize the spiking propensity. Also, the Poisson factor eσ decreased with the DBS frequency in both cortices but the reduction was significant (p < 0.05) only with 100- and 130-DBS-normal.
In M1 cortex, DBS decreased the fraction of neurons with recurrent patterns (Figures 4B,C): the percentage of neurons with RFPs was lower (χ2-test, p < 0.05) under 100- vs. 0-DBS-normal, and the percentage of neurons with long-term patterns was lower under 50- vs. 0-DBS-normal. With 130-DBS-normal, no M1 neuron in animal A and only 1 out of 9 neurons in animal B had significant activation patterns.
Figures 5A–D show the population-mean value of the parameters {βr}18r = 1 vs. the history bins for the M1 cortex. The relative impact of the RFPs vs. the long-term patterns was similar at rest (Figure 5A) but changed under DBS. In particular, 50-DBS-normal increased the dependency on the very recent history (last 5–6 ms) and one specific recurrent long-term pattern (25–30 ms period, Figure 5B), which means that, at any time t, a spike was likely elicited if spikes occurred 5–6 ms and 25–30 ms earlier. 100- and 130-DBS-normal, instead, reduced the impact of every pattern (Figures 5C,D) and, differently from 50-DBS-normal, remarkably increased the impact of the DBS history (Figures 5I–K), as noted in the previous section.
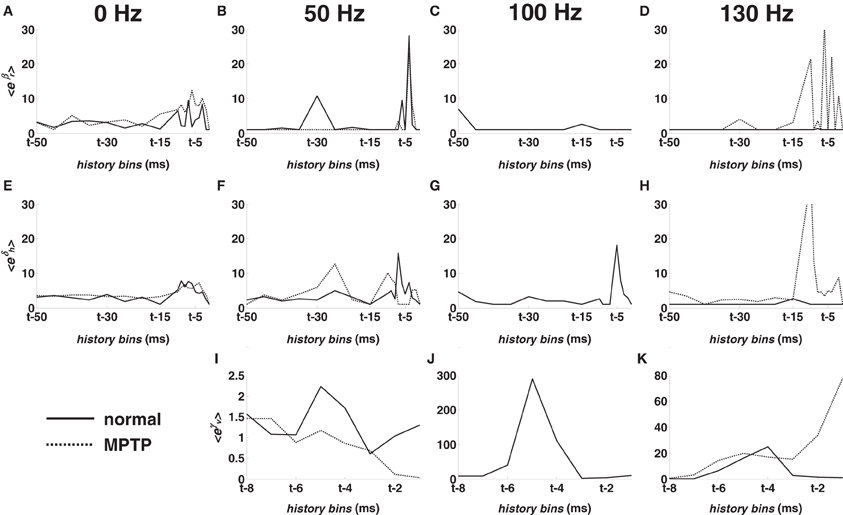
Figure 5. Population-mean value of the point process model parameters for M1 cortex in normal (solid line) and MPTP (dashed line) conditions (animal A). (A–D) Mean value of eβr, r = 1, …, 18. (E–H) Mean value of eδh, h = 1, …, 18. (I–K) Mean value of eγν, ν = 1, …, 8. Parameters are depicted vs. the history bins for a generic time t. Parameters in the first column were estimated at rest (0 Hz). Parameters in the following columns were estimated under 50, 100, 130 Hz STN DBS, respectively.
In S1 cortex, DBS induced mild modulation of the recurrent activation patterns (Figures 4E,F), presumably because of smaller impact of the spiking histories (i.e., smaller fluctuations of λO) and higher values of the Poisson factor in S1 vs. M1 cortex, both at rest and during DBS.
Effects of DBS on Cortical Ensembles in Normal Conditions
For every ordered pair of neurons (n1,n2) in the same ensemble, we inferred dependencies of n1 on n2 by looking at the parameters {δh,n2}18h = 1 estimated for n1. These dependencies were classified as short-term (lag: 3–7 ms) or long-term (lag: 30–50 ms), and the number of ordered neuronal pairs included in this study is in Table 1.
With 0-DBS-normal, approximately 35% of M1 pairs from animal A and 20% from animal B showed recurrent dependencies (Figures 6A,B). With 50- and 100-DBS-normal, the fraction of pairs with dependencies did not significantly change compared with 0-DBS-normal. With 130-DBS-normal, short-term dependencies [“fast ensemble dependencies” (FEDs)] were suppressed in both animals (Figure 6A), while long-term dependencies were suppressed in animal A and affected only 15% of M1 population in animal B (Figure 6B). In S1, no ensemble dependency was significantly affected by the DBS frequency (Figures 6C,D).
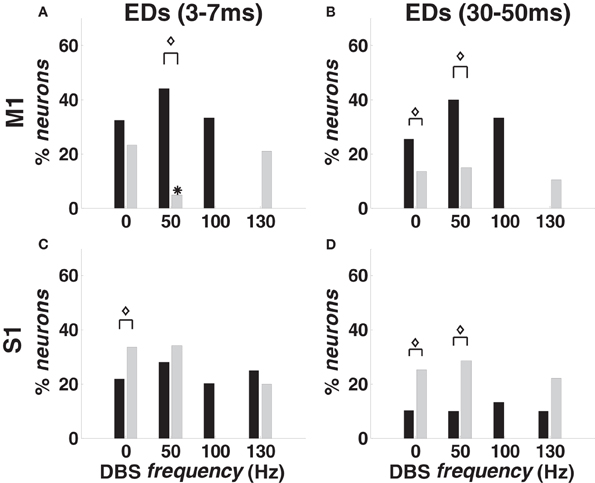
Figure 6. Temporal ensemble dependencies (EDs) in M1 (A,B) and S1 (C,D) cortex in normal and MPTP conditions (animal A), both at rest (0 Hz) and during DBS (50, 100, 130 Hz). (A,C) Percentage of neurons with FEDs (3–7 ms period). (B,D) Percentage of neurons with long-term dependencies (30–50 ms period). Color code, asterisks and diamonds are as in Figure 4.
Figures 5E–H shows the population-mean value of the parameters {δh,q}18h = 1 vs. the history bins at rest and during DBS in M1 cortex. The recent spiking history (last 5–6 ms) of the ensemble had higher impact on the spiking propensity under non-therapeutic DBS vs. no-DBS conditions, thus suggesting a synchronous activity through the ensemble.
Effects of DBS in MPTP vs. Normal Conditions
In both cortices, the PSTH with 130-DBS-MPTP showed an early temporally consistent response, which could be antidromic. The lag between the first post-stimulus spike and the DBS pulse was smaller with 130-DBS-MPTP than 130-DBS-normal both in M1 cortex (0.96 vs. 1.52 ms) and S1 cortex (0.88 vs. 1.28 ms), and the fraction of neurons with early response was higher with 130-DBS-MPTP than 130-DBS-normal in M1 (73 vs. 30%).
The point process model parameters show that the percentage of S1 neurons with RFPs and FEDs was higher (p < 0.05) in 0-DBS-MPTP than 0-DBS-normal (Figures 4E,6C), while long-term patterns and dependencies in M1 were significantly lower with 0-DBS-MPTP than 0-DBS-normal (Figures 4C,6B). 130 Hz STN DBS had similar effects on the neuronal dynamics in MPTP and normal conditions (Figure 5), but the fraction of M1 neurons with FEDs was lower with 50-DBS-MPTP than 50-DBS-normal (Figure 6A).
Discussion
In this study we found that (i) MPTP increases the activation patterns and the ensemble dependencies at rest in neurons from the S1 cortex of non-human primates, (ii) the effects of DBS depend on the stimulation frequency and the disease conditions, and (iii) therapeutic 130 Hz STN DBS reduces short-term patterns and dependencies and evokes a short-latency phase-locked increment of the spiking activity, while non-therapeutic 50 Hz DBS reduces the burstiness of the spike trains (Gale, 2004).
Our work exploited single unit recordings and point process models of the neuronal spike trains whose prediction power was measured with the ROC curve and the information rate. These measures reveal that the prediction power of the DBS input increases with the stimulation frequency while the spike variability (which is captured by the Poisson factor eσ) decreases under HF DBS.
Effects of DBS on Normal Cortical Discharge Patterns
The analysis of the point process models (2–5) indicate that, in the M1 cortex (normal conditions), 100–130 Hz DBS suppresses the history-dependent activation patterns and ensemble dependencies, decreases the Poisson factor, and increases the impact of the DBS history (higher AUC and IR values). These results suggest that the likelihood of a spike in the M1 neurons becomes strictly dependent on whether and when the DBS pulse is delivered, while the variability of the spiking patterns across the population decreases. Although not implying classical synchronization (i.e., constant phase lag among spike trains), these observations suggest that the cortical patterns stochastically depend on DBS and the dependency increases with the stimulation frequency, thus overriding other existing intrinsic dependencies. A reduction of the Poisson factor, on the other hand, is consistent with the reduced variability of the STN under DBS (Gale et al., 2009) and indicates a regularization of the cortical spiking patterns.
Pattern regularization and pattern overriding have been speculated as potential therapeutic mechanisms of HF DBS (Montgomery and Baker, 2000; Johnson et al., 2008; Montgomery and Gale, 2008; Dorval et al., 2010). It has been shown that HF regular DBS of both STN and GPi improves the PD motor symptoms while bursting or modulated DBS patterns (with the same frequency and target) worsen the symptoms both in MPTP animals (Ma and Wichmann, 2004) and PD patients (Montgomery, 2005). Also, simulation studies showed that irregular neuronal activity is associated with low information processing capacity, whereas more regular high frequency activity increases the information processing (Montgomery and Baker, 2000; Montgomery and Gale, 2008). Our results, therefore, suggest that therapeutic HF DBS would restore the information processing capacity of the cortex by masking the misinformation coming from the BG-thalamic loop with more regular patterns. These considerations, however, cannot be conclusive as the animals in this study were resting, so no clear prediction about the physiologic changes during movement can be derived from this data (Montgomery and Gale, 2008).
Our analysis shows that RFPs and FEDs are reduced more than the long-term patterns and dependencies with 100- and 130-DBS-normal. Also, the point process models for M1 neurons show higher sensitivity to short-term histories and dependencies during non-therapeutic DBS, and the incidence of RFPs vs. long-term patterns increases under MPTP conditions. These facts suggest that suppressing the RFPs and FEDs could have some relevance for the therapeutic mechanisms of HF DBS.
The lower sensitivity to long-term patterns vs. RFPs is counterintuitive because exaggerated cortical oscillations in the beta band (15–35 Hz, which is covered by the long-term patterns in our study) have been found both in PD patients (Marsden et al., 2001; Silberstein et al., 2005; Brown, 2007; Hammond et al., 2007) and animal models of Parkinsonism (Goldberg et al., 2004; Mallet et al., 2008; Degos et al., 2009) at rest, and the reduction of these oscillations in PD patients has been found proportional to the improvement of the motor symptoms under HF DBS (Silberstein et al., 2005). Therefore, higher modulation of the long-term patterns during HF DBS would have been expected. However, the relationship between motor impairment and beta oscillations under HF DBS has been determined only for some of the PD motor symptoms (bradykinesia and rigidity) and has involved patients with severe PD (Hammond et al., 2007), while the relationship is not univocal in untreated patients (Silberstein et al., 2005; Hammond et al., 2007). Therefore, the exaggerated beta oscillations could be just a manifestation of the severe motor impairment (which does not happen in any of the conditions in our study) and their suppression could be a secondary effect of the overall therapeutic mechanisms of HF DBS. Also, the activation patterns and ensemble dependencies are more general than the (stationary) notion of “oscillation.” These patterns and dependencies, indeed, characterize the neuronal dynamics and may capture recurrent non-periodic activation sequences in the ensembles. Finally, differences between our study and the others may be related to the type of signals analyzed. The studies cited above, indeed, utilize local field potentials, which reflect averaged synaptic-driven activities in the dendrites (Lopes da Silva, 1991) and represent neuronal input over relatively large tissue volumes. Our study, instead, uses extracellular action potentials (spike trains), which reflect highly spatially-restricted neuronal outputs.
The physiological origins of these sequences, however, remain unclear. They could be due to orthodromic stimuli from the cortico-BG-thalamo-cortical loop (Hashimoto et al., 2003; Nishibayashi et al., 2011) or to patterned synaptic sequences from cortico-cortical networks [e.g., synfire chains, (Ikegaya et al., 2004), collective dynamics (Truccolo et al., 2010), etc.].
The abundance of RFPs, however, would be hardly conciliated with synfire chains or BG-thalamic projections, as the period (3–7 ms), which roughly indicates the most likely latency between two consecutive spikes, is close to the time of monosynaptic activation, whereas both mechanisms are polysynaptic. On the other hand, it could be possible that the polysynaptic activation is shortened because of a persistent depolarized state of the neurons, but our data indicates that, under HF DBS, the discharge rate is comparable or even higher than before stimulation, while the RFPs are suppressed. Finally, because we used regular DBS instead of bursts or random pulses, we cannot rule out the possibility that, under HF DBS, the latency between each DBS pulse and the correspondent effects is longer than the inter-pulse interval, i.e., we do not know whether the suppression of an activation pattern is due to the most recent DBS pulse or the pulse preceding the most recent one. In the latter case, the suppression of the RFPs under HF DBS could still be due to the block of polysynaptic mechanisms, although this would be hardly conciliated with the results under 50-DBS-normal (i.e., suppression of neuronal activity but mild change in RFPs).
A plausible, although purely speculative, interpretation could be that these short-term patterns are due to mechanisms intrinsic to the neuronal membranes (e.g., post-refractory period rebound), which are activated by random spikes elicited by multiple, phase-unlocked synaptic inputs (e.g., distal cortical neuron, thalamic projections, etc.). In this case, DBS would affect the neuronal membranes by shifting the rebound timing. For example, according to the PSTHs in Figure 3 and the model parameters in Figure 5, the likelihood of a spike is significantly high ~4 ms after a DBS pulse. This means that, if a spike occurred approximately 4 ms after a pulse, the rebound would occur 8–11 ms after the pulse and would be covered by the artifact of the next DBS pulse if the stimulation frequency is above 100 Hz, thus explaining the reduction in RFPs. Also, these changes deal with non-stationary phenomena and therefore have a minor impact on average measures.
Another important issue here is whether reinforcement mechanisms were evoked by DBS. We reported that 130 Hz DBS evoked highly temporally consistent short-latency responses in both cortices, which would rule out intervening synapses or BG-thalamo-cortical projections, and are most consistent with antidromic activation (Montgomery, 2006; Johnson et al., 2009). 50–100 Hz DBS, instead, elicited responses with longer latency and more temporal variability, which suggest monosynaptic orthodromic activation. Finally, the percentage of spike-evoking pulses was low for every DBS frequency, but higher during HF DBS in both animals (<2% with 50 Hz DBS; 5–12% with 100–130 Hz DBS).
We argue that the antidromic activation elicits a significant response only in a few neurons, while the monosynaptic orthodromic activation has a stronger impact and may be facilitated by recurrent patterns from thalamus, which would determine a depolarized state (Montgomery, 2004). In this case, during 130 Hz DBS, the antidromic stimulus elicited by a generic pulse n would overlap with the orthodromic effects of pulse n−2 and would reinforce the response to pulse n (Montgomery, 2004). This reinforcement, which has been speculated for long time without cortical evidence (Bar-Gad and Bergman, 2001; Montgomery, 2004), would represent a systems effect of DBS (Montgomery and Gale, 2008), is consistent with our frequency-dependent PSTHs, and would explain both the higher impact of the DBS history on the spike trains and the suppression of RFPs and FEDs.
MPTP vs. Normal Conditions
Recordings after MPTP treatment were performed in animal A only and resulted in smaller sets of neurons. Nevertheless, our study indicates that, at rest, (i) there was a larger fraction of S1 neurons with recurrent patterns and dependencies, (ii) the history dependencies had a stronger impact on the spike propensity (Figure 5), (iii) the ratio between the fractions of neurons with short- and long-term activation patterns was higher and the Poisson factor was lower after the MPTP treatment (both cortices).
These results suggest higher synchronization in S1 cortex and higher sensitivity to the ensemble activity in M1 cortex at rest under MPTP conditions. Also, the spiking propensity of the M1 neurons at rest is modulated similarly by short- (last 5–6 ms) and long-term spiking histories, and the fraction of neurons with long-term activation pattern reduce under MPTP, thus becoming similar to the fraction of neurons with short-term patterns. This lack of preferred patterns could be due to the suppression of long-term dependencies, which could originate from thalamo-cortical polysynaptic projections.
Finally, the average model parameters correspondent to short-term patterns and ensemble dependencies (10–15 ms lag) are larger under 130-DBS-MPTP than 130-DBS-normal (Figures 5D,H,K). This suggests that, under MPTP conditions, the response to HF DBS likely consists of a burst of a few spikes (3–4 at least, which covers a window of 10–15 ms) that are simultaneously fired by all the neurons in the same ensemble. Such a response could be an effect of the increased cortical synchronization and could involve sub-threshold depolarization mechanisms (e.g., calcium-mediated rebound activation phenomena), which would be consistent with a decreased MPTP-mediated cortical activity, as indicated by the lower value of the Poisson factor.
Conflict of Interest Statement
The authors declare that the research was conducted in the absence of any commercial or financial relationships that could be construed as a potential conflict of interest.
Acknowledgments
Dr. Sarma was supported by the Burroughs Wellcome Fund CASI Award 1007274, the National Science Foundation CAREER Award 1055560, and NIH R01NS073118-02. Dr. Gale was supported by the American Parkinson's Disease Association. Dr. Montgomery was supported by the Dr. Sigmund Rosen Fund of the University of Alabama at Birmingham.
References
Akaike, H. (1974). A new look at the statistical model identification. IEEE Trans. Aut. Control 19, 716–723.
Baker, K., Boulis, N. B., Rezai, A. R., and Montgomery, E. B. (2004). “Target selection using microelectrode recording,” in Microelectrode Recordings in Movement Disorder Surgery, ed Thieme (New York, NY: Thieme), 138–151.
Baker, K. B., Montgomery, E. B. Jr. Rezai, A. R., Burgess, R., and Lüders, H. O. (2002). Subthalamic nucleus deep brain stimulus evoked potentials: physiological and therapeutic implications. Mov. Disord. 17, 969–983.
Bamber, D. (1975). The area above the ordinal dominance graph and the area below the receiver operating characteristic graph. J. Math. Psychol. 12, 387–415.
Bar-Gad, I., and Bergman, H. (2001). Stepping out of the box: information processing in the neural networks of the basal ganglia. Curr. Opin. Neurobiol. 11, 689–695.
Bar-Gad, I., Ritov, Y., Vaadia, E., and Bergman, H. (2001). Failure in identification of overlapping spikes from multiple neuron activity causes artificial correlations. J. Neurosci. Methods 107, 1–13.
Barbieri, R., Quirk, M. C., Frank, L. M., Wilson, M. A., and Brown, E. N. (2001). Construction and analysis of non-Poisson stimulus-response models of neural spiking activity. J. Neurosci. Methods 105, 25–37.
Brown, E. N., Barbieri, R., Eden, U. T., and Frank, L. M. (2003). “Likelihood methods for neural data analysis,” in Computational Neuroscience: a Comprehensive Approach, ed J. Feng (London, UK: CRC), 253–286.
Brown, E. N., Barbieri, R., Ventura, V., Kass, R. E., and Frank, L. M. (2002). The time-rescaling theorem and its application to neural spike train data analysis. Neural Comput. 14, 325–346.
Brown, P. (2007). Abnormal oscillatory synchronisation in the motor system leads to impaired movement. Curr. Opin. Neurobiol. 17, 656–664.
Buchholz, S. R., and Montgomery, E. B. (1988). Head restraint device for chronic recording of neural activity in the awake monkey. J. Neurosci. Methods 25, 139–141.
Cover, T. M., and Thomas, J. A. (1991). Elements of Information Theory. New York, NY: Wiley and Sons.
Cunic, D., Roshan, L., Khan, F. I., Lozano, A. M., Lang, A. E., and Chen, R. (2002). Effects of subthalamic nucleus stimulation on motor cortex excitability in Parkinson's disease. Neurology 58, 1665–1672.
Czanner, G., Eden, U. T., Wirth, S., Yanike, M., Suzuki, W. A., and Brown, E. N. (2008). Analysis of between-trial and within-trial neural spiking dynamics. J. Neurophysiol. 99, 2672–2693.
DeLong, M. R., and Wichmann, T. (2007). Circuits and circuit disorders of the basal ganglia. Arch. Neurol. 64, 20–24.
Degos, B., Deniau, J. M., Chavez, M., and Maurice, N. (2009). Chronic but not acute dopaminergic transmission interruption promotes a progressive increase in cortical beta frequency synchronization: relationships to vigilance state and akinesia. Cereb. Cortex 19, 1616–1630.
Dejean, C., Hyland, B., and Arbuthnott, G. (2009). Cortical effects of subthalamic stimulation correlate with behavioral recovery from dopamine antagonist induced akinesia. Cereb. Cortex 19, 1055–1063.
Dorval, A. D., Kuncel, A. M., Birdno, M. J., Turner, D. A., and Grill, W. M. (2010). Deep brain stimulation alleviates Parkinsonian bradykinesia by regularizing pallidal activity. J. Neurophysiol. 104, 911–921.
Doudet, D. J., Gross, C., Arluison, M., and Bioulac, B. (1990). Modifications of precentral cortex discharge and EMG activity in monkeys with MPTP-induced lesions of DA nigral neurons. Exp. Brain Res. 80, 177–188.
Fogelson, N., Williams, D., Tijssen, M., van Bruggen, G., Speelman, H., and Brown, P. (2006). Different functional loops between cerebral cortex and the subthalmic area in Parkinson's disease. Cereb. Cortex 16, 64–75.
Frank, L. M., Eden, U. T., Solo, V., Wilson, M. A., and Brown, E. N. (2002). Contrasting patterns of receptive field plasticity in the hippocampus and the entorhinal cortex: an adaptive filtering approach. J. Neurosci. 22, 3817–3830.
Gale, J. T. (2004). Basis of Periodic Activities in the BG-Thalamic-Cortical System of the Rhesus Macaque. Ph.D. thesis, Kent State University, OH.
Gale, J. T., Amirnovin, R., Williams, Z. M., Flaherty, A. W., and Eskandar, E. N. (2008). From symphony to cacophony: pathophysiology of the human basal ganglia in Parkinson's disease. Neurosci. Biobehav. Rev. 32, 378–387.
Gale, J. T., Shields, D. C., Jain, F. A., Amirnovin, R., and Eskandar, E. N. (2009). Subthalamic nucleus discharge patterns during movement in the normal monkey and Parkinsonian patient. Brain Res. 1260, 15–23.
Goldberg, J. A., Boraud, T., Maraton, S., Haber, S. N., Vaadia, E., and Bergman, H. (2002). Enhanced synchrony among primary motor cortex neurons in the 1-methyl-4-phenyl-1,2,3,6-tetrahydropyridine primate model of Parkinson's disease. J. Neurosci. 22, 4639–4653.
Goldberg, J. A., Rokni, U., Boraud, T., Vaadia, E., and Bergman, H. (2004). Spike synchronization in the cortex/basal-ganglia networks of Parkinsonian primates reflects global dynamics of the local field potentials. J. Neurosci. 24, 6003–6010.
Gradinaru, V., Mogri, M., Thompson, K. R., Henderson, J. M., and Deisseroth, K. (2009). Optical deconstruction of Parkinsonian neural circuitry. Science 324, 354–359.
Hahn, P. J., Russo, G. S., Hashimoto, T., Miocinovic, S., Xu, W., McIntyre, C. C., and Vitek, J. L. (2008). Pallidal burst activity during therapeutic deep brain stimulation. Exp. Neurol. 211, 243–251.
Hammond, C., Bergman, H., and Brown, P. (2007). Pathological synchronization in Parkinson's disease: networks, models and treatments. Trends Neurosci. 30, 357–364.
Hanajima, R., Ashby, P., Lozano, A. M., Lang, A. E., and Chen, R. (2004). Single pulse stimulation of the human subthalamic nucleus facilitates the motor cortex at short intervals. J. Neurophysiol. 92, 1937–1943.
Hashimoto, T., Elder, C. M., Okun, M. S., Patrick, S. K., and Vitek, J. L. (2003). Stimulation of the subthalamic nucleus changes the firing pattern of pallidal neurons. J. Neurosci. 23, 1916–1923.
Herzog, J., Pinsker, M., Wasner, M., Steigerwald, F., Wailke, S., Deuschl, G., and Volkmann, J. (2007). Stimulation of subthalamic fibre tracts reduces dyskinesias in STN-DBS. Mov. Disord. 22, 679–684.
Ikegaya, Y., Aaron, G., Cossart, R., Aronov, D., Lampl, I., Ferster, D., and Yuste, R. (2004). Synfire chains and cortical songs: temporal modules of cortical activity. Science 304, 559–564.
Johnson, M. D., Miocinovic, S., McIntyre, C. C., and Vitek, J. L. (2008). Mechanisms and targets of deep brain stimulation in movement disorders. Neurotherapeutics 5, 294–308.
Johnson, M. D., Vitek, J. L., and McIntyre, C. C. (2009). Pallidal stimulation that improves Parkinsonian motor symptoms also modulates neuronal firing patterns in primary motor cortex in the MPTP-treated monkey. Exp. Neurol. 219, 359–362.
Lalo, E., Thobois, S., Sharott, A., Polo, G., Mertens, P., Pogosyan, A., and Brown, P. (2008). Patterns of bidirectional communication between cortex and basal ganglia during movement in patients with Parkinson's disease. J. Neurosci. 28, 3008–3016.
Li, S., Arbuthnott, G. W., Jutras, M. J., Goldberg, J. A., and Jaeger, D. (2007). Resonant antidromic cortical circuit activation as a consequence of high-frequency subthalamic deep brain stimulation. J. Neurophysiol. 98, 3525–3537.
Lopes da Silva, F. (1991). Neural mechanisms underlying brain waves: from neural membranes to networks. Electroencephalogr. Clin. Neurophysiol. 79, 81–93.
Ma, Y., and Wichmann, T. (2004). Disruption of motor performance by basal ganglia stimulation. Soc. Neurosci. Abstr. 416.2, San Diego, CA.
Mallet, N., Pogosyan, A., Sharott, A., Csicsvari, J., Bolam, J. P., Brown, P., and Magill, P. J. (2008). Disrupted dopamine transmission and the emergence of exaggerated beta oscillations in subthalamic nucleus and cerebral cortex. J. Neurosci. 28, 4795–4806.
Marsden, J. F., Limousin-Dowsey, P., Ashby, P., Pollak, P., and Brown, P. (2001). Subthalamic nucleus, sensorimotor cortex, and muscle interrelationships in Parkinson's disease. Brain 124, 378–388.
Montgomery, E. B. (2004). Dynamically coupled, high-frequency reentrant, nonlinear oscillators embedded in scale-free basal ganglia-thalamic-cortical networks mediating function and deep brain stimulation effects. Nonlin. Stud. 11, 385–421.
Montgomery, E. B. (2005). Effect of subthalamic nucleus stimulation patterns on motor performance in Parkinson's disease. Parkinsonism Relat. Disord. 11, 167–171.
Montgomery, E. B. (2006). Effects of GPi stimulation on human thalamic neuronal activity. Clin. Neurophysiol. 117, 2691–2702.
Montgomery, E. B. (2008). Subthalamic nucleus neuronal activity in Parkinson's disease and epilepsy subjects. Parkinsonism Relat. Disord. 14, 120–125.
Montgomery, E. B., and Baker, K. B. (2000). Mechanisms of deep brain stimulation and future technical developments. Neurol. Res. 22, 259–266.
Montgomery, E. B., and Buchholz, S. R. (1991). The striatum and motor cortex in motor initiation and execution. Brain Res. 549, 222–229.
Montgomery, E. B., and Gale, J. T. (2008). Mechanisms of action of deep brain stimulation (DBS). Neurosci. Biobehav. Rev. 32, 388–407.
Montgomery, E. B., Gale, J. T., and Huang, H. (2005). Methods for isolating extracellular action potentials and removing stimulus artifacts from microelectrode recordings of neurons requiring minimal operator intervention. J. Neurosci. Methods 144, 107–125.
Nishibayashi, H., Ogura, M., Kakishita, K., Tanaka, S., Tachibana, Y., Nambu, A., Kita, H., and Itakura, T. (2011). Cortically evoked responses of human pallidal neurons recorded during stereotactic neurosurgery. Mov. Disord. 26, 469–476.
Paninski, L. (2004). Maximum likelihood estimation of cascade point-process neural encoding models. Netw. Comput. Neural Syst. 15, 243–262.
Paxinos, G., Huang, X. F., and Toga, A. W. (2000). The Rhesus Monkey Brain in Stereotaxic Coordinates. San Diego, CA: Academic Press.
Pillow, J. W., Shlens, J., Paninski, L., Sher, A., Litke, A. M., Chichilnisky, E. J., and Simoncelli, E. P. (2008). Spatio-temporal correlations and visual signalling in a complete neuronal population. Nature 454, 995–999.
Rivlin-Etzion, M., Elias, S., Heimer, G., and Bergman, H. (2010). Computational physiology of the basal ganglia in Parkinson's disease. Prog. Brain Res. 183, 259–273.
Rivlin-Etzion, M., Marmor, O., Saban, G., Rosin, B., Haber, S. N., Vaadia, E., Prut, Y., and Bergman, H. (2008). Low-pass filter properties of basal ganglia cortical muscle loops in the normal and MPTP primate model of Parkinsonism. J. Neurosci. 28, 633–649.
Santaniello, S., Gale, J. T., Montgomery, E. B., and Sarma, S. V. (2010a). Modeling the effects of deep brain stimulation on sensorimotor cortex in normal and MPTP conditions. Conf. Proc. IEEE Eng. Med. Biol. Soc. 2010, 2081–2084.
Santaniello, S., Gale, J. T., Montgomery, E. B., and Sarma, S. V. (2010b). Modeling the motor striatum under deep brain stimulation in normal and MPTP conditions. Conf. Proc. IEEE Eng. Med. Biol. Soc. 2010, 2065–2068.
Sarma, S. V., Eden, U. T., Cheng, M. L., Williams, Z. M., Hu, R., Eskandar, E. N., and Brown, E. N. (2010). Using point process models to compare neural spiking activity in the subthalamic nucleus of Parkinson's patients and a healthy primate. IEEE Trans. Biomed. Eng. 57, 1297–1305.
Saxena, S., Santaniello, S., Gale, J. T., Montgomery, E. B., and Sarma, S. V. (2010a). “Point process modeling of basal ganglia activity under deep brain stimulation,” Abstract. Neural Interfaces Conference, (Long Beach, CA), June 21–22.
Saxena, S., Santaniello, S., Montgomery, E. B., Gale, J. T., and Sarma, S. V. (2010b). Point process models show temporal dependencies of basal ganglia nuclei under deep brain stimulation. Conf. Proc. IEEE Eng. Med. Biol. Soc. 2010, 4152–4155.
Silberstein, P., Pogosyan, A., Kühn, A. A., Hotton, G., Tisch, S., Kupsch, A., Dowsey-Limousin, P., Hariz, M. I., and Brown, P. (2005). Cortico-cortical coupling in Parkinson's disease and its modulation by therapy. Brain 128, 1277–1291.
Snyder, D. L., and Miller, M. I. (1991). Random Point Processes in Time and Space. New York, NY: Springer.
Truccolo, W., Eden, U. T., Fellows, M. R., Donoghue, J. P., and Brown, E. N. (2005). A point process framework for relating neural spiking activity to spiking history, neural ensemble, and extrinsic covariate effects. J. Neurophysiol. 93, 1074–1089.
Truccolo, W., Hochberg, L. R., and Donoghue, J. P. (2010). Collective dynamics in human and monkey sensorimotor cortex: predicting single neuron spikes. Nat. Neurosci. 13, 105–111.
Watts, R. L., and Mandir, A. S. (1992). The role of motor cortex in the pathophysiology of voluntary movement deficits associated with Parkinsonism. Neurol. Clin. 10, 451–469.
Keywords: deep brain stimulation, Parkinson's disease, motor cortex, spike trains, point processes, receiver operating characteristic curve, information rate
Citation: Santaniello S, Montgomery EB Jr, Gale JT and Sarma SV (2012) Non-stationary discharge patterns in motor cortex under subthalamic nucleus deep brain stimulation. Front. Integr. Neurosci. 6:35. doi: 10.3389/fnint.2012.00035
Received: 08 February 2012; Accepted: 31 May 2012;
Published online: 25 June 2012.
Edited by:
Sidarta Ribeiro, Edmond and Lily Safra International Institute of Neuroscience of Natal, BrazilReviewed by:
Antonio Pereira, Federal University of Rio Grande do Norte, BrazilErich T. Fonoff, Hospital das Clinicas of University of São Paulo, Brazil
Copyright: © 2012 Santaniello, Montgomery, Gale and Sarma. This is an open-access article distributed under the terms of the Creative Commons Attribution Non Commercial License, which permits non-commercial use, distribution, and reproduction in other forums, provided the original authors and source are credited.
*Correspondence: Sabato Santaniello, Department of Biomedical Engineering, Institute for Computational Medicine, Johns Hopkins University, Baltimore, MD 21218-2686, USA. e-mail:c3NhbnRhbjVAamh1LmVkdQ==
† These authors contributed equally to this work.