 Amir H. Ghaderi
 Masoud N. Andevari2,3
 Paul F. Sowman
- 1Cognitive Neuroscience Laboratory, University of Tabriz, Tabriz, Iran
- 2Iranian Neuro-wave Laboratory, Center of Isfahan, Isfahan, Iran
- 3Department of Physics, School of Basic Science, Babol Noshirvani University of Technology, Babol, Iran
- 4Department of Cognitive Science, Faculty of Human Sciences, Macquarie University, Sydney, NSW, Australia
- 5ARC Centre of Excellence in Cognition and its Disorders, Macquarie University, Sydney, NSW, Australia
Neural network-based investigations of stuttering have begun to provide a possible integrative account for the large number of brain-based anomalies associated with stuttering. Here we used resting-state EEG to investigate functional brain networks in adults who stutter (AWS). Participants were 19 AWS and 52 age-, and gender-matched normally fluent speakers. EEGs were recorded and connectivity matrices were generated by LORETA in the theta (4–8 Hz), alpha (8–12 Hz), beta1 (12–20 Hz), and beta2 (20–30 Hz) bands. Small-world propensity (SWP), shortest path, and clustering coefficients were computed for weighted graphs. Minimum spanning tree analysis was also performed and measures were compared by non-parametric permutation test. The results show that small-world topology was evident in the functional networks of all participants. Three graph indices (diameter, clustering coefficient, and shortest path) exhibited significant differences between groups in the theta band and one [maximum betweenness centrality (BC)] measure was significantly different between groups in the beta2 band. AWS show higher BC than control in right temporal and inferior frontal areas and lower BC in the right primary motor cortex. Abnormal functional networks during rest state suggest an anomaly of DMN activity in AWS. Furthermore, functional segregation/integration deficits in the theta network are evident in AWS. These deficits reinforce the hypothesis that there is a neural basis for abnormal executive function in AWS. Increased beta2 BC in the right speech–motor related areas confirms previous evidence that right audio–speech areas are over-activated in AWS. Decreased beta2 BC in the right primary motor cortex is discussed in relation to abnormal neural mechanisms associated with time perception in AWS.
Introduction
Stuttering is a developmental disorder of speech fluency that affects 1% of all adults (Craig et al., 2002). The behavioral manifestations of stuttering include unplanned sound prolongations, blocks in speech, and syllabic repetitions at the start of words and sentences. Stuttering is also associated with abnormalities in complex cognitive functions such as language (Weber-Fox and Hampton, 2008), motor preparation (Mersov et al., 2016), time perception (Ezrati-Vinacour and Levin, 2001), and also attention (Kamhi and McOsker, 1982).
Over the last two decades, a body of neuroimaging research has amassed which suggests that stuttering likely emerges from deficiencies in the brain mechanisms that support fluent speech production (e.g., Chang et al., 2009, 2017). Structurally, stuttering is related to several abnormalities in cortical and subcortical brain areas such as the Broca’s area (BA 44, 45), the basal ganglia, supplementary motor area, and parasylvian cortex (Gordon, 2002; Büchel and Sommer, 2004; Chang et al., 2009; Loucks et al., 2011; Sowman et al., 2017) which can be linked to mechanistic explanations proposed to account for stuttering such as auditory–speech dysfunction (Liotti et al., 2010; Jansson-Verkasalo et al., 2014) and also a speech–motor impairment (Neilson and Neilson, 1987). More recently, neural network-based investigations of stuttering have begun to provide a possible integrative account that might account for the large number of brain-based anomalies (for review see: Brown et al., 2005; Budde et al., 2014; Belyk et al., 2015; Etchell et al., 2017) now associated with stuttering.
Studies using connectivity analyses and graph theoretical methods have demonstrated network abnormalities in stuttering during resting state (Xuan et al., 2012; Ghaderi et al., 2016; Chang et al., 2017) that may involve anomalies in the default mode network (DMN) and affect attentional and executive functions (Chang et al., 2017). Such studies provide an insight into the neural correlates of psychological dysfunctions, particularly anxiety, that have long been associated with stuttering (Craig, 1990; Menzies et al., 1999; Iverach et al., 2011). Recent studies such as that by Yang and colleagues provide evidence that some of the hitherto unexplained neural abnormalities evident in stuttering might be attributable to the close association between stuttering and anxiety (Yang et al., 2017). Indeed, their results bear considerable concordance with other investigations that suggest emotional states and disorders (e.g., depression and anxiety) are associated with functional deficits in DMN activity (Coutinho et al., 2016; Messina et al., 2016).
To date, investigations of brain networks in stuttering have largely relied on functional magnetic resonance imaging (fMRI; Luc et al., 2008; Chang et al., 2009; Loucks et al., 2011). fMRI remains the gold standard for defining the topographic nature of network dysfunction in stuttering due to its excellent spatial resolution; however, as it has been suggested that stuttering depends on abnormal timing of brief durations and deficits in rapid movement control, planning, and preparation (e.g., Etchell et al., 2014, 2015; Wieland et al., 2015), neurophysiological methods that provide higher temporal resolution than fMRI may provide complementary information about the nature of neural connectivity in stuttering. Electroencephalography (EEG) can be used to acquire an ongoing record of the electrical activity of the brain with excellent temporal resolution, but since the origin of brain waves is a combination of post-synaptic potentials in the pyramidal cortical neurons, the source of EEG waves is not generally well reflected by the current distribution on the scalp. This means that inter-electrode connectivity analyses cannot easily be reconciled with fMRI network measurements (Babiloni et al., 2005; Mizuhara et al., 2005). Low-resolution brain electromagnetic tomography (LORETA) is an approach to solve inverse electromagnetic problem which transforms the EEG scalp current topography into a gross approximation of the EEG sources in brain space (Pascual-Marqui et al., 1994, 2011; Pascual-Marqui, 2002). Using LORETA, one can obtain a highly temporally-resolved neural signal that is mapped onto brain space.
Graph theoretical analysis (GTA) has become an important method for the study of complex systems in the field of neuroscience as well as in physics, astronomy, genetics, and engineering (Boccaletti et al., 2006; Bullmore and Sporns, 2009). GTA has been used to reveal the topological properties of structural brain networks and functional associations between brain regions. Important properties of neural information propagation and processing such as segregation and integration, and modularity and efficiency have been characterized by GTA. Graph theoretical indices such as the clustering coefficient, global efficiency, and small-worldness are meaningful neurobiological measures that can be calculated quickly (Rubinov and Sporns, 2010).
Small-world topography (Watts and Strogatz, 1998) provides an optimal balance between segregation and integration (Rubinov and Sporns, 2010). In 1998, Watts and Strogatz introduced the concept of small-world graphs based on Stanley Milgram’s works in the late 1960s (Watts and Strogatz, 1998; Boccaletti et al., 2006). Small-world graphs are simultaneously highly integrated and also highly segregated. Dynamically, these graphs exist in a specific state between random and regular graphs (Watts and Strogatz, 1998). Studies indicate that the functional and structural topography of the human brain, as well as other self-organizing systems, exhibit small-world properties (Watts and Strogatz, 1998; Achard et al., 2006; Bassett and Bullmore, 2006; Wang J. et al., 2009), the conformations of which are affected by developmental disorders (Wang L. et al., 2009; Barttfeld et al., 2011).
A more recently developed approach, minimum spanning tree (MST) analysis, is a powerful technique that can clarify emergent properties of functional brain networks (Stam, 2014). In weighted graphs there are many loops, which consist of sets of edges that connect a node to itself. The presence of loops in a graph increases the connectivity cost (the number of routes and edges between nodes). Spanning trees are subsets of graphs that cover all nodes without any loop (Stam, 2014; Tewarie et al., 2015). The MST is the tree with the lowest total cost (Graham and Hell, 1985); the unique, unweighted, binary graph that is made by the shortest path between all pairs of nodes without the occurrence of a loop. Therefore, the minimum connectivity cost involved in spanning all nodes is recovered by MST analysis (Tewarie et al., 2015). MST has been widely applied in the investigation of functional brain connectivity during tasks and rest (Stam et al., 2014; van Lutterveld et al., 2017).
This study represents the first attempt to use quantitative EEG (QEEG), LORETA, and graph theory in the field of language-related disorders. Graph theoretical analysis is applied here to investigate the brain’s topological network properties in adults who stutter (AWS). Further, we investigate possible relationships between the centrality of candidate brain regions and stuttering. MST analysis is used as the GTA approach. Based on previous reports that suggest that oscillatory brain activity in the beta band is abnormal in stuttering (Salmelin et al., 2000; Etchell et al., 2016; Mersov et al., 2016), we hypothesize that networks connected by coherent beta oscillations in stuttering will be compromised compared to those in controls. Since abnormal attention and executive network abnormalities have been observed in AWS (Chang et al., 2017) we also predict that language network abnormalities will be evident in AWS alongside abnormalities in the default mode and executive networks. This hypothesis is in line with previous findings that suggest stuttering is a disorder related to impaired working memory (Kaganovich et al., 2010), attention (Kaganovich et al., 2010), self-control (Eggers et al., 2013), and linguistic processing speed (Anderson and Wagovich, 2010).
Materials and Methods
Participants
Nineteen AWS [74% male, aged between 19 and 31 years, mean age (SD) 24.02 (3.65) years] and 52 age-, and gender-matched normally fluent speakers [fluent; 71% male, aged between 19 and 32 years mean age (SD) 24.47 (4.78) years] participated in this study. AWS participants were recruited from the Aftab Clinic in the city of Isfahan. Fluent speakers (controls) were recruited via an online announcement. All participants were native Persian speakers with no reported history of psychiatric/neurological disorders/diseases or use of medications that might affect neural function (e.g., medication for depression or seizure). All participants had normal hearing and normal or corrected-to-normal vision. At the time of testing, the Stuttering Severity Instrument for Adults—Fourth Edition (SSI–4) was administered by a speech therapist to each of the AWS and their stuttering severities were rated to be between mild and severe (Riley, 1972). A consent form was signed by all participants after the aim and procedure of the study was explained to them. The study conformed to the Helsinki declaration obligations and was approved by central ethical committee at Islamic Azad University.
EEG Recording, Technical Setup, and Signal Pre-processing
EEG was recorded from 19 scalp electrodes (Fp1, Fp2, F3, F4, C3, C4, P3, P4, O1, O2, F7, F8, T3, T4, T5, T6, Fz, Cz, and Oz) positioned according to the 10–20 standard systems. A further two electrodes were positioned at left and right preauricular points (A1 and A2). EEGs were recorded using a Brain Master Discovery 24 amplifier and Electro-cap (eci). A linked-ear reference, commonly used in QEEG studies (Rotondi et al., 2016) was used. EEG cancelation is minimized by this montage (Sanei and Chambers, 2013). Impedance was kept under 5 kΩ during recording. Recordings were performed in an electromagnetically shielded faraday cage. EEG was digitized at 250 Hz and a low pass filter (40 Hz cutoff) was applied to avoid aliasing effects. Eight minutes of eyes open resting state EEG was recorded from each participant (Wu et al., 2010). Participants were instructed to avoid body or eye movements during the recording.
After recording, signals were screened for artifacts visually by an expert and then submitted to a z-score based artifact rejection algorithm implemented in the NeuroGuide software1. Twenty-five artifact-free segments (each segment was between 4 and 5 s in duration) were selected and exported for LORETA source localization.
LORETA Analysis
Functional connectivity between 84 regions of interests (ROIs) was obtained by LORETA software version 201702202. LORETA estimates cortical sources of brain waves based on the distribution of scalp-recorded potentials (Pascual-Marqui, 2002). This algorithm works as an inverse solution method and use a smoothness matrix that optimizes the solution (see Pascual-Marqui et al., 1994 for details). Recent versions of LORETA provide a connectivity utility (Pascual-Marqui et al., 2011). Functional dynamic connectivity of cortical regions with high temporal resolution can be calculated by LORETA. Although the number of EEG electrodes has a relationship to the precision of source estimation, a number of previous studies indicate that a reliable LORETA estimation can be achieved with only 19 channels (e.g., Thatcher et al., 2014; Aoki et al., 2015; Emory et al., 2015; Alahmadi et al., 2016; Clemens et al., 2016; Hata et al., 2016; Mohan et al., 2016b; Mumtaz et al., 2017). Time-resolved activity in all Brodmann areas excepting areas 12, 14, 15, 16, and 26 (localization of these regions is not implemented in the LORETA software) was estimated and the lagged coherences between 84 ROIs (42 Brodmann areas in the left hemisphere and 42 Brodmann areas in the right side) were computed for four frequency bands [theta (4–8 Hz), alpha (8–12 Hz), beta1 (12–20 Hz), and beta2 (20–30 Hz)]. The length of selected segments was at least 4 s and the sampling rate was 250 Hz (at least 1000 samples for each segment). The number of time frames per epoch selected in the LORETA software was 1024.
Connectivity Measure and Adjacency Matrix
Non-instantaneous or lagged coherence is a methodological approach to frequency domain connectivity that removes the effects of volume conduction in EEG co-spectra (Pascual-Marqui, 2007; Pascual-Marqui et al., 2011). Lagged coherence has been used to investigate functional connectivity in resting-state brain networks in several disorders, e.g., Olbrich et al. (2013), Mohan et al. (2016a), Schwartz et al. (2016). However, to our knowledge, brain connectivity in AWS has not yet been investigated with lagged coherence.
The 84 by 84 adjacency matrices were calculated separately in the theta, alpha, beta1, and beta2 bands. In the adjacency matrix, each row and each column represents a Brodmann area, and the lagged coherences between pairs of Brodmann areas are quantified at their intersections. Weighted and undirected adjacency matrices for the two groups (AWS and controls) are presented in Figure 1.
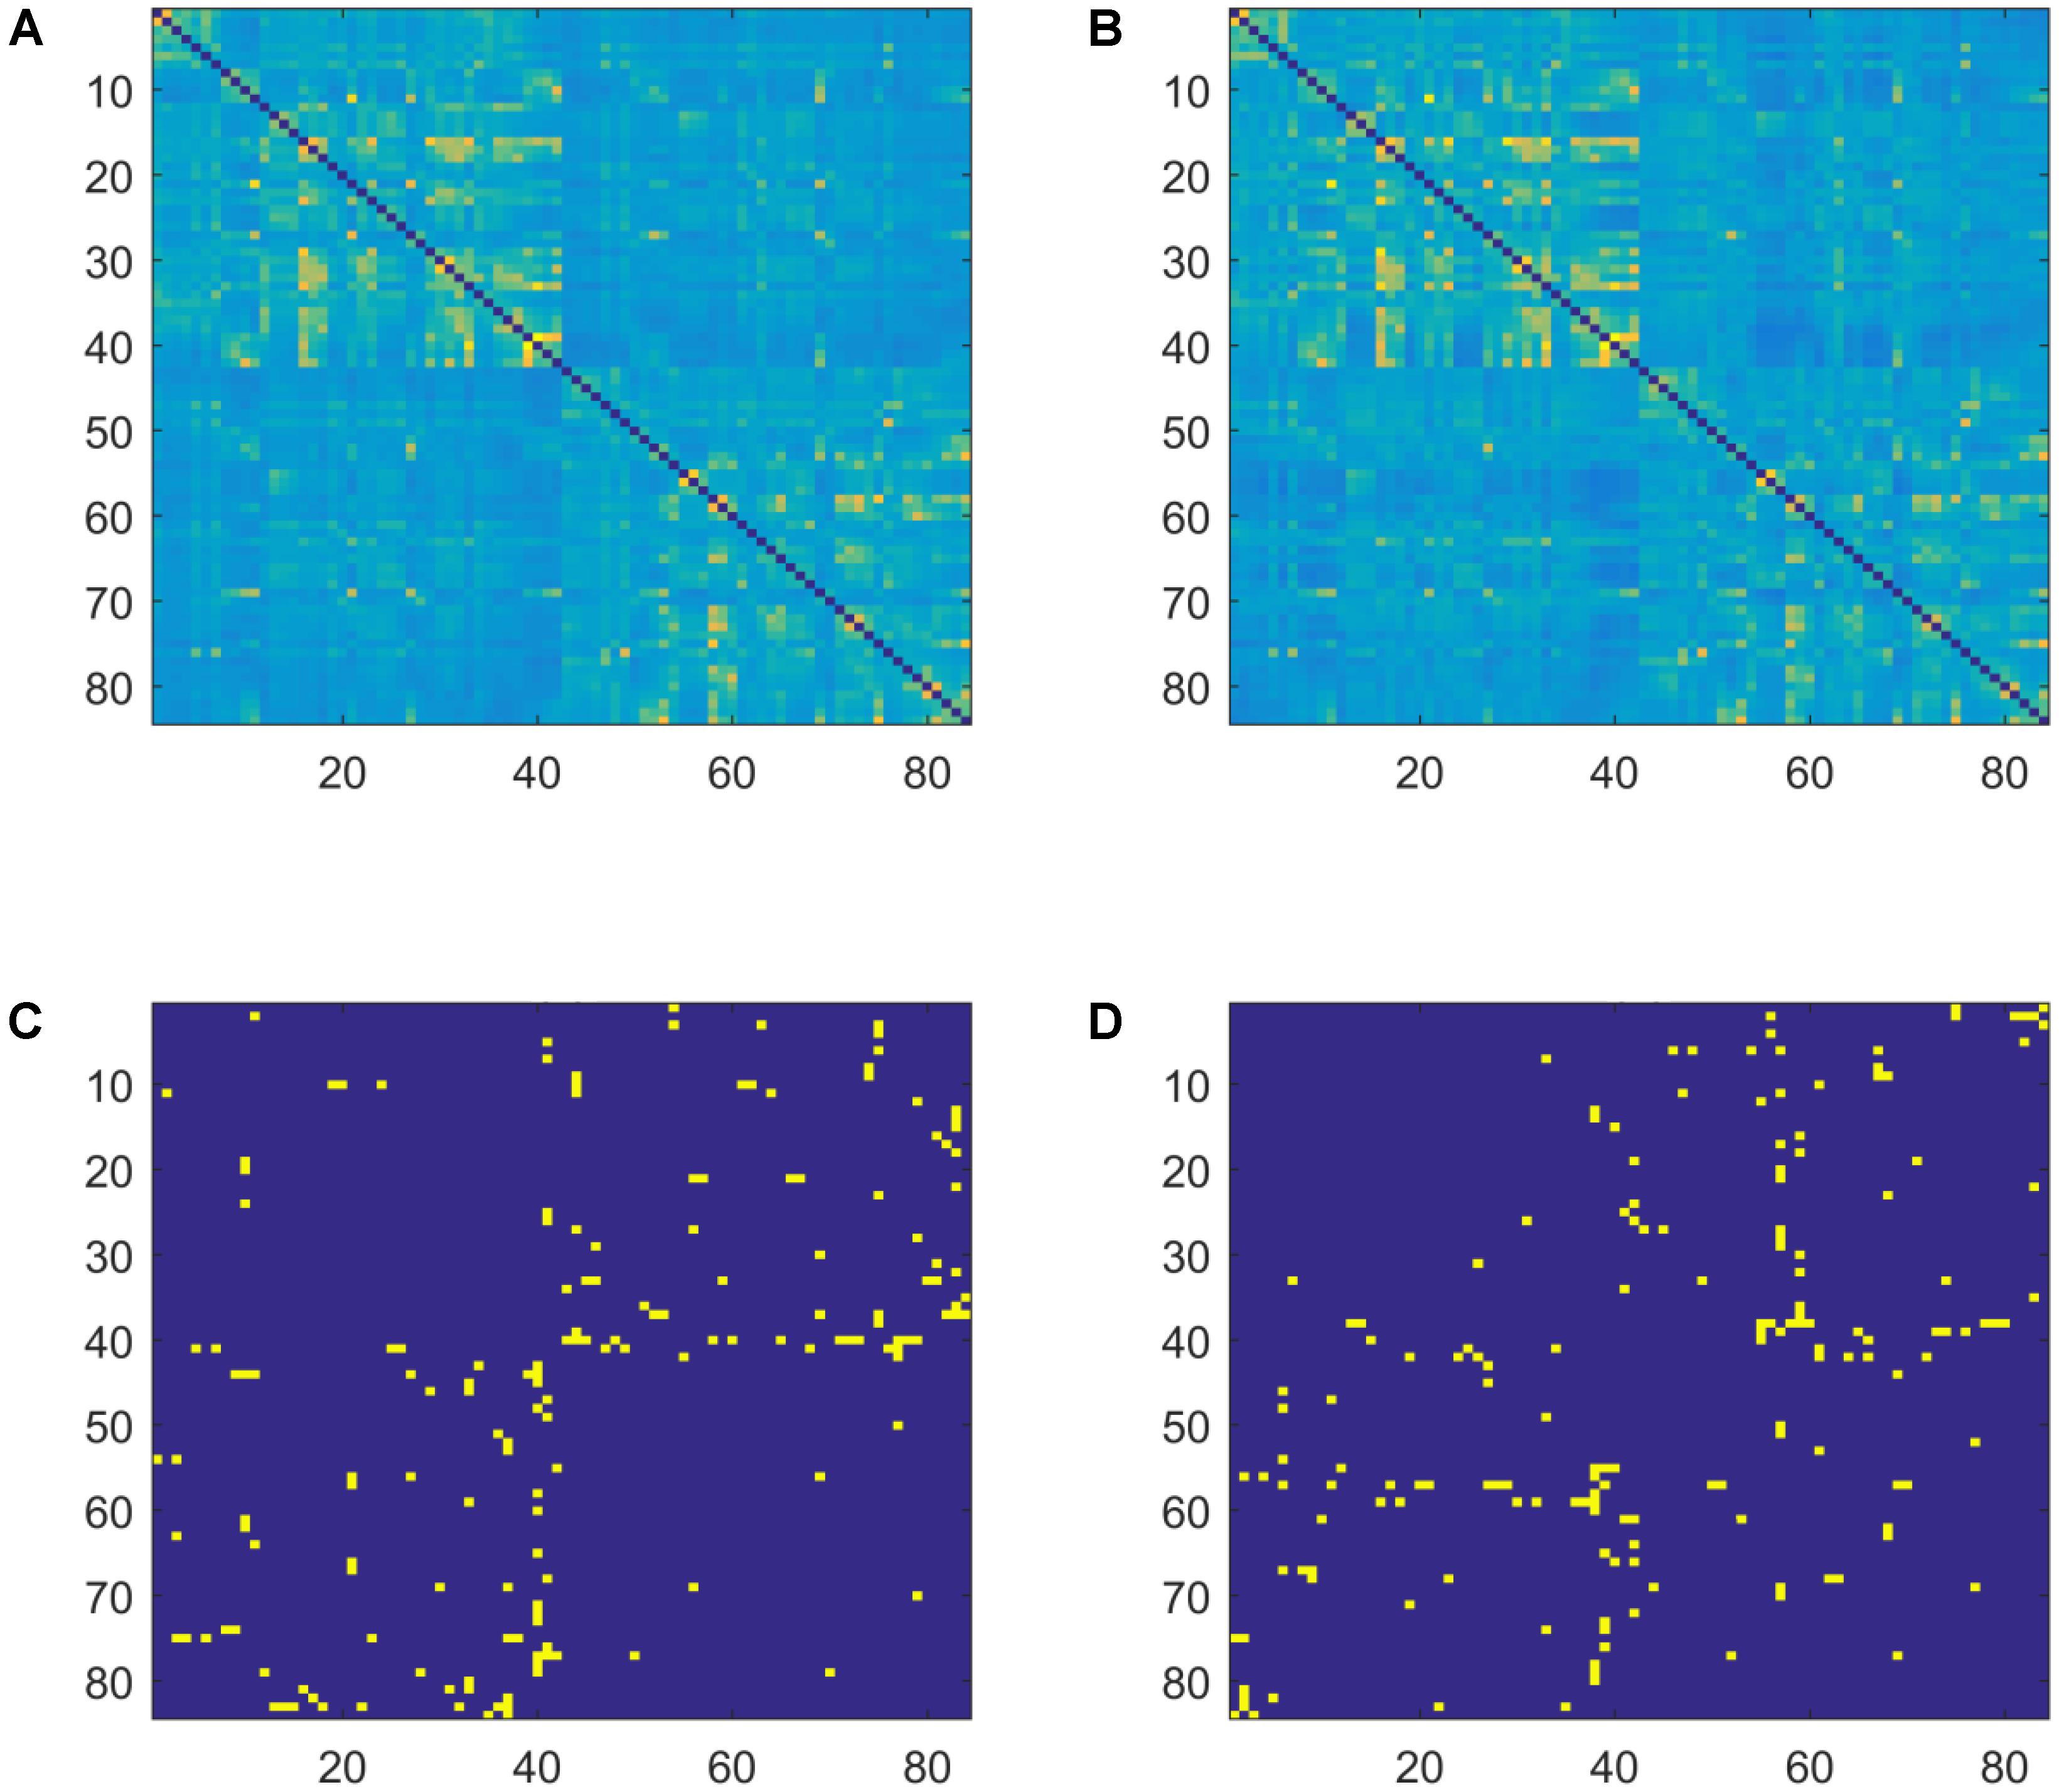
FIGURE 1. Weighted and sparse (MST) adjacency matrices for the two groups (AWS and control) in the beta2 band. (A) Averaged weighted adjacency matrix for controls. (B) Averaged weighted adjacency matrix for AWS. (C) Average MST adjacency matrix for controls. (D) Average MST adjacency matrix for AWS. Different patterns are visually observable between the MST graphs.
Small-World Properties, Shortest Path, and Clustering Coefficient of Weighted Graph
Before 1998, graphs were classified generally as either random or regular (Boccaletti et al., 2006). In a random graph, edges are connected randomly to nodes and a node’s degree (the number of edges connected to each node) conforms to a Gaussian distribution (Boccaletti et al., 2006). Since the shortest path between nodes is typically small, random graphs are highly integrated. However, at the local level, there are no significant clusters between nodes and therefore random graphs are not segregated. Conversely, in a regular graph, all nodes have the same degree. In these graphs, the shortest path is long, and therefore, integration is minimal and segregation high.
In the majority of previous studies utilizing GTA analysis, small-world topography has been calculated for binary, non-weighted, and undirected graphs. This represents the simplest form of graph that requires the least computation and programing for calculation of small-worldness (Boccaletti et al., 2006; Humphries and Gurney, 2008). However, in a binary graph, there is only information pertaining to the existence or not of connections; connectivity strength between nodes is not visible.
Commonly, an adjacency brain connectivity matrix contains connectivity measures between nodes (electrodes or brain regions) that are not binary (e. g. coherence is a scalar that lies in the range 0 to 1; phase lag falls between -1 and +1, etc.). Therefore, the original adjacency brain connectivity matrix is a weighted matrix. For simplification, thresholding can be applied to transform weighted matrices to binary forms (Rubinov and Sporns, 2010; Mohan et al., 2016b; Ghaderi et al., 2017). In this approach, all of the matrix arrays with values higher than the threshold are replaced by 1 and all other array values set to zero. Although this approach has been used widely, e.g., Achard et al. (2006), Mohan et al. (2016b), Ghaderi et al. (2017), two basic problems are inherent in this approach. First, there is no specific threshold that must be used to make binary matrices, and therefore the choice of threshold can greatly influence the resulting structure of the graph (Tewarie et al., 2015). By systematically investigating the threshold “space,” any bias may be countered, but a second problem then arises in the statistical analysis where the use of multiple thresholds greatly increases the number of comparisons being made. To avoid these problems, analysis of weighted graphs has been proposed. Recently, a new measure, Small-World Propensity (SWP), has been proposed for identification of small-world properties of weighted networks (Muldoon et al., 2016). SWP compares clustering coefficient and characteristic shortest paths of a given network using lattice and random graphs:
Where, ΔCis Clattice-Cgiven divided by Clattice-Crandom and ΔLis Lgiven-Lrandom divided byLlattice-Lrandom. In this equation, Lattice and random graphs have the same size (number of nodes) and the same distribution of degree (probability distribution of degrees over all nodes) within the given network (Muldoon et al., 2016).
As indicated in the above equation, SWP is related to the characteristic shortest path (L) and clustering coefficient (C). L is the average minimum number of edges between all pairs of nodes. The clustering coefficient is defined by the number of triangles around a given node relative to the number of all neighbors (Boccaletti et al., 2006) and is closely related to brain modularity and segregation (Bullmore and Sporns, 2009; Rubinov and Sporns, 2010).
Here, random graphs with the same degree distribution and same size were made by permutation of adjacency matrices. Then L, C, and SWP were calculated for the stuttering group and control using a MATLAB toolbox at http://www.seas.upenn.edu/~dsb/ developed by Muldoon et al. (2016). For assessing SWP measures for the two groups, the SWP of 50 randomly permuted graphs was calculated and compared to the adjacency matrices.
Minimum Spanning Tree (MST) and Integration Measures
The aforementioned problems involved thresholding the connectivity matrix are overcome by transforming the original weighted matrix into a unique sparse matrix. Functional brain connectivity using the MST approach can be quantified by the derived measures of maximum BC, nodal degree, leaf fraction (LF), diameter, and eccentricity (van Lutterveld et al., 2017).
BC is calculated by the counting all of the shortest paths that pass through a given node. Nodal degree is comparable to BC (it is simpler than BC). Degree is equal to the number of edges that are connected to a node. Nodes with a higher degree or BC play an important role in information processing within a graph (Boccaletti et al., 2006). It is suggested that a graph with higher maximum BC is more integrated (Bullmore and Sporns, 2009; Stam et al., 2014). LF relates to the integrative properties of the brain network (Stam et al., 2014; van Lutterveld et al., 2017). In a MST, the LF is equal to the number of nodes with degree 1 divided by N - 1, where N is the number of nodes in the graph. Therefore, a tree with a central node connected to all other nodes has maximum LF (equal to 1) and is highly integrated. Conversely, a tree with a series of one-to-one connected nodes exhibits the lowest possible LF (near zero) and also minimal integration (Stam et al., 2014). On the other hand, the maximum path length in a tree is defined as its diameter. Higher diameter is negatively associated with brain integration (Bullmore and Sporns, 2009; Stam, 2014). Eccentricity of a node is related to nodal isolation and average nodal eccentricity shows the tendency of nodes within the network to be isolated and poorly integrated (Rubinov and Sporns, 2010; Stam et al., 2014; van Lutterveld et al., 2017). Here, MST analysis on the 84 by 84 adjacency matrices was performed using MATLAB R2016a and the biograph toolbox. The measures of tree (e.g., BC, degree, LF, diameter, and eccentricity) were obtained via the brain connectivity toolbox developed by Rubinov and Sporns (2010)3.
Statistical Analysis
Non-parametric permutation tests (Maris and Oostenveld, 2007) were applied to compare the between-subject measures of graph indices within frequency bands. Each permutation contained 5000 random shuffles. Seven graph indices (SWP, L, C, maximum BC, LF, diameter, and average eccentricity) were compared in four frequency bands (theta, alpha, beta1, and beta2) and then 28 (7 indices × 4 frequencies) independent permutation tests were performed. To minimize the possibility of false positives resulting from multiple comparisons, False Discovery Rate (FDR) correction was applied. The resulting q-values (corrected p-values in FDR) less than 0.05 were accepted as indicating statistically significant differences.
To evaluate the local corporation of cortical regions, BC and eccentricity of all Brodmann areas was investigated using a separate non-parametric permutation test. This latter analysis was performed only at the frequencies that maximum BC or/and average eccentricity was significant. FDR correction was also applied to minimize the likelihood of type I errors that might arise through comparison of 84 Brodmann areas over multiple frequencies. Non-parametric statistical tests were performed in MATLAB R2016a.
Results
Figure 2 shows that both the controls and AWS exhibit SWP values over 0.6 in all frequency bands. Conversely, randomly permuted graphs show SWP less than 0.6. As suggested by Muldoon et al. (2016), SWP values over 0.6 are indicative of small-world networks. Therefore, all of the brain-based graphs (in both groups) exhibit small-world properties that are significantly different from random graphs (Figure 2).
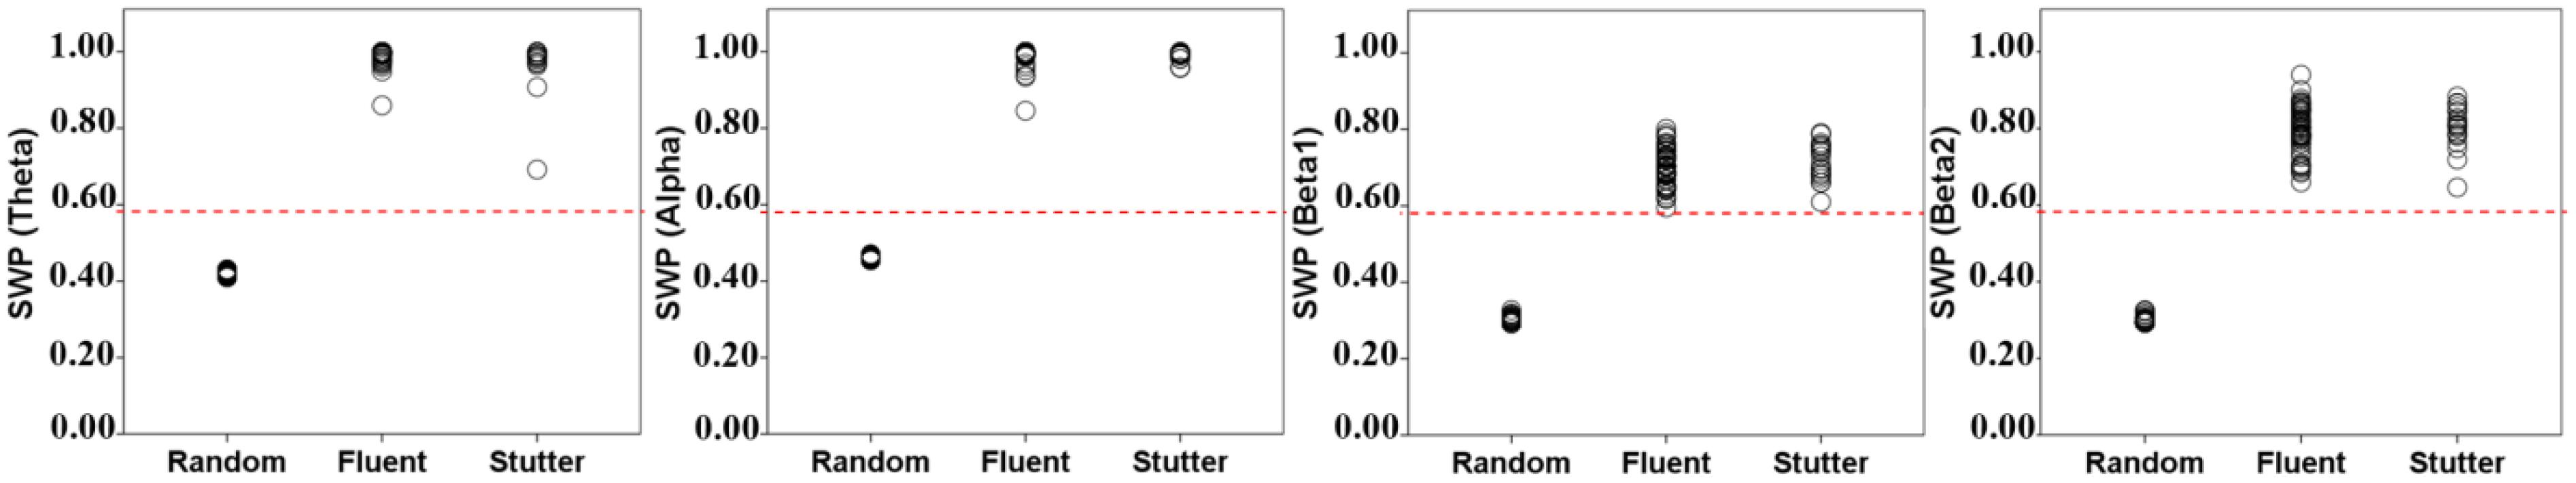
FIGURE 2. SWP measures for all samples in permuted random graphs (group 1), the control group (group 2), and the AWS group (group 3). The control and AWS groups exhibit values higher than 0.6, indicating that they have small-world connectivity. Permuted random graphs exhibit values less than 0.6.
After FDR correction, three graph indices exhibited significant differences between groups in the theta band and one measure was significantly different between groups in the beta2 band.
In the theta band a significant difference between groups occurred in the diameter of MST (t = -2.83, P = 0.0001). In this band, the AWS group had a smaller diameter (mean = 13.894, SD = 2.051) than the fluent control group (mean = 15.750, SD = 2.573). Significant differences were also observed between the two groups in the measures of characteristic shortest path (t = 2.71, q = 0.003) and clustering coefficient (t = -2.81, q = 0.002). The fluent group had a lower characteristic shortest path and a higher clustering coefficient (respectively: mean = 1.061, SD = 0.026; mean = 0.937, SD = 0.019) than the AWS group (respectively: mean = 1.080, SD = 0.029; mean = 0.922, SD = 0.023).
In the beta2 band, a significant difference was seen in the maximum BC of MST (t = 3.04, q = 0.007). The AWS group (mean = 5023.684, SD = 574.688) had a higher maximum BC than did the control group (mean = 4659.608, SD = 398.141). There were no significant differences in any measures in the alpha and beta1 bands between groups.
Since there was a significant difference between groups in the maximum BC in the beta2 band, BC of MST was investigated for the 84 Brodmann areas. After FDR multiple comparison correction, significant differences between the stuttering group and controls were observed in the right hemisphere; primary motor cortex (BA4; t = -2.03, q = 0.001), inferior temporal lobe (BA 20; t = 3.02, q = 0.0001) as a part of the DMN, and a part of the inferior frontal gyrus (BA 47; F = 2.84, q = 0.0001). There was no significant difference in the BC in the left hemisphere. The normally fluent group exhibited higher BC in BA 4 than the AWS group. However, they showed lower values of BC in BA 20 and 47 than the AWS group. Significant differences in BC are visually presented in the Figure 3.
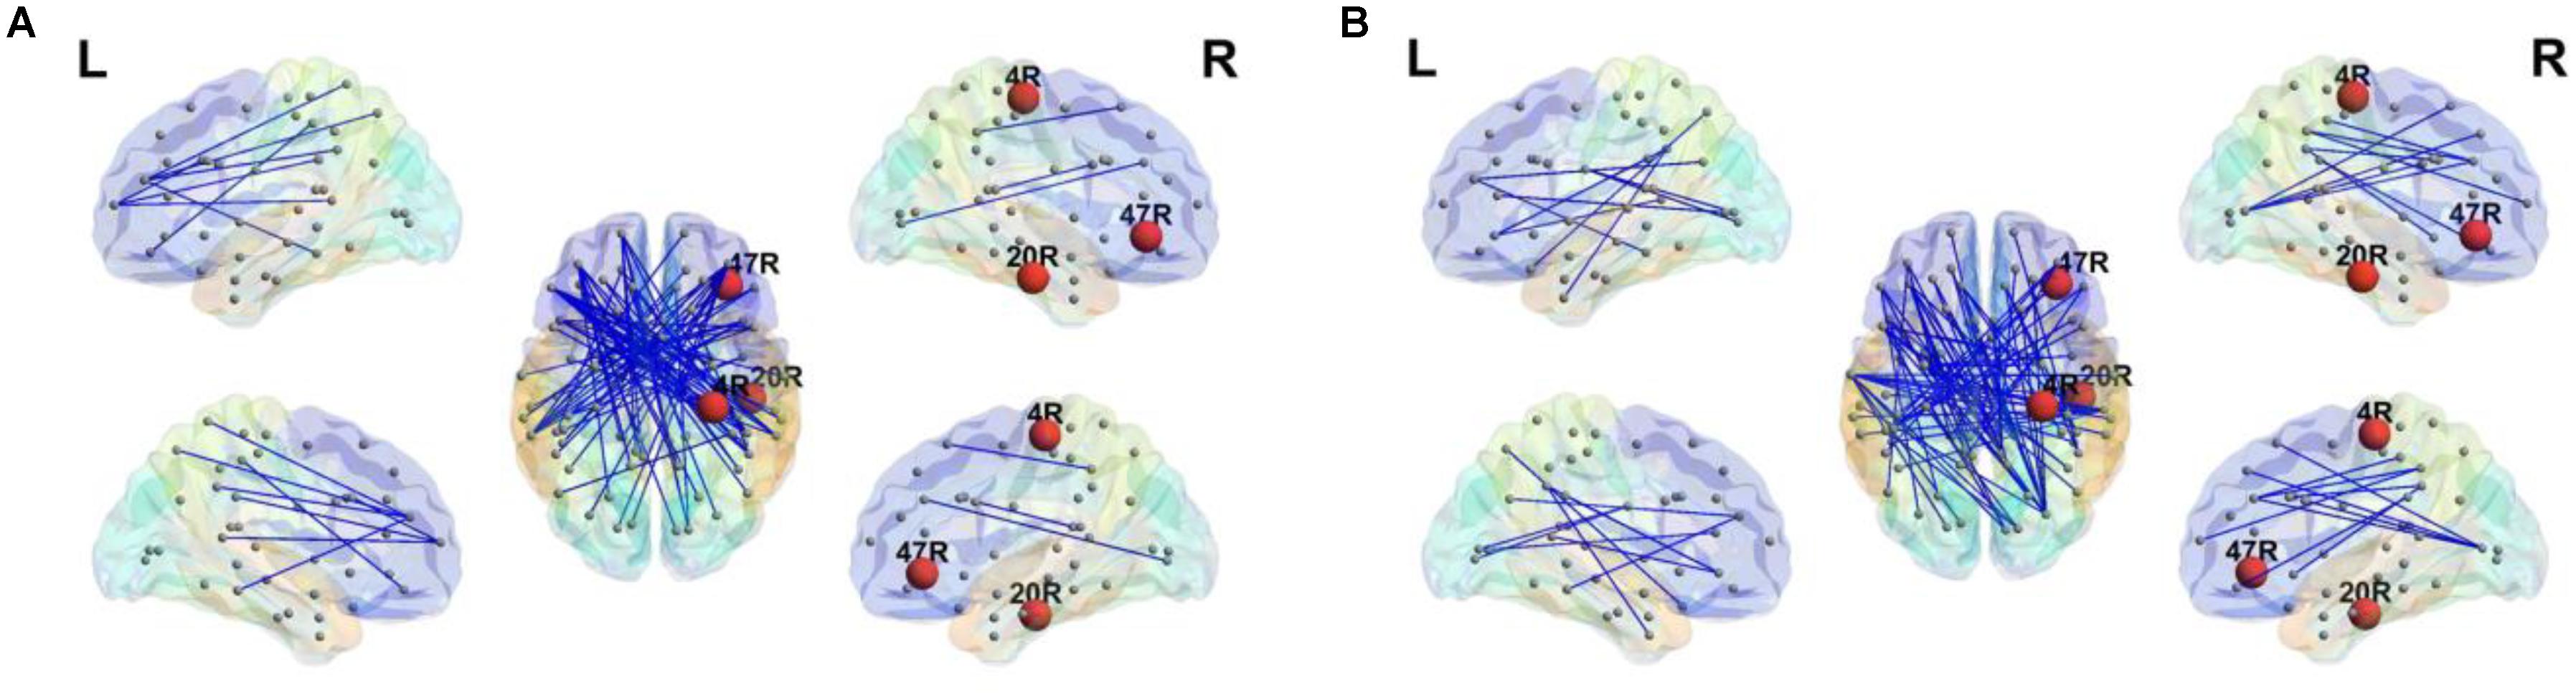
FIGURE 3. Minimum spanning tree in the beta2 band. Significant differences of BC (red nodes) were observed for right primary motor cortex (4R), right inferior temporal lobe (20R) and right inferior frontal gyrus (47R). The stuttering group (A) shows higher BC than the fluent group (B) in 20R and right 47R. The AWS exhibit lower BC in 4R. The figure was generated using BrainNet viewer toolbox version 1.53 (Xia et al., 2013).
Weighted and sparse MST graphs for the beta2 band are presented in Figure 1. While the weighted graphs are visually similar between groups, differences are evident in the sparse MST matrices. Topological MSTs are presented in Figure 3.
Discussion
These results indicate that alterations in very fast fluctuations and synchronization of post synaptic dipole arrangements, in various brain regions involved in generating EEG coherence, are associated with stuttering. Both groups studied here show small-world networks in the functional brain connectivity, and all participants exhibit SWP higher than 0.6. Since a graph with small-world topology exhibits an optimized and enhanced signal-propagation speed and synchronizability (Watts and Strogatz, 1998), optimized information transformation and propagation occurs in adult who stutter (AWS) as well as in controls. However, functional deficits in weighted graphs and MST analysis were observed in the theta and beta2 bands in AWS. Significant differences between controls and AWS in BC are also observable in the right primary motor area, inferior temporal lobe, and inferior frontal cortex. AWS show higher BC than controls in right temporal and inferior frontal areas and lower BC in right primary motor cortex. We discuss these results in the following two sections with regard to the functional meaning of brain oscillations and the regions involved in the observed functional connectivity deficits in AWS.
Alpha Wave: The Role of Emotion in Stuttering
The role of alpha activity in emotional states such as anxiety (Boutcher and Landers, 1988; Knyazev et al., 2006) and depression (Gotlib, 1998; Fingelkurts et al., 2007) has been widely investigated. Several studies suggest that those who stutter exhibit higher levels of anxiety (e.g., social anxiety or social phobia) than people whose speech is fluent (Mahr and Torosiana, 1999; Messenger et al., 2004; Iverach and Rapee, 2014). However, our results indicate that, at least during resting conditions, AWS exhibit alpha connectivity that is not different from that seen in control subjects. This result is consistent with previous studies that explain anxiety in stuttering as a secondary reaction (Alm, 2004). In the context of a possible alpha difference in AWS that might be based on reactive anxiety, then, in the current study where the AWS were at rest, it might not be expected that alpha network differences between groups would be evident.
Theta Wave: The Role of Executive Network in Stuttering
In the theta band, AWS have a higher value of characteristic shortest path and a lower value of clustering coefficient than controls, suggesting that the theta network is disrupted at both local and global levels in AWS. Theta-mediated networks in AWS are less integrated and also less segregated.
Theta activity is closely associated with executive functions such as problem solving, planning, working memory, and also attention (Sauseng et al., 2005; Mizuhara and Yamaguchi, 2007). Further, functional connectivity in the theta band is related to activity in central executive networks (Sauseng et al., 2004, 2005) and abnormal theta connectivity during rest state may suggest impaired DMN function (Scheeringa et al., 2008). Abnormal functional connectivity in the theta network is reported in attention-related disorders such as attention deficit hyper activity disorder (ADHD) during rest (Ghaderi et al., 2017) and during tasks (Sauseng et al., 2007). Similar to our current findings in AWS, in ADHD impaired functional segregation and integration in the theta network is evident (Ghaderi et al., 2017). Such similarities reinforce the hypothesis that there is a neural basis for abnormal executive functions among the stuttering group that may explain previous findings that indicate impairment of working memory (Kaganovich et al., 2010), attention (Kaganovich et al., 2010), self-control (Eggers et al., 2013), and also linguistic processing speed (Anderson and Wagovich, 2010) in stuttering. This result may also help explain the reported treatment effects of attentional training (Nejati et al., 2013) and also mindfulness (Boyle, 2011) in stuttering.
MST analysis indicates that there is no regional theta-mediated abnormality in AWS. This finding, in combination with the aforementioned local and global anomalies of the theta network, may suggest that attentional deficits in AWS are related to the functional connectivity of the whole brain rather than those within a specific module (e.g., middle frontal lobe as a hub in executive network).
Beta Wave: The Role of Motor Timing and Audio–Speech Regions
Many studies have investigated the role of motor, speech and auditory related impairments in stuttering, e.g., (Büchel and Sommer, 2004; Watkins et al., 2008; Chang et al., 2009). These confirm motor–speech (Watkins et al., 2008) and audio–speech (Luc et al., 2008; Chang et al., 2009) deficits exist, at least at the neural level, in stuttering. The current results reaffirm that functional brain differences in AWS occur in both primary motor related regions and also audio-speech areas. We show that the BC of beta2 mediated connections is decreased in the right primary motor cortex in AWS. A node with high BC lies on a large number of shortest paths. Nodes with significant association in information transfer often have high BC while BC is zero for a dead-end node (Barthelemy, 2004; Rubinov and Sporns, 2010). Decreased BC in right primary motor cortex suggest that this area plays a reduced role in neural communication and information propagation within the cortico-cortical networks in AWS. This result is comparable with previous findings that show hypo-activity of the cortical motor and premotor areas in stuttering (Salmelin et al., 2000; Watkins et al., 2008). Previous findings suggest that abnormal motor and pre-motor activity during speech tasks may be causal in stuttering (Packman, 2012). However, the present results were obtained during resting state and could therefore fit with an explanation that posits DMN deficits in stuttering (Xuan et al., 2012; Chang et al., 2017).
Recently it has been suggested by Etchell et al. (2014, 2016) that stuttering is a timing deficit disorder underpinned by abnormal functioning of beta-mediated timing networks (see also Alm, 2004). According to the broader literature in this area (Buhusi and Meck, 2005; Fujioka et al., 2009; Kononowicz and van Rijn, 2015; Merchant and Bartolo, 2017), beta activity in the basal ganglia-thalamocortical circuits (measured by EEG/MEG from central brain locations) can be considered in relation to interval timing. Behaviorally, deficits in response timing tasks are frequently reported in people who stutter (Ezrati-Vinacour and Levin, 2001; Olander et al., 2010; Falk et al., 2015) and recently it has been suggested that impairment of resting state functional connectivity is involved in time discrimination deficits in stuttering (Chang et al., 2016). Since beta activity in primary and supplementary motor cortices is associated with activity of basal ganglia-thalamocortical circuit (Kropotov, 2010), decreased BC of primary motor cortex in resting state beta2 adds further, albeit indirect, neural evidence for a deficit in interval timing networks in stuttering that involve the striatum.
AWS exhibit increased beta2 BC in the right speech–motor related areas during resting state. This result suggests that extra information is transferred via right audio–speech regions and that hyper propagation of beta signals occurs in this region. Increased activity of right audio–speech areas has previously been observed in studies using fMRI (Luc et al., 2008; Chang et al., 2009). Therefore, as suggested by other authors (Luc et al., 2008; Chang et al., 2009), AWS may require more neural activity in right audio–speech regions to compensate for deficiencies elsewhere. It could be posited that decreased signal propagation in the right primary cortex causes an imbalance in the neural network and hence shortest paths are transferred from right audio–speech regions.
Study Limitations
Two limitations that affect this study should be considered. Firstly, as LORETA accuracy is dependent to an extent on the EEG montage density, the relatively small number of electrodes we were limited to suggest that some caution regarding interpreting absolute source localization accuracy should be exercised. However, this is always the case with EEG source analysis, and the fact that the results presented here are both physiologically plausible and in strong concordance with previous studies mitigate this concern. Furthermore, whilst there is some evidence that suggests montage density positively correlates with deep source reconstruction accuracy, a clear relationship to reconstruction of superficial sources is less clear (Liu et al., 2018). Secondly, whilst not an absolute limitation, our choice of referencing scheme, the linked ear montage, whilst widely used in similar studies e.g., Hata et al. (2016), is not universally accepted as the best option for EEG studies in source space. Future studies would be advised to systematically address the implications of the choice of reference scheme on possible functional connectivity deficits in AWS.
Conclusion
Our results reinforce previous findings that DMN deficits occur in stuttering (Xuan et al., 2012; Chang et al., 2017). Altered networks found in AWS include attentional circuits, primary motor regions and also audio–speech related areas. We found decreased functional integration and segregation comparable to that seen in other developmental disorders (Ghaderi et al., 2017) but no local impairments in specific regions were evident. AWS also show impairment in the beta network in primary motor cortex and audio-speech areas. We suggest that abnormal activity in the beta network may relate to timing deficits and hypo-activation of motor related areas.
Author Contributions
AG performed the main analysis, data recording, and wrote the main body of the manuscript. MA performed a part of graph analysis and he collaborated in data recording. PS managed the methodology, edited the manuscript, and also wrote a considerable part of the Section “Discussion.”
Funding
PS is supported by the National Health and Medical Research Council, Australia (#1003760), the Australian Research Council (DE130100868 and DP170103148) and the Australian Research Council Centre of Excellence for Cognition and its Disorders (http://www.ccd.edu.au; CE110001021).
Conflict of Interest Statement
The authors declare that the research was conducted in the absence of any commercial or financial relationships that could be construed as a potential conflict of interest.
Acknowledgments
We are very thankful to Professor Warren H. Meck for great comments on our presentation at Duke University.
Footnotes
- ^ http://www.appliedneuroscience.com
- ^ http://www.uzh.ch/keyinst/loreta.htm
- ^ http://www.brain-connectivity-toolbox.net
References
Achard, S., Salvador, R., Whitcher, B., Suckling, J., and Bullmore, E. D. (2006). A resilient, low-frequency, small-world human brain functional network with highly connected association cortical hubs. J. Neurosci. 26, 63–72. doi: 10.1523/JNEUROSCI.3874-05.2006
Alahmadi, N., Evdokimov, S. A., Kropotov, Y. J., Müller, A. M., and Jäncke, L. (2016). Different resting state EEG features in children from Switzerland and Saudi Arabia. Front. Hum. Neurosci. 10:559. doi: 10.3389/fnhum.2016.00559
Alm, P. A. (2004). Stuttering and the basal ganglia circuits: a critical review of possible relations. J. Commun. Disord. 37, 325–369. doi: 10.1016/j.jcomdis.2004.03.001
Anderson, J. D., and Wagovich, S. A. (2010). Relationships among linguistic processing speed, phonological working memory, and attention in children who stutter. J. Fluency Disord. 35, 216–234. doi: 10.1016/j.jfludis.2010.04.003
Aoki, Y., Ishii, R., Pascual-Marqui, R. D., Canuet, L., Ikeda, S., Hata, M., et al. (2015). Detection of EEG-resting state independent networks by eLORETA-ICA method. Front. Hum. Neurosci. 9:31. doi: 10.3389/fnhum.2015.00031
Babiloni, F., Cincotti, F., Babiloni, C., Carducci, F., Mattia, D., Astolfi, L., et al. (2005). Estimation of the cortical functional connectivity with the multimodal integration of high-resolution EEG and fMRI data by directed transfer function. Neuroimage 24, 118–131. doi: 10.1016/j.neuroimage.2004.09.036
Barthelemy, M. (2004). Betweenness centrality in large complex networks. Eur. Phys. J. B 38, 163–168. doi: 10.1140/epjb/e2004-00111-4
Barttfeld, P., Wicker, B., Cukier, S., Navarta, S., Lew, S., and Sigman, M. (2011). A big-world network in ASD: dynamical connectivity analysis reflects a deficit in long-range connections and an excess of short-range connections. Neuropsychologia 49, 254–263. doi: 10.1016/j.neuropsychologia.2010.11.024
Bassett, D. S., and Bullmore, E. D. (2006). Small-world brain networks. Neuroscientist 12, 512–523. doi: 10.1177/1073858406293182
Belyk, M., Kraft, S. J., and Brown, S. (2015). Stuttering as a trait or state–an ALE meta-analysis of neuroimaging studies. Eur. J. Neurosci. 41, 275–284. doi: 10.1111/ejn.12765
Boccaletti, S., Latora, V., Moreno, Y., Chavez, M., and Hwang, D. U. (2006). Complex networks: Structure and dynamics. Phys. Rep. 424, 175–308. doi: 10.1016/j.physrep.2005.10.009
Boutcher, S. H., and Landers, D. M. (1988). The effects of vigorous exercise on anxiety, heart rate, and alpha activity of runners and nonrunners. Psychophysiology 25, 696–702. doi: 10.1111/j.1469-8986.1988.tb01911.x
Boyle, M. P. (2011). Mindfulness training in stuttering therapy: a tutorial for speech-language pathologists. J. Fluency Disord. 36, 122–129. doi: 10.1016/j.jfludis.2011.04.005
Brown, S., Ingham, R. J., Ingham, J. C., Laird, A. R., and Fox, P. T. (2005). Stuttered and fluent speech production: an ALE meta-analysis of functional neuroimaging studies. Hum. Brain Mapp. 25, 105–117. doi: 10.1002/hbm.20140
Büchel, C., and Sommer, M. (2004). What causes stuttering. PLoS Biol. 2:E46. doi: 10.1371/journal.pbio.0020046
Budde, K. S., Barron, D. S., and Fox, P. T. (2014). Stuttering, induced fluency, and natural fluency: a hierarchical series of activation likelihood estimation meta-analyses. Brain Lang. 139, 99–107. doi: 10.1016/j.bandl.2014.10.002
Buhusi, C. V., and Meck, W. H. (2005). What makes us tick? Functional and neural mechanisms of interval timing. Nat. Rev. Neurosci. 6, 755–765. doi: 10.1038/nrn1764
Bullmore, E., and Sporns, O. (2009). Complex brain networks: graph theoretical analysis of structural and functional systems. Nat. Rev. Neurosci. 10, 186–198. doi: 10.1038/nrn2575
Chang, S.-E., Angstadt, M., Chow, H. M., Etchell, A. C., Garnett, E. O., Choo, A. L., et al. (2017). Anomalous network architecture of the resting brain in children who stutter. J. Fluency Disord. 55, 46–67. doi: 10.1016/j.jfludis.2017.01.002
Chang, S. E., Chow, H. M., Wieland, E. A., and McAuley, J. D. (2016). Relation between functional connectivity and rhythm discrimination in children who do and do not stutter. Neuroimage 12, 442–450. doi: 10.1016/j.nicl.2016.08.021
Chang, S. E., Kenney, M. K., Loucks, T. M., and Ludlow, C. L. (2009). Brain activation abnormalities during speech and non-speech in stuttering speakers. Neuroimage 46, 201–212. doi: 10.1016/j.neuroimage.2009.01.066
Clemens, B., Puskás, S., Spisák, T., Lajtos, I., Opposits, G., Besenyei, M., et al. (2016). Increased resting-state EEG functional connectivity in benign childhood epilepsy with centro-temporal spikes. Seizure 35, 50–55. doi: 10.1016/j.seizure.2016.01.001
Coutinho, J. F., Fernandesl, S. V., Soares, J. M., Maia, L., Gonçalves,Ó. F., and Sampaio, A. (2016). Default mode network dissociation in depressive and anxiety states. Brain Imag. Behav. 10, 147–157. doi: 10.1007/s11682-015-9375-7
Craig, A. (1990). An investigation into the relationship between anxiety and stuttering. J. Speech Hear. Disord. 55, 290–294. doi: 10.1044/jshd.5502.290
Craig, A., Karen, H., Yvonne, T., Magali, C., and Karen, P. (2002). Epidemiology of stuttering in the community across the entire life span. J. Speech Lang. Hear. Res. 45, 1097–1105. doi: 10.1044/1092-4388(2002/088)
Eggers, K., Luc, F., and Van den Bergh, B. R. (2013). Inhibitory control in childhood stuttering. J. Fluency Disord. 38, 1–13. doi: 10.1016/j.jfludis.2012.10.001
Emory, H., Wells, C., and Mizrahi, N. (2015). Quantitative EEG and current source density analysis of combined antiepileptic drugs and dopaminergic agents in genetic epilepsy: two case studies. Clin. EEG Neurosci. 46, 256–262. doi: 10.1177/1550059414532253
Etchell, A. C., Civier, O., Ballard, K. J., and Sowman, P. F. (2017). A systematic literature review of neuroimaging research on developmental stuttering between 1995 and 2016. J. Fluency Disord. 55, 6–45. doi: 10.1016/j.jfludis.2017.03.007
Etchell, A. C., Johnson, B. W., and Sowman, P. F. (2014). Behavioral and multimodal neuroimaging evidence for a deficit in brain timing networks in stuttering: a hypothesis and theory. Front. Hum. Neurosci. 8:467. doi: 10.3389/fnhum.2014.00467
Etchell, A. C., Johnson, B. W., and Sowman, P. F. (2015). Beta oscillations, timing, and stuttering. Front. Hum. Neurosci. 8:1036. doi: 10.3389/fnhum.2014.01036
Etchell, A. C., Ryan, M., Martin, E., Johnson, B. W., and Sowman, P. F. (2016). Abnormal time course of low beta modulation in non-fluent preschool children: a magnetoencephalographic study of rhythm tracking. Neuroimage 125, 953–963. doi: 10.1016/j.neuroimage.2015.10.086
Ezrati-Vinacour, R., and Levin, I. (2001). Time estimation by adults who stutter. J. Speech Lang. Hear. Res. 44, 144–155. doi: 10.1044/1092-4388(2001/013)
Falk, S., Müller, T., and Dalla Bella, S. (2015). Non-verbal sensorimotor timing deficits in children and adolescents who stutter. Front. Psychol. 6:847. doi: 10.3389/fpsyg.2015.00847
Fingelkurts, A. A., Fingelkurts, A. A., Rytsälä, H., Suominen, K., Isometsä, E., and Kähkönen, S. (2007). Impaired functional connectivity at EEG alpha and theta frequency bands in major depression. Hum. Brain Mapp. 28, 247–261. doi: 10.1002/hbm.20275
Fujioka, T., Trainor, L. J., Large, E. W., and Ross, B. (2009). Beta and gamma rhythms in human auditory cortex during musical beat processing. Ann. N. Y. Acad. Sci. 1169, 89–92. doi: 10.1111/j.1749-6632.2009.04779.x
Ghaderi, A. H., Nazari, M., and Meck, W. H. (2016). Interval Timing in Adult Stutters: Role of Beta Connectivity in Default Mode-Related Functional Segregation. San Diego, CA: Society for Neuroscience.
Ghaderi, A. H., Nazari, M. A., Shahrokhi, H., and Darooneh, A. H. (2017). Functional brain connectivity differences between different ADHD presentations: impaired functional segregation in ADHD-combined presentation but not in ADHD-inattentive presentation. Basic Clin. Neurosci. 8, 267–278. doi: 10.18869/nirp.bcn.8.4.267
Gordon, N. (2002). Stuttering: incidence and causes. Dev. Med. Child Neurol. 44, 278–282. doi: 10.1017/S0012162201002067
Gotlib, I. H. (1998). EEG alpha asymmetry, depression, and cognitive functioning. Cogn. Emot. 12, 449–478. doi: 10.1080/026999398379673
Graham, R. L., and Hell, P. (1985). On the history of the minimum spanning tree problem. Ann. Hist. Comput. 7, 43–57. doi: 10.1089/cmb.2013.0134
Hata, M., Kazui, H., Tanaka, T., Ishii, R., Canuet, L., Pascual-Marqui, R. D., et al. (2016). Functional connectivity assessed by resting state EEG correlates with cognitive decline of Alzheimer’s disease–An eLORETA study. Clin. Neurophysiol. 127, 1269–1278. doi: 10.1016/j.clinph.2015.10.030
Humphries, M. D., and Gurney, K. (2008). Network ‘small-world-ness’: a quantitative method for determining canonical network equivalence. PLoS ONE 3:e0002051. doi: 10.1371/journal.pone.0002051
Iverach, L., Menzies, R. G., O’Brian, S., Packman, A., and Onslow, M. (2011). Anxiety and stuttering: continuing to explore a complex relationship. Am. J. Speech Lang. Pathol. 20, 221–232. doi: 10.1044/1058-0360(2011/10-0091)
Iverach, L., and Rapee, R. M. (2014). Social anxiety disorder and stuttering: current status and future directions. J. Fluency Disord. 40, 69–82. doi: 10.1016/j.jfludis.2013.08.003
Jansson-Verkasalo, E., Eggers, K., Järvenpää, A., Suominen, K., Van den Bergh, B., De Nil, L., et al. (2014). Atypical central auditory speech-sound discrimination in children who stutter as indexed by the mismatch negativity. J. Fluency Disord. 41, 1–11. doi: 10.1016/j.jfludis.2014.07.001
Kaganovich, N., Wray, A. H., and Weber-Fox, C. (2010). Non-linguistic auditory processing and working memory update in pre-school children who stutter: an electrophysiological study. Dev. Neuropsychol. 35, 712–736. doi: 10.1080/87565641.2010.508549
Kamhi, A. G., and McOsker, T. G. (1982). Attention and stuttering: do stutterers think too much about speech? J. Fluency Disord. 7, 309–321. doi: 10.1016/0094-730X(82)90025-0
Knyazev, G. G., Savostyanov, A. N., and Levin, E. A. (2006). Alpha synchronization and anxiety: implications for inhibition vs. alertness hypotheses. Int. J. Psychophysiol. 59, 151–158. doi: 10.1016/j.ijpsycho.2005.03.025
Kononowicz, T. W., and van Rijn, H. (2015). Single trial beta oscillations index time estimation. Neuropsychologia 75, 381–389. doi: 10.1016/j.neuropsychologia.2015.06.014
Kropotov, J. D. (2010). Quantitative EEG, Event-Related Potentials and Neurotherapy. Cambridge, MA: Academic Press.
Liotti, M., Ingham, J. C., Takai, O., Paskos, D. K., Perez, R., and Ingham, R. J. (2010). Spatiotemporal dynamics of speech sound perception in chronic developmental stuttering. Brain Lang. 115, 141–147. doi: 10.1016/j.bandl.2010.07.007
Liu, Q., Ganzetti, M., Wenderoth, N., and Mantini, D. M. (2018). Detecting large-scale brain networks using EEG: impact of electrode density, head modelling and source localization. Front. Neuroinform. 12:4. doi: 10.3389/fninf.2018.00004
Loucks, T., Kraft, S. J., Choo, A. L., Sharma, H., and Ambrose, N. G. (2011). Functional brain activation differences in stuttering identified with a rapid fMRI sequence. J. Fluency Disord. 36, 302–307. doi: 10.1016/j.jfludis.2011.04.004
Luc, F., Beal, D. S., Lafaille, S. J., Kroll, R. M., Crawley, A. P., and Gracco, V. L. (2008). The effects of simulated stuttering and prolonged speech on the neural activation patterns of stuttering and nonstuttering adults. Brain Lang. 107, 114–123. doi: 10.1016/j.bandl.2008.07.003
Mahr, G. C., and Torosiana, T. (1999). Anxiety and social phobia in stuttering. J. Fluency Disord. 24, 119–126. doi: 10.1016/S0094-730X(98)00027-8
Maris, E., and Oostenveld, R. (2007). Nonparametric statistical testing of EEG-and MEG-data. J. Neurosci. Methods 164, 177–190. doi: 10.1016/j.jneumeth.2007.03.024
Menzies, R. G., Onslow, M., and Packman, A. (1999). Anxiety and stuttering: exploring a complex relationship. Am. J. Speech Lang. Pathol. 8, 3–10. doi: 10.1044/1058-0360.0801.03
Merchant, H., and Bartolo, R. (2017). Primate beta oscillations and rhythmic behaviors. J. Neural. Transm. 125, 461–470. doi: 10.1007/s00702-017-1716-9
Mersov, A., Cecilia, J., Douglas, O. C., and Luc, D. (2016). Sensorimotor oscillations prior to speech onset reflect altered motor networks in adults who stutter. Front. Hum. Neurosci. 10:443. doi: 10.3389/fnhum.2016.00443
Messenger, M., Onslow, M., Packman, A., and Menzies, R. (2004). Social anxiety in stuttering: measuring negative social expectancies. J. Fluency Disord. 29, 201–212. doi: 10.1016/j.jfludis.2004.06.002
Messina, I., Bianco, F., Cusinato, M., Calvo, V., and Sambin, M. (2016). Abnormal default system functioning in depression: implications for emotion regulation. Front. Psychol. 7:858. doi: 10.3389/fpsyg.2016.00858
Mizuhara, H., and Yamaguchi, Y. (2007). Human cortical circuits for central executive function emerge by theta phase synchronization. Neuroimage 36, 232–244. doi: 10.1016/j.neuroimage.2007.02.026
Mizuhara, H., Wang, L. Q., Kobayashi, K., and Yamaguchi, Y. (2005). Long-range EEG phase synchronization during an arithmetic task indexes a coherent cortical network simultaneously measured by fMRI. Neuroimage 27, 553–563. doi: 10.1016/j.neuroimage.2005.04.030
Mohan, A., De Ridder, D., and Vanneste, S. (2016a). Emerging hubs in phantom perception connectomics. Neuroimage 11, 181–194. doi: 10.1016/j.nicl.2016.01.022
Mohan, A., De Ridder, D., and Vanneste, S. (2016b). Graph theoretical analysis of brain connectivity in phantom sound perception. Sci. Rep. 6:19683. doi: 10.1038/srep19683
Muldoon, S. F., Bridgeford, E. W., and Bassett, D. S. (2016). Small-world propensity and weighted brain networks. Sci. Rep. 6:22057. doi: 10.1038/srep22057
Mumtaz, W., Xia, L., Ali, S. S. A., Yasin, M. A. M., Hussain, M., and Malik, A. S. (2017). Electroencephalogram (EEG)-based computer-aided technique to diagnose major depressive disorder (MDD). Biomed. Signal Process. Control 31, 108–115. doi: 10.1016/j.bspc.2016.07.006
Neilson, M. D., and Neilson, P. D. (1987). Speech motor control and stuttering: a computational model of adaptive sensory-motor processing. Speech Commun. 6, 325–333. doi: 10.1016/0167-6393(87)90007-0
Nejati, V., Pouretemad, H. R., and Bahrami, H. (2013). Attention training in rehabilitation of children with developmental stuttering. NeuroRehabilitation 32, 297–303. doi: 10.3233/NRE-130847
Olander, L., Smith, A., and Zelaznik, H. N. (2010). Evidence that a motor timing deficit is a factor in the development of stuttering. J. Speech Lang. Hear. Res. 53, 876–886. doi: 10.1044/1092-4388(2009/09-0007)
Olbrich, S., Olbrich, H., Adamaszek, M., Jahn, I., Hegerl, U., and Stengler, K. (2013). Altered EEG lagged coherence during rest in obsessive–compulsive disorder. Clin. Neurophysiol. 124, 2421–2430. doi: 10.1016/j.clinph.2013.05.031
Packman, A. (2012). Theory and therapy in stuttering: a complex relationship. J. Fluency Disord. 37, 225–233. doi: 10.1016/j.jfludis.2012.05.004
Pascual-Marqui, R. D. (2007). Instantaneous and lagged measurements of linear and nonlinear dependence between groups of multivariate time series: frequency decomposition. arXiv:0711.1455.
Pascual-Marqui, R. D. (2002). Standardized low-resolution brain electromagnetic tomography (sLORETA): technical details. Methods Find. Exp. Clin. Pharmacol. 24, 5–12.
Pascual-Marqui, R. D., Lehmann, D., Koukkou, M., Kochi, K., Anderer, P., Saletu, B., et al. (2011). Assessing interactions in the brain with exact low-resolution electromagnetic tomography. Philos. Trans. R. Soc. Lond. A 369, 3768–3784. doi: 10.1098/rsta.2011.0081
Pascual-Marqui, R. D., Michel, C. M., and Lehmann, D. (1994). Low resolution electromagnetic tomography: a new method for localizing electrical activity in the brain. Int. J. Psychophysiol. 18, 49–65. doi: 10.1016/0167-8760(84)90014-X
Riley, G. D. (1972). A stuttering severity instrument for children and adults. J. Speech Hear. Disord. 37, 314–322. doi: 10.1044/jshd.3703.314
Rotondi, F., Franceschetti, S., Avanzini, G., and Panzica, F. (2016). Altered EEG resting-state effective connectivity in drug-naïve childhood absence epilepsy. Clin. Neurophysiol. 127, 1130–1137. doi: 10.1016/j.clinph.2015.09.003
Rubinov, M., and Sporns, O. (2010). Complex network measures of brain connectivity: uses and interpretations. Neuroimage 52, 1059–1069. doi: 10.1016/j.neuroimage.2009.10.003
Salmelin, R., Schnitzler, A., Schmitz, F., and Freund, H. J. (2000). Single word reading in developmental stutterers and fluent speakers. Brain 123, 1184–1202. doi: 10.1093/brain/123.6.1184
Sauseng, P., Hoppe, J., Klimesch, W., Gerloff, C., and Hummel, F. C. (2007). Dissociation of sustained attention from central executive functions: local activity and interregional connectivity in the theta range. Eur. J. Neurosci. 25, 587–593. doi: 10.1111/j.1460-9568.2006.05286.x
Sauseng, P., Klimesch, W., Doppelmayr, M., Hanslmayr, S., Schabus, M., and Gruber, W. R. (2004). Theta coupling in the human electroencephalogram during a working memory task. Neurosci. Lett. 354, 123–126. doi: 10.1016/j.neulet.2003.10.002
Sauseng, P., Klimesch, W., Schabus, M., and Doppelmayr, M. (2005). Fronto-parietal EEG coherence in theta and upper alpha reflect central executive functions of working memory. Int. J. Psychophysiol. 57, 97–103. doi: 10.1016/j.ijpsycho.2005.03.018
Scheeringa, R., Bastiaansen, M. C., Petersson, K. M., Oostenveld, R., Norris, D. G., and Hagoort, P. (2008). Frontal theta EEG activity correlates negatively with the default mode network in resting state. Int. J. Psychophysiol. 67, 242–251. doi: 10.1016/j.ijpsycho.2007.05.017
Schwartz, S., Kessler, R., Gaughan, T., and Buckley, A. W. (2016). Electroencephalogram coherence patterns in autism: an updated review. Pediatr. Neurol. 67, 7–22. doi: 10.1016/j.pediatrneurol.2016.10.018
Sowman, P. F., Ryan, M., Johnson, B. W., Savage, G., Crain, S., Harrison, E., et al. (2017). Grey matter volume differences in the left caudate nucleus of people who stutter. Brain Lang. 164, 9–15. doi: 10.1016/j.bandl.2016.08.009
Stam, C. J. (2014). Modern network science of neurological disorders. Nat. Rev. Neurosci. 15, 683–695. doi: 10.1038/nrn3801
Stam, C. J., Tewarie, P., Van Dellen, E., Van Straaten, E. C. W., Hillebrand, A., and Van Mieghem, P. (2014). The trees and the forest: characterization of complex brain networks with minimum spanning trees. Int. J. Psychophysiol. 92, 129–138. doi: 10.1016/j.ijpsycho.2014.04.001
Tewarie, P., van Dellen, E., Hillebrand, A., and Stam, C. J. (2015). The minimum spanning tree: an unbiased method for brain network analysis. Neuroimage 104, 177–188. doi: 10.1016/j.neuroimage.2014.10.015
Thatcher, R. W., North, D. M., and Biver, C. J. (2014). LORETA EEG phase reset of the default mode network. Front. Hum. Neurosci. 8:529. doi: 10.3389/fnhum.2014.00529
van Lutterveld, R., van Dellen, E., Pal, P., Yang, H., Stam, C. J., and Brewer, J. (2017). Meditation is associated with increased brain network integration. Neuroimage 158, 18–25. doi: 10.1016/j.neuroimage.2017.06.071
Wang, J., Wang, L., Zang, Y., Yang, H., Tang, H., Gong, Q., et al. (2009). Parcellation-dependent small-world brain functional networks: a resting-state fMRI study. Hum. Brain Mapp. 30, 1511–1523. doi: 10.1002/hbm.20623
Wang, L., Zhu, C., He, Y., Zang, Y., Cao, Q., Zhang, H., et al. (2009). Altered small-world brain functional networks in children with attention-deficit/hyperactivity disorder. Hum. Brain Mapp. 30, 638–649. doi: 10.1002/hbm.20530
Watkins, K. E., Smith, S. M., Davis, S., and Howell, P. (2008). Structural and functional abnormalities of the motor system in developmental stuttering. Brain 131, 50–59. doi: 10.1093/brain/awm241
Watts, D. J., and Strogatz, S. H. (1998). Collective dynamics of ‘small-world’ networks. Nature 393, 440–442. doi: 10.1038/30918
Weber-Fox, C., and Hampton, A. (2008). Stuttering, and natural speech processing of semantic, and syntactic constraints on verbs. J. Speech Lang. Hear. Res. 51, 1058–1071. doi: 10.1044/1092-4388(2008/07-0164)
Wieland, E. A., McAuley, J. D., Dilley, L. C., and Chang, S. E. (2015). Evidence for a rhythm perception deficit in children who stutter. Brain Lang. 144, 26–34. doi: 10.1016/j.bandl.2015.03.008
Wu, L., Eichele, T., and Calhoun, V. D. (2010). Reactivity of hemodynamic responses and functional connectivity to different states of alpha synchrony: a concurrent EEG-fMRI study. Neuroimage 52, 1252–1260. doi: 10.1016/j.neuroimage.2010.05.053
Xia, M., Wang, J., and He, Y. (2013). BrainNet viewer: a network visualization tool for human brain connectomics. PLoS One 8:e68910. doi: 10.1371/journal.pone.0068910
Xuan, Y., Meng, C., Yang, Y., Zhu, C., Wang, L., Yan, Q., et al. (2012). Resting-state brain activity in adult males who stutter. PLoS One 7:e30570. doi: 10.1371/journal.pone.0030570
Keywords: stuttering, functional brain networks, minimum spanning tree, executive function, time perception
Citation: Ghaderi AH, Andevari MN and Sowman PF (2018) Evidence for a Resting State Network Abnormality in Adults Who Stutter. Front. Integr. Neurosci. 12:16. doi: 10.3389/fnint.2018.00016
Received: 24 January 2018; Accepted: 10 April 2018;
Published: 27 April 2018.
Edited by:
James Danckert, University of Waterloo, CanadaReviewed by:
Gennady Knyazev, State Scientific-Research Institute of Physiology & Basic Medicine, RussiaIrene Messina, Università degli Studi di Padova, Italy
Copyright © 2018 Ghaderi, Andevari and Sowman. This is an open-access article distributed under the terms of the Creative Commons Attribution License (CC BY). The use, distribution or reproduction in other forums is permitted, provided the original author(s) and the copyright owner are credited and that the original publication in this journal is cited, in accordance with accepted academic practice. No use, distribution or reproduction is permitted which does not comply with these terms.
*Correspondence: Amir H. Ghaderi, YV9naGFkZXJpQHRhYnJpenUuYWMuaXI=; YW1pcmhvc2VpbmdoYWRlcmlAZ21haWwuY29t