 Nicole Davis1,2,3*
 Qiuyun Fan2,4
 Donald L. Compton1,5
 Doug Fuchs1,5
 Lynn S. Fuchs1,5
 Laurie E. Cutting1,2,3,5
 John C. Gore1,2,3,4
 Adam W. Anderson1,2,3,4
- 1Vanderbilt University Kennedy Center for Research on Human Development, Nashville, TN, USA
- 2Vanderbilt University Institute of Imaging Science, Nashville, TN, USA
- 3Department of Radiology and Radiological Sciences, Vanderbilt University, Nashville, TN, USA
- 4Department of Biomedical Engineering, School of Engineering, Vanderbilt University, Nashville, TN, USA
- 5Vanderbilt Peabody, Department of Special Education, Vanderbilt University, Nashville, TN, USA
As the education field moves toward using responsiveness to intervention to identify students with disabilities, an important question is the degree to which this classification can be connected to a student’s neurobiological characteristics. A few functional neuroimaging studies have reported a relationship between activation and response to instruction; however, whether a similar correlation exists with white matter (WM) is not clear. To investigate this issue, we acquired high angular resolution diffusion images from a group of first grade children who differed in their levels of responsiveness to a year-long reading intervention. Using probabilistic tractography, we calculated the strength of WM connections among nine cortical regions of interest and correlated these estimates with participants’ scores on four standardized reading measures. We found eight significant correlations, four of which were connections between the insular cortex and angular gyrus. In each of the correlations, a relationship with children’s response to intervention was evident.
Introduction
Cognitive tasks engage a set of distributed cortical areas that work together toward accomplishing a desired goal. Each neural center has its own specialization; activation is synchronized across participating areas. In regard to reading ability, the neural network can be generally associated with neuroanatomical areas within the left perisylvian region. Areas within this region have their own cognitive specialization and vary in their importance to reading ability (Shaywitz et al., 2004).
In terms of functional neuroimaging, an abundant literature links poor word recognition skill to differences in the neuronal functioning of three neuroanatomical areas within the perisylvian network: occipito-temporal cortex (OTC), temporo-parietal cortex (TPC), and inferior frontal gyrus (IFG). A variety of studies have shown that the neural signature of brain function in individuals with reading disability (RD) is characterized by decreased activity in the left OTC (Brunswick et al., 1999; Paulesu et al., 2001) and left TPC (Rumsey et al., 1997; Horwitz et al., 1998; Brunswick et al., 1999) and increased activity in right TPC (Shaywitz and Shaywitz, 2003) region. However, this functional pattern of RD is malleable: Children with RD who respond to intervention exhibit significantly increased activation of left hemisphere TPC and decreased activation of right hemisphere TPC (Simos et al., 2002, 2006; Aylward et al., 2003; Shaywitz et al., 2004). Such differences in functional activation serve to elucidate the neurobiological phenotype for responsiveness to intervention (RTI). This is an important point because under the new Federal educational policy enacted in the reauthorization of the Individuals with Disabilities Education Act (IDEA; P.L. 108-446; IDEA, 2004), RTI may be used to identify students with disabilities. An important question is the degree to which this classification can be connected to, and in a sense validated by, anomalous neurobiological characteristics.
While functional MRI (fMRI) studies have provided information about neuronal response to word stimuli, coordinated transfer of information between brain regions within a network is also an important component of information processing. White matter (WM) tracts connecting different brain regions support communication between brain regions, though these have been less frequently investigated in imaging studies. Until recently, the in vivo investigation of WM integrity was not possible. Now, with the advent of diffusion tensor imaging (DTI) WM integrity can be evaluated in adults and children. DTI is a technique that examines the structure of WM in the brain by measuring the molecular diffusion of water. Cell membranes and myelin hinder the diffusive movement of water perpendicular to those membranes. Hence diffusion rates are higher parallel to axons than perpendicular to them. Information on the directional preference of diffusion is used to perform fiber tracking and estimate connectivity (Conturo et al., 1999; Jones et al., 1999Mori et al., 1999; Basser et al., 2000).
How highly connected gray matter regions are to one another appears to be associated with reading ability. In fact, several studies comparing children with reading difficulty to normal readers have reported significant differences in WM integrity in and between the temporal-parietal regions (Klingberg et al., 2000; Beaulieu et al., 2005; Deutsch et al., 2005; Niogi and McCandliss, 2006). While differences between the WM of good and poor readers have been shown, the relationship between WM connectivity and intervention has only recently been investigated (Keller and Just, 2009). Using a voxel-based analysis of diffusion tensor parameters, Keller and Just (2009) showed changes in left medial superior frontal WM in 8–10 year olds after 100 h of tutoring. But, they did not examine WM architecture and connectivity as related to an individual’s classification as a responder or non-responder to intervention. It should be noted that a few neuroimaging studies actually have addressed this issue, but only using functional neuroimaging (Simos et al., 2006; Odegard et al., 2008; Davis et al., in press). Whether a similar correlation exists between responsiveness to instruction and WM brain structures is not clear. Use of a complementary neuroimaging modality that captures WM connectivity thus can provide important and unique information.
The purpose of the current study was to investigate the potential relationship between WM connectivity and responsiveness to classroom based instruction in a group of children in the first grade, using voxel based analysis of diffusion tensor magnetic resonance imaging data. To investigate the relationship between WM connectivity and responsiveness to instruction, we identified nine cortical regions of interest that have strong theoretical justification for playing a part in reading skill (Table 1). Each region is involved with several different processes; therefore, we list in Table 1 only the behaviors of interest to the current study. We calculated the connectivity strength (defined below) between these gray matter regions and correlated the strength estimate with participants’ scores on reading measures. We hypothesized that we would replicate previous findings of differences in WM related to reading skill. In addition, we anticipated that children’s responsiveness to reading intervention would provide additional information. To our knowledge, this is the first cortical connectivity study with children who differ in their response to a year-long reading intervention. However, this is an exploratory study with a small sample size and further studies with a larger sample size are needed.
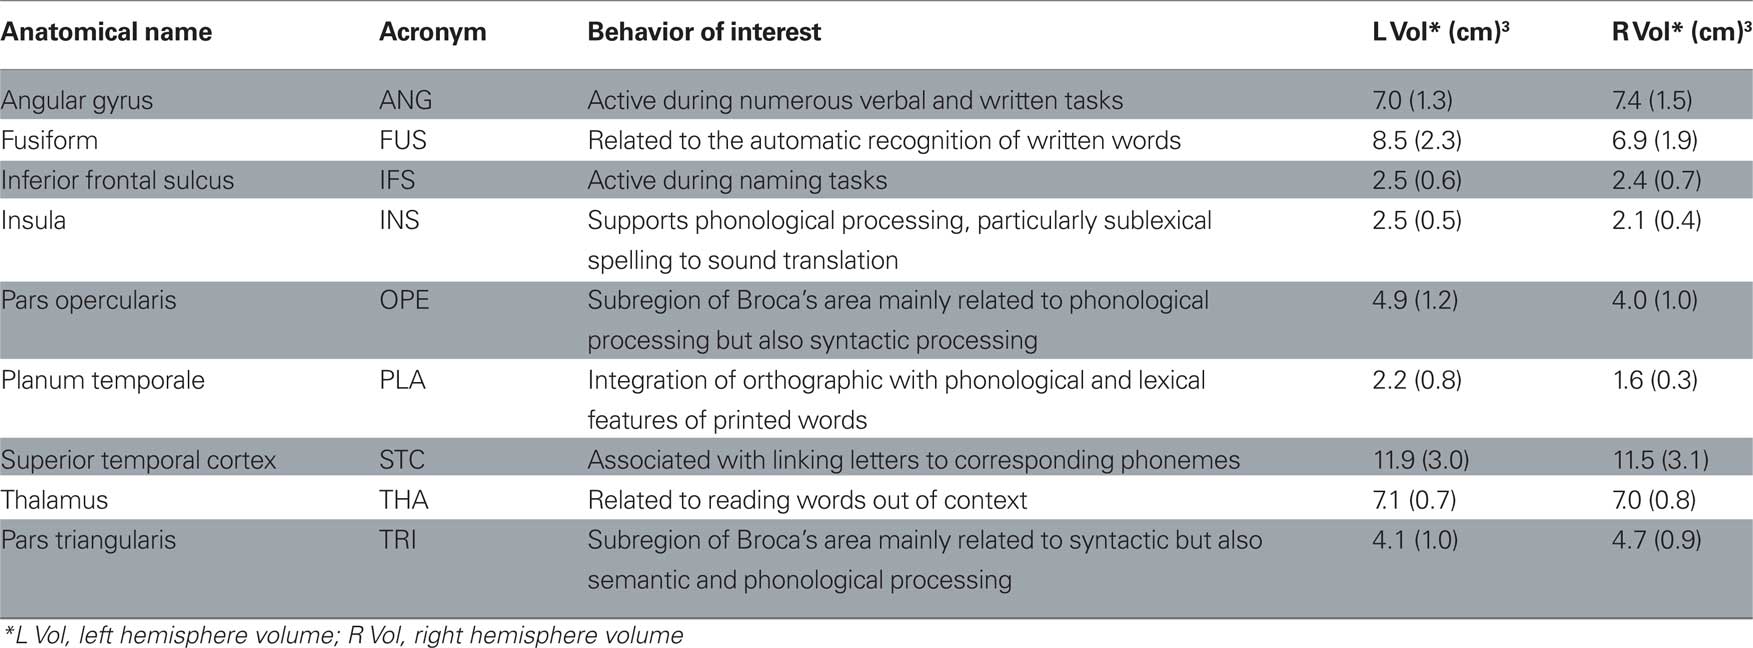
Table 1 Regions of interest.
Materials and Methods
Participants
Imaging data were acquired on 15 children with a mean age of 7.5 years (SD = .43). All participants were recruited from a sample of first graders in Nashville participating in a federally funded randomized control trial (RCT). The RCT explores the effectiveness of response to intervention (RTI) as a means of identifying and preventing RD. All participants, including control participants, were screened and determined to be at-risk for reading difficulties at the beginning of first grade. Children with brain injury, other physical disabilities, severe emotional problems, uncorrected sensory disorders, ADHD, or an IQ < 80 were excluded during recruitment for this neuroimaging portion of the project. No child who was defined as having limited proficiency in English participated in the imaging study. No restriction was made for gender, ethnicity, or socioeconomic status. This study was approved by the Vanderbilt University Institutional Review Board. Written informed consent was obtained from the children’s guardians. Written assent was obtained from the children.
Of the 15 datasets, four were not included due to severe head motion that rendered the tractography data unreliable. The remaining 11 participants were placed into groups based upon RCT categorization (described in Behavioral Measures and Responsiveness section below). As such, classroom controls (C; n = 4) were defined as children who were initially identified as at risk in the fall of first grade but benefited from classroom-based tier 1 instruction and therefore did not qualify for small-group tier 2 reading intervention. Treatment responders (R; n = 2) were defined as children who did not benefit from tier 1 instruction, were eligible for small-group tier 2 reading intervention, and achieved adequate results on behavioral measures indicating response to intervention. Treatment non-responders (NR; n = 4) were children who did not benefit from tier 1 instruction, were eligible for small-group tier 2 reading intervention, and did not achieve adequate results on behavioral measures, indicating a failure to respond to intervention.
Behavioral Measures and Responsiveness
Within the RCT, children’s response to the instruction was estimated with a measure of word identification fluency (WIF; Fuchs et al., 2004; Compton et al., 2010), which was administered weekly. Growth modeling of WIF over 6 weeks at the beginning of the school year indicated each child’s responsiveness to the general classroom instruction (prior to small-group tier 2 intervention). Children identified as unresponsive to general classroom instruction were assigned to small-group tier 2 intervention (tier 2), in which trained research assistants provided a prescribed reading intervention 3 days/week for 17 weeks. For participants receiving tier 2 intervention, weekly progress monitoring using WIF continued throughout the course of intervention. Upon conclusion of the intervention, responsiveness was determined using WIF intercept and slope over the duration of the intervention.
It is important to note that for the imaging study, limitations in sample size necessitated ranking participants by WIF intercept and slope and dividing participants to designate equal groups of responders and non-responders. These designations of responders and non-responders were used in all subsequent analyses.
Measures
Pre- and post-test behavioral measures were administered to all participants receiving tier 2 intervention. As stated above, the WIF growth was used to identify the participants’ group membership. The pre- and post-test measures listed below were correlated with DTI data.
Word identification fluency. WIF consists of single-page lists of 100 high-frequency words randomly sampled from the Dolch pre-primer, primer, and first-grade level lists (Fuchs et al., 2004). The task is to read as many words as possible in 1 min.
Untimed word identification skill. The Woodcock Reading Mastery Test – R/NU: Word Identification (WRMT-R: WID, Woodcock, 1998) is a norm-referenced test in which subjects read individual words ordered in difficulty until six sequential incorrect responses occur.
Untimed decoding skill. The Woodcock Reading Mastery Test – R/NU: Word Attack (WRMT-R: WAT, Woodcock, 1998) is a norm-referenced test that requires subjects to pronounce decodable pseudowords presented in ordered difficulty until a ceiling of six sequential incorrect responses is reached.
Sight word reading efficiency. The Test of Sight Word Reading Efficiency (TOWRE: SWE, Torgesen et al., 1997) is a norm-referenced measure of sight word reading accuracy and fluency in which participants read a list of words of increasing difficulty for 45 s.
Phonemic decoding efficiency. The Test of Phonemic Decoding Efficiency (TOWRE: PDE, Torgesen et al., 1997) is a norm-referenced measure of decoding accuracy and fluency that requires participants to read a list of decodable pseudowords of increasing difficulty for 45 s.
Intake procedure
In May, letters were sent to the parents of children who had successfully completed the RCT research protocol (including R, NR, and C participants) and met our recruitment criteria. All participants attended a single imaging session, in which each child was acclimated to the lab and received a child-oriented explanation of the study procedures. A play tunnel and a mock scanner were used to practice the tasks and prepare the child for the scanning environment.
Imaging and analysis
All imaging was performed on a research-dedicated Philips Achieva 3T MR scanner.
Structural imaging. High resolution 3D T1-weighted anatomical images were acquired (in a sagittal orientation) in just under 6 min. This was an inversion-prepared turbo field echo sequence (IR-TFE) with TI = 916 ms, TR = 7.9 ms, TE = 3.6 ms, SENSE acceleration factor of 2, matrix size 256 × 256 × 170, and FOV 170 mm × 256 mm × 256 mm for isotropic 1 mm3 resolution. These images were used for subsequent scan prescription and for cortical parcellation.
Diffusion imaging. To measure brain tissue microstructure, we acquired high angular resolution diffusion images using a pulsed-gradient spin echo, echo planar imaging (single shot EPI) pulse sequence to image the entire brain at 2.5 mm isotropic resolution (50 slices, 96 × 96 matrix, TE = 65 ms, TR = 8.5 s, SENSE acceleration factor 2). We acquired 10 non-diffusion weighted and 92 diffusion weighted image volumes (92 directions at b = 1600 s/mm2).
Field map. To correct for EPI distortions, we acquired a field map (1.875 mm × 1.875 mm × 4.934 mm voxels, TE = 2.9 and 3.9 ms, TR = 173 ms, scan time 28 s).
Image Analysis
The image analysis procedure performed for each participant is shown in Figure 1. As shown, diffusion weighted images were corrected for image distortions due to both eddy current (Netsch and van Muiswinkel, 2004) and static magnetic field errors ( Jezzard and Balaban, 1995), the latter using the acquired field maps and FSL software1. Cortical reconstruction and volumetric segmentation was performed with the Freesurfer image analysis suite to identify the cortical and subcortical gray matter regions of interest (Figure 2) on the T1-weighted structural scan. Briefly, this automated process includes motion correction, removal of non-brain tissue (Segonne et al., 2004), segmentation of the subcortical WM and deep gray matter volumetric structures (Fischl et al., 2002, 2004), intensity normalization (Sled et al., 1998), tessellation of the gray matter WM boundary, automated topology correction (Fischl et al., 2001; Segonne et al., 2007), and surface deformation (Dale and Sereno, 1993; Dale et al., 1999; Fischl and Dale, 2000). Information on Freesurfer is freely available online2. Regions were registered to the diffusion image space using a 12-parameter affine transformation calculated in FSL.
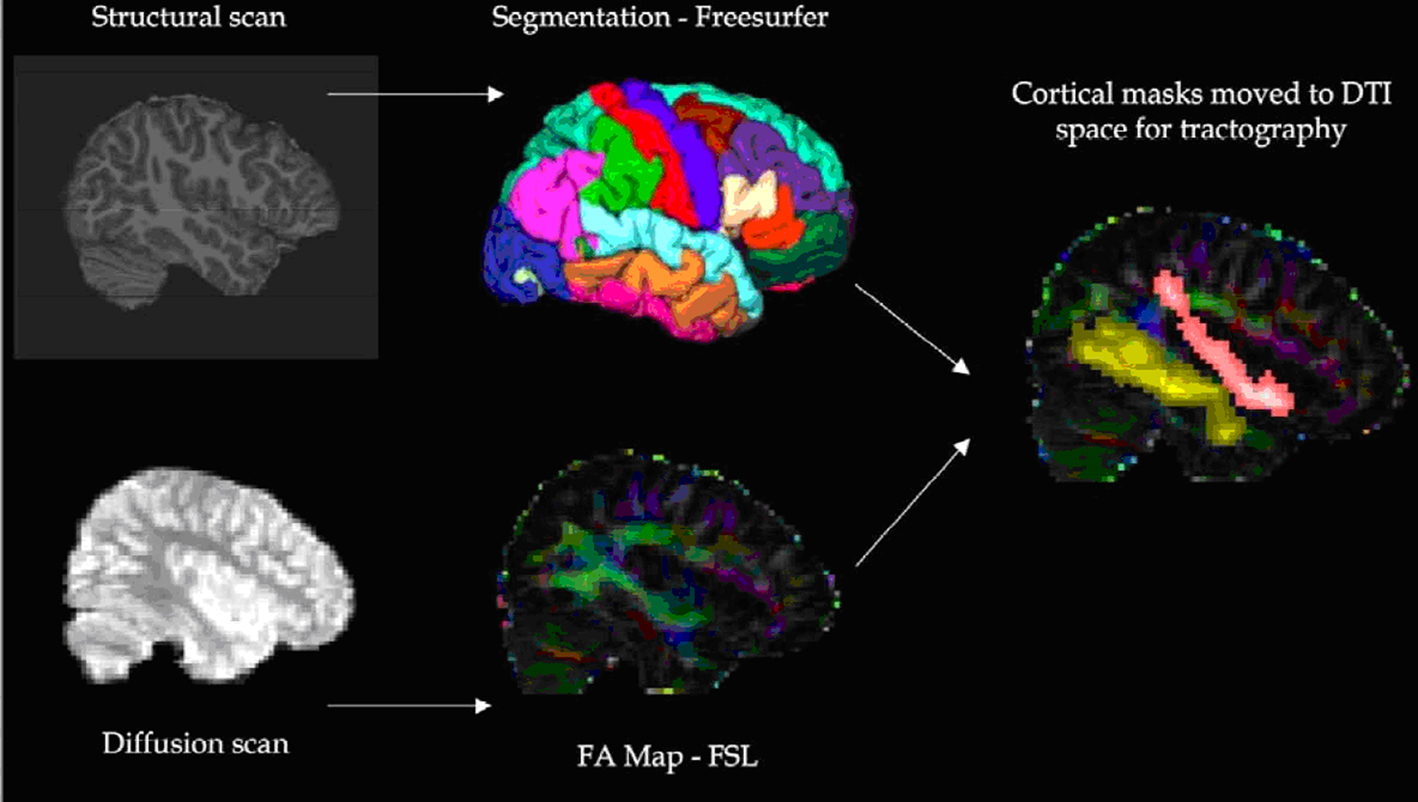
Figure 1 Procedure used for imaging analysis.
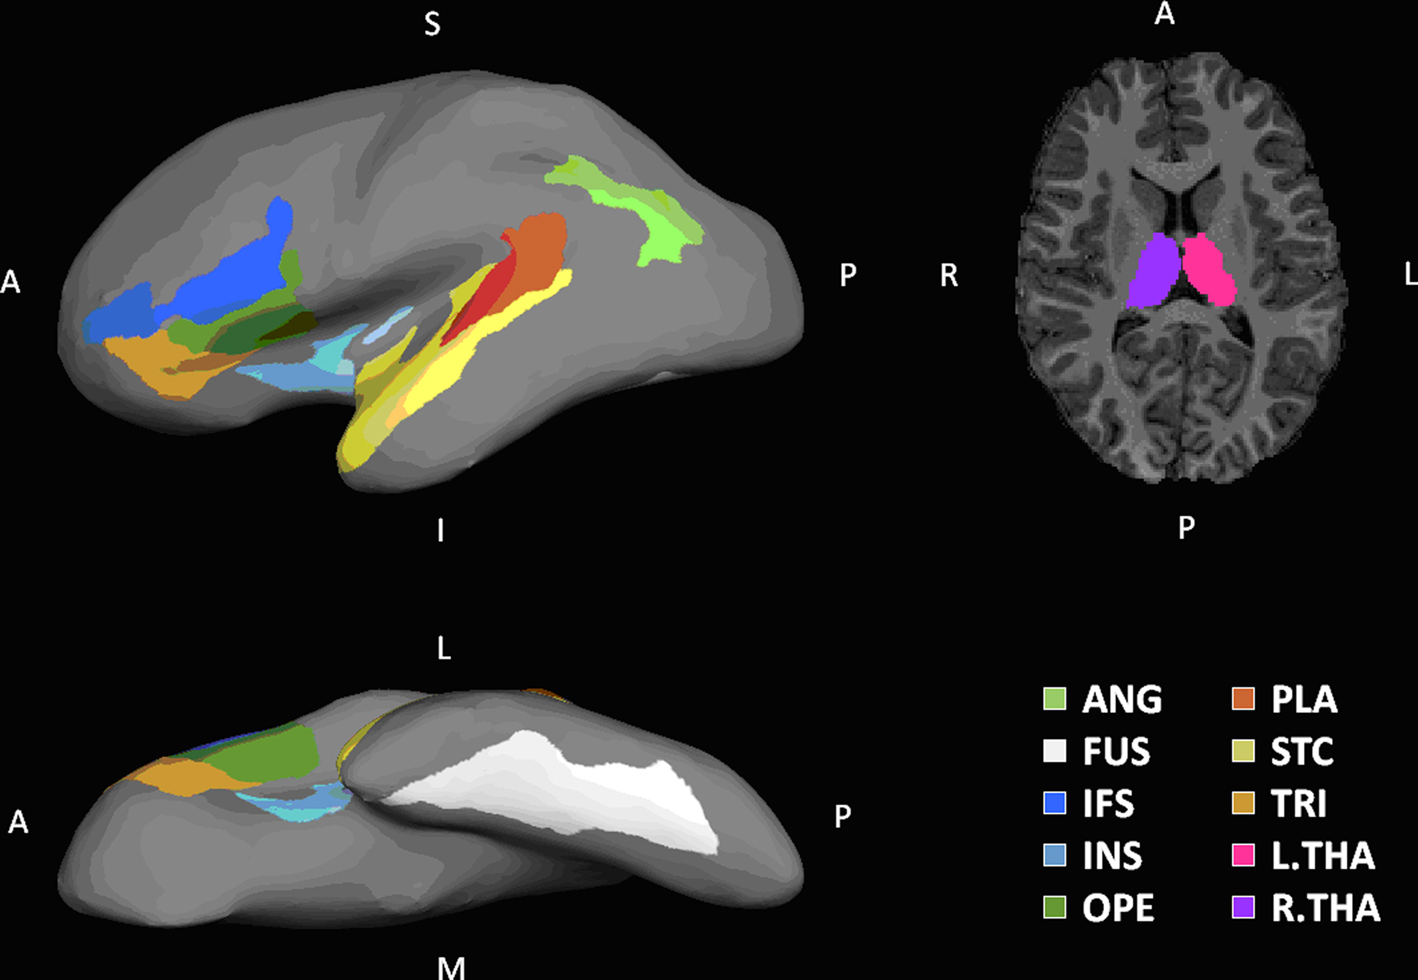
Figure 2 Regions of interest. Shown on the left column are lateral and inferior views of ROIs rendered on the inflated surface of a left hemispherical brain. On the right column is a transverse slice of brain showing THA. Eighteen ROIs identified in this paper are labeled in the following manner: a prefix for cerebral hemisphere (L, left hemisphere; R, right hemisphere), a dot following the prefix, and one of the designators: ANG, angular gyrus; FUS, fusiform; IFS, inferior frontal sulcus; INS, insula; OPE, pars opercularis; PLA, planum temporale; STC, superior temporal gyrus; THA, thalamus; TRI, pars triangularis.
A probabilistic tractography algorithm (Behrens et al., 2003a,b, 2007), implemented in FSL, was then used to quantify the connectivity among these gray matter regions. Each of the 18 gray matter ROIs was used as a seed region, with the other 8 ROIs in the same hemisphere serving as possible termination regions. WM was used as a waypoint mask (i.e., all paths had to pass through the WM). Streamline tractography was initiated 10,000 times within each voxel of the seed region. The streamlines were propagated along directions sampled from the distribution characterizing the estimated uncertainty in the primary diffusion direction. A pathway is comprised of all the streamlines found connecting seed and target regions. In the current study we were only interested in direct pathways connecting region A to region B. Therefore, paths passing through the thalamus were excluded except when the thalamus was the seed or target region. For each pairing of seed and target regions, the number of connecting streamlines was calculated automatically by FSL. We divided this number by the number of seed voxels in A and used it to quantify the one-way connection ratio, r(A− > B). The same procedure was done for r(B− > A). The connectivity, or connection strength, between regions A and B was defined as the symmetrized connection ratio, c (A,B) = (r(A− > B) + r(B− > A))/2. For each participant, we calculated the volume of each region of interest (Table 1). Because volume varied across participants, we calculated the correlation between region volume and the different behavioral measures. Connectivity was calculated for each of the possible 72 pairs of regions. Figure 3 shows the result of these steps, a connectivity matrix, for one of the C participants in the study. An individual connectivity value that deviated from the original sample mean by two standard deviations or more was defined as an outlier and removed from the associated correlation analysis.
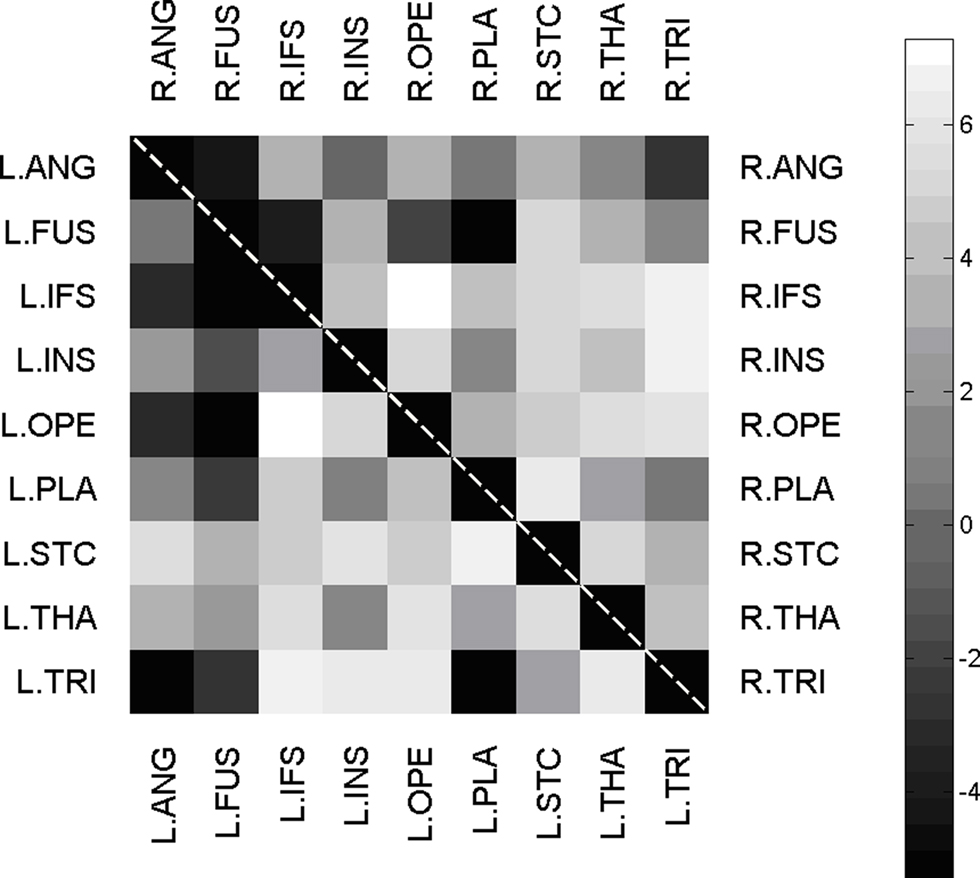
Figure 3 Connectivity matrix. Matrix of connectivity between all intra-hemispherical pairs of n = 18 ROIs. Pairs within left-hemisphere are displayed in the lower left half, pairs within right-hemisphere in the upper right half. All connectivity strengths are displayed with a logarithmic grayscale map.
Results
To test the hypothesis that reading performance was correlated with connectivity of key gray matter regions, we correlated each element of the connectivity matrix with the participants’ scores on standardized tests of reading proficiency. Figure 4 is a visual representation of the correlations between participants’ connectivity estimates and their performance on each of the standardized measures. Within these matrices, left hemisphere connections are in the bottom triangle and right hemisphere connections are in the top triangle. The gray scale denotes significance level, with lighter colors indicating more significant correlations. Because of the small sample size, significant correlations were reported at p < 0.05 uncorrected. Connections with significant correlation at the p < 0.05 level are starred. We investigated age and gender influences on the behavioral and imaging results using two separate one way ANOVAs. Results showed a single significant effect: The left TRI to IFS pathway had a significant gender effect, in which girls had a significantly greater number of WM fibers connecting these regions. In addition, we correlated participant’s performance on the behavioral tasks with the volume of each region. We found a positive correlation between the PDE subtest of the TOWRE and the left planum temporal (p = 0.02) and the left superior temporal cortex (p = 0.03).
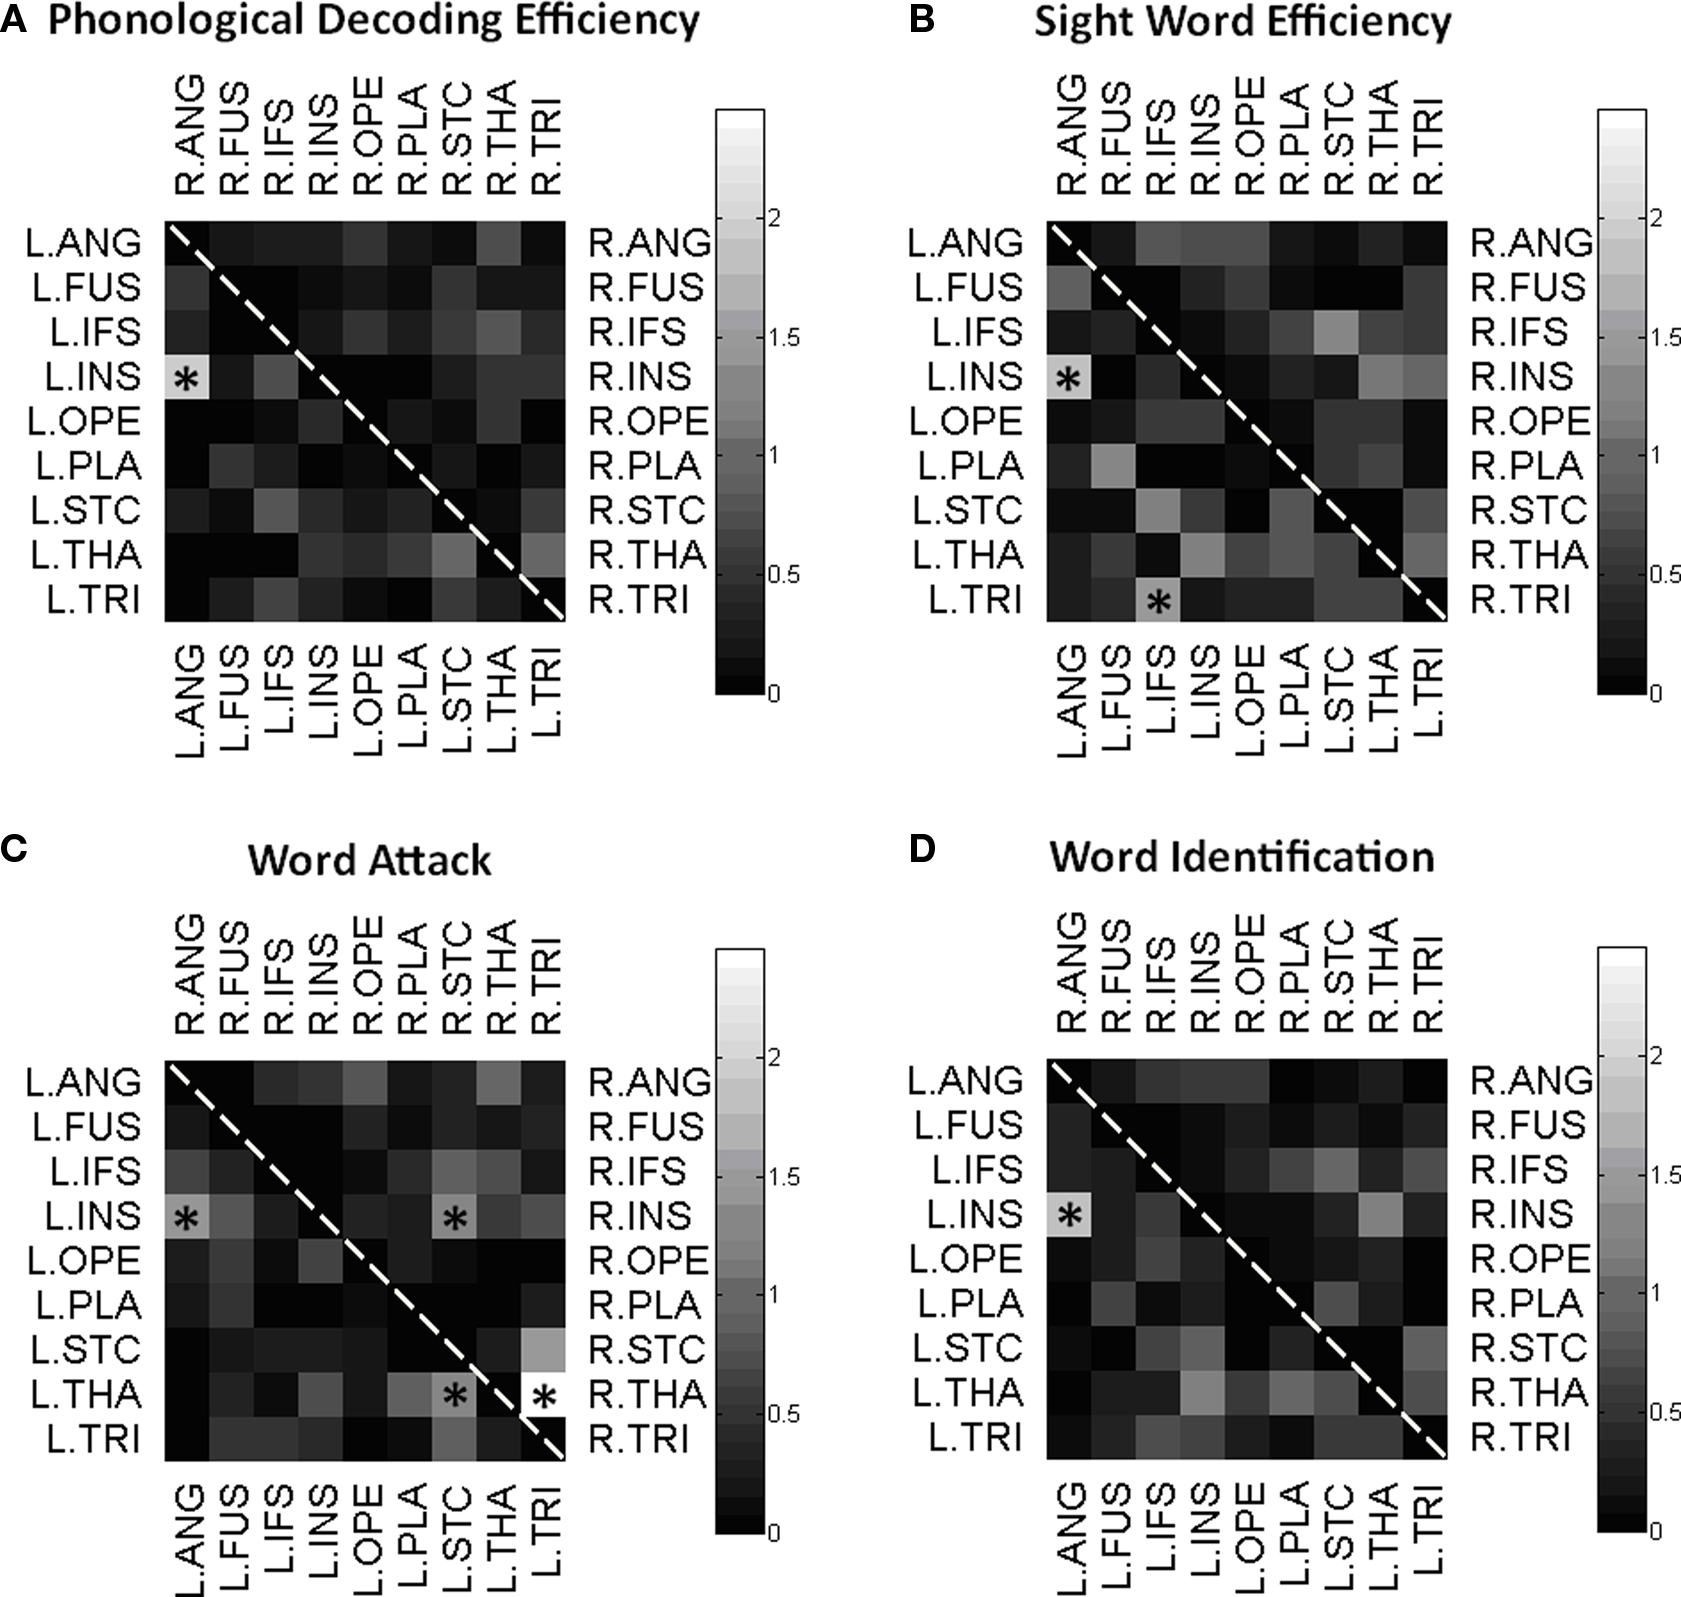
Figure 4 Correlation matrices. Matrix of correlations between intra-hemispherical pairs of gray matter regions. Connectivity between each pair of ROIs is correlated with Phonological Decoding Efficiency (A), Sight Word Efficiency (B), Word Attack (C), and Word Identification (D), and the significance level of the correlation is displayed on a logarithmic scale. Significant correlations were marked by a star (*p < 0.05, uncorrected).
To facilitate interpretation of the significant connections, scatterplots for each finding are shown in Figures 5 and 6. These scatterplots also represent the relationship with response to instruction. In these plots, the NR participants are red, R participants are blue, and C participants are green.
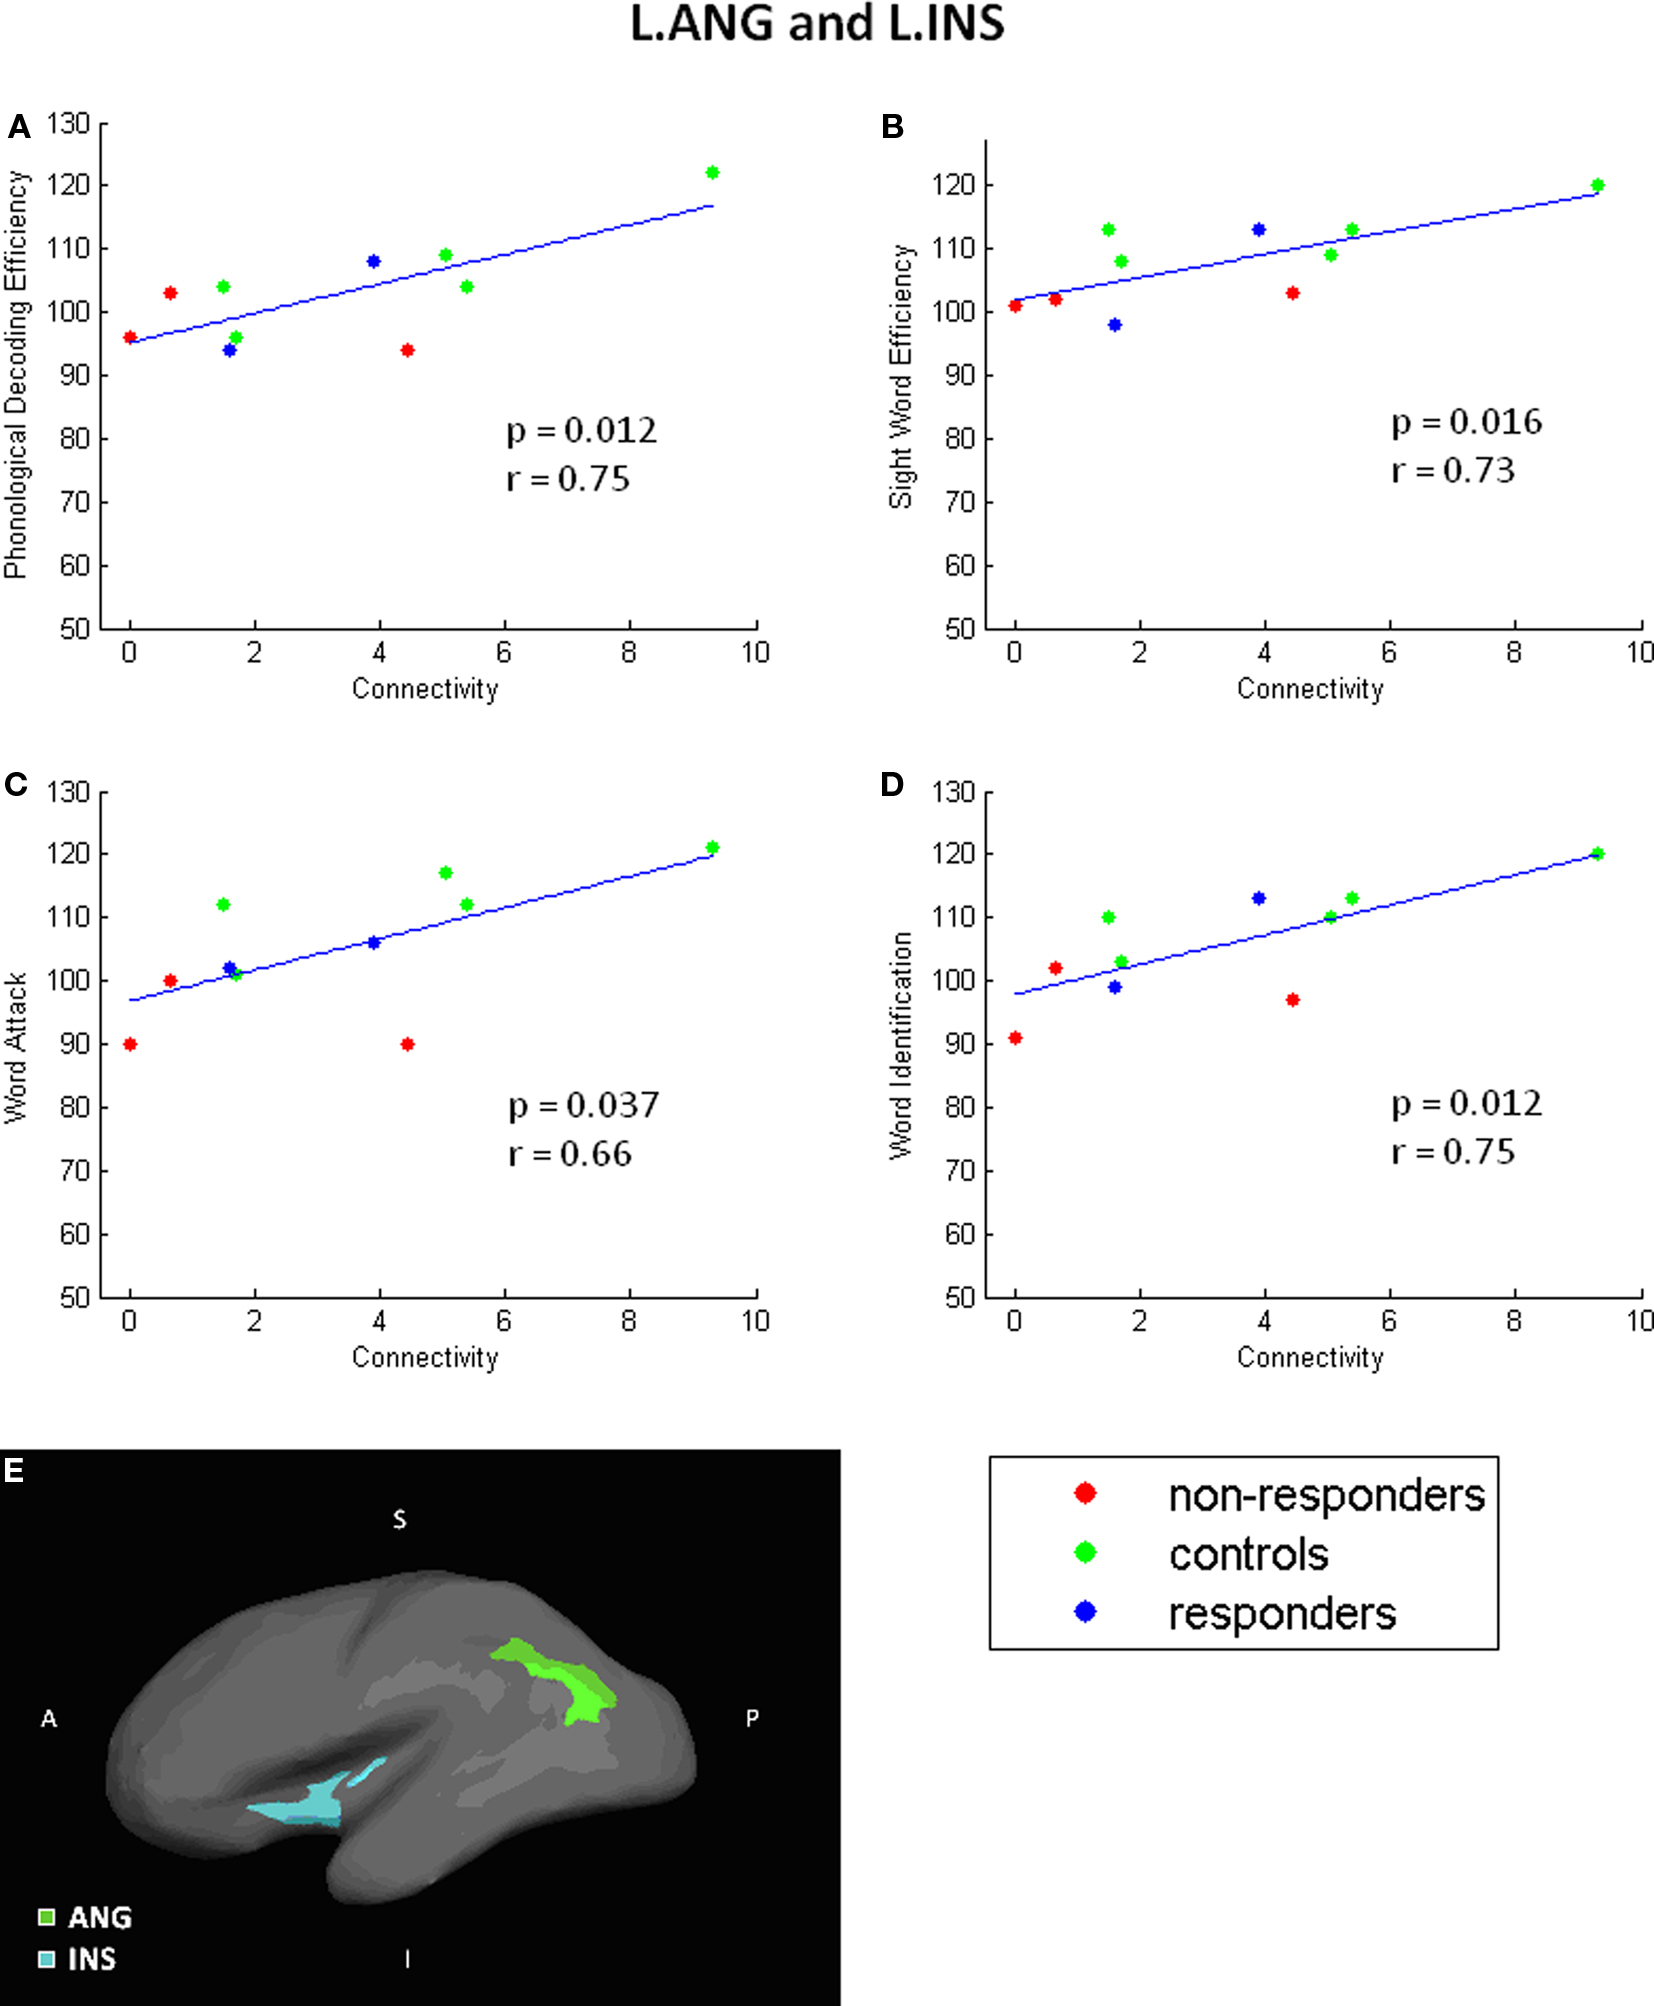
Figure 5 Angular to insula scatterplots. Correlation scatterplots for L. INS and L.ANG. (A–D) Scatterplots showing detailed relationship between connectivity and specific test performances. (E) Locations of L.INS and L.ANG. A single NR participant was identified as an outlier and excluded from this analysis.
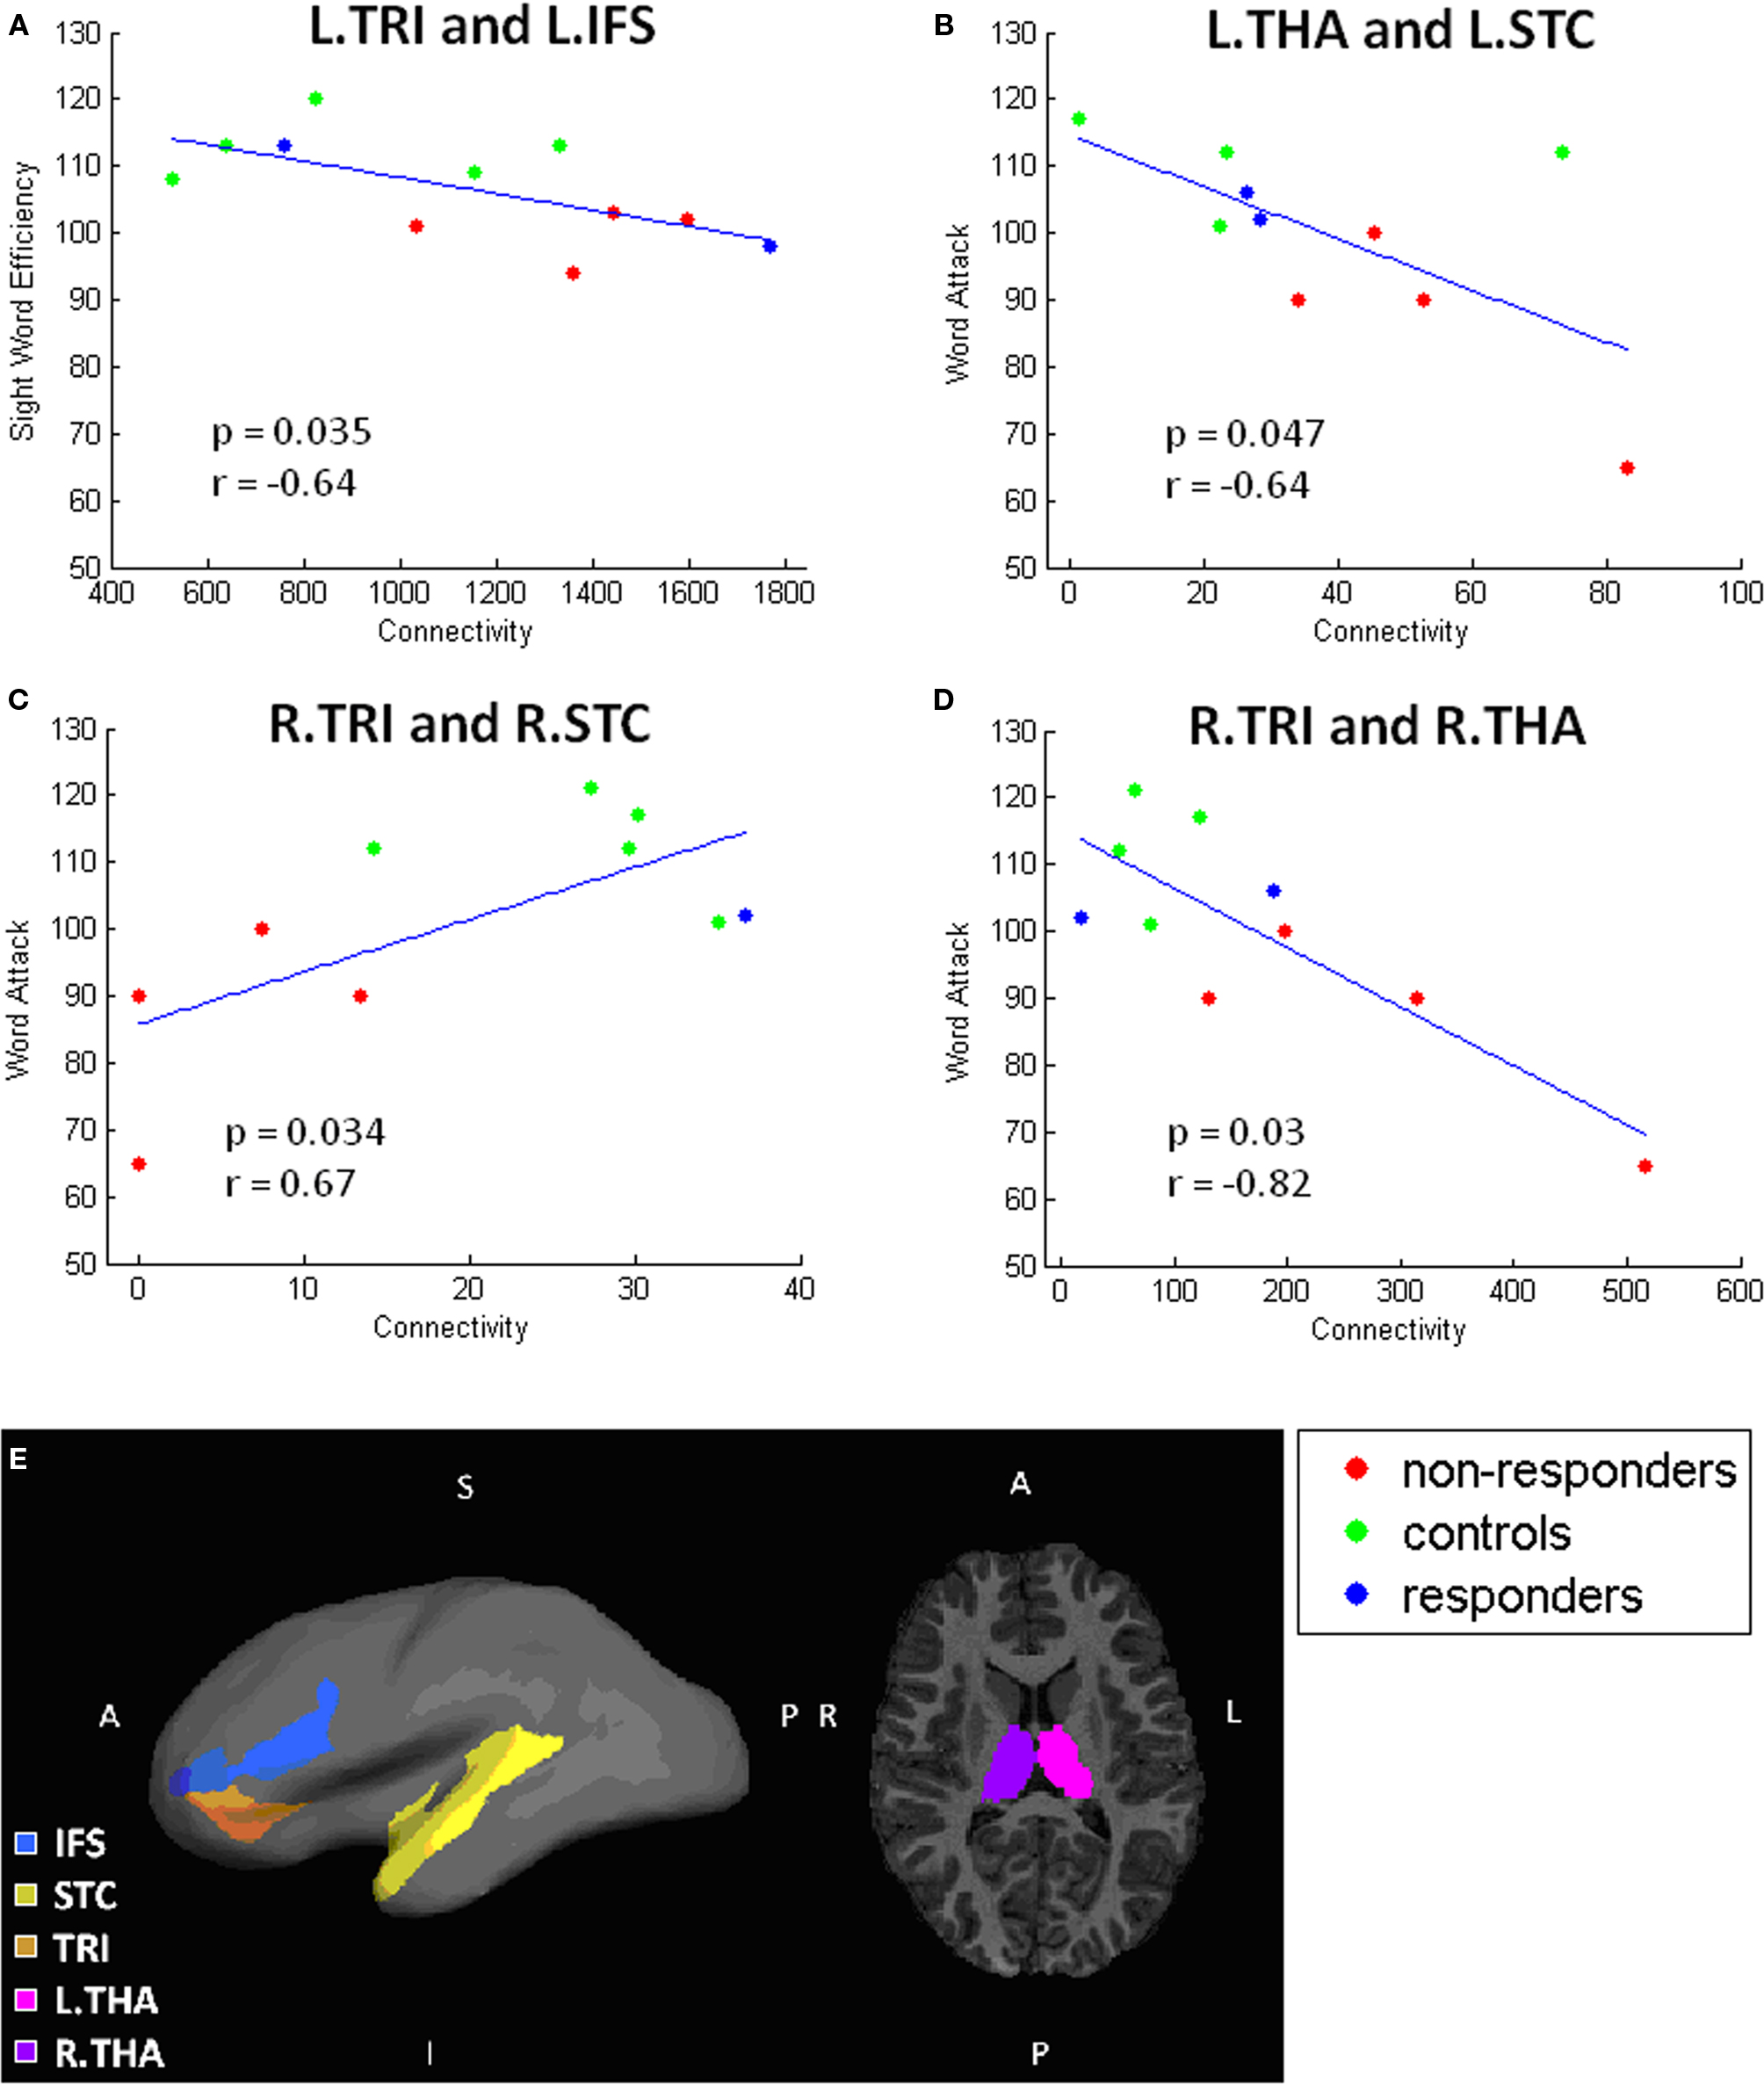
Figure 6 Remaining significant correlations. Scatterplots showing correlations between connectivity and behavioral test performance. Each scatterplot corresponds to one pair of gray matter regions: (A) L.TRI and L.IFS, (B) L.THA and L.STC, (C) R.STC and R.TRI, (D) R.THA and R.TRI. Locations of these regions are illustrated in (E).
As shown in Figure 5, increased reading score on each of the reading measures is related to greater connectivity between the left ANG and INS; the NR participants generally have lower connectivity than R or C participants. Similarly, performance on the WAT subtest correlated positively with connectivity values between TRI to STC (Figure 6). Scatterplots of this correlation showed that NR participants had lower connectivity than R or C participants (although only one R dataset survived outlier rejection). Alternatively, three negative correlations were found in which poorer readers, and more particularly, NR participants, had a greater magnitude of connectivity between brain regions than the other two groups. Two correlations involve connections to the THAL, yet in different hemispheres of the brain: the first was right THAL to right TRI and the second was left THAL to left STC. The third remaining region was also in the right hemisphere – TRI to STC.
Discussion
Reading relies on a diffuse network of brain regions spread throughout the entire brain (Pugh et al., 2001). Reading skill is likely a result of the level of integration (and potentially segregation) of different gray matter regions within a network. Previous studies converge on the finding that good and poor readers have significantly different FA scores in a left hemisphere temporo-parietal region within this network (Klingberg et al., 2000; Beaulieu et al., 2005; Deutsch et al., 2005; Niogi and McCandliss, 2006; Rimrodt et al., 2010). From these results, the field has gained critical information on the structural relationship that exists between the brain and reading skill. However, the previous studies provide information on the contribution of a single tract to reading, effectively ignoring the connections between gray matter regions which are ultimately responsible for the functional processes that underlie reading skill. It may be that these findings are the critical pieces of the connectivity network that differs in good and poor reading. The present study attempted to clarify this issue by investigating connectivity strength between gray matter regions critical to reading, thus examining more directly than the previous studies the putative relationship between gray matter (function) and WM (structure).
Specifically, in the current study we used probabilistic tractography to calculate the strength of WM connections and investigate the potential relationship between WM connectivity and reading skill in the first grade. Results demonstrated that eight connectivity probability estimates correlated with participants’ reading skill, four of which were connectivity estimates between the angular gyrus and insula. We are confident that these results are not attributable to differences in participants’ gender or age. Furthermore, although we found evidence of a correlation between variability in the volume of the brain regions and participants’ behavioral scores, these findings involved different regions than the connectivity findings. Our results extend the previous findings of WM differences related to reading skill to identify specific connections between gray matter regions. In particular, we propose that our findings of connectivity differences between insular cortex to angular gyrus in the left hemisphere corresponds to the temporo-parietal WM region reported in previous papers (Klingberg et al., 2000; Beaulieu et al., 2005; Deutsch et al., 2005; Niogi and McCandliss, 2006; Rimrodt et al., 2010).
Connectivity between left insula and angular gyrus correlated with all four reading tasks, indicating that better readers in general had greater connectivity estimates between these two brain regions on both timed and untimed reading tasks. Related to this, relative to the other two groups, NR had the fewest fiber pathways connecting these two regions. Despite the small sample size in the current study, the redundancy of findings across different measures of word reading skill is promising. However, interpretation of the findings is challenging, as the insula and the angular gyrus have very different roles. Within the cognitive domain, functional activation occurs in the left insula during language, speech, working memory, and attention tasks. Evidence exists that the left insula plays an integrative role between purely cognitive and other systems, including sensorimotor, social-emotional, and olfacto-gustatory systems (Dolan, 2002; Johansen-Berg and Matthews, 2002; Chen et al., 2007; Frith and Singer, 2008). By contrast, several studies have concluded that the left angular gyrus is important for the lexical processes that occur when reading words (e.g., Binder et al., 2009); though, it is possible that the angular gyrus is involved in phonological processing, especially in early years, as inferior parietal lobe is often associated with mapping phonological representations to their orthographic representations (Pugh et al., 2000). These results may indicate that connectivity between these two brain regions is a crucial aspect of the neural network that supports word recognition skill.
Alternatively, it may be that the insula and/or angular gyrus are simply acting as way stations (or relay stations), connecting the gray matter regions that are actually performing the domain specific tasks such as phonological processing and sight word recognition. For example, WM tracts traveling from planum temporale (Wernicke’s area) in the superior temporal cortex to Broca’s area in the frontal cortex are critical for speech development and normal reading (Hickok et al., 2003). These WM tracts may interact with the insula as they travel past on their way to frontal cortex. Related to this, it is possible that our results would change if a more liberal fiber tracking method were used. In the current study, WM tracts were counted if they connected a pair of gray matter regions and did not touch additional gray matter regions. This method was used because connectivity between two regions cannot be established with a high degree of reliability once the WM tract passes through additional gray matter region(s). Therefore, it would be fruitful for future imaging studies on reading skill to investigate both the direct connection between the insula and angular gyrus, while also considering the indirect role these regions play in the larger perisylvian language network. Additionally, in the current study, the entire insula was used as the seed region. However, insular cortex is often divided into separate regions with distinct functions (Dolan, 2002; Dupont et al., 2003; Kurth et al., 2010). Future connectivity studies with the insula would benefit from dividing it based on its functional differentiation.
In addition, a finding of interest that was unexpected was two negative correlations with thalamic connectivity estimates and the WAT subtest, a measure of pseudoword reading skill, in which NR participants had increased connectivity values compared to both R and C participants. Because the thalamus acts as an information processing way station for the brain, relaying sensation and motor signals and contributing to the regulation of arousal (Portas et al., 1998), it is logical that there would be connections between the thalamus and reading related areas (STG and IFG). In fact, previous studies have reported individual variability in functional (Price et al., 1994; Fiebach et al., 2002; Turkeltaub et al., 2002) and structural (e.g., Galaburda and Eidelberg, 1982) aspects of the thalamus that relate to differences in reading skills, suggesting linkages between the thalamus and reading ability. For people who are poor at reading, thalamocortical connections may be more strongly related to reading ability than good readers because poor readers rely on these connections to a greater extent than those who are skilled. This would explain a negative correlation between strength of connection and reading skill (i.e., poorer reading = more connections). Although the sample size in the current study is small, these negative correlations, coupled with previous negative correlation findings and thalamic findings, are intriguing and suggest a need for further exploration. This finding requires follow up studies with larger numbers of participants to fully interpret its meaning. Other studies have also shown negative correlations between reading skill and neuroimaging findings (Brunswick et al., 1999; Sarkari et al., 2002; Shaywitz et al., 2002, 2003; Turkeltaub et al., 2003; Brem et al., 2009), which has been interpreted as utilization of alternative pathways. However, the exact meaning of these negative correlations is not known. It may be that they demonstrate that poor readers implement a compensatory strategy via the use of an alternative pathway (e.g., rely on memory for sight word reading; articulation based word decoding, etc.), or further investigations may reveal that they are in fact a result of error in measurement (e.g., multiple comparisons; performance differences between ability groups, etc.). For this reason, further investigation of this topic is needed to fully understand it.
An additional finding worth noting is that the scatterplots for each of the significant correlations showed a potential trend between participants’ brain connectivity and their level of responsiveness to instruction. Although each correlation showed group differences in WM connectivity, the strength of the connections varied with the pair of regions under investigation. In other words, compared to children who responded to intervention (both R and C groups), the NR group had increased connectivity in some regions and decreased connectivity in others. Although caution is warranted when interpreting these results as the study was based on a small sample size, this is a promising finding, which demonstrates the importance of considering responsiveness to instruction in future studies of RD.
Limitations
Limitations in the study design hinder the interpretation of the results. In particular, the current study lacks a scan prior to intervention. Future studies would benefit from a longitudinal design, in which imaging data is acquired before and after intervention. This would provide data to investigate whether the group differences found in this study are a cause or a result of children’s responsiveness to instruction. Large WM tracts are well within place by 9 months of age; however, a selective change in connectivity occurs at cortical and subcortical levels through the late second decade of life (O’Leary and Stanfield, 1989; Luo and O’Leary, 2005). Therefore, it is possible that WM is sculpted by life experiences. At our current level of understanding, it is not possible to determine the causal relationship between gray and WM deficits. It is possible that fiber pathways are abnormal in RD due to a deficit in the number of neurons in one reading-related region projecting along the fiber to other regions. On the other hand, deficits in myelination along a fiber could impact the efficiency and timing of information transfer between regions, which would cause reductions in activation. A longitudinal design in which functional, structural, and diffusion data were acquired would be useful to study this issue. Related to this, it is not clear how best to use fiber tractography to quantify pathway differences. In this study, we used a symmetrized measure of connectivity strength. In an attempt to minimize the variability in one way fiber measurements, more sensitive and specific connectivity methods may improve the correlations between DTI and behavior in future studies. In addition to a longitudinal design, more participants would increase the power of our study, allowing us to do more refined analyses of the data. In particular, due to the small sample size, conventional statistics were not used to test the significance of the results. Thus, replication and expansion of the current study’s design with a larger sample size would be fruitful.
Conflict of Interest Statement
The authors declare that the research was conducted in the absence of any commercial or financial relationships that could be construed as a potential conflict of interest.
Acknowledgments
This work was supported in part by the Vanderbilt Kennedy Center Hobbs Discovery grant, Grant R324G060036 from the U.S. Department of Education, Institute of Education Sciences, and the National Institutes of Health through the Biomedical MRI and MRS Training Program T32EB001628.
Footnote
References
Aylward, E. H., Richards, T. L., Berninger, V. W., Nagy, W. E., Field, K. M., Grimme, A. C., Richards, A. L., Thomson, J. B., and Cramer, S. C. (2003). Instructional treatment associated with changes in brain activation in children with dyslexia. Neurology 61, 212–219.
Basser, P. J., Pajevic, S., Pierpaoli, C., Duda, J., and Aldroubi, A. (2000). In vivo fiber tractography using DT-MRI data. Magn. Reson. Med. 44, 625–632.
Beaulieu, C., Plewes, C., Paulson, L. A., Roy, D., Snook, L., Concha, L., and Phillips, L. (2005). Imaging brain connectivity in children with diverse reading ability. Neuroimage 25, 1266–1271.
Behrens, T. E., Berg, H. J., Jbabdi, S., Rushworth, M. F., and Woolrich, M. W. (2007). Probabilistic diffusion tractography with multiple fibre orientations: what can we gain? Neuroimage 34, 144–155.
Behrens, T. E., Johansen-Berg, H., Woolrich, M. W., Smith, S. M., Wheeler-Kingshott, C. A., Boulby, P. A., Barker, G. J., Sillery, E. L., Sheehan, K., Ciccarelli, O., Thompson, A. J., Brady, J. M., and Matthews, P. M. (2003a). Non-invasive mapping of connections between human thalamus and cortex using diffusion imaging. Nat. Neurosci. 6, 750–757.
Behrens, T. E., Woolrich, M. W., Jenkinson, M., Johansen-Berg, H., Nunes, R. G., Clare, S., Matthews, P. M., Brady, J. M., and Smith, S. M. (2003b). Characterization and propagation of uncertainty in diffusion-weighted MR imaging. Magn. Reson. Med. 50, 1077–1088.
Binder, J. R., Desai, R. H., Graves, W. W., and Conant, L. L. (2009). Where is the semantic system? A critical review and meta-analysis of functional neuroimaging studies. Cereb. Cortex 19, 2767–2796.
Brem, S., Hadler, P., Bucher, K., Summers, P., Martin, E., and Brandeis, D. (2009). Tuning of the visual word processing system: distinct developmental ERP and fMRI effects. Hum. Brain Mapp. 30, 1833–1844.
Brunswick, N., McCrory, E., Price, C. J., Frith, C. D., and Frith, U. (1999). Explicit and implicit processing of words and pseudowords by adult developmental dyslexics: a search for Wernicke’s Wortschatz? Brain 122, 1901–1917.
Chen, C. H., Ridler, K., Suckling, J., Williams, S., Fu, C. H., Merlo-Pich, E., and Bullmore, E. (2007). Brain imaging correlates of depressive symptom severity and predictors of symptom improvement after antidepressant treatment. Biol. Psychiatry 62, 407–414.
Compton, D. L., Fuchs, D., Fuchs, L. S., Bouton, B., Gilbert, J. K., Barquero, L. A., Cho, E., and Crouch, R. C. (2010). Selecting at-risk first-grade readers for early intervention: eliminating false positives and exploring the promise of a two-stage gated screening process. J. Educ. Psychol. 102, 327–340.
Conturo, T. E., Lori, N. F., Cull, T. S., Akbudak, E., Snyder, A. Z., Shimony, J. S., McKinstry, R. C., Burton, H., and Raichle, M. E. (1999). Tracking neuronal fiber pathways in the living human brain. Proc. Natl. Acad. Sci. U.S.A. 96, 10422–10427.
Dale, A. M., Fischl, B., and Sereno, M. I. (1999). Cortical surface-based analysis. I. Segmentation and surface reconstruction. Neuroimage 9, 179–194.
Dale, A. M., and Sereno, M. I. (1993). Improved localization of cortical activity by combining EEG and MEG with MRI cortical surface reconstruction: a linear approach. J. Cogn. Neurosci. 5, 162–176.
Davis, N., Barquero, L., Compton, D., Fuchs, L. S., Fuchs, D., Gore, J., and Anderson, A. (in press). Functional correlates of children’s responsiveness to intervention. Dev. Neuropsychol..
Deutsch, G. K., Dougherty, R. F., Bammer, R., Siok, W. T., Gabrieli, J. D., and Wandell, B. (2005). Children’s reading performance is correlated with white matter structure measured by diffusion tensor imaging. Cortex 41, 354–363.
Dupont, S., Bouilleret, V., Hasboun, D., Semah, F., and Baulac, M. (2003). Functional anatomy of the insula: new insights from imaging. Surg. Radiol. Anat. 25, 113–119.
Fiebach, C. J., Friederici, A. D., Muller, K., and von Cramon, D. Y. (2002). fMRI evidence for dual routes to the mental lexicon in visual word recognition. J. Cogn. Neurosci. 14, 11–23.
Fischl, B., and Dale, A. M. (2000). Measuring the thickness of the human cerebral cortex from magnetic resonance images. Proc. Natl. Acad. Sci. U.S.A. 97, 11050–11055.
Fischl, B., Liu, A., and Dale, A. M. (2001). Automated manifold surgery: constructing geometrically accurate and topologically correct models of the human cerebral cortex. IEEE Trans. Med. Imaging 20, 70–80.
Fischl, B., Salat, D. H., Busa, E., Albert, M., Dieterich, M., Haselgrove, C., van der Kouwe, A., Killiany, R., Kennedy, D., Klaveness, S., Montillo, A., Makris, N., Rosen, B., and Dale, A. M. (2002). Whole brain segmentation: automated labeling of neuroanatomical structures in the human brain. Neuron 33, 341–355.
Fischl, B., Salat, D. H., van der Kouwe, A. J., Makris, N., Segonne, F., Quinn, B. T., and Dale, A. M. (2004). Sequence-independent segmentation of magnetic resonance images. Neuroimage 23(Suppl. 1), S69–S84.
Frith, C. D., and Singer, T. (2008). The role of social cognition in decision making. Philos. Trans. R. Soc. Lond., B, Biol. Sci. 363, 3875–3886.
Fuchs, L. S., Fuchs, D., and Compton, D. L. (2004). Monitoring early reading development in first grade: word identification fluency versus nonsense word fluency. Except. Child. 7–21.
Galaburda, A. M., and Eidelberg, D. (1982). Symmetry and asymmetry in the human posterior thalamus.Thalamic lesions in a case of developmental dyslexia. Arch. Neurol. 39, 333–336.
Hickok, G., Buchsbaum, B., Humphries, C., and Muftuler, T. (2003). Auditory-motor interaction revealed by fMRI: speech, music, and working memory in area Spt. J. Cogn. Neurosci. 15, 673–682.
Horwitz, B., Rumsey, J. M., and Donohue, B. C. (1998). Functional connectivity of the angular gyrus in normal reading and dyslexia. Proc. Natl. Acad. Sci. U.S.A. 95, 8939–8944.
Jezzard, P., and Balaban, R. S. (1995). Correction for geometric distortion in echo planar images from B0 field variations. Magn. Reson. Med. 34, 65–73.
Johansen-Berg, H., and Matthews, P. M. (2002). Attention to movement modulates activity in sensori-motor areas, including primary motor cortex. Exp. Brain Res. 142, 13–24.
Keller, T. A., and Just, M. A. (2009). Altering cortical connectivity: remediation-induced changes in the white matter of poor readers. Neuron 64, 624–631.
Klingberg, T., Hedenhus, M., Temple, E., Salz, T., Gabrieli, J. D., Moseley, M. E., and Poldrack, R. A. (2000). Microstructure of temporoparietal white matter as a basis for reading ability: evidence from diffusion tensor magnetic resonance imaging. Neuron 25, 493–500.
Kurth, F., Ziles, K., Fox, P. T., Laird, A. R., and Eickhoff, S. B. (2010). A link between the systems: functional differentiation and integration within the human insula revealed by meta-analysis. Brain Struct. Funct. 214, 519–534.
Luo, L., and O’Leary, D. D. (2005). Axon retraction and degeneration in development and disease. Annu. Rev. Neurosci. 28, 127–156.
Mori, S., Crain, B. J., Chacko, V. P., and van Zijl, P. C. (1999). Three-dimensional tracking of axonal projections in the brain by magnetic resonance imaging. Ann. Neurol. 45, 265–269.
Netsch, T., and van Muiswinkel, A. (2004). Quantitative evaluation of image-based distortion correction in diffusion tensor imaging. IEEE Trans. Med. Imaging 23, 789–798.
Niogi, S. N., and McCandliss, B. D. (2006). Left lateralized white matter microstructure accounts for individual differences in reading ability and disability. Neuropsychologia 44, 2178–2188.
Odegard, T. N., Ring, J., Smith, S., Biggan, J., and Black, J. (2008). Differentiating the neural response to intervention in children with developmental dyslexia. Ann. Dyslexia 58, 1–14.
O’Leary, D. D., and Stanfield, B. B. (1989). Selective elimination of axons extended by developing cortical neurons is dependent on regional locale: experiments utilizing fetal cortical transplants. J. Neurosci. 9, 2230–2246.
Paulesu, E., Demonet, J. F., Fazio, F., McCrory, E., Chanoine, V., Brunswick, N., Cappa, S. F., Cossu, S. F., Habib, M., Frith, C. D., and Frith U. (2001). Dyslexia: cultural diversity and biological unity. Science 291, 2165–2167.
Portas, C. M., Rees, G., Howseman, A. M., Josephs, O., Turner, R., and Frith, C. D. (1998). A specific role for the thalamus in mediating the interaction of attention, and arousal in humans. J. Neurosci. 18, 8979–8989.
Price, C. J., Wise, R. J., Watson, J. D., Patterson, K., Howard, D., and Frackowiak, R. S. (1994). Brain activity during reading. The effects of exposure duration and task. Brain 117, 1255–1269.
Pugh, K. R., Mencl, W. E., Jenner, A. R., Katz, L., Frost, S. J., and Lee, J. R., Shaywitz, S. E., and Shaywitz, B. A. (2001). Neurobiological studies of reading and reading disability. J. Commun. Disord. 34, 479–492.
Pugh, K. R., Mencl, W. E., Shaywitz, B. A., Shaywitz, S. E., Fulbright, R. K., Constable, R. T., Skudarski, P., Marchione, K. E., Jenner, A. R., Fletcher, J. M., Liberman, A. M., Shankweiler, D. P., Katz, L., Lacadie, C., and Gore, J. C. (2000). The angular gyrus in developmental dyslexia. Psychol. Sci. 11, 51–56.
Rimrodt, S. L., Peterson, D. J., Denckla, M. B., Kaufmann, W. E., and Cutting, L. E. (2010). White matter microstructural differences linked to left perisylvian language network in children with dyslexia. Cortex 46, 739–749.
Rumsey, J. M., Nace, K., Donohue, B., Wise, D., Maisog, J. M., and Andreason, P. (1997). A positron emission tomographic study of impaired word recognition and phonological processing in dyslexic men. Arch. Neurol. 54, 562–573
Sarkari, S., Simos, P. G., Fletcher, J. M., Catillo, E. M., Brieier, J. I., and Papanicolaou, A. C. (2002). Contributions of magnetic source imaging to the understanding of dyslexia. Semin. Pediatr. Neurol. 9, 229–238.
Segonne, F., Dale, A. M., Busa, E., Glessner, M., Salat, D., Hahn, H. K., and Fischl, B. (2004). A hybrid approach to the skull stripping problem in MRI. Neuroimage 22, 1060–1075.
Segonne, F., Pacheco, J., and Fischl, B. (2007). Geometrically accurate topology-correction of cortical surfaces using nonseparating loops. IEEE Trans. Med. Imaging 26, 518–529.
Shaywitz, B. A., Shaywitz, S. E., Blachman, B. A., Pugh, K. R., Fulbright, R. K., Skudlarski, P., Mencl, W. E., Constable, R.T., Holahan, J.M., Marchione, K. E., Fletcher, J. M., Lyon, G. R., and Gore, J. C. (2004). Development of left occipitotemporal systems for skilled reading in children after a phonologically-based intervention. Biol. Psychiatry 55, 926–933.
Shaywitz, S. E., and Shaywitz, B. A. (2003). Dyslexia (specific reading disability). Pediatr. Rev. 24, 147–153.
Shaywitz, S. E., Shaywitz, B. A., Fulbright, R. K., Skudlarski, P., Mencl, W. E., Constable, R. T., Pugh, K. R., Holahan, J. M., Marchione, K. E., Fletcher, J. M., Lyon, G. R., and Gore, J. C. (2003). Neural systems for compensation and persistence: young adult outcome of childhood reading disability. Biol. Psychiatry 1, 25–33.
Shaywitz, B. A., Shaywitz, S. E., Pugh, K. R., Mencl, W. E., Fulbright, R. K., Skudlarski, P., Constable, R. T., Marchione, K. E., Fletcher, J. M., Lyon, G. R., and Gore, J. C. (2002). Disruption of posterior brain systems for reading in children with developmental dyslexia. Biol. Psychiatry 52, 101–110.
Simos, P. G., Fletcher, J. M., Bergman, E., Breier, J. I., Foorman, B. R., Castillo, E. M., Davis, R. N., Fitzgerald, M., and Papanicolaou, A.C. (2002). Dyslexia-specific brain activation profile becomes normal following successful remedial training. Neurology 58, 1203–1213.
Simos, P. G., Fletcher, J. M., Denton, C., Sarkari, S., Billingsley-Marshall, R., and Papanicolaou, A. C. (2006). Magnetic source imaging studies of dyslexia interventions. Dev. Neuropsychol. 30, 591–611.
Sled, J. G., Zijdenbos, A. P., and Evans, A. C. (1998). A nonparametric method for automatic correction of intensity nonuniformity in MRI data. IEEE Trans. Med. Imaging 17, 87–97.
Torgesen, J. K., Wagner, R. K., and Rashotte, C. A. (1997). Test of Word Reading Efficiency. Austin, Tx: Pro:Ed.
Turkeltaub, P. E., Eden, G. F., Jones, K. M., and Zeffiro, T. A. (2002). Meta-analysis of the functional neuroanatomy of single-word reading: method and validation. Neuroimage 16, 765–780.
Keywords: diffusion tensor imaging; probabilistic tractography, reading disability, response to intervention, connectivity, magnetic resonance imaging, children
Citation: Davis N, Fan Q, Compton DL, Fuchs D, Fuchs LS, Cutting LE, Gore JC and Anderson AW (2010) Influences of neural pathway integrity in children’s response to reading instruction. Front. Syst. Neurosci. 4:150. doi: 10.3389/fnsys.2010.00150
Received: 14 June 2010;
Accepted: 01 October 2010;
Published online: 29 October 2010.
Edited by:
Barry Horwitz, National Institutes of Health, USAReviewed by:
Kristina Simonyan, Mount Sinai School of Medicine, USA;Mohamed L. Seghier, University College London, UK
Copyright: © 2010 Davis, Fan, Compton, Fuchs, Fuchs, Cutting, Gore and Anderson. This is an open-access article subject to an exclusive license agreement between the authors and the Frontiers Research Foundation, which permits unrestricted use, distribution, and reproduction in any medium, provided the original authors and source are credited.
*Correspondence: Nicole Davis, Vanderbilt University, Peabody Box 328, 230 Appleton Place, Nashville, TN 37203, USA. e-mail:bmlra2kuZGF2aXNAdmFuZGVyYmlsdC5lZHU=